chemotherapy-COOH), H Supporting Information · The preparation of other LPNPs, PLGA-DCCP,...
24
Supporting Information Redox-triggered activation of nanocarriers for mitochondria-targeting cancer chemotherapy Wei Zhou, Hui Yu, Liu-Jie Zhang, Bo Wu, Cai-Xia Wang, Qian Wang, Kai Deng, Ren- Xi Zhuo, Shi-Wen Huang* Materials and methods Polyethylene glycol monostearate (C 18 -PEG 2000 -OH, CPO),polyethylene glycol monomethyl ether 4000 (mPEG 4000 ), 3,3’-dithiodipropionic acid (C 6 H 10 O 4 S 2 ) and suberic acid (C 8 H 14 O 4 ) were purchased from Tokyo Chemical Industry Co., Ltd. Coumarin, dicyclohexylcarbodiimide (DCC), 4-(dimethylamino)pyridine (DMAP) and triethylamine (TEA) were purchased from Sinopharm Chemical Reagent Co. Ltd. (Shanghai, China). 1,2-Dilauroyl-sn-glycero-3-phosphoethanolamine (DLPE) was obtained from J&K Chemical (Guangzhou, China). Paclitaxel (PTX), 5-bromovaleric acid (Br-C 4 H 8 -COOH), triphenylphosphine (TPP), poly(lactic-co-glycolic acid) (PLGA 65:35, Mw 40000-75000 Da),3-(4,5-dimethylthiazol-2-yl)-2,5- diphenyltetrazolium bromide (MTT) and Hoechst 33258 were purchased from Sigma – Aldrich Chemicals (St. Louis, MO, USA ). Mitotracker ® Red CMXRos were purchased from Invitrogen (Eugene, OR, USA). Trypsin-EDTA, fetal bovine serum (FBS, Gibco ® ), trypsin (Gibco ® ), Dulbecco's Modified Eagle Medium (DMEM, HYCLONE ® ), penicillin-streptomycin solution (Hyclone ® ), BCA Protein Assay Kit (BD biosciences), Annexin V-fluorescein isothiocyanate (FITC)/propidium iodide (PI) Electronic Supplementary Material (ESI) for Nanoscale. This journal is © The Royal Society of Chemistry 2017
Transcript of chemotherapy-COOH), H Supporting Information · The preparation of other LPNPs, PLGA-DCCP,...
Supporting Information
Redox-triggered activation of nanocarriers for mitochondria-targeting cancer
chemotherapy
Wei Zhou, Hui Yu, Liu-Jie Zhang, Bo Wu, Cai-Xia Wang, Qian Wang, Kai Deng, Ren-
Xi Zhuo, Shi-Wen Huang*
Materials and methods
Polyethylene glycol monostearate (C18-PEG2000-OH, CPO),polyethylene glycol
monomethyl ether 4000 (mPEG4000), 3,3’-dithiodipropionic acid (C6H10O4S2) and
suberic acid (C8H14O4) were purchased from Tokyo Chemical Industry Co., Ltd.
Coumarin, dicyclohexylcarbodiimide (DCC), 4-(dimethylamino)pyridine (DMAP) and
triethylamine (TEA) were purchased from Sinopharm Chemical Reagent Co. Ltd.
(Shanghai, China). 1,2-Dilauroyl-sn-glycero-3-phosphoethanolamine (DLPE) was
obtained from J&K Chemical (Guangzhou, China). Paclitaxel (PTX), 5-bromovaleric
acid (Br-C4H8-COOH), triphenylphosphine (TPP), poly(lactic-co-glycolic acid)
(PLGA 65:35, Mw 40000-75000 Da),3-(4,5-dimethylthiazol-2-yl)-2,5-
diphenyltetrazolium bromide (MTT) and Hoechst 33258 were purchased from Sigma–
Aldrich Chemicals (St. Louis, MO, USA). Mitotracker® Red CMXRos were purchased
from Invitrogen (Eugene, OR, USA). Trypsin-EDTA, fetal bovine serum (FBS,
Gibco®), trypsin (Gibco®), Dulbecco's Modified Eagle Medium (DMEM,
HYCLONE®), penicillin-streptomycin solution (Hyclone®), BCA Protein Assay Kit
(BD biosciences), Annexin V-fluorescein isothiocyanate (FITC)/propidium iodide (PI)
Electronic Supplementary Material (ESI) for Nanoscale.This journal is © The Royal Society of Chemistry 2017
apoptosis detection kit (BD Biosciences),Streptavidin/Peroxidase
immunohistochemical kit (Zymed), anti-cytochrome c (Beyotime), diaminobenzidine
(DAB) kit, colorimetric assay kit (Beyotime) and XF24 extracellular flux analyzer kit
(Seahorse Bioscience) were provided by domestic suppliers. Other chemicals and
reagents are of analytical grade and used without further purification.
FTIR spectra were measured by FTS 6000 spectrum instrument (Bio-Rad Company,
Hercules, USA). 1H NMR was detected by Mercury VX-300 type NMR spectrometer
at 300 MHz, CDCl3 as a solvent, tetramethylsilane (TMS) as the internal standard. Gel
permeation chromatography (GPC) measurements were carried out by using a Waters
2690D HPLC equipped with Styragel HR3 column. Samples were detected with a
Waters 2410 differential refractive index detector. DMF was used as the mobile phase
at a flow rate of 0.3 mL min-1. The column temperature was 40 C. Poly(methyl
methacrylate) was used as the standard.
Synthesis of 4-carboxbutyltriphenylphosphonium bromide (1)
To a solution of 5-bromovaleric acid (1 g, 5.5 mmol) in acetonitrile (15 mL), TPP
(1.6 g, 6.1 mmol) was added and refluxed for 24h. The reaction solution was evaporated
under vacuum to remove acetonitrile. The residue was dissolved in dichloromethane.
The solution was added dropwise into diethyl ether. The white solid was collected by
filtration, washed with benzene, hexane and diethyl ether successively, and then dried
to give 2.4 g product (yield 98%).
Synthesis of C18-PEG2000-TPP (CPT, 2)
4-Carboxbutyl triphenylphosphonium bromide (443.3 mg, 1 mmol), C18-PEG2000-
OH (2.48 g, 1 mmol) and 4-(dimethylamino)pyridine (DMAP, 0.018 g, 0.15 mmol)
were dissolved in anhydrous DMF (20 mL) under an nitrogen atmosphere.
Subsequently, N,N′-dicyclohexylcarbodiimide (DCC) (247.6 mg, 1.2 mmol) in 3 mL
anhydrous DMF was added dropwise into the above solution at 0 °C with stirring. The
mixture was stirred for 24 h at room temperature. After filtration, the solution was
dialyzed against pure water for 48 h using a dialysis tube (MWCO 1000 Da). During
dialysis, water was exchanged each six hours. The solution was filtered and freeze-dried
to obtain white product (2.00g, yield 73%).1H NMR (300 MHz, CDCl3:δ (ppm) 0.86
(s, 3H, CH3 ), 1.23 (s, 30H, CH2CH2), 2.75 –2.77(t, 4H, CH2COO), 3.55–3.71 (m,
CH2CH2O),7.60 –7.92 (d, 15H, C6H5).
Synthesis of mPEG4000-S-S-COOH (3) and mPEG4000-C-C-COOH (4)
mPEG4000 (4.0 g, 1 mmol), DMAP (0.018 g, 0.15 mmol) and TEA (150 μL, 1.1
mmol) were added to an ice cooled solution of3,3’-dithiodipropionic acid (0.252 g, 1.2
mmol) in 10mL anhydrous DMF. Then, a solution of DCC (0.248 g, 1.2 mmol) in
anhydrous DMF (3 mL) was added dropwise into the mixture and stirred for 24 h at
room temperature. After filtration, the solution was added dropwise into cold diethyl
ether. The white solid was collected and dried overnight in vacuum. The crude product
was purified by dissolution–precipitation in dichloromethane/diethyl ether twice and
dried in vacuum to obtain the compound 3 (2.20g, yield 54%).
The synthesis of mPEG4000-C-C-COOH (4) was similar to that of compound 3 except
suberic acid (0.172 g, 1 mmol) was used instead of 3,3’-dithiodipropionic acid.
Synthesis of DLPE-S-S-mPEG4000 (DSSP, 5) and DLPE-C-C-mPEG4000 (DCCP, 6)
mPEG4000-S-S-COOH (3) (4.250 g, 1 mmol), DLPE (0.580 g,1 mmol), DMAP
(0.018 g, 0.15 mmol) and TEA (150μL 1.1mmol) were dissolved in anhydrous
chloroform (20 mL) at 0 °C under nitrogen atmosphere. Subsequently, DCC (0.248 g,
1.2mmol) in 3 mL anhydrous chloroform was added dropwise into the solution at 0 °C.
The mixture was stirred overnight at room temperature. After filtration, the solution
was added dropwise into cold diethyl ether to give white solid. The white solid was
purified by dissolution–precipitation in dichloromethane/diethyl ether twice. The
product was obtained after drying in vacuum (3.40g, yield 72%).1H NMR (300 MHz,
CDCl3:δ ( ppm) 0.86 (s, 3H, CH3), 1.26 (s, 72H, CH2CH2), 2.45–2.50(t, 4H,
CH2COO), 2.79–2.80 (t, 2H, CH2COO), 2.90–2.92 (t, 4H,CH2SS), 3.41 (s, 3H, OCH3),
3.55–3.71 (m, CH2CH2O),4.24–4.26 (t, 2H, COOCH2).
The synthesis of DLPE-C-C-mPEG4000 (DCCP, 6) was similar to that of DLPE-S-S-
mPEG4000 (5) except mPEG4000-C-C-COOH (4) (4.150 g, 1 mmol) was used instead of
mPEG4000-S-S-COOH (3).1H NMR (300 MHz, CDCl3:δ (ppm) 0.86 (s, 3H, CH3 ),
1.26 (s, 40H, CH2CH2), 2.75 –2.77(t, 2H, CH2COO), 2.79 –2.80 (t, 2H, CH2COO), 3.41
(s, 3H, OCH3), 3.55–3.71 (m, CH2CH2O),4.24 –4.26 (t, 2H, COOCH2).
Preparation of blank LPNPs
C18-PEG2000-TPP (CPT, 3mg) and C18-PEG2000-OH (CPO, 2 mg) were dispersed in
7 mL ultrapure water with stirring at 45 °C for 30 min. The solution of 50 mg PLGA in
3mL DMF was added to the aqueous phase and whirled violently for 30 min.
Subsequently, the suspension was stirred at room temperature for 2 h and dialyzed
against ultrapure water using a dialysis tube (MWCO 7000) for 48 h. Ultrapure water
was exchanged each 6 hr during dialysis.The solution of LPNPs (PLGA-CPT) was
extruded repeatedly through a syringe filter (0.22 μM) and was stored at 4 °C before
usage.
The preparation of other LPNPs, PLGA-DCCP, PLGA-DSSP, PLGA-CPT-DCCP
and PLGA-CPT-DSSP, was similar to PLGA-CPT. The composition of LPNPs was
summarized in Table S2.
Characterization of LPNPs
200 μL of LPNPs solution was diluted in 3 mL of PBS buffer.The average particle
sizesand zeta potentials of LPNPs were measured using a ZETA-SIZER Nano Series
ZEN3600 (Malvern Instruments Ltd, UK). The diluted LPNPs solutionwas dropped on
a copper grid (300 mesh) with formvar film and then stained with a drop of 1%
phosphotungstic acid for 2 min. The morphologies of LPNPs were observedusing Jeol
JEM-100CXII transmission electron microscopy (TEM, Tokyo, Japan) at an
acceleration voltage of 100 kV.
Effect of GSH treatment on sizes and zeta potentials of LPNPs
200 μL of prepared LPNPs solution was mixed with 2.8 mL of PBS containing 0.03
μmol or 0.03 mmol GSH in a cell. The final concentration of GSH is 10 μM or 10 mM.
The cell was placed in a shaking bed at 37 °C. The sizes and zeta potentials of LPNPs
were measured at predetermined time intervals. The sizes and zeta potentials of LPNPs
incubated in PBS without GSH were measured similarly.
Protein adsorption of LPNPs

Fetal bovine serum (FBS) was used to measure protein adsorption of LPNPs. 0.5 mL
of LPNPs solution in PBS at different concentrations (1, 2, 3, 4 and 5 mg/mL) was
separately added into 0.5 mL mixture of FBS and PBS (1:4, v:v), and then incubated
under agitation in shaking bed at 37 °C for 2 h. Subsequently, the mixture was
centrifuged at 5000 rpm for 3 min and the supernatant was harvested and analyzed using
BCA Protein Assay Kit. 25 μL of supernatant was added into 96-well plates, mixed
with 200 μL of BCA working reagent and incubated at 37°C for 30 min. Absorbance
was measured at 570 nm with a microplate reader (Thermo Scientific, USA). The final
mass of FBS (Mf) was obtained from a calibration curve, which was linear over the
concentration of standard protein in the kit from 2 mg/mL to 0.025 mg/mL. Initial mass
of FBS (Mi) was measured after similar treatment of FBS and PBS mixture using 0.5
mL PBS instead of LPNPs solution. The mass of adsorbed FBS (Ma) was calculated as
Ma=Mi-Mf.
Variation of sizes and charges in the presence of FBS
200 μL of prepared PTX-LPNPs solution was mixed with 2.8 mL of fresh DMEM
medium in a cell. The final concentration of FBS is 10% (V/V). The cell was placed in
a shaking bed at 37 °C for 2h. After 2 h, the LPNPs were harvested by centrifuging
(12,000 rpm) and resuspended in 3 mL PBS to measure the sizes and zeta potentials.
Preparation of PTX-LPNPs
The preparation of PTX-LPNPs was similar to that of blank LPNPs except 6 mg PTX
was added into 3mL DMF together with 50 mg PLGA. Drug loading content (DLC) of
PTX-LPNPs was measured using HPLC analysis. PTX-LPNPs nanoparticles were
obtained by freeze-drying of PTX-LPNPs solution. 1 mg PTX-LPNPs nanoparticles
were dissolved in 1 mL acetonitrile.10 μLsolution was analyzed using SHIMADZU
SPD-15C high performance liquid chromatograph spectrophotometer (HPLC, Tokyo,
Japan) equipped with a reverse-phase Angel C18 column (250×4.6 mm2, 5 mm). The
samples were detected with UV detector at a wavelength of 227 nm. Acetonitrile/water
(60:40, v:v) was used as the mobile phase at a flow rate of 0.5 mL/min. The column
temperature was 25°C. The mass of PTX was calculated from a standard curve that was
linear over the concentration of PTX from 0.01 mg/mL to 0.3 mg/mL.
Release of PTX from PTX-loaded LPNPs
In vitro release of PTX from LPNPs in PBS with or without GSH was carried out
using the dialysis method. 0.5mL PTX-LPNPs solution in dialysis tube (MWCO 14
000) was immersed into a tube containing 10 mL buffer (PBS+0.1 M Tween-80) or
buffer (PBS+10 mM GSH+0.1 M Tween-80) and kept at 37 °C in a shaking water bath.
2 mL sample was withdrawn at predetermined time intervals (0 h, 0.5 h, 1 h, 2 h, 4 h, 6
h, 8 h, 12 h, 24 h, 36 h, and 48 h) and harvested by freeze-drying. Meanwhile, 2 mL
fresh buffer (PBS+0.1 M Tween-80) or buffer (PBS +10 mM GSH+0.1 M Tween-80)
was replenished into the tube. Subsequently, freeze-drying powder was dissolved in 2
mL acetonitrile and the amount of PTX released was measured by HPLC. The
determination of coumarin release from LPNPs was similar to PTX release from
LPNPs.
Cells culture
Michigan Cancer Foundation-7 (MCF-7) cells were purchased from the China Center
for Type Culture Collection (Wuhan University, Wuhan, People’s Republic of China)
and cultured in DMEM medium which was supplemented with 10% FBS and 1%
streptomycin/penicillin. Cells were kept at 37 °C in a humidified incubator containing
5% CO2.
Co-localization of coumarin-LPNPs and Mitotracker® Red in the mitochondria of
MCF-7 cells
Co-localization of coumarin-LPNPs and mitochondria of MCF-7 cells was
monitored using a CLSM (Nikon, TE2000, EZ-C1, Japan). Coumarin as a fluorescence
indicator was used. Coumarin-LPNPs were prepared similar to PTX-LPNPs except
PTX was replaced with coumarin. The DLC of all coumarin-LPNPs ranged from 8.0%
to 8.2%. 3×10⁴ MCF-7 cells were seeded in confocal dishes and incubated at 37 °C for
24 h. The media were then replaced with 1mL of media with LPNPs containing 10 μg
coumarin and incubated for further 24 h in the dark at 37°C. After removing the culture
medium and washing twice with PBS, the cells were stained using 1mL of 100 nM
Mitotracker® Red CMXRos (Invitrogen, USA) for 15 min in the dark at 37 ℃.
Subsequently, the cells were washed with PBS three times and kept in PBS for CLSM
observation. The green fluorescence signals of coumarin and red fluorescence signals
of Mitotracker® Red were detected using 408/520 and 543/590nm excitation/emission
filters respectively. The Pearson’s correlation coefficient of green fluorescence from
coumarin and red fluorescence from Mitotracker® Red was calculated using Imaging J
software (National Institute of Health, USA).
In vitro cytotoxicity assay
The cytotoxicity offree PTX and PTX-LPNPs against MCF-7 cells was evaluated by
the MTT assay. Cells were seeded at a density of 7000 cells per well in 96-well plates
and cultured at 37 ℃ for 24 h. Then the medium was replaced by 100 L DMEM
medium containing free PTX or PTX-LPNPs at various concentrations of PTX from
5.0 to 0.04 μg/mL. 100 L complete DMEM was used as a control. After 48 h
incubation under 5% CO2 at 37 °C, the medium was replaced by 100 μL of MTT
solution (0.5 mg/ mL). After 4h additional incubation, the medium was removed and
150 μL DMSO was added into each well to dissolve the formazan crystals. The
absorbance was measured on a microplate reader (Thermo Scientific, USA) at 570 nm.
Cell viability was calculated according to the following equation: Cell viability
(%)=[(Asample–A0)/(Acontrol-A0)]×100, where Asampleand Acontrolare the absorbance values
for the treated cells and the untreated control cells. A0 is the absorbance for the untreated
control cells without addition of MTT. Data are presented as average ± SD (n=4).
The cytotoxicity of LPNPs against MCF-7 and cytotoxicity of free PTX and PTX-
LPNPs against COS 7 cells were similarly measured.
Release of cytochrome c from mitochondria
A Streptavidin/Peroxidase immunohistochemical kit was used to detect cytochrome
c released from the mitochondria of MCF-7 cells to the cytosol according to the
manufacturer's instructions. MCF-7 cells were seeded in 6-well plates (3×10⁵
cells/well) and incubated for 24 h. The medium was separately replaced by 1 mL
complete medium containing free PTX or PTX-LPNPs at 3 μg/mL of PTX. The cells
were incubated for 24 h, and fixed with 4% paraformaldehyde for 15 min, followed by
treated with 3% H2O2 (v/v). After that, blocking buffer, primary antibody anti-
cytochrome c, enhanced secondary antibody and enhanced streptavidin HRP in the kit
(Shanghai Beyotime Biotechnology,Co, Ltd, China) were used to treat cells,
respectively. After treatment with freshly prepared diaminobenzidine-
tetrahydrochloride (DAB) in the kit, an optical microscope(Nikon, XSP-8CZ, Japan)
was used to observe cytochrome c release in the cells.
Caspase-9 and caspase -3 activity
Colorimetric assay kits (Shanghai Beyotime Biotechnology, Co, Ltd, China) were
used to measure caspase-9 and caspase-3 activity ratios of MCF-7 cells. MCF-7 cells
were seeded in 6-well plates (3×10⁵ cells/well) and incubated for 24 h. The medium
was separately replaced by 1 mL complete medium containing free PTX or PTX-
LPNPs at 3 μg/mL of PTX). After further 24 h incubation, the cells were harvested and
washed twice with PBS, then treated with lysis buffer provided in the kit for 1 h in the
ice bath. Subsequently, the solution was centrifuged at 10,000 rpm for 2 min at 4 °C
and the supernatants were collected. Caspase-9 or caspase-3 substrates in the kit were
separately incubated with the supernatants at 37 °C for 4 h in the dark. A microplate
reader (Thermo Scientific, USA) was used to measure caspase-9 and caspase-3 activity
and the value was calculated according to the manufacture's instruction. The absorbance
for the cells untreated with PTX-containing sample was used a control. Data are
presented as average ± SD (n=3).
Cell apoptosis assay
Annexin V-fluorescein isothiocyanate (FITC)/propidium iodide (PI) apoptosis
detection kit (BD Biosciences, OR, USA) was used to determine apoptotic rate of MCF-
7 cells.MCF-7 cells were seeded in 6-well plates at 4×10⁴ cells/well and incubated for
24 h. The medium was separately replaced by 1 mL complete medium containing free
PTX or PTX LPNPs at 3 μg/mL of PTX. After additional 24 h incubation, the cells
were harvested and washed twice with PBS. Thereafter, the cells were centrifuged and
resuspended in 300 μL of 1×binding buffer in the kit. 5 µL of annexin V-FITC and 10
µL of PI were added to each cell suspension. The cell suspension was incubated at room
temperature for 15min in dark, followed by adding 200 µL of 1× binding buffer in the
kit. The fluorescence intensity of cells was measured using a flow cytometer (CyAN-
ADP, Beckman). The cells untreated with PTX-containing sample were used as a
control.
Cell OCR analysis
O2 consumption rate (OCR) was investigated in real time using XF24 extracellular
flux analyzer instrument (Seahorse Bioscience, USA) and measuring kits were
provided by Seahorse Bioscience. MCF-7 cells were seeded on XF24-well cell plates
at 5× 10⁴ cells/well in 150 μL DMEM medium and then incubated for 24 h at 37 °C in
a humidified incubator containing 5% CO2. After 24 h, cells were treated with 100 μL
medium containing free PTX or PTX-LPNPs at 3 μg/mL of PTX for 15 h at 37 °C in
5% CO2 atmosphere. Then, all but 50 μL of the culture medium was removed from each
well and cells were washed two times with 1 mL of XF stress test medium(provided in
the kit) pre-warmed to 37 °C.Finally 450 µL of test medium was added to each well
and the plate was placed at 37 °C without CO2 for 1 h prior to assay. XF sensor catridges
(provided in the kit)used in the processshould be hydrated prior to assay. 1 mL of
Seahorse calibrant (provided in the kit) was added into the each wellof an XF utility
plate (provided in the kit), on the top of which XF sensor cartridges were placed, and
then catridges together with XF utility plate were kept at 37 °C incubator without CO2
for 24 h. According to the manufacturer’s instructions, OCR was measured in basal
condition or after addition of Electron transport inhibitors oligomycin (1.0 µM), FCCP
(0.25μM), a mixture of antimycin-A (0.5 µM) and rotenone (0.5 µM) sequentially. Test
samples on each well had three replicates.
HPLC measurement of PTX content in whole cells and the mitochondria of
MCF-7 cells
Cells were seeded at a density of 5 x 10⁴ cells per well in 6-well plates and cultured
at 37 ℃ for 24 h. Then the medium was replaced by 1 mL complete medium containing
free PTX or PTX-LPNPs at 3 μg/mL of PTX. After 24 h incubation under 5% CO2 at
37 °C, cells were harvested and washed twice with PBS. Cells were resuspendedin 1mL
PBS and divided into two parts; one was lyased and analyzed using BCA Protein Assay
Kit (purchased from BD biosciences), the other one was used for mitochondrial
isolation.To obtain mitochondria of cancer cells, mitochondria isolation kit (purchased
from Beyotime) was used. Cells were harvested and washed with cold PBS, followed
by resuspended in 2 mL mitochondria isolated solution (provided in the kit) and then
kept in the ice bath for 15 min. After that, cells solution were transferred into the
homogenizer and homogenized 10 times, followed by centrifuged at 600 rpm for 10
min at 4 °C. The supernate was transfered into another tube and centrifuged at 11,000
rpm for 10 min at 4 °C. The precipitate was harvested and mitochondria of cancer cells
were obtained. In order to measure PTX content in the mitochondria, the precipitate
was resuspended in 200 µL mitochondrial lysate (provided in kit) and kept in the ice
bath for 15 min. The mitonchondria-lysated solution was divided into two parts. 100µL
of solution was used to mearsure the amount of total protein using BCA Protein Assay
Kit. Another 100µL of solution was added into 400 μL chloroform. The mixture was
whirled violently for 5 min and centrifuged at 12,000 rpm for 15 min. The organic phase
was separated to dryness at 60 °C. The residue was redissolved in 100 μL acetonitrile
and whirled violently for 5 min. After centrifugation at 12,000 rpm for 5 min, 10 μL of
supernatant was analyzed by HPLC. The mass of PTX was calculated from a standard
curve that was linear over the concentration of PTX from 0.01 μg/mL to 5 μg/mL.
In vivo therapeutic study
Four weeks old female BALB/c nude mice were purchased from Beijing Hua Fu
Kang Biological Technology Co, Ltd of China. All animals received care in compliance
with the guidelines outlined in the Guide for the Care and Use of Laboratory Animals
and the procedures were approved by the Wuhan University of China Animal Care and
Use Committee. To develop the tumor xenograft model, MCF-7 cells (5×10⁶ cells)
suspended in 200 µL PBS were subcutaneously injected into the right back of the mice.
A caliper was used to measure the length (L) and width (W) of tumor. Tumor volume
(mm3) was calculated as V=L×W2/2. Once the tumor volumes reached around 90 mm3
in the12th day post-tumor inoculation, the mice were randomly divided into seven
groups (n=5 per group). The mice bearing MCF-7 xenograft tumors were separately
treated with 200 µL of free PTX, PTX-PLGA/CPT, PTX-PLGA/DCCP, PTX-
PLGA/DSSP, PTX-PLGA/CPT/DCCP and PTX-PLGA/CPT/DSSP via intravenous
injection of an equivalent dose of 7.5 mg PTX per kg of mouse body weight.The
treatment with 200 µL of PBS was used as a control. The tumor volumes and the body
weights of mice were monitored each two days. The tumor inhibitory rate (TIR) was
calculated as TIR=[1-(Vtf-Vti)/(Vpf-Vpi)]×100%. Vtf and Vti represent the final and
initial tumor volume of the treatment group, while the Vpf and Vpi represent the final
and initial tumor volume of the PBS group, respectively.
The mice were sacrificed on the 18th day post-drug injection. The tumors were
removed and washed with PBS, followed by fixed in 4% formaldehyde for histological
and immunohistochemical analysis.
Biodistribution of PTX
Twenty-four mice bearing MCF-7 tumor (90 mm3) were randomly divided into six
groups (n=4 per group), and separately treated with 200 µL of free PTX, PTX-
PLGA/CPT, PTX-PLGA/DCCP, PTX-PLGA/DSSP, PTX-PLGA/CPT/DCCP and
PTX-PLGA/CPT/DSSP via intravenous injection of an equivalent dose of 7.5 mg PTX
per kg of mouse body weight. After 24 h, the mice were sacrificed. The main tissues,
including heart, liver, spleen, lung, kidney and tumors, were collected, washed with
cold PBS, dried on filter paper, weighted and cut into small pieces. The samples were
individually ground to a homogenate in KH2PO4with a tissue pulverizer (IKA, T 25
digital S 25, Germany) for subsequent operation. 100 μL of the whole tissue
homogenate was added into 400 μL chloroform. The mixture was whirled violently for
5 min and centrifuged at 12,000 rpm for 15 min. The organic phase was separated to
dryness at 60 °C. The residue was redissolved in 100 μL acetonitrile and whirled
violently for 5 min. After centrifugation at 12,000 rpm for 5 min, 10 μL of supernatant
was analyzed by HPLC. The percentage of PTX in the different tissue was calculated
by following formula: % PTX/g organ = 100 * QPTX in tissue /( QOrgan * QPTX injected), where
QPTX in tissue and QOrgan were the total amount of PTX in the tissue and weight of the
tissue, respectively.
Measurement of PTX content in whole cancer cells and the mitochondria of cancer
cells after i. v. injection
Eighteen mice bearing MCF-7 tumor (100 mm3) were randomly divided into six
groups (n=3 per group), and separately treated with 200 µL of free PTX, PTX-
PLGA/CPT, PTX-PLGA/DCCP, PTX-PLGA/DSSP, PTX-PLGA/CPT/DCCP and
PTX-PLGA/CPT/DSSP via intravenous injection of an equivalent dose of 7.5 mg PTX
per kg of mouse body weight. After 24 h, the mice were sacrificed, meanwhile, tumors
were collected, washed with hank’s solution two times. Following, tumors were cut into
small fragment (1-2 mm3) and ground to 5mL DF12 medium containing type I and type
IV collagenases (2 mg/mL, Sigma, St. Louis, MO, USA) to collagen digested for 2 h at
37°C. During digestion times, the mixture was dispersed by pipetting each 30 min.
After 2 h digestion, the mixture was filtered by filtration sieve cells (40 mesh) and cells
were harvested for subsequent operation.Cancer cells were isolated by differential
adhesion method1. Cells medium were transferred into culture bottle (marked as bottle
A) and 10 mL fresh DMEM was added into bottle A. After cultured for 20 min at 37°C,
bottle A was swayed gently, and the medium was then transferred into culture bottle B.
The process was performed three times repeatedly, following medium were harvested
and centrifuged at 1000 rpm for 10 min to obtain cancer cells. The cancer cells were
divided into two parts. One part of cells were used to measure the PTX content in whole
cells. Another part of cells were used to measure the PTX content in the mitochondria
of cancer cells. The separation and analysis methods were same as described above.
PTX content was measured by HPLC analysis.
Statistical analysis
Statistical analyses were performed using Student's t-test. P<0.05 was considered
significant. Data were expressed as mean ± SD.
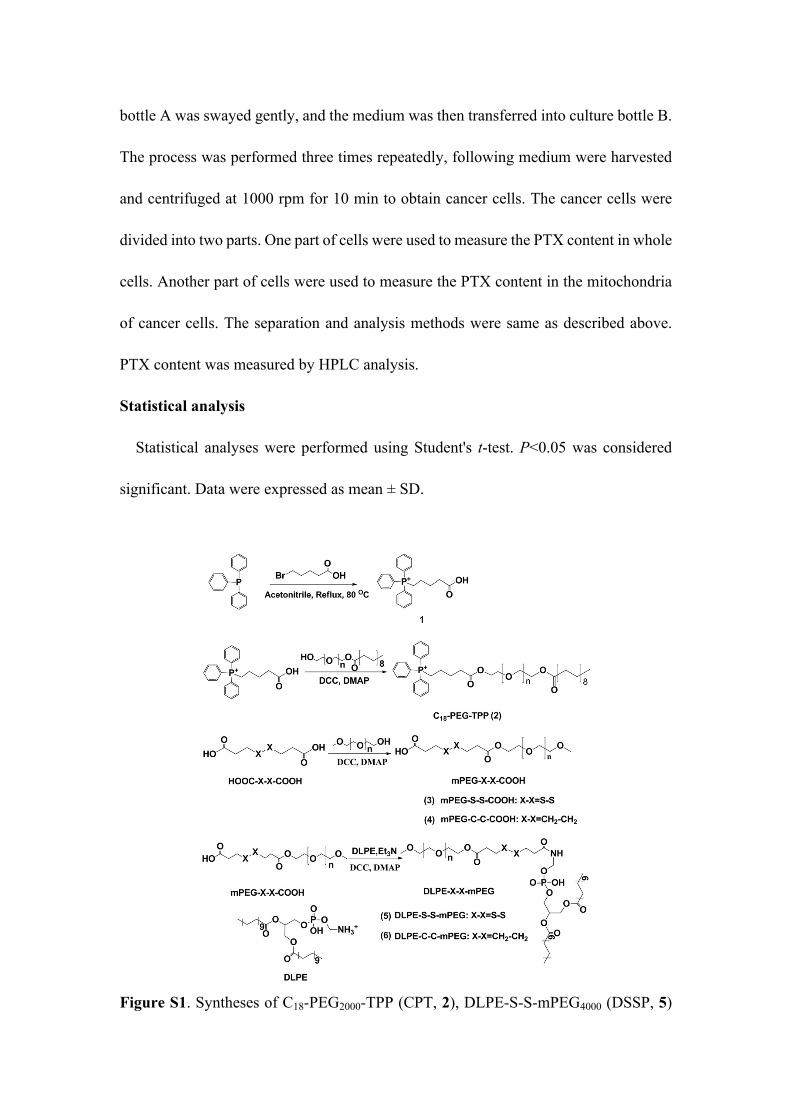
Figure S1. Syntheses of C18-PEG2000-TPP (CPT, 2), DLPE-S-S-mPEG4000 (DSSP, 5)
and DLPE-C-C-mPEG4000 (DCCP, 6).
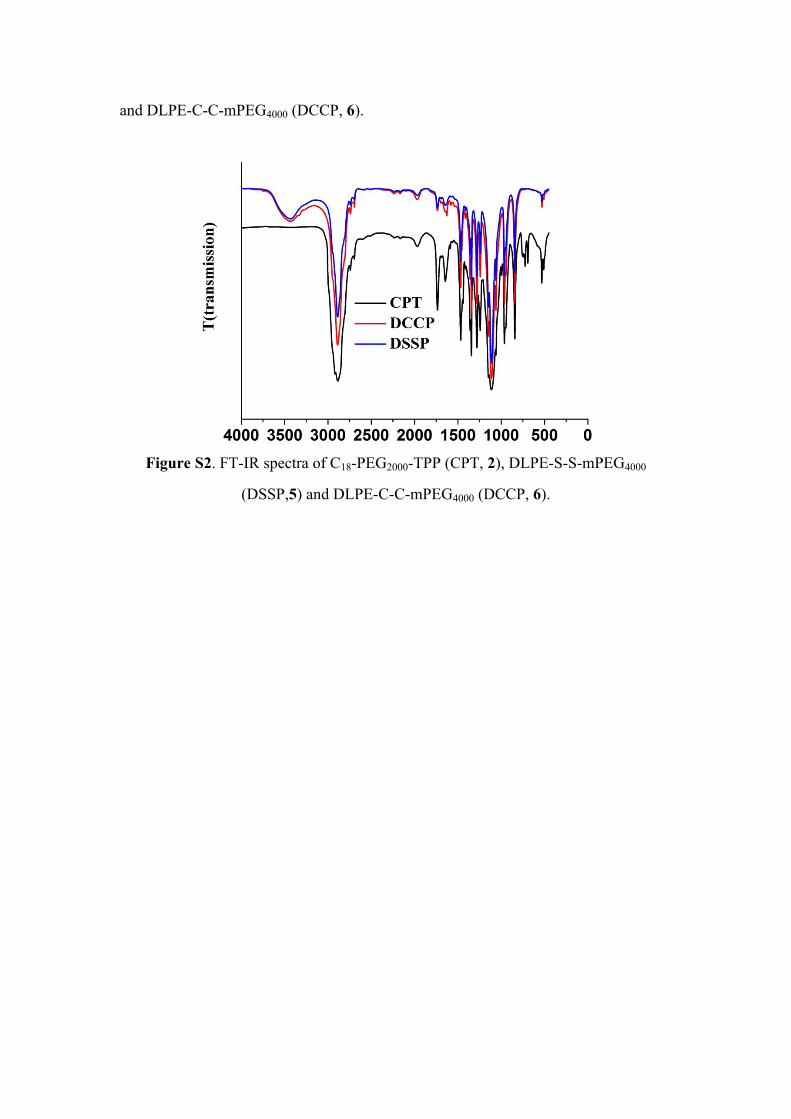
Figure S2. FT-IR spectra of C18-PEG2000-TPP (CPT, 2), DLPE-S-S-mPEG4000
(DSSP,5) and DLPE-C-C-mPEG4000 (DCCP, 6).
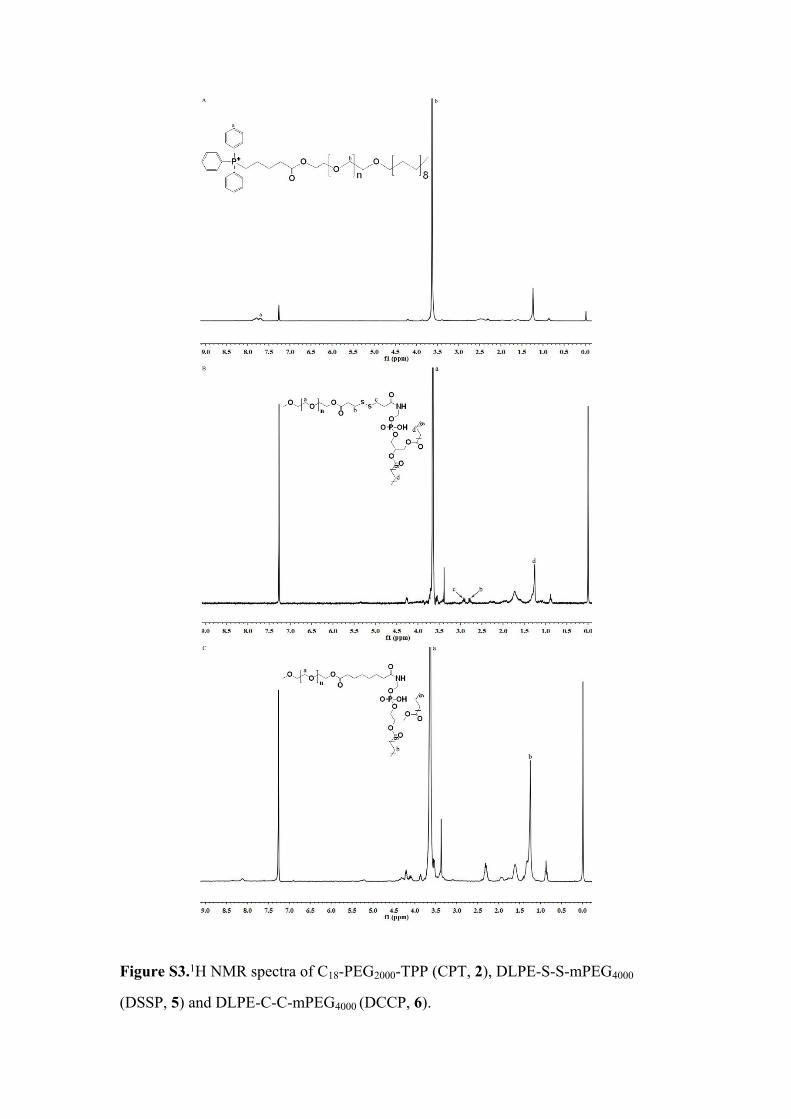
Figure S3.1H NMR spectra of C18-PEG2000-TPP (CPT, 2), DLPE-S-S-mPEG4000
(DSSP, 5) and DLPE-C-C-mPEG4000 (DCCP, 6).
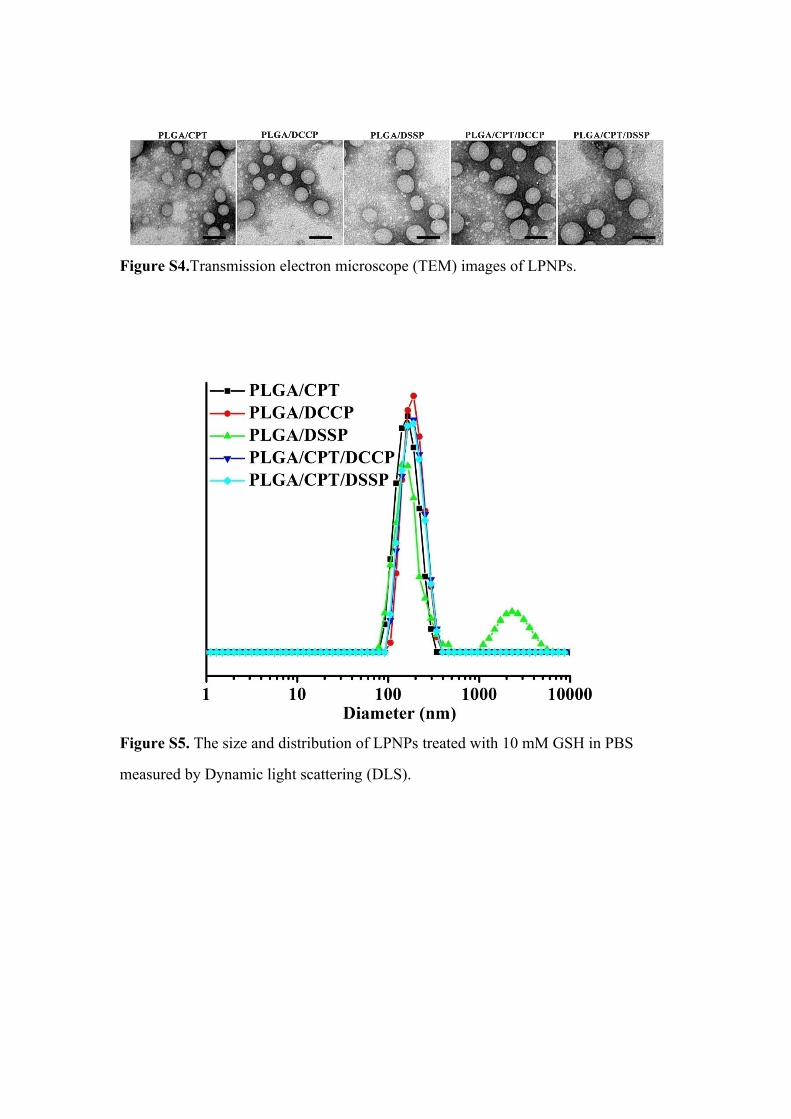
Figure S4.Transmission electron microscope (TEM) images of LPNPs.
Figure S5. The size and distribution of LPNPs treated with 10 mM GSH in PBS
measured by Dynamic light scattering (DLS).
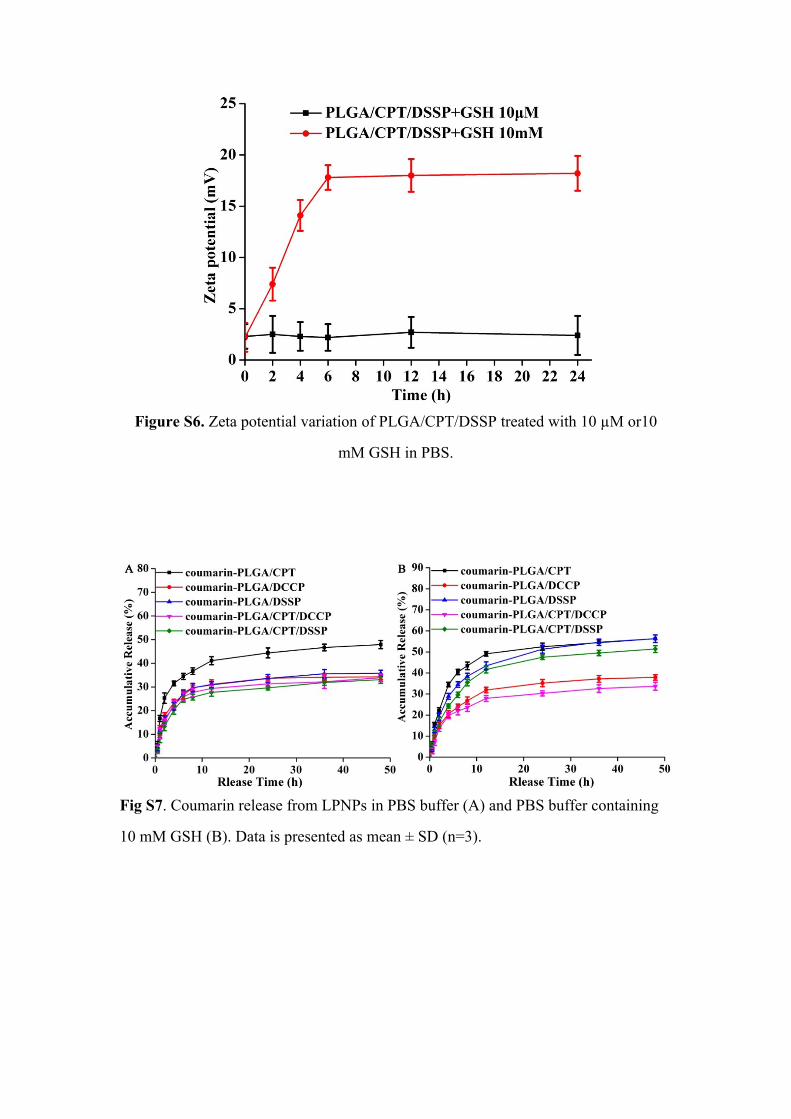
Figure S6. Zeta potential variation of PLGA/CPT/DSSP treated with 10 µM or10
mM GSH in PBS.
Fig S7. Coumarin release from LPNPs in PBS buffer (A) and PBS buffer containing
10 mM GSH (B). Data is presented as mean ± SD (n=3).
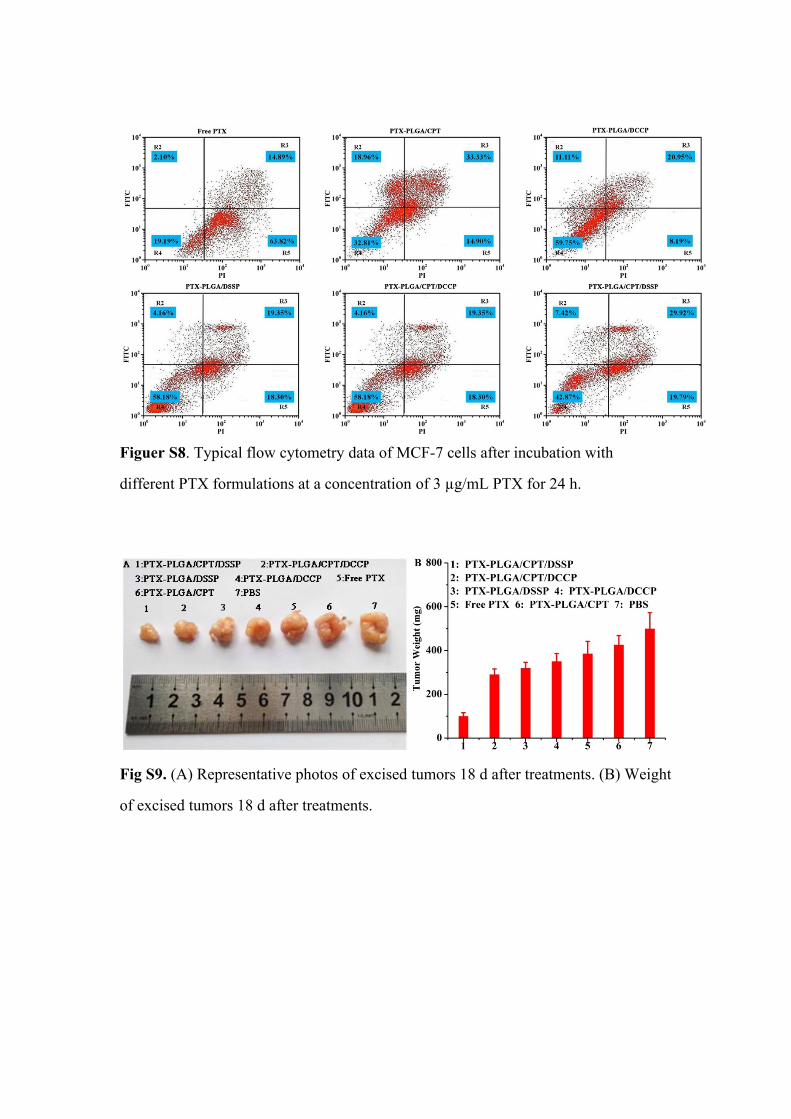
Figuer S8. Typical flow cytometry data of MCF-7 cells after incubation with
different PTX formulations at a concentration of 3 µg/mL PTX for 24 h.
Fig S9. (A) Representative photos of excised tumors 18 d after treatments. (B) Weight
of excised tumors 18 d after treatments.
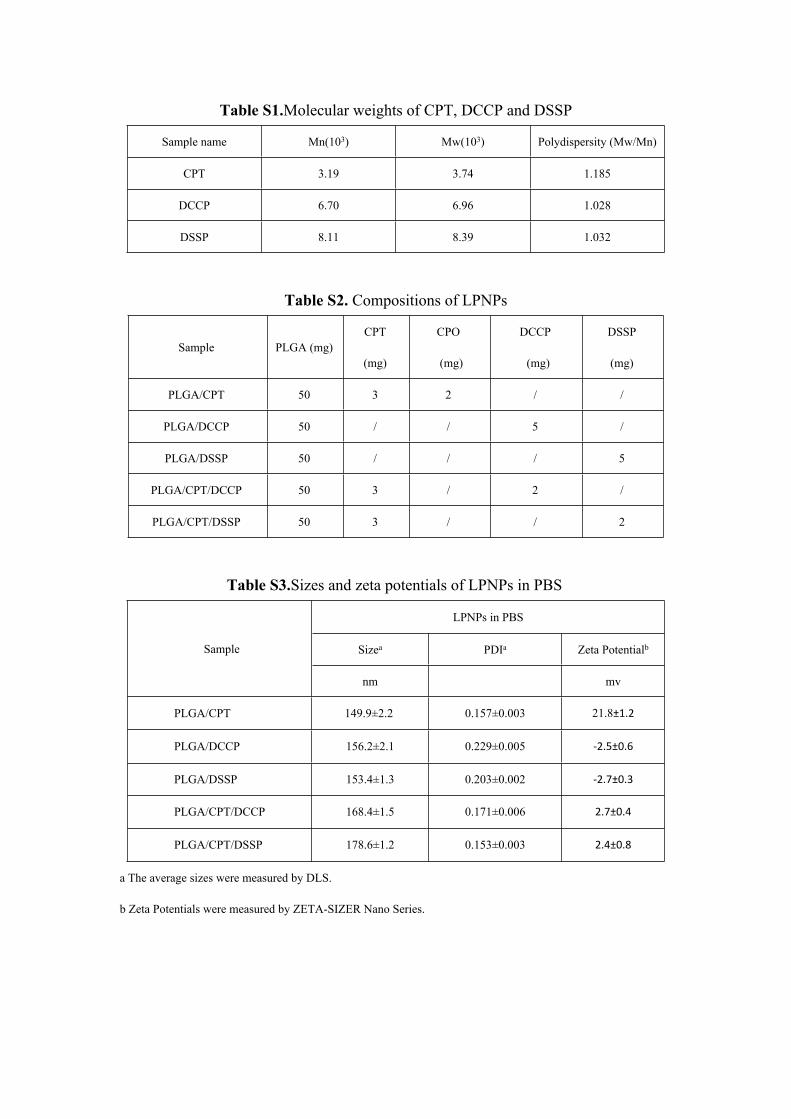
Table S1.Molecular weights of CPT, DCCP and DSSP
Sample name Mn(103) Mw(103) Polydispersity (Mw/Mn)
CPT 3.19 3.74 1.185
DCCP 6.70 6.96 1.028
DSSP 8.11 8.39 1.032
Table S2. Compositions of LPNPs
Sample PLGA (mg)CPT
(mg)
CPO
(mg)
DCCP
(mg)
DSSP
(mg)
PLGA/CPT 50 3 2 / /
PLGA/DCCP 50 / / 5 /
PLGA/DSSP 50 / / / 5
PLGA/CPT/DCCP 50 3 / 2 /
PLGA/CPT/DSSP 50 3 / / 2
Table S3.Sizes and zeta potentials of LPNPs in PBS
LPNPs in PBS
Sizea PDIa Zeta PotentialbSample
nm mv
PLGA/CPT 149.9±2.2 0.157±0.003 21.8±1.2
PLGA/DCCP 156.2±2.1 0.229±0.005 -2.5±0.6
PLGA/DSSP 153.4±1.3 0.203±0.002 -2.7±0.3
PLGA/CPT/DCCP 168.4±1.5 0.171±0.006 2.7±0.4
PLGA/CPT/DSSP 178.6±1.2 0.153±0.003 2.4±0.8
a The average sizes were measured by DLS.
b Zeta Potentials were measured by ZETA-SIZER Nano Series.
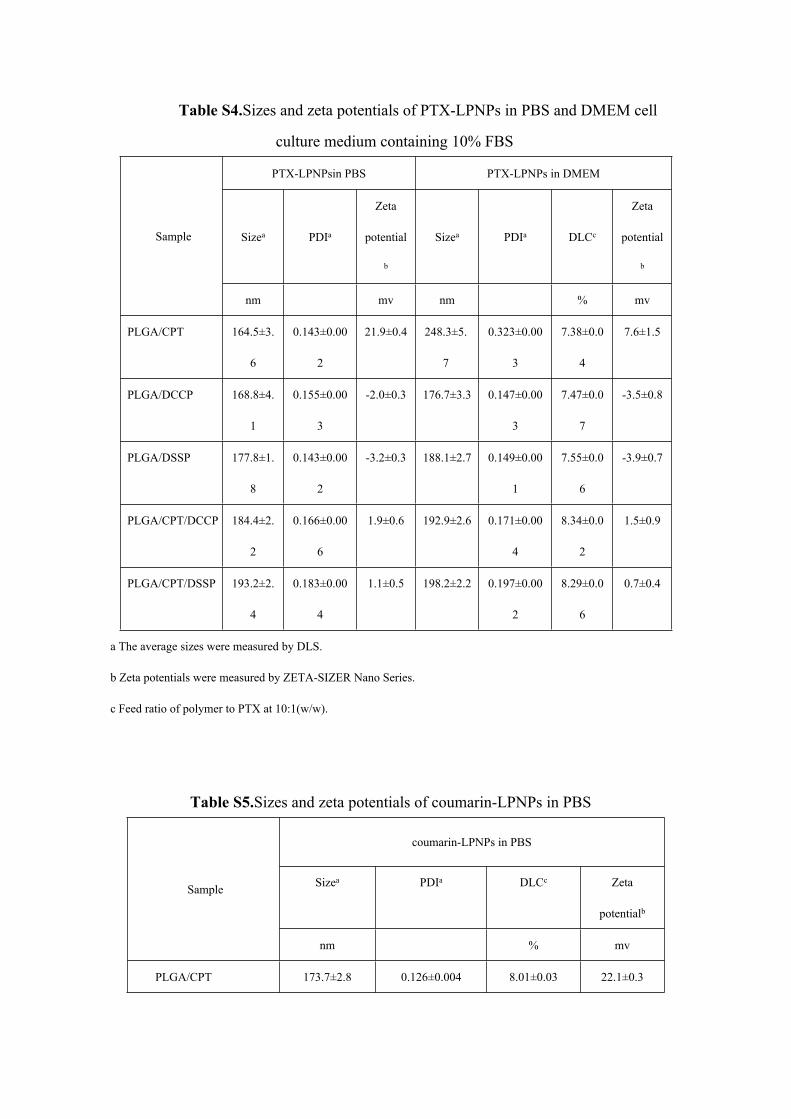
Table S4.Sizes and zeta potentials of PTX-LPNPs in PBS and DMEM cell
culture medium containing 10% FBS
PTX-LPNPsin PBS PTX-LPNPs in DMEM
Sizea PDIa
Zeta
potential
b
Sizea PDIa DLCc
Zeta
potential
b
Sample
nm mv nm % mv
PLGA/CPT 164.5±3.
6
0.143±0.00
2
21.9±0.4 248.3±5.
7
0.323±0.00
3
7.38±0.0
4
7.6±1.5
PLGA/DCCP 168.8±4.
1
0.155±0.00
3
-2.0±0.3 176.7±3.3 0.147±0.00
3
7.47±0.0
7
-3.5±0.8
PLGA/DSSP 177.8±1.
8
0.143±0.00
2
-3.2±0.3 188.1±2.7 0.149±0.00
1
7.55±0.0
6
-3.9±0.7
PLGA/CPT/DCCP 184.4±2.
2
0.166±0.00
6
1.9±0.6 192.9±2.6 0.171±0.00
4
8.34±0.0
2
1.5±0.9
PLGA/CPT/DSSP 193.2±2.
4
0.183±0.00
4
1.1±0.5 198.2±2.2 0.197±0.00
2
8.29±0.0
6
0.7±0.4
a The average sizes were measured by DLS.
b Zeta potentials were measured by ZETA-SIZER Nano Series.
c Feed ratio of polymer to PTX at 10:1(w/w).
Table S5.Sizes and zeta potentials of coumarin-LPNPs in PBS
coumarin-LPNPs in PBS
Sizea PDIa DLCc Zeta
potentialb
Sample
nm % mv
PLGA/CPT 173.7±2.8 0.126±0.004 8.01±0.03 22.1±0.3

PLGA/DCCP 168.4±2.4 0.150±0.003 8.12±0.05 -2.6±0.2
PLGA/DSSP 181.4±3.2 0.138±0.008 8.11±0.03 -3.5±0.3
PLGA/CPT/DCCP 184.4±2.2 0.147±0.005 8.17±0.04 1.7±0.4
PLGA/CPT/DSSP 186.8±2.6 0.172±0.004 8.20±0.02 1.4±0.2
a The average sizes were measured by DLS.
b Zeta potentials were measured by ZETA-SIZER Nano Series.
c Feed ratio of polymer to coumarin at 10:1(w/w).
Table S6. IC50 of free PTX and PTX-LPNPs against MCF-7 and COS 7 cells
MCF-7 COS 7
IC50 IC50Sample
(g/mL) (g/mL)
Free PTX 0.78 ± 0.08 1.34 ± 0.08
PTX-PLGA/CPT 1.65 ± 0.04 5.67 ± 016
PTX-PLGA/DCCP 5.22 ± 0.13 10.07 ± 0.20
PTX-PLGA/DSSP 2.74 ± 0.10 10.03 ± 0.18
PTX-PLGA/CPT/DCCP 4.62 ± 0.13 7.76 ± 0.16
PTX-PLGA/CPT/DSSP 1.79 ± 0.07 7.81 ± 0.22
1. Biernaskie, J. A.; McKenzie, I. A.; Toma, J. G.; Miller, F. D. Nature Protocols
2006, 1, 2803-2812.