Chemistry of Natural Resources -...
91
Salters Advanced Chemistry Module 2 Activities Booklet Chemistry of Natural Resources 2848 AS M From Minerals to Elements A The Atmosphere PR The Polymer Revolution A2 (2849) WM What’s in a Medicine?
Transcript of Chemistry of Natural Resources -...

Salters Advanced Chemistry Module 2 Activities Booklet
Chemistry of Natural Resources
2848
AS M From Minerals to Elements A The Atmosphere PR The Polymer Revolution
A2 (2849) WM What’s in a Medicine?

Chemistry of Natural Resources Module 2 – 2848 - Activities Booklet
From Minerals to Elements M1.1 Solutions of ions 64 M1.2 Bromine production 67 M1.3 Halogens and their compounds 68 M1.4 This liquid is dangerous 71 M1.5 Manufacturing chlorine 73 M2.1 Mineral spotting 75 M2.2 Getting at the minerals 76 M2.3 Extracting copper 77 M2.4 Finding out how much acid there is in a solution 81 M2.5 The philosopher’s microbe 83 M2.6 Molecules and networks 85 M3 Check your notes on From Minerals to Elements 86
Developing Fuels A2.1 What substances can act as sunscreens? 89 A2.2 Investigating sunscreens 90 A2.3 What is the effect of the atmosphere on the Sun’s radiation? 91 A3.1 More about ozone 92 A3.2 The photodissociation of bromine (Optional teacher demonstration) 93 A3.3 Investigating the reaction between bromine and cyclohexane 94 A4.1a How do halogenoalkanes differ in reactivity? 96 A4.1b How do halogenoalkanes differ in reactivity? 97 A4.2 Making a halogenoalkane 98 A4.3 Designing refrigerants 101 A5 Chemistry in the stratosphere 105 A6 Which are the greenhouse gases? 106 A8.1 The effect of concentration changes on chemical equilibria 107 A8.2 Measuring the concentration of carbon dioxide in air samples 109 A9 Controlling carbon dioxide 111 A10 Check your notes on The Atmosphere 115

Chemistry of Natural Resources Module 2 – 2848 - Activities Booklet
The Polymer Revolution PR1 Some important polymers: introductory data 118 PR2 Making poly(phenylethene) (Optional extension) 121 PR3 Using spaghetti to model polymer structure 122 PR5.1 Deflecting jets 123 PR5.2 Viscosity in alcohols 124 PR5.3 Now you see it... 125 PR5.4 Making ‘slime’ 126 PR5.5 The oxidation of alcohols 126+1
PR6 Poly(pyrrole) – a conducting polymer 127 PR7 Check your notes on The Polymer Revolution 130
What’s in a medicine? WM1 The origins and development of the modern pharmaceutical industry 134 WM2 Extraction of salicylic acid 139 WM3 Investigating the chemistry of the –OH group in various environments 140+1
WM4 Interpretation of the mass spectrum of salicylic acid 144 WM5.1 A preparation of aspirin 147 WM5.2 Using spectroscopy 148 WM6 An aspirin assay 150 WM8 Which product should a pharmaceutical company develop? 152 WM9 Check your notes on What’s in a medicine? 156+1

„ Salters Advanced Chemistry 2000 – see Copyright restrictions 64
Solutions of ions
This activity uses simple test-tube experiments toillustrate the properties of ionic solutions.
M1.1
Requirements� test-tubes
� teat pipettes
� 10 cm3 measuring cylinder
� copper(II) carbonate, solid (1 spatula measure)
� copper(II) sulphate solution, 1 mol dm–3 (6 cm3)
� sodium nitrate(V) solution, 1 mol dm–3 (10 cm3)
� sodium carbonate solution, 1 mol dm–3 (2 cm3)
� lead nitrate(V) solution, 1 mol dm–3 (3 cm3)
� potassium iodide solution, 1 mol dm–3 (1 cm3)
� hydrochloric acid, 1 mol dm–3 (3 cm3)
� sodium hydroxide solution, 1 mol dm–3 (2 cm3)
� sulphuric acid, 1 mol dm–3 (2 cm3)
� sodium chloride solution, 1 mol dm–3 (1 cm3)
copper(II) carbonate
copper(II) sulphate solution
lead nitrate(V) solution
HARMFUL
HARMFUL
TOXIC
dilute sulphuric acidIRRITANT
dilute sodium hydroxidesolution
If you had a crystal of copper(II) sulphate which was large enough to test its
electrical conductivity, you would find that it does not conduct. But if you
dissolve copper(II) sulphate crystals in water, the resulting solution does
conduct electricity. These simple observations provide some direct evidence to
support the theory about what happens when an ionic compound such as
copper(II) sulphate dissolves in water:
� Solid ionic compounds consist of regular giant ionic lattices, with the positive
and negative ions in fixed positions. The ions cannot move and so the solid
does not conduct electricity.� When an ionic compound dissolves in water, the ions separate and become
surrounded by water molecules (hydrated). The ions move about
independently in the solution and so the solution conducts electricity.
You will find all of the small tests that you do in this activity easy to explain if you
remember to picture any solution of an ionic compound as consisting of positive
and negative ions moving independently throughout the solution. You also need
to know that all sodium and potassium salts are soluble at the concentrations
used in these tests.
WEAR EYEPROTECTION
CARE Eye protectionmust be worn.
CORROSIVE
10509-05P064-086-GECKO.LTD 7/3/02 4:07 pm Page 64

„ Salters Advanced Chemistry 2000 – see Copyright restrictions 65
M1.1SOLUTIONS OF IONS
What you doUsing Table 1, carry out the tests as instructed below. In the observation column
of the table record what you see, not what you think is happening. But keep
thinking about what is happening. You need to be clear about the ions present
in each compound. It may help to write the name of each compound below the
formula in the table.
After answering each set of questions, write an explanation of your
observations in the last column of the table, using at least two words from this
list for each experiment:
mixing
diluting
dissolving
precipitating
solution
insoluble salt
soluble salt
acid-base
The first row of the table has been filled in as an example.
1 Carry out experiments i to iv by mixing the reagents shown in Table 1.
a What is the concentration of Cu2+(aq) ions in a 1 mol dm3 solution ofcopper(II) sulphate?
b What is the concentration of SO42–(aq) ions in a 1 mol dm–3 solution
of copper(II) sulphate?c What is the concentration of each of Cu2+(aq) and Cl–(aq) ions in a
1 mol dm–3 solution of copper(II) chloride, CuCl2(aq)?
2 Carry out experiments v to ix.
d What would you expect to see if you mixed the lead nitrate(V)solution with sodium chloride solution, instead of hydrochloric acid,in ix? Carry out the mixing to check your prediction.
3 Carry out experiments x to xii.
e The enthalpy change when1 dm3 of 1 mol dm–3 NaOH(aq) reacts with1 dm3 of 1 mol dm–3 HCl(aq)
is the same as the enthalpy change when1 dm3 of 1 mol dm–3 NaOH(aq) reacts with1 dm3 of 1 mol dm–3 solution of HNO3(aq).
How does this evidence support the theory that these threesubstances exist as separate ions when in dilute aqueous solution?
4 When you have completed the explanation column of Table 1, write full
equations, with state symbols, for each chemical reaction that occurred in
the tests you carried out. Then write ionic equations for each of these
reactions.
10509-05P064-086-GECKO.LTD 7/3/02 4:07 pm Page 65

SOLUTIONS OF IONSM1.1
66 „ Salters Advanced Chemistry 2000 – see Copyright restrictions
Reagents Observations Explanation
i 1 cm3 CuSO4(aq) + 5 cm3 H2O
Blue solution becomes Words used:paler as water is added diluting, mixing, solution
ii 5 drops CuSO4(aq) + 5 cm3 H2O
iii 1 cm3 CuSO4(aq) + 5 cm3 NaNO3(aq)
iv 5 drops CuSO4(aq) + 5 cm3 NaNO3(aq)
v 1 cm3 CuSO4(aq) + 1 cm3 Na2CO3(aq)
vi 1 cm3 CuSO4(aq) + 1 cm3 NaOH(aq)
vii 1 cm3 CuSO4(aq) + 1 cm3 Pb(NO3)2(aq)
viii 1 cm3 Pb(NO3)2(aq) + 1 cm3 KI(aq)
ix 1 cm3 Pb(NO3)2(aq) + 1 cm3 HCl(aq)
x 1 cm3 Na2CO3(aq) + 2 cm3 HCl(aq)
xi 1 cm3 NaOH(aq) + 1 cm3 HCl(aq)
xii 1/2 spatula CuCO3(s) + 2 cm3 H2SO4(aq)
Table 1 Results table
10509-05P064-086-GECKO.LTD 7/3/02 4:07 pm Page 66

„ Salters Advanced Chemistry 2000– see Copyright restrictions 67
Bromine production
This activity is designed to help you to understand therole of redox reactions in the production of bromine.
M1.2
The flow diagram in Figure 1 describes the production of bromine from water
from the Irish Sea. It provides a simplified diagrammatic summary of the
sequence of steps in the process and identifies the inputs and outputs of each
step. This flow diagram does not provide any information about the energy
transfers in the process.
QUESTIONS
a Write an equation, with state symbols, for the redox reactionoccurring in:i the sea water inlet pipeii the blowing-out toweriii the steaming-out tower.For each reaction identify what is oxidised and what is the oxidisingagent.
b Which of the properties of bromine make it possible to separate itfrom water?
c What would you expect the hot vapour mixture leaving thesteaming-out tower to contain?
d Suggest what the outputs would be at points X and Y.
e Identify a point on the flow diagram where:i heating is requiredii cooling is required.
BLOWINGOUT
TOWER
STEAMING OUT
TOWER
CONDENSER
SEPARATOR
DRYER
sea water
sea water
SO2(g)
fresh water
CI2(g)
steam Y
purebromine
X
concentratedH2SO4
hot vapour mixtureHBr(aq) andH2SO4(aq)
dampbromine
H2SO4(aq) Cl2(g)
Figure 1 Flow diagram for bromine productionat the Almwch works
10509-05P064-086-GECKO.LTD 7/3/02 4:07 pm Page 67

„ Salters Advanced Chemistry 2000 – see Copyright restrictions 68
Halogens and their compounds
M1.3 In this activity you are going to find out about some ofthe properties of the elements chlorine, bromine andiodine, and their compounds. You need to be able torecognise the elements when pure and when insolution. Their appearances will help you to work outwhat is happening during your investigations. Theseexperiments will help you learn some factualchemistry, and will give you practice at observing andinterpreting chemical changes.
Requirements� chlorine solution, in water (5 cm3)
� bromine solution, in water (5 cm3)
� iodine solution, in water (5 cm3)
� test-tubes
� rubber bungs
� potassium chloride, solid (2 g)
� potassium bromide, solid (2 g)
� potassium iodide, solid (2 g)
� potassium chloride solution, 0.1 mol dm–3 (10 cm3)
� potassium bromide solution, 0.1 mol dm–3 (10 cm3)
� potassium iodide solution, 0.1 mol dm–3 (10 cm3)
� silver nitrate solution, 0.025 mol dm–3 (1 cm3)
� cyclohexane (30 cm3)
CARE Cyclohexane is highly flammable. Return residuescontaining cyclohexane to a residues bottle. Do not pourthem down the sink.
bromine solution
chlorine solution
cyclohexane
iodine solution
HARMFUL
Appearances and solubilities of halogenelements1 Draw up a table like the one below so that you can record the following
information for chlorine, bromine and iodine:
� state and colour at room temperature� colour of vapour� colour of aqueous solution� colour of solution in cyclohexane� relative solubility in water and cyclohexane.
Use a textbook if necessary to find out about the appearances of the halogens.
IRRITANT
HARMFUL IRRITANT
HIGHLYFLAMMABLE
HARMFUL
WEAR EYEPROTECTION
CARE Eye protectionmust be worn.
Chlorine Bromine Iodine
state and colour at roomtemperature
2 Observe the behaviour of the halogens in water and in cyclohexane by taking a
few cm3 of a halogen solution in water in a test-tube. Then stopper the tube
and shake the solution with an equal volume of cyclohexane. (CARE Chlorine
and bromine solutions have harmful vapours. Avoid breathing the fumes from
the solutions.) Add this information to your table.
Appearances and solubilities of halogencompounds3 Draw up a table like the one on the next sheet and record the following
points about potassium chloride, potassium bromide and potassium iodide:
10509-05P064-086-GECKO.LTD 7/3/02 4:07 pm Page 68

„ Salters Advanced Chemistry 2000 – see Copyright restrictions 69
M1.3HALOGENS AND THEIR COMPOUNDS
Potassium Potassium Potassiumchloride bromide iodide
state and colour
QUESTIONS
a What general patterns are there in the appearance, volatility andsolubility of the halogens? Make a note of your conclusions. Predictthe properties you would expect for the other two halogens –fluorine and astatine.
b What general pattern can you find in the solubilities of the alkalimetal halides? Make a note of your conclusions. Predict thesolubilities in water and cyclohexane of potassium fluoride andpotassium astatide.
Displacement reactions of halogens4 Add a few drops of aqueous chlorine solution to aqueous potassium
bromide in a test-tube. Observe what happens. It may help you interpret
what happens if you observe the effect of shaking the reaction mixture with
an equal volume of cyclohexane.
If the crystalsdissolve, addanother 2–3crystals
If the crystals donot dissolve,the solid isinsoluble (IS)
If the extra crystalsdissolve, add asmall heap ofcrystals fromthe spatula
If the extra crystalsdo not dissolve,the solid is slightlysoluble (SS)
If all the crystalsdissolve, thesolid is verysoluble (VS)
If some of thecrystals are left,the solid issoluble (S)
Add 2–3 crystalsof solid to thetest-tubecontaining thesolvent
Figure 1 Key for investigating solubilities of alkalimetal halides
� state and colour at room temperature� solubility in water� colour of aqueous solution� solubility in cyclohexane.
The properties of the potassium halides are typical of the alkali metal halides
in general.
You can either look up the solubilities of the salts in a databook or
investigate them for yourself. Use the key shown in Figure 1 to help you
decide what the relative solubilities are. A suitable volume of solvent to use
for these experiments is about 3 cm3.
10509-05P064-086-GECKO.LTD 7/3/02 4:07 pm Page 69

HALOGENS AND THEIR COMPOUNDSM1.3
70 „ Salters Advanced Chemistry 2000 – see Copyright restrictions
5 Now try other combinations of solutions of halogen elements with solutions
of halide salts and look for a pattern. Record your observations and
interpretations in a table like the one shown below:
Halogen added Observation/ Potassium Potassium Potassiuminterpretation chloride solution bromide solution iodide solution
chlorine appearance of aqueous solution
appearance ofcyclohexane solution
names of products
Halide ion Effect of adding silver nitrate Effect of light
Observation Interpretation Observation Interpretation
chloride ion
QUESTIONS
c i Write ionic equations for the reactions of:� chlorine with bromide ions� bromine with iodide ions.
ii Explain how these reactions can be classified as redox reactions.
d i What order for the relative oxidising powers of the halogens issuggested by your results for the displacement reactions?
ii Suggest positions for fluorine and astatine in relation to the otherhalogens in your list for d i.
iii What general pattern emerges from the displacement reactions?
e There is a pattern to the appearances of the silver halides. Explainwhat it is.
f i Is there a pattern in the photosensitivities of the silver halides?Explain your answer.
ii Interpret the effect of light on the silver halides in terms of ideasabout redox.
g Silver halides are used in photography. Which silver halide would bemost useful in:i fast photographic film – film which can be used in low light
levels?ii X-ray film, which is exposed to very high light energies?
h Iodine undergoes a redox reaction with thiosulphate ions,S2O3
2–(aq). The reaction is often used in analysis. The products areiodide ions, I–(aq), and tetrathionate ions, S4O6
2–(aq).i State the oxidation number of sulphur in:
� S2O32–
� S4O62–.
ii Write a balanced equation for the reaction of iodine withthiosulphate ions.
iii Explain why this can be regarded as a redox reaction.
Reactions of halide ions with silver nitratesolution6 Add 2 cm3 of one of the potassium halide solutions to a test tube and then
add a few drops of silver nitrate solution. (CARE Silver nitrate stains your
skin and clothes if spilled.) Observe what happens.
Repeat the process with solutions of the other two potassium halides.
7 Place the tubes and contents in daylight near a window. Observe what
happens to the contents over a period of about half an hour.
Record your observations and interpretations in a table like the one shown
below.
10509-05P064-086-GECKO.LTD 7/3/02 4:07 pm Page 70

„ Salters Advanced Chemistry 2000– see Copyright restrictions 71
This liquid is dangerous
This activity looks at how a hazardous chemical likebromine is handled on a large scale. To answer thequestions you will need to think about how choice ofconstruction materials and safety considerations arerelated to the design of the equipment which is used.
M1.4
Imagine what it must be like to be the person who is responsible for unloading
tankers full of bromine. Figure 1 shows the part of the plant at Fawley, near
Southampton, where bromine is transferred from road tankers to be used in the
manufacture of bromobutyl rubber. It should help you answer some of the
questions which follow.
concrete base
worker with protectiveclothing and breathingapparatus
water-filled tankto catch and containany bromine liquidspillages
bromine detector connectedto control room: detectorcontains calcium bromidesolution; the conductivitychanges when bromine ispresent – maximum permittedbromine concentration inair = 0.1 ppm
bromine to themanufacturingplant in plasticpiping
nitrogen to bepurified in theabsorption tower
bromine
pressurisednitrogen
lead-linedsteel
plasticpiping bromine
glass-linedsteel
Figure 1 Unloading bromine at Fawley
a i What properties of glass make it suitable for lining the brominestorage tank?
ii Why do you suppose that lead is preferred for lining the lorrytanks?
b Imagine that you are drawing up safety rules for the plant. Whatinstructions would you give for dealing with small leaks of liquidbromine? What chemical method would you choose to get rid of thespilt liquid? (You may need to refer to a textbook to answer thisquestion.)
10509-05P064-086-GECKO.LTD 7/3/02 4:07 pm Page 71

M1.4
72 „ Salters Advanced Chemistry 2000 – see Copyright restrictions
THIS LIQUID IS DANGEROUS
Questions c–g are about the absorption tower which is used to remove bromine
vapour from the nitrogen before it is released into the atmosphere. The
absorption tower is not shown on the diagram; it is described below.
Unlike most of the pipes and towers in a petrochemicals plant, the bromine
absorption tower is made of glass so that it is possible to see what is happening
inside. It is packed with short lengths of glass tubing and contains a
concentrated aqueous solution of sodium hydroxide. Waste gases, including
bromine vapour, enter roughly in the middle of the absorption tower, so the
glass packing extends above and below the point at which the gases enter.
Sodium hydroxide reacts with bromine according to the equation:
2NaOH(aq) + Br2(g) Æ NaBr(aq) + NaOBr(aq) + H
2O(l)
The sodium hydroxide solution is strongly alkaline, whereas the solution
produced from the reaction is only weakly alkaline. The sodium hydroxide is
circulated by a pump, and a flow meter checks that the pump is working.
A pH meter is one of the other detectors used to monitor the efficiency of
the absorption tower.
c What change would you expect to see in the bromine vapour after ithas entered the absorption tower?
d Suggest reasons why the tower is packed with glass tubing, and whythe column is packed below the point where nitrogen enters thetower.
e Explain why sodium hydroxide solution is suitable for absorbingbromine.
f Suggest why a pH meter is included as part of the absorption tower’smonitoring equipment.
g Draw a sketch of how you would design an absorption tower basedon the description given above. Label your sketch to indicate thechemicals, reactions, etc., where appropriate.
10509-05P064-086-GECKO.LTD 7/3/02 4:07 pm Page 72

„ Salters Advanced Chemistry 2000– see Copyright restrictions 73
The purpose of this activity is to provide you with adescription of modern chlorine manufacture. Whenyou have finished, you should be able to describe thechemistry involved in the manufacture of chlorine,and you should be aware of the technology used toapply this chemistry efficiently.
Manufacturing chlorine
M1.5
The electrolysis of brineChlorine is a vital commodity for the chemical industry. One of its uses is to
produce bromine from sea water.
Chlorine can be made by electrolysis of a concentrated solution of sodium
chloride (sometimes called brine). The other products are hydrogen and the
alkali, sodium hydroxide (often called caustic soda in the industry).
Chlorine manufacture and sodium hydroxide manufacture are directly linked,
so we often talk about the chlor-alkali industry. In the UK this is based mainly
on the underground salt deposits in Cheshire. One problem for the chlor-alkali
industry is to ensure that demand for all three of its products is kept in line with
the production rate.
There are two well-established technologies for electrolysing brine: the
mercury cell and the diaphragm cell. A third is a more modern cell, the
membrane cell, which has only been used since the early 1980s. As the
membrane cell is the fastest growing technology for the manufacture of chlorine
it has been chosen for this discussion.
a The half-equations involved in the electrolysis of sodium chloridesolution are:
at the positive electrode: 2Cl–(aq) Æ Cl2(g) + 2e–
at the negative electrode: 2H2O(l) + 2e– Æ 2OH–(aq) + H2(g)
These two gases are evolved, chlorine at the positive electrode andhydrogen at the negative electrode.
i In each case state whether the half-reaction corresponds toreduction or to oxidation.
ii Sodium ions and hydroxide ions are left in the solution. What islikely to be the impurity in this solution of sodium hydroxide?
b i Calculate the amount (in moles) of sodium hydroxide, NaOH, inone tonne of solid sodium hydroxide.
ii What amount (in moles) of chlorine, Cl2, is produced for eachmole of NaOH?
iii Calculate the mass of chlorine produced at the same time as onetonne of sodium hydroxide.
c Use a reference book (such as The Essential Chemical Industry,available from the Chemical Industry Education Centre at theUniversity of York) to find information about the uses of chlorine,sodium hydroxide and hydrogen. Display the information in the formof pie-charts. If you have access to a graphics package on acomputer, use this to draw your pie-charts.
Cell designAny electrolysis cell used to make chlorine, hydrogen and sodium hydroxide by
the electrolysis of sodium chloride solution must be designed to:
� prevent chlorine produced at the positive electrode reacting with the
hydroxide ions around the negative electrode
� minimise chloride ions diffusing into the solution around the negative
electrode which would contaminate the sodium hydroxide solution
� minimise hydroxide ions being lost by diffusion away from the negative
electrode towards the positive electrode
� prevent mixing of chlorine and hydrogen which could lead to an explosion.
10509-05P064-086-GECKO.LTD 7/3/02 4:07 pm Page 73
MANUFACTURING CHLORINEM1.5
74 „ Salters Advanced Chemistry 2000 – see Copyright restrictions
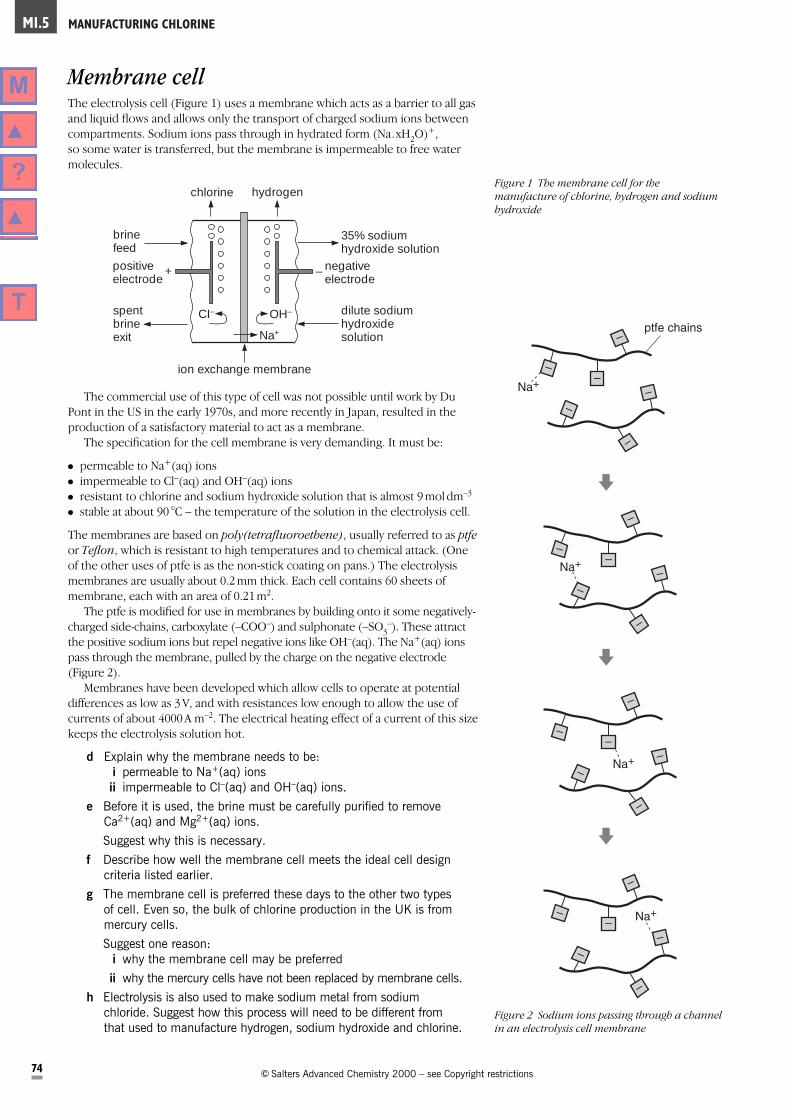
Membrane cellThe electrolysis cell (Figure 1) uses a membrane which acts as a barrier to all gas
and liquid flows and allows only the transport of charged sodium ions between
compartments. Sodium ions pass through in hydrated form (Na.xH2O)+,
so some water is transferred, but the membrane is impermeable to free water
molecules.
brinefeed
spentbrineexit
positiveelectrode
chlorine hydrogen
ion exchange membrane
CI–
+ – negativeelectrode
OH–
Na+
dilute sodiumhydroxidesolution
35% sodiumhydroxide solution
The commercial use of this type of cell was not possible until work by Du
Pont in the US in the early 1970s, and more recently in Japan, resulted in the
production of a satisfactory material to act as a membrane.
The specification for the cell membrane is very demanding. It must be:
� permeable to Na+(aq) ions� impermeable to Cl–(aq) and OH–(aq) ions� resistant to chlorine and sodium hydroxide solution that is almost 9 mol dm–3
� stable at about 90 °C – the temperature of the solution in the electrolysis cell.
The membranes are based on poly(tetrafluoroethene), usually referred to as ptfeor Teflon, which is resistant to high temperatures and to chemical attack. (One
of the other uses of ptfe is as the non-stick coating on pans.) The electrolysis
membranes are usually about 0.2 mm thick. Each cell contains 60 sheets of
membrane, each with an area of 0.21 m2.
The ptfe is modified for use in membranes by building onto it some negatively-
charged side-chains, carboxylate (–COO–) and sulphonate (–SO3–). These attract
the positive sodium ions but repel negative ions like OH–(aq). The Na+(aq) ions
pass through the membrane, pulled by the charge on the negative electrode
(Figure 2).
Membranes have been developed which allow cells to operate at potential
differences as low as 3 V, and with resistances low enough to allow the use of
currents of about 4000 A m–2. The electrical heating effect of a current of this size
keeps the electrolysis solution hot.
d Explain why the membrane needs to be:i permeable to Na+(aq) ionsii impermeable to Cl–(aq) and OH–(aq) ions.
e Before it is used, the brine must be carefully purified to removeCa2+(aq) and Mg2+(aq) ions.
Suggest why this is necessary.
f Describe how well the membrane cell meets the ideal cell designcriteria listed earlier.
g The membrane cell is preferred these days to the other two typesof cell. Even so, the bulk of chlorine production in the UK is frommercury cells.
Suggest one reason:i why the membrane cell may be preferred
ii why the mercury cells have not been replaced by membrane cells.
h Electrolysis is also used to make sodium metal from sodiumchloride. Suggest how this process will need to be different fromthat used to manufacture hydrogen, sodium hydroxide and chlorine.
Figure 1 The membrane cell for themanufacture of chlorine, hydrogen and sodiumhydroxide
Na+
Na+
Na+
Na+
ptfe chains
Figure 2 Sodium ions passing through a channelin an electrolysis cell membrane
10509-05P064-086-GECKO.LTD 7/3/02 4:07 pm Page 74

„ Salters Advanced Chemistry 2000– see Copyright restrictions 75
Mineral spotting
You are provided with a sample of rock which hasbeen taken from a mineral lode in the Pennines. Thesample has been ground to a powder to liberate thegrains of the minerals that are present. In this activityyou will look for evidence of hydrothermally depositedminerals. In a later activity you will use a similarsample which has been roasted, and extract somecopper from it.
M2.1
What you do1 Shake about 2 g of unroasted ore in a boiling tube about one-third full of
water.
2 Leave the tube until the larger particles of solid have settled to the bottom
but the smaller particles are still in suspension, then decant away the dirty
water.
3 Spread out some of the damp sediment from the bottom of the tube on a
microscope slide. Examine the grains of sediment under a microscope using
illumination from the top. Use the lowest power of magnification on the
microscope and try to identify as many minerals as possible from the list at
the end of the activity. If you have access to larger samples of minerals,
examine samples of the minerals you have identified under the microscope.
QUESTIONS
a Which minerals are present in your sample of copper ore?
b Has the process of liberation been effective? Have the mineralgrains been set free from the host rock?
c Approximately what size are the mineral grains in your sample?(Use a ruler or something similar to make an estimate.)
Requirements� unroasted sample of copper ore (2 g)
� boiling tube
� microscope slide
� microscope with table lamp to illuminate sample from above
� spatula
� samples of chalcopyrite, galena, sphalerite, quartz, fluorite, calcite,
malachite
Mineral Appearance*
chalcopyrite, CuFeS2 brassy yellow; metallic-looking
bornite, Cu5FeS4 red/brown with streaks of blue
malachite, Cu2(OH)2CO3 green; dull-stony looking
azurite, Cu3(OH)2(CO3)2 deep blue
galena, PbS blue-grey; metallic-looking
sphalerite, ZnS black-brown; metallic-looking
quartz, SiO2 white-colourless; glassy-looking, irregular shape
calcite, CaCO3 white-colourless; sometimes with streaks of colours
fluorite, CaF2 colour very variable, for example, pale yellow,pale blue; cubic shape
Data: some hydrothermal minerals
*The minerals have many different appearances. The data given here describe someof the colours in which they occur.
10509-05P064-086-GECKO.LTD 7/3/02 4:07 pm Page 75

„ Salters Advanced Chemistry 2000 – see Copyright restrictions 76
Getting at the minerals
M2.2 Roasting is a process which converts sulphideminerals into oxides. In this activity, a sample of orecontaining copper sulphide has been roasted toproduce copper oxide. You are going to investigatetwo methods of dissolving the copper compounds outof the roasted ore: (1) using acid, (2) using ammonia.Afterwards you should be able to explain why theammonia method is used for Activity M2.3.
What you do1 Put about 3 g of the roasted ore into each of two beakers. Add 10 cm3 of the
hydrochloric acid (CARE Corrosive) to one beaker and cover it loosely with
clingfilm or with a watch-glass.
2 Add 10 cm3 of the ammonia leach solution (CARE Corrosive; harmful
vapour) to the other beaker. Cover this beaker in the same way.
3 After the initial reaction has subsided, warm both beakers for 10 minutes on
the domestic food-warming tray.
QUESTIONS
a What changes occurred in the two beakers? Explain whathappened.
b Explain why using the ammonia leach provides the better way ofextracting the copper.
Requirements� 100 cm3 beakers
� clingfilm or watch-glasses
� 10 cm3 measuring cylinder
� sample of roasted copper ore (6 g)
� hydrochloric acid, 50% (10 cm3)
� ammonia leach solution
– 192 g ammonium carbonate dissolved in 1 dm3 of
4 mol dm–3 ammonia solution (10 cm3)
� domestic food-warming tray to use as a heating mat
CARE The leach solution produces an irritating vapour.Avoid inhaling the fumes. Use the solution in a fumecupboard.
ammonia solution
hydrochloric acid
HARMFUL
CARE Eye protectionmust be worn.
CORROSIVE
CORROSIVE
WEAR EYEPROTECTION
10509-05P064-086-GECKO.LTD 7/3/02 4:07 pm Page 76

„ Salters Advanced Chemistry 2000– see Copyright restrictions 77
Extracting copper
In this activity, copper compounds are dissolved out of a roasted ore sample using an ammonia leachsolution. The copper is then separated by displacing itfrom solution with zinc. The activity gives you an ideaof the quantities of waste and useful mineral in anore sample, and introduces you to some of theprocesses used at Bingham Canyon.
M2.3
ammonia solution
sodium hydroxide solution
sulphuric acid
HARMFUL
CARE The leach solution has a toxic vapour.Use a fume cupboard when instructed to do so.
propanoneHIGHLY
FLAMMABLE
CORROSIVE
CORROSIVE
CORROSIVE
WEAR EYEPROTECTION
CARE Eye protectionmust be worn.
Requirements� roasted copper ore (50 g)
� 250 cm3 conical flask
� cottonwool
� ammonia leach solution – see Activity M2.2 (100 cm3)
� 100 cm3 measuring cylinder
� domestic food-warming tray to use as a heating mat
� test-tubes
� apparatus for vacuum filtration (if available)
� 400 cm3 beaker
� 250 cm3 beaker
� sulphuric acid, 4 mol dm–3 (40 cm3)
� sodium hydroxide solution, 2 mol dm–3 (access to reagent
bottle)
� Universal Indicator paper
� zinc dust (4 g)
� propanone (20 cm3)
� watch-glass
� glass rod
� access to balance
� access to fume cupboard
� filter funnels
Additional requirements (optional)� 250 cm3 volumetric flask
� 10.0 cm3 pipette
� pipette filler
� 100 cm3 conical flask
� burette
� ammonium ethanoate, solid (10 g)
� potassium iodide, solid (5 g)
� sodium thiosulphate solution, 0.100 mol dm–3 (50 cm3)
� freshly made starch solution (5 cm3)
Flow diagramThis activity is quite long and involved. It might help you to follow the process
more clearly if you regard it as built up from the four stages which are indicated
in the flow diagram (Figure 1).
Steps 1 & 2
Ore reacts with leach solution.
Mixture is washed with water.
Steps 3–7
Filtering off solution of leached copper.
Washing to remove further traces ofleached copper.
Steps 10–15
Displacement of copper from solution using zinc.
Removal of excess zinc and collection of purecopper.
Steps 8–9
Neutralisation ofleached solution.
(Optional E1–E9Analysis of Cu2+ ionsin leached solution.)
Figure 1
10509-05P064-086-GECKO.LTD 7/3/02 4:07 pm Page 77

EXTRACTING COPPERM2.3
78 „ Salters Advanced Chemistry 2000 – see Copyright restrictions
Buchner funnel
conical flask
filter paper
vacuum pump
Figure 2 Diagram of a vacuum filtrationassembly
Leaching the ore1 Place about 50 g roasted ore in a 250 cm3 conical flask. Add 100 cm3 of the
ammonia leach solution which you used in Activity M2.2. (CARE Toxic
vapour. Do this part of the activity in a fume cupboard.) Gently swirl the
mixture. Fit a cottonwool plug loosely into the neck of the flask and place it
on the food-warming tray, in a fume cupboard, for between 30 minutes and
an hour.
2 Add 20 cm3 of water, swirl the flask and contents once more, then leave them
to stand overnight in the fume cupboard, which should be left on if
ammonia gas is still being released.
During this first stage of the extraction, Cu2+ ions in the roasted ore dissolve
into the leach solution.
a Leaching is most effective when warm solution is left in contact withthe ore for a long time. Explain why this is so.
b Explain why there is a limit to the time a mining company can spendon leaching.
Vacuum filtration3 Carefully pour off the leach solution from the solid which has settled to the
bottom of the conical flask. (CARE Toxic vapour. Do this part of the activity
in a fume cupboard.) Disturb the solid as little as possible. Add 40 cm3 of
water to the solid left over in the flask, swirl them together and leave them
to settle while you filter the decanted leach solution.
4 Assemble a vacuum filtration apparatus like the one shown in Figure 2.
There are many variations on the equipment used – your teacher may need
to show you a different assembly. Use a 250 cm3 conical flask and a coarse
filter paper.
Vacuum filtration is normally used to separate mixtures when the solid is
required and the solution is waste. Ordinary filtration is used when you want a
pure solution. In this activity it is actually the filtrate you want to collect, but the
solid contains some very fine particles which clog up the filter paper and make
ordinary filtration very slow. If available, vacuum filtration separates the solution
more quickly, but it is less efficient. Do not worry if your solution is
contaminated with a little solid: you will filter it properly at a later stage.
5 Filter the decanted leach solution, then transfer the filtrate to a 400 cm3
beaker.
6 When the liquid from the first washing of the solid is fairly clear, decant this
too and filter it using a new filter paper. Notice the colour of the filtrate and
add it to the other filtrate in the 400 cm3 beaker.
7 Add a second 40 cm3 portion of water to the solid. Shake them together and
leave them to separate. Decant the liquid and filter it using a new filter paper.
Notice the colour of the filtrate and combine it with the other filtrates.
10509-05P064-086-GECKO.LTD 7/3/02 4:07 pm Page 78

„ Salters Advanced Chemistry 2000 – see Copyright restrictions 79
M2.3EXTRACTING COPPER
c i What were the colours of the three filtrates?ii Do you think you managed to extract all the leached copper into
your 400 cm3 beaker? Explain your answer.iii Why is it not worth continuing to wash the ore with further
quantities of water?iv How could you recover the ammonia from the filtrate for re-use in
step 1?
Neutralising the leached solutionThe combined filtrate contains copper(II) ions in addition to hydroxide ions,
carbonate ions and ammonia molecules. The last three all react with sulphuric
acid.
8 Add 4 mol dm–3 sulphuric acid (CARE Corrosive), 1 cm3 at a time, to the
beaker with stirring (glass rod). During this addition there will be some
effervescence and a precipitate will form. Keep on adding the acid until the
precipitate just dissolves.
d i What gas has caused the effervescence? How could you identifythis gas?
ii What colour is the precipitate? What do you think the precipitatemight be?
iii Write equations for the reactions of sulphuric acid with:– copper(II) carbonate– copper(II) hydroxide– ammonia solution.
9 Use small quantities of sodium hydroxide solution (CARE Corrosive) and
dilute sulphuric acid (CARE Corrosive) to adjust the pH of the solution so
that it is just acidic. Filter the solution into a 250 cm3 conical flask using a
conventional filter funnel.
Finding the concentration of Cu2+(aq) ionsin solution (Optional extension)E1 Transfer the filtrate to a 250 cm3 volumetric flask, and make up to the mark
with water. Stopper the flask and invert it several times to mix the solution.
E2 Use a pipette and pipette filler to withdraw 10.0 cm3 of the solution and
transfer it to a 100 cm3 conical flask.
E3 Add a spatula measure of ammonium ethanoate to the conical flask to act as
a buffer (to keep the pH of the solution constant). Using a glass rod, test a
drop of the mixture with Universal Indicator paper: if acidic, add more
ammonium ethanoate until the mixture is nearly neutral.
E4 Add approximately 1 g (a spatula measure) of potassium iodide to the conical
flask. Swirl the contents. The solution will turn brown due to the formation
of iodine and a beige coloured precipitate of copper(I) iodide will appear.
E5 Fill a burette with 0.100 mol dm–3 sodium thiosulphate solution. Make sure
that the burette jet is also full of solution.
E6 Record the volume reading in the burette before starting the titration. Add
the sodium thiosulphate solution, in small volumes, to the contents of the
conical flask until the iodine colour is nearly dispelled. Then add 1 cm3 of
starch solution and continue the titration until the characteristic blue–black
colour just goes. This is the end-point; the mixture will be a cloudy light-
beige colour due to the presence of precipitated copper(I) iodide.
E7 Record the final burette reading and record the volume of sodium
thiosulphate solution used. This is your rough titration.
E8 Repeat the titration two more times with further 10.0 cm3 portions of the
original solution from the volumetric flask. When you approach the end-
points in these titrations, you should add the sodium thiosulphate solution
dropwise until the blue–black colour goes.
10509-05P064-086-GECKO.LTD 7/3/02 4:07 pm Page 79

EXTRACTING COPPERM2.3
80 „ Salters Advanced Chemistry 2000 – see Copyright restrictions
E9 Transfer the remaining contents of your volumetric flask to a 250 cm3 conical
flask and continue to step 10.
e i From the burette readings which agree to within 0.2 cm3, workout the average volume of sodium thiosulphate solution used in atitration.
ii Calculate the amount (in moles) of sodium thiosulphate whichjust reacts with the iodine in the titration flask. This amount isequal to the amount (in moles) of Cu2+(aq) ions in the titrationflask.
Your teacher may discuss the redox chemistry involved in thistitration, which explains why the amount (in moles) of Cu2+(aq) ionsis the same as the amount (in moles) of sodium thiosulphate used.iii Calculate the amount (in moles) of Cu2+(aq) ions extracted in this
experiment.iv Calculate the mass of copper extracted from the roasted ore. What
appears to be the percentage by mass of copper in the roasted oresample? (See question g.)
Producing and weighing the copper10 Add zinc dust to the solution in the flask in small quantities with swirling
until it is no longer blue and all the copper has been displaced from the
solution.
11 The solid you obtain will contain unreacted zinc. Remove this by adding
4 mol dm–3 sulphuric acid (CARE Corrosive), 1 cm3 at a time with swirling,
until there is no further effervescence. (You may need to leave this overnight
to ensure complete reaction.)
12 Filter off the displaced copper using vacuum filtration.
13 Wash the copper twice with 10 cm3 portions of distilled water and twice with
10 cm3 portions of propanone (CARE Highly flammable). On each occasion
turn off the vacuum to give the liquid time to soak into the copper.
14 Allow air to be sucked through the copper to carry away any propanone as
vapour; then spread out the copper on a weighed watch-glass and leave it to
dry thoroughly.
15 Record the mass of the dry copper you have produced.
f If you assume that you have extracted all the copper that waspresent, what appears to be the percentage by mass of copper in theore sample you used?
Evaluation of your results and procedures(Optional extension)
g If you did the optional extension, compare your answer to f(remember to allow for the volume of solution you removed to do thetitration!) with that of e iv. Which method do you think will haveproduced the more accurate result? Explain your answer.
h In practice you have not extracted all the copper in the sample. What do you consider to be the main source of loss of copper in your process?
10509-05P064-086-GECKO.LTD 7/3/02 4:07 pm Page 80

„ Salters Advanced Chemistry 2000– see Copyright restrictions 81
Titration rough 1 2 3 4 5
final burette
reading
initial burette
reading
titre
Average titre = cm3
Finding out how muchacid there is in a solution
M2.4 In this activity you use the technique of titration toanalyse a solution of dilute sulphuric acid, and youcalculate the concentration of acid it contains. Thisconcentration is considerably greater than theconcentration of acid in ‘acid rain’, but the samemethod of analysis could be used to determineaccurate values of pH for ‘acid rain’ samples. Youmay find it helpful to look back at your notes onActivity EL2.1 in which you first performed a titration.
The questions at the end of this activity draw yourattention to some of the environmental consequencesof the production of sulphur dioxide from smelting.
What you do1 Use a pipette and pipette filler to transfer 10.0 cm3 of the ‘acid rain’ sample
to a 100 cm3 conical flask. Add 5 drops of Phenolphthalein indicator.
2 Fill a burette with 0.01 mol dm–3 sodium hydroxide solution. Make sure that
the burette jet is also full of solution.
3 Record the volume reading in the burette before starting the titration. Then
add sodium hydroxide solution, in small volumes, to the ‘acid rain’ solution
in the conical flask. Swirl the flask after each addition.
4 Phenolphthalein indicator is colourless in acidic solution but pink in alkaline
solution. Run in the small volumes of sodium hydroxide solution until you
first observe the appearance of a permanent pink colour in the titration
mixture. This is the end-point.
5 Record the final burette reading and calculate the volume of sodium
hydroxide solution you have used.
6 Your first attempt will be a rough titration; you will have gone beyond the
end-point and added more sodium hydroxide than is needed to react with all
the acid in the flask. You should, however, now have a general idea of what
the end-point is. Do several more titrations until you record three volumes
that agree to within 0.1cm3. When you get near the end-points of these
titrations, you should add the sodium hydroxide carefully, adding only one
drop of solution at a time until the permanent pink colour is produced.
Record your results in a table like the one below.
Requirements� solution of ‘acid rain’ (dilute sulphuric acid) (50 cm3)
� sodium hydroxide solution, 0.01 mol dm–3 (100 cm3)
� 100 cm3 conical flask
� 10 cm3 pipette
� pipette filler
� burette
� Phenolphthalein indicator solution
CARE Eye protectionmust be worn.
WEAR EYEPROTECTION
HIGHLYFLAMMABLE
Phenolphthalein indicator
10509-05P064-086-GECKO.LTD 7/3/02 4:07 pm Page 81

FINDING OUT HOW MUCH ACID THERE IS IN A SOLUTIONM2.4
82 „ Salters Advanced Chemistry 2000 – see Copyright restrictions
Working out the acid concentration7 From the titres which agree to within 0.1 cm3, work out the average volume
of sodium hydroxide solution used in the titration.
8 Combine this average volume with the concentration of the sodium
hydroxide solution to calculate the amount (in moles) of sodium hydroxide,
NaOH, which just reacts with the acid in the titration flask.
9 The acid in the ‘acid rain sample’ is sulphuric acid. The equation for the
reaction in this titration is therefore:
H2SO
4(aq) + 2NaOH(aq) Æ Na
2SO
4(aq) + 2H
2O(l)
Calculate the amount (in moles) of sulphuric acid, H2SO
4, in the flask in each
titration.
10 The titration flask contained 10.0 cm3 of sulphuric acid solution. Calculate
the amount (in moles) of acid which would be contained in 1 dm3 (1000 cm3)
of solution. Write down the concentration of the sulphuric acid in units of
mol dm–3.
Evaluating your results and proceduresa What is the percentage error for each of the measurements you
made? Look at your notes on Activity EL2.1 if you need help withthis.
b Which is the most important of these errors? Check that the numberof significant figures you used in your answer to step 10 is consistentwith the least precise of the measurements you made.
c Explain how aspects of your procedure were designed to ensure thatyour results were as accurate and reliable as possible.
Sulphur dioxide from smeltingd The equation for smelting chalcopyrite at Bingham Canyon is:
4CuFeS2 + 10 �� O2 Æ 4Cu + 2FeO + Fe2O3 + 8SO2
i What amount (in moles) of sulphur dioxide, SO2, is produced foreach mole of copper, Cu?
ii What is the relationship between the masses of 1mol of SO2 and1mol of Cu? (A r: O, 16; S, 32; Cu, 64)
iii How many tonnes of sulphur dioxide are produced per tonne ofcopper?
e 200 000 tonnes of rock with an average copper content of 0.5% bymass are mined every day at Bingham Canyon. In the US themaximum permissible concentration of sulphur dioxide in the air inany one day is 0.365 tonnes km–3.
i How many tonnes of sulphur dioxide are produced daily at theBingham Canyon smelter?
ii What volume of air would become contaminated each day to themaximum permissible level if this sulphur dioxide were allowed toescape? Perhaps you can now see why the sulphur dioxide isconverted into sulphuric acid, even though the acid is worth lessthan the cost of extracting the sulphur dioxide.
10509-05P064-086-GECKO.LTD 7/3/02 4:07 pm Page 82

„ Salters Advanced Chemistry 2000– see Copyright restrictions 83
The philosopher’smicrobe?
In the Middle Ages, alchemists dreamed of the‘philosopher’s stone’, a substance which would be ableto convert ordinary metals, like lead, into gold. Thisactivity tells you about a technique which almost turnsordinary rock into gold. It illustrates an applicationof bacterial leaching, and gives you an opportunity topractise and develop your reading andcommunication skills.
M2.5
Read the report that follows, which is based on an article written by Dr Jack
Barrett, formerly of the Department of Chemistry at King’s College, London
(KCL), then answer the questions below.
(Arseno-pyrites is FeAsS. The oxides of arsenic, As2O
3and As
2O
5, are volatile
and toxic. Their emission is very strictly controlled.)
To get at the gold it is important to break down the pyrites.
Answers lie in the spoilSalmonella and Listeria notwithstanding, bacteria can be good for you, especiallyif you own a goldmine with ore containing pyrites in a country which objects tosulphur and arsenic being poured into its atmosphere.
Researchers at King’s College, London, have isolated and harnessed a uniquecommunity of microbes that has been working in Australia in the first major,commercially viable application of a technology known for a quarter of a centurybut yet to realise its full potential: bacterial leaching.
The biotechnology of using microbes to release residual metal from low-grade ores,whose treatment by conventional physical and chemical processes entailsunacceptably high levels of pollution, has become routine in American coppermining. There Thiobacillus ferro-oxidans happily chews its way through spoil-heaps that were once useless. T. ferro-oxidans produces acid which helps thebacteria to liberate soluble copper compounds. When scrap-iron is added to theresulting solution metallic copper is produced – as satisfying a piece of internaleconomy as one is likely to come across in industry.
T. ferro-oxidans also uses its bizarre metabolism to turn pyrites (iron sulphides)and arseno-pyrites into iron oxides. When it has done that, any metal (such asgold) previously encapsulated in the sulphide can be recovered by the applicationof chemicals in the normal way.
Gold may be found mixed in with oxide or sulphide ores of other metals. Theproblem is – how to get the gold out? If the gold occurs with oxide ores it isnormally extracted by treating them with cyanide. But this isn’t much good forsulphide ores like pyrites because cyanide only gets at as little as 10% of theencapsulated gold. Bacteria can expose 85–100% of the latter to extraction bycyanide.
A process known as roasting can also turn pyrites into oxide – but only at the costof sending noxious sulphur dioxide and arsenious oxide up the chimney inincreasingly unacceptable quantities. Nearly all mining countries now restrictroasting so severely that it is no longer commercially viable.
Biotechnology is already being tried in the gold-mining industry, but so far withmostly equivocal results; subsidiary equipment and procedures may beinadequate, tending to give the new technology as a whole a bad name. Theprincipal problem with T. ferro-oxidans is that it is fussy about its ambienttemperature, preferring about 30°C for optimum performance.
Unfortunately, many mining regions are naturally hotter than that, to say nothingof the heat generated by the process itself: the cost of reducing and holding thetemperature to the required level can make the process forbiddingly expensive.
The KCL team believe their new bacterial culture has the edge because it willcheerfully work in temperatures between 30 and 50°C degrees, eliminating theneed for cooling. On this basis, says Dr Jack Barrett, inorganic chemist on theteam, the KCL process takes considerably less capital as well as having lowerrunning costs than other methods.
The KCL researchers know little enough about their microscopic prodigy beyondwhat it does. It eats pyrites as if they were going out of fashion and converts theminto oxides (biooxidation) so that the previously encapsulated gold can be extractedconveniently by dissolution in cyanide, followed by recovery through precipitation.
10509-05P064-086-GECKO.LTD 7/3/02 4:07 pm Page 83

THE PHILOSOPHER’S MICROBE?M2.5
84 „ Salters Advanced Chemistry 2000 – see Copyright restrictions
a Suggest a reason why the gold is encapsulated in the veins of pyritesand not spread out in the rock.
b What is the major obstacle to using bacterial leaching in the metalextraction industry?
c List three chemicals needed by T. ferro-oxidans besides a supply ofpyrites.
d Explain why the use of T. ferro-oxidans poses no threat to life or toother organic matter.
e Explain why using biotechnology of this kind may give ‘new life to oldmines’.
What the microbes need is an environment roughly as acidic as battery-acid,access to oxygen and carbon dioxide from the air, and the right temperature. Theirmajor peculiarity is that they need no organic nourishment of any kind but liveexclusively on inorganic matter. Alchemists would clearly have done better to lookfor a philosopher’s microbe.
The organisms were isolated from water samples found by KCL microbiologistProfessor Robert Poole at an Australian mine in 1986. The resulting mixed cultureappears to combine the best qualities of its components, most notably the broadtemperature-tolerance which Dr Barrett believes to be its major selling point.
The KCL team got into the gold-recovery business by accident. Dr Barrett’s wifeEileen, who works for the Mineral Industry Manpower and Careers Unit, asked himto find out whether gold could be extracted from pyrites from an old Welsh mine.He made the research a project for his third-year students, involving a series ofchemical experiments. It was only at the end of the programme that his inorganicchemist colleague, Dr Martin Hughes, suggested the microbiological approach –with encouraging results.
‘What happened next is only too familiar,’ said Barrett. ‘We could not find anycash in Britain to exploit the discovery, but fortunately we eventually got a positiveresponse in Australia.’ He believes that he and his colleagues collided not onlywith the customary conservatism of British venture-capital, but also asubconscious prejudice against using organisms in industrial processes.
‘People must wonder what would happen if they escaped, as in some old horrorfilm, or perhaps they think such bacteria are infectious. But they can’t “escape”and they aren’t interested in organic matter,’ he says.
An Australian mining firm funded a pilot plant which worked successfully. A full-scale plant was built in Western Australia and opened in 1994 treating up to 5tonnes of gold concentrate per hour. In 1998 the Australian and Britishgovernments decided to sell off major proportions of their gold reserves, causingthe gold price to fall well below the $300 per ounce level and making thetreatment of refractory ores uneconomic. The bacterial plant was closed and nofurther plants have been opened.
The company is now using the bacterial technology to treat copper and nickelconcentrates in a plant in Mexico and expects expansion in the extraction of basemetals while awaiting better times which would allow a return to gold extraction.
The implications of the technology once it is established are enormous. Unlessgeological upheavals have supervened, oxide ores are found nearest the surface,because that is where the oxygen is, and sulphide ores are underneath. Thedifficulties of extracting gold from the latter have commonly meant abandoningmining when the sulphide level is reached.
After munching through the arseno-pyrites the KCL culture leaves ferric arsenatebehind – an insoluble, stable and environmentally neutral residue which piles upjust as iron oxide does at the end of the conventional gold-extraction process.
10509-05P064-086-GECKO.LTD 7/3/02 4:07 pm Page 84

„ Salters Advanced Chemistry 2000– see Copyright restrictions 85
QUESTIONS
a Carbon dioxide has a simple molecular structure – covalentlybonded molecules with weak intermolecular forces between them.Diamond has a giant covalent structure – a network of covalentbonds throughout.
What type of structure has:i carbon monoxide?ii silica?iii hexane?
b Explain why giant covalent (network) structures have very highmelting points but molecular structures have low ones.
c If carbon dioxide is cooled below its melting point it solidifies toproduce a white solid – dry ice. This can be cut with a steel knifewhereas diamond and silica cannot. Give a step by step explanationof these observations suitable for a student who has not studiedchemistry beyond GCSE.
This activity helps you to find out about the verydifferent properties of substances which have covalentbonds.
What you doConstruct a table like the one below, but leave about 5 cm depth for each
substance. Fill in your table by consulting textbooks, databooks, CD ROMs,
the Internet, Intranet, etc. List the sources that you consulted and give a
detailed reference (author, year of publication, title, publisher, page
number) for each diagram.
Molecules and networks
M2.6
Substance Formula Properties Diagram of structure
melting boiling solubility point/K point/K in water
carbon monoxide
carbon dioxide
hexane
diamond
silica(silicon(IV) oxide)
10509-05P064-086-GECKO.LTD 7/3/02 4:07 pm Page 85

„ Salters Advanced Chemistry 2000 – see Copyright restrictions 86
Check your notes onFrom Minerals toElements
This activity helps you get your notes in order at theend of this unit.
M3
Use this list as the basis of a summary of the unit by
collecting together the related points and arranging them in
groups. Check that your notes cover the points and are
organised in appropriate ways. Remember that you will be
coming back to many of the ideas in later units.
Most of the points are covered in the Chemical Ideas,
with supporting information in the Storyline or Activities.
However, if the main source of information is the Storyline
or an Activity, this is indicated.
� Calculations involving concentrations of solutions.
� The classification of elements into s, p and d blocks.
� The electronic configuration of atoms from hydrogen to
krypton in terms of main energy levels and s, p and d
atomic orbitals.
� The following physical properties of the halogens:
appearance and state at room temperature, volatility, and
solubility in water and organic solvents.
� Assigning oxidation states to the elements in a compound
and the use of oxidation states to decide which species
have been oxidised and which reduced in a redox reaction.
� Redox reactions of s- and p-block elements in terms of
electron transfer, using half-equations to represent the
oxidation and reduction reactions.
� The redox changes which take place when chlorine,
bromine and iodine react with other halide ions and the
relative reactivity of the halogens.
� The redox changes occurring in the extraction of bromine
from sea water (Storyline M1; Activity M1.2)
� The reaction between halide ions and silver ions.
� How a hazardous substance like bromine is handled and
transported (Storyline M1; Activity M1.4).
� The economic importance of bromine and chlorine and
their compounds (Storyline M1).
� The structure of an ionic lattice, eg sodium chloride.
� Writing ionic equations to represent precipitation
reactions and other reactions involving ionic compounds.
� The hydration of ions in aqueous solution.
� The major stages in the extraction of a pure metal from its
ore (Storyline M2).
� The environmental implications of mineral extraction
(Storyline M2).
� Flow diagrams for chemical processes (Storyline in
general).
� Recognising from the balanced equation for a reaction
whether it is an acid–base, redox or precipitation reaction.
� Identification of the proton donor and proton acceptor in
an acid–base reaction.
� The procedure for carrying out an acid–alkali titration and
how to work out the results (Activity M2.4).
� The procedure for vacuum filtration (Activity M2.3).
� Examples of giant covalent (network) structures, such as
diamond and silicon(IV) oxide (Activity M2.6).
� Interpreting differences in the physical properties of CO2
and SiO2
in terms of their different structures (ActivityM2.6).
10509-05P064-086-GECKO.LTD 7/3/02 4:07 pm Page 86

„ Salters Advanced Chemistry 2000 – see Copyright restrictions 89
What substances can actas sunscreens?
In this activity, you will use information about theabsorption of visible and ultraviolet radiation bysome substances to decide how they will affectradiation from the Sun.
A2.1
Look at Figure 1, which shows the portion of the Sun’s radiation that reaches
us on Earth, and its effect on skin.
Figure 1 The portion of the Sun’s radiation that reaches the Earth and its effect on theskin (from The Atmosphere, Storyline A2)
Each of the substances listed in Table 1 absorbs light in the visible–ultraviolet
region. The absorption spectrum of each substance shows the intensity of
radiation absorbed at each frequency, and may consist of either a number of
sharp peaks or a broad band of absorption called a continuum. The figures in
Table 1 show the lowest frequency (or frequency range) at which each substance
absorbs strongly.
Substance Absorption frequency range/1014Hz
water from 16.2glass from 9.4glyceryl trioleate 6.8–10.7(a major constituent of olive oil)4-aminobenzoic acid 8.8–12.2
Where possible, mark on Figure 1 the start of the absorption range of the
substances in the table above. (Some of them may lie outside the frequency
range shown in the diagram.)
What are your conclusions concerning:
a whether swimming can protect you from sunburn?b the chance of getting tanned sitting in a south-facing window on a
sunny day?c the use of olive oil as a sunscreen?d the use of 4-aminobenzoic acid as a sunscreen?
Table 1 Ultraviolet absorption of somesubstances
10509-07P089-115-GECKO.LTD 7/3/02 4:09 pm Page 89

„ Salters Advanced Chemistry 2000 – see Copyright restrictions 90
Investigating sunscreens
This activity will help you develop the important skillof designing and carrying out a practicalinvestigation.
A2.2
What you doThe aim of this activity is to find out about the effectiveness of different
sunscreens.
The design of the experiment is left to you. You will need to think about the
items in the requirement list, and decide how you are going to test the
sunscreens so that you can make fair comparisons. You may decide on
modifications after your first try which lead to improvements in your method.
Prepare a Risk Assessment for your planned activity and a list of sources
you have used in developing your plan and your Risk Assessment.
Do not start your investigation until your plan has been checked by your
teacher.
The following points may help you.
1 The best source of ultraviolet radiation of the right frequencies is of course
the Sun itself. A domestic sun-tan lamp is also good, but does not emit
frequencies above about 9.3 ¥ 1014 Hz. A mid-range ultraviolet lamp from the
school science department will emit frequencies in the 9.3 ¥ 1014 Hz – 10.7 ¥1014 Hz region, where the skin is very sensitive.
2 Most ultraviolet radiation will not pass through glass. It passes quite well
through perspex, and very well through clingfilm.
3 For detecting the ultraviolet radiation, there are a number of possibilities:
a Ultraviolet sensitive paper, which turns blue in the presence of natural
ultraviolet radiation. (Incidentally, this paper is used to make security
passes to check whether the wearer has left the building. You can use it
to test the effectiveness of glass as a sunscreen by sticking pieces inside
and outside a window.)
b A white cloth that has been washed in detergent. (Most machine
detergents contain fluorescent compounds. You can see the effect under
some disco lights.) The cloth will give a bright fluorescence with
ultraviolet light.
c Tonic water fluoresces in ultraviolet light.
d Some photocopying paper fluoresces.
Requirements� a light source which provides radiation of about the
same frequency as the ultraviolet light that causes
sunburn and skin cancer
� a means of supporting the sunscreen so that light can be
directed at it and possibly pass through it
� a way of detecting the ultraviolet light
� a variety of sunscreen products with different screening
factors
ULTRA-VIOLETRADIATION
CARE If you are using anykind of ultraviolet lamp,
remember that ultravioletradiation is hazardous.
Follow the recommendedprecautions concerning eye
protection.
10509-07P089-115-GECKO.LTD 7/3/02 4:09 pm Page 90

„ Salters Advanced Chemistry 2000 – see Copyright restrictions 91
What is the effect of theatmosphere on the Sun’sradiation?
A2.3 In this activity, you will use information about theultraviolet absorption of some atmospheric gases toinvestigate their effect on radiation from the Sun.
Figure 1 shows the spectrum of the Sun’s radiation in space, that is before it has
passed through the Earth’s atmosphere. It shows the energy emitted at each
wavelength (and frequency).
Figure 1 The spectrum of solar radiation inspace
Table 1 Ultraviolet absorption of someatmospheric gases1 On Figure 1 shade the area of the solar spectrum which corresponds to
ultraviolet radiation.
2 List the gases from Table 1 that absorb in this region, with the relevant
absorption ranges. Mark and label these regions on Figure 1 using a double-
headed arrow ´.
a Comment on the effect of each of the gases in the atmosphere onsolar radiation. You should consider both the absorptioncharacteristics and the concentrations of the gases in the atmosphere.
b How would you expect the Sun’s spectrum as seen on the surface ofthe Earth to differ from that seen in space?
Gas Absorption frequency range/1014Hz Absorption wavelength range/nm
oxygen 12.4–17.1 (very weak) and above 17.1 (strong) 242–175 (very weak) and below 175 (strong)
nitrogen above 50.0 below 60
water 16.2–20.6 185–145
carbon dioxide 17.6–23.9 (weak) and above 25.6 170–125 (weak) and below 117
ozone 10.1–14.0 296–214
methane above 20.8 below 144
sulphur dioxide 9.1–12.5 (weak) and above 13.8 330–240 (weak) and below 217
Table 1 shows the frequency and wavelength ranges over which some
common atmospheric gases absorb ultraviolet radiation. Where only one figure
is given, it represents the low frequency (high wavelength) limit at which
absorption begins.
You will find it easier to use the wavelength ranges rather than the frequency
ranges. This is because the horizontal axis of the spectrum is plotted using a
linear wavelength scale, whereas the frequency is non-linear.
10509-07P089-115-GECKO.LTD 7/3/02 4:09 pm Page 91

„ Salters Advanced Chemistry 2000 – see Copyright restrictions 92
More about ozone
In this activity, you can find out more about thebonding in ozone and the stability of ozone relative tooxygen. You can remind yourself about the use ofbond enthalpies to calculate enthalpy changes.
A3.1
Ozone is a polymorph (or allotrope) of oxygen. Its formula is O3
and it is called
trioxygen. It is a pungent-smelling, pale blue gas which condenses at low
temperatures to give a dark blue liquid. It is much less abundant in the
atmosphere than the other polymorph, dioxygen, O2.
Bonding in ozoneThe table shows three substances which contain oxygen–oxygen bonds.
Substance Shape of molecule Length of O–O Bond enthalpy ofbond/nm O–O bond /kJ mol–1
dioxygen, O2(double bond)
hydrogen peroxide, H2O2(single bond)
ozone, O3
a Use the Data Sheets to fill in the bond length and bond enthalpy ofthe oxygen–oxygen bond in each compound.
b What do these figures tell you about the nature of the bonding inozone?
EnergeticsThe overall equation for the formation of ozone from dioxygen is:
1 �� O2(g) Æ O
3(g)
c Work out the standard enthalpy change of formation of ozone by thefollowing steps.
i Draw a Hess cycle to show the formation of ozone from dioxygenvia three atoms of oxygen in the gaseous state.
ii Use the bond enthalpies in your table to work out a value for thestandard enthalpy change of formation of ozone. (Remember thatthe bond enthalpy is the energy needed to break one mole ofbonds, see Chemical Ideas 4.2.)
d Which is the more energetically stable allotrope of oxygen, O2 or O3?Explain your answer.
e Ozone is described as an endothermic substance. What does thismean?
f Would you expect ozone to be more or less reactive than dioxygen?Explain your answer.
O O
O O
H
H
O
O
O
10509-07P089-115-GECKO.LTD 7/3/02 4:09 pm Page 92

„ Salters Advanced Chemistry 2000 – see Copyright restrictions 93
The photodissociation ofbromine (Optionalteacher demonstration)
A3.2 In this activity you will investigate the effect of light onthe reaction between bromine and hexane. You willlearn how to handle bromine safely.
What you do1 Put 2 cm3 of hexane in each of three test-tubes. (CARE Hexane is highly
flammable and harmful. Avoid skin contact and do not breathe the vapour.)
2 Add one drop of bromine (not bromine water) to each tube. (CAREBromine is corrosive and toxic. Wear eye protection and gloves. Work in a
fume cupboard when adding the bromine.)
3 Wrap aluminium foil around two of the tubes as shown in Figure 1. Stand the
three tubes side by side in a test-tube rack.
4 Leave the rack in bright sunlight or next to a bright light source for
5–10 minutes, then examine the appearance of each tube. Cautiously blow
across the top of each tube. Test any gases given off with moist indicator
paper, and by holding a drop of ammonia solution on a glass rod at the
mouth of the test-tube.
Requirements� hexane (6 cm3)
� bromine (3 drops)
� aluminium foil
� test-tubes and rack
� Universal Indicator paper
� glass rod
� concentrated ammonia solution
� light source (sunlight is best, but you could use a strong
lamp such as a fluorescent light tube – a microscope lamp
or an overhead projector lamp will work reasonably well)
CARE Bromine liquid should always be used in a fumecupboard. It produces an irritant vapour which is very toxic.The liquid causes severe burns. A beaker of sodiumthiosulphate solution (approximately 1 mol dm–3) should beavailable to treat spillages.
bromine
concentrated ammonia solution
hexane
TOXIC
QUESTIONS
a What evidence is there thatbromine undergoesphotodissociation?
b Look up the values for Br–Br andC–H bond enthalpies. Rememberthat bond enthalpies are given permole of bonds. Calculate theenthalpy change when:
i one Br–Br bond is brokenii one C–H bond is broken.
Use E = hn to calculate thefrequencies of photons of radiationcorresponding to each of theseenergies. Which bond is mostlikely to be broken by absorptionof sunlight?
c What has the bromine reactedwith?
d What is the gaseous product thatis formed?
e Write an equation, with statesymbols, for the reaction of thisgas with ammonia.
Tube 1 Tube 2 Tube 3
uncovered completelycovered in foil
only the liquidcovered in foil
Figure 1
CORROSIVE
CORROSIVE
HIGHLYFLAMMABLE
WEAR EYEPROTECTION
WEARPROTECTIVE
GLOVES
CARE Eye protection andgloves must be worn.
HARMFUL
10509-07P089-115-GECKO.LTD 7/3/02 4:09 pm Page 93

© Salters Advanced Chemistry 2000 – see Copyright restrictions 94
Investigating the reaction betweenbromine andcyclohexane
In this activity you will carry out a quantitativeinvestigation of the reaction between bromineradicals and cyclohexane, and determine the amountof one of the products formed. This will give you anopportunity to improve your skills at carrying out anaccurate titration, and to use the results of a titrationto calculate the information needed.
A3.3
Outline of the experimentBromine is added to a mixture of cyclohexane and water, and the mixture isplaced in a bright light and shaken from time to time. Hydrogen bromide (HBr)is formed, and passes into the water layer.
When all the bromine has reacted and the red colour has gone, the mixture istitrated with sodium hydroxide. HBr(aq) reacts with the sodium hydroxide, andfrom the titration result the amount of HBr formed per mole of bromine can becalculated.
What you do1 Put 35 cm3 of cyclohexane and 15 cm3 of distilled water in the bottle and
stopper it firmly. (CARE Cyclohexane is highly flammable. Avoid skincontact and do not breathe the vapour.)
2 Make sure the bottle is dry on the outside, then find the mass of the bottle,stopper and contents.
3 Add approximately 1 g (about 0.3 cm3) of bromine to the bottle. (CAREBromine is corrosive and toxic. Wear eye protection and gloves. Work in afume cupboard when adding the bromine. Do not remove the stopper fromthe bottle after the bromine has been added.)
4 Find the mass of the bottle again, in order to find the exact mass of bromineadded.
5 Shake the bottle. Place it near a light source or on a window sill. Shake thebottle every 2 minutes until the colour has disappeared.
Requirements� reagent bottle (about 250 cm3 capacity) with good-fitting
stopper� cyclohexane (35 cm3)� protective gloves� distilled water� bromine (1 g)� marked pipette for adding bromine� sodium hydroxide solution, 0.200 mol dm–3 (100 cm3)� Phenolphthalein indicator solution� burette and stand� wash bottle with distilled water� access to a balance� light source (sunlight is best, but you could use a strong
lamp such as a fluorescent light tube – a microscope lampor an overhead projector lamp will work reasonably well)
CARE Bromine liquid should always be used in a fumecupboard. It produces an irritant vapour which is very toxic.The liquid causes severe burns. A beaker of sodiumthiosulphate solution (approximately 1 mol dm–3) should beavailable to treat spillages.
bromine
dilute sodium hydroxidesolution
cyclohexane
Phenolphthalein indicatorsolution
TOXIC CORROSIVE
IRRITANT
HIGHLYFLAMMABLE
HIGHLYFLAMMABLE
WEAR EYEPROTECTION
WEARPROTECTIVE
GLOVES
CARE Eye protection andgloves must be worn.

„ Salters Advanced Chemistry 2000 – see Copyright restrictions 95
A3.3INVESTIGATING THE REACTION BETWEEN BROMINE AND CYCLOHEXANE
6 Fill a clean burette with 0.200 mol dm–3 sodium hydroxide solution. (CARESodium hydroxide of this concentration is an irritant.)
7 Give the stoppered bottle a final shake, remove the stopper and rinse it with
distilled water into the bottle so no liquid is lost.
8 Add 10 drops of Phenolphthalein to the bottle. Titrate the contents of the
bottle with 0.200 mol dm–3 sodium hydroxide solution to a faint pink end-
point. The end-point is not very stable and the colour tends to fade. Titrate
to the first overall pink colour. (CARE The product of the reaction is
flammable. Its vapours are harmful and may irritate the eyes and nose. Avoid
breathing the vapours.)
9 When you have finished, the reaction mixture must be poured into a residue
bottle in a fume cupboard.
Using the resultsRecord your results in a suitable table, then answer the following questions.
a What mass of bromine did you use?
b What amount in moles of bromine, Br2, did you use?
c What volume of sodium hydroxide solution was needed in thetitration?
d What amount in moles of sodium hydroxide, NaOH, was used in thetitration?
e Write an equation for the reaction between sodium hydroxide andhydrogen bromide.
f What amount in moles of hydrogen bromide was produced in thereaction between bromine and hexane?
g What amount in moles of hydrogen bromide would be produced fromthe reaction of 1 mole of bromine, Br2?
h Write a balanced equation for the reaction between hexane andbromine to produce bromohexane, C6H11Br.
i What general type of reaction is this?
j Why was water added to the reaction mixture, even though it is not areactant?
k Bromohexane is formed in this reaction. In which of the two layerswould it be found?
Evaluating your results and proceduresl For which of your measurements is the level of precision you could
achieve important? Work out the percentage error for each of thesemeasurements.
m Compare the relative importance of each of these errors.
n Identify the stages in your procedure which could have led to errors.
o How do you think the sources of error or uncertainty that you haveidentified in l and n affect the accuracy and reliability of your overallresult?
10509-07P089-115-GECKO.LTD 7/3/02 4:09 pm Page 95

„ Salters Advanced Chemistry 2000 – see Copyright restrictions 96
This part of the activity will allow you to practise anddevelop your skills in experimental design. You areasked to plan an experiment to compare the reactivityof some halogenoalkanes.
Some background informationHalogenoalkanes have the general formula RHal, where R is an alkyl group and
Hal is a halogen atom. In this experiment you will investigate how the reactivity
of halogenoalkanes depends on the nature of the halogen atom, Hal.
You will compare the rates of hydrolysis (reaction with water) of
1-chlorobutane, 1-bromobutane and 1-iodobutane.
CH3CH
2CH
2CH
2Hal + H
2O Æ CH
3CH
2CH
2CH
2OH + H+ + Hal–
The rate of the reaction is followed by carrying it out in the presence of silver
ions, Ag+(aq). Silver ions react with halide ions to form a precipitate of silver
halide:
Ag+(aq) + Hal–(aq) Æ AgHal(s)
Halogenoalkanes are covalently bonded, so they give no precipitate with silver
ions. But as the reaction proceeds and halide ions are produced, a white or
yellow precipitate of silver halide gradually appears.
Halogenoalkanes are insoluble in water, so the reaction is carried out in the
presence of ethanol, which acts as a mutual solvent for the halogenoalkane, the
water and the silver ions.
PlanningWrite a plan for how you will compare the rate of hydrolysis of a few drops of
the three halogenoalkanes by warm water. Your plan should include the
following:
� the apparatus to be used� the quantities of materials to be used� details of what you expect to do in the form of a set of instructions that could
be followed by another student without any further guidance� a Risk Assessment which identifies the hazards associated with each
substance you will use and each operation you will carry out, and what steps
you will take to minimise the hazards� details of the sources you have used in devising your plan and your Risk
Assessment.
Do not carry out your plan until it has been checked by your teacher.
How do halogenoalkanesdiffer in reactivity?
A4.1a
10509-07P089-115-GECKO.LTD 7/3/02 4:09 pm Page 96

© Salters Advanced Chemistry 2000 – see Copyright restrictions 97
How do halogenoalkanesdiffer in reactivity?
A4.1b In this part of the activity, you will carry out theexperiment to compare the reactivity of somehalogenoalkanes. From your results, you should beable to see why Midgley was led to look at CFCs for arefrigerant gas.
Some background informationHalogenoalkanes have the general formula RHal, where R is an alkyl group andHal is a halogen atom. In this experiment you will investigate how the reactivityof halogenoalkanes depends on the nature of the halogen atom, Hal.
You will compare the rates of hydrolysis (reaction with water) of 1-chlorobutane, 1-bromobutane and 1-iodobutane.
CH3CH2CH2CH2Hal + H2O → CH3CH2CH2CH2OH + H+ + Hal–
The rate of the reaction is followed by carrying it out in the presence of silverions, Ag+(aq). Silver ions react with halide ions to form a precipitate of silver halide:
Ag+(aq) + Hal–(aq) → AgHal(s)
Halogenoalkanes are covalently bonded, so they give no precipitate with silverions. But as the reaction proceeds and halide ions are produced, a white oryellow precipitate of silver halide gradually appears.
Halogenoalkanes are insoluble in water, so the reaction is carried out in thepresence of ethanol, which acts as a mutual solvent for the halogenoalkane, thewater and the silver ions.
What you do1 Heat some water to about 50 °C in a beaker. Extinguish the flame.
(Alternatively, the water can be heated safely using an electric kettle.)2 Set up three test-tubes labelled 1, 2, 3. Place 1 cm3 of ethanol into each. (CARE
Ethanol is highly flammable. Keep bottles stoppered when not in use and wellaway from naked flames. Avoid skin contact and do not breathe the vapour.)
3 Add 2 drops of chlorobutane to tube 1, 2 drops of bromobutane to tube 2,and 2 drops of iodobutane to tube 3. (CARE Halogenoalkanes areflammable. Their vapours are irritating and harmful. Avoid inhaling them.)
4 Stand the tubes in the beaker of water at 50 °C. Put three test-tubes, eachcontaining 1 cm3 of 0.01 mol dm–3 silver nitrate solution, in the same beaker.Leave the tubes for about 10 minutes so that they reach the temperature ofthe bath.
5 Now add 1 cm3 of the warm silver nitrate solution to each of tubes 1, 2 and3, working quickly and noting the time. Shake each tube to mix the contents.
6 Observe the tubes over the course of the next 5 minutes or so and notedown the time when any precipitate appears.
Requirements� test-tubes� ethanol (3 cm3)� silver nitrate solution, 0.01 mol dm–3 (3 cm3)� 0–110°C thermometer� 250 cm3 beaker� source of hot water (50 °C)� 1-chlorobutane� 1-bromobutane a few drops of each� 1-iodobutane� stopclock
1-bromobutane
1-chlorobutane
ethanol
1-iodobutane
HARMFUL
RESULTS AND QUESTIONS
If a precipitate appears it meansthat hydrolysis has taken place andhalide ions have been released fromthe halogenoalkane.
a Which halogenoalkane undergoesthe fastest hydrolysis? Which isslowest?
b Suggest a reason for the differentrates of hydrolysis. The chartshowing bond enthalpies in theData Sheets may help you.
c What result would you predict for1-fluorobutane? Explain youranswer.
d Why was the experiment doneusing halogenobutanes ratherthan halogenomethanes?
e What bearing do your results haveon the choice of the besthalogenoalkanes to use asrefrigerant fluids?
⎧⎨⎩
CARE Eye protectionmust be worn.
HIGHLYFLAMMABLE
HARMFUL HIGHLYFLAMMABLE
HARMFUL HIGHLYFLAMMABLE
HARMFUL FLAMMABLEWEAR EYEPROTECTION

© Salters Advanced Chemistry 2000 – see Copyright restrictions 98
HCl
2-methylpropan-2-ol 2-chloro-2-methylpropane
++C OHCH3 H2O
CH3
CH3
C ClCH3
CH3
CH3
Making ahalogenoalkane
In this activity, you will prepare a sample of 2-chloro-2-methylpropane. This will involve learningnew techniques both to carry out the reaction, and toseparate and purify the liquid product. You will needto work carefully to obtain the maximum yieldpossible.
A4.2
BackgroundOne way to make a halogenoalkane is to start with an alcohol and replace the–OH group by a halogen atom.
For example, you can make 2-chloro-2-methylpropane by allowing 2-methylpropan-2-ol to react with concentrated hydrochloric acid at roomtemperature. The overall reaction can be represented by the equation:
Requirements� 10 cm3 measuring cylinder� 50 cm3 measuring cylinder� 2-methylpropan-2-ol (6.5 cm3)� concentrated hydrochloric acid (20 cm3)� access to a balance� 50 cm3 pear-shaped flask� 50 cm3 separating funnel and stopper � distillation head� clamps and stand� anti-bumping granules� condenser� small Bunsen burner or electric heating mantle� sodium hydrogencarbonate solution, 5% (10 cm3)� anhydrous sodium sulphate� 100 cm3 conical flask (2)� 0 –110 °C thermometer and holder� specimen tube� 50 cm3 beaker
2-methylpropan-2-ol
concentrated hydrochloric acid
HARMFUL
CARE Eye protectionmust be worn.
CORROSIVE
WEAR EYEPROTECTION
The mechanism of this reaction is explained in Chemical Ideas 14.2. (A similartype of reaction with HBr rather than HCl is described in Chemical Ideas 13.1.)
The preparation of an organic compound usually takes place in four stages:
� carrying out the reaction� separating the required product from the reaction mixture� purifying the product� testing the product to check that it is a pure sample of the required
compound.
a Write the equation for the reaction given above using skeletal ratherthan structural formulae.
CARE The vapours produced in this activity canbe harmful. Work in a well-ventilated laboratoryand avoid inhaling the fumes.
HIGHLYFLAMMABLE

„ Salters Advanced Chemistry 2000 – see Copyright restrictions 99
A4.2MAKING A HALOGENOALKANE
What you do
Carrying out the reactionBefore you carry out the reaction you need to learn how to use the separating
funnel correctly. Your teacher will show you.
1 Into a 10 cm3 measuring cylinder, pour about 6.5 cm3 of 2-methylpropan-2-ol.
(CARE Highly flammable and harmful. Keep bottle stoppered when not in
use and well away from naked flames. Avoid skin contact and do not breathe
the vapour.) This will be approximately 5 g of the 2-methylpropan-2-ol.
Weigh the measuring cylinder and contents and then pour the
2-methylpropan-2-ol into a 50 cm3 separating funnel. Weigh the empty
measuring cylinder and record the exact mass of 2-methylpropan-2-ol you
have added to the funnel.
2 Into a 50 cm3 measuring cylinder, pour about 20 cm3 of concentrated
hydrochloric acid. (CARE Extremely corrosive. Avoid skin contact.)
Gradually add the acid to the 2-methylpropan-2-ol in the funnel over a
period of about 2 minutes.
3 Put the stopper in the funnel and shake the mixture from time to time over
the next 20 minutes. After each shaking remove the stopper briefly to releasethe pressure.
Separating the product from the reaction mixtureThe mixture now contains the product 2-chloro-2-methylpropane (CARE Highly
flammable and harmful) and the following substances:
� 2-methylpropan-2-ol� hydrogen chloride (hydrochloric acid)� water.
4 Allow the mixture to stand until two layers have separated (Figure 1).
Remove the stopper and run the lower layer into a clean 100 cm3 conical
flask. Use the table of densities (Table 1) to decide which layer contains the
2-chloro-2-methylpropane.
Liquid Density/g cm–3
2-chloro-2-methylpropane 0.842-methylpropan-2-ol 0.78water 1.0concentrated hydrochloric acid 1.2
Table 1 Densities of some of the liquids present
Most of the 2-methylpropan-2-ol impurity dissolves in the concentrated
hydrochloric acid layer and so is removed when you run off this layer.
The remaining impurities are removed in the operations which follow.
b Suggest why the alcohol dissolves in concentrated hydrochloric acid.c What impurities are likely still to contaminate the 2-chloro-2-
methylpropane layer at this stage?
5 Slowly add 10 cm3 of 5% sodium hydrogencarbonate solution to the
2-chloro-2-methylpropane in the separating funnel. Stopper the funnel and
shake the contents gently and then more vigorously. There will be a markedbuild up of gas, so be very careful when you release the pressure. When the
two layers have separated, run off and discard the lower aqueous layer.
Repeat the washing with sodium hydrogencarbonate solution until no more
gas is given off.
6 Add 10 cm3 of distilled water and shake. When the two layers have separated,
run off and discard the lower aqueous layer and then run the 2-chloro-2-
methylpropane into a clean conical flask.
7 To the liquid in the flask, add a small amount of anhydrous sodium sulphate,
which acts as a drying agent and removes the last traces of water. Add the
drying agent in small quantities, swirling after each addition, until the liquid
is totally clear.
Figure 1 Separating funnel
10509-07P089-115-GECKO.LTD 7/3/02 4:09 pm Page 99

MAKING A HALOGENOALKANEA4.2
100 „ Salters Advanced Chemistry 2000 – see Copyright restrictions
d Which impurity is removed by shaking the product with a solution ofsodium hydrogencarbonate?
e Why is there a marked build up of pressure during the shaking?f Suggest a reason why sodium hydrogencarbonate solution is used
rather than sodium hydroxide solution.g How did the appearance of your product change when it was swirled
with anhydrous sodium sulphate? How do you account for this?h Name another drying agent which could be used in place of the
anhydrous sodium sulphate.
Purifying the product and testing its identity and purityMost of the impurities should now have been removed, except for a small
amount of 2-methylpropan-2-ol which will be dissolved in the 2-chloro-2-
methylpropane. This can be separated by carrying out a distillation.
8 Set up clean and dry apparatus for a simple distillation, complete with
thermometer (see Figure 2). The thermometer bulb should be opposite the
side-arm so that it measures the temperature of the liquid that distils over.
HEAT
waterin
waterout
pureliquid
impure
anti-bumpinggranules
liquid
condenser
Figure 2 Apparatus for a simple distillation
9 Transfer the dried 2-chloro-2-methylpropane into the distillation flask and
add a few anti-bumping granules.
10 Weigh a clean, dry specimen tube. Gently heat the liquid in the distillation
flask using the flame from a small hand-held Bunsen burner. At first use a
small beaker as the receiver. Start collecting the 2-chloro-2-methylpropane in
the weighed specimen tube when the temperature reaches 48 °C. The
boiling point of 2-chloro-2-methylpropane is 51 °C. Stop the distillation when
the thermometer rises above 53 °C. Stopper the specimen tube and record
the mass of 2-chloro-2-methylpropane collected.
i How does the final stage allow you to check the identity and purityof your product?
j Differences in three properties – solubility, acidity and volatility –are used to remove impurities from the 2-chloro-2-methylpropane.Group the impurities removed under these headings.
k Work out the % yield of 2-chloro-2-methylpropane as follows:i Write the balanced equation for the reaction used to produce
2-chloro-2-methylpropane .ii What is the maximum mass of 2-chloro-2-methylpropane that
you could obtain from the mass of 2-methylpropan-2-ol used?iii Calculate the % yield you obtained in your experiment.
l Experience suggests that you will do well to get a yield over 50%.What reasons can you think of to account for a yield well under100%?
m Look carefully at the equation for the preparation of 2-chloro-2-methylpropane. What type of reaction is this?
n What problems would you expect at each stage of the process ifyou were trying to scale it up to make several tonnes of 2-chloro-2-methylpropane?
10509-07P089-115-GECKO.LTD 7/3/02 4:09 pm Page 100

„ Salters Advanced Chemistry 2000 – see Copyright restrictions 101
Designing refrigerants
In this activity you will analyse data about a number ofcompounds which have been considered as possiblerefrigerants. You will then investigate various replacementsfor CFCs and look at the international agreements thatgovern the phasing out of ozone-depleting compounds.
In the final part you are asked to produce a briefingdocument for a politician, which will allow you topractise your research and communication skills.
A4.3
Part 1: Properties of refrigerantsFigure 1 shows an outline of how a refrigerator works.
Figure 1 How a refrigerator works
low-pressureliquid and gas
compressorpump
heat takenin byvaporisingrefrigerant
coolingfins
heat lost bycondensingrefrigerant
hot, high-pressure gas
cold, high-pressure liquid
low-pressure gas
expansion valve
The refrigerant fluid is crucial to the whole process. It must have the right
boiling point – high enough to liquefy by compression, low enough to vaporise
easily at reduced pressure; 240 K (–33 °C) is about right. For many years,
ammonia was used as a refrigerant.
a What other properties do you think a refrigerant fluid should have?
Compounds derived from alkanes by replacing H atoms with Cl and F atoms
appeared to be good candidates for refrigerant fluids. The different halogen
atoms give the compounds different properties.
Table 1 gives some properties of alkanes, chloroalkanes and fluoroalkanes.
Suggest answers to the following questions concerning the properties of the
compounds in the table.
Formula Boiling Chemical Flammable? Toxic? Pricepoint/K reactivity in
atmosphere
CH4 109 moderate yes no lowCCl4 350 low no yes mediumCF4 144 very low no no high
C2H6 185 moderate yes no lowC2Cl6 459 low no yes mediumC2F6 194 very low no no very high
C3H8 231 moderate yes no lowC3Cl8 559 low no yes highC3F8 237 very low no no very high Table 1 Properties of some alkanes,
chloroalkanes and fluoroalkanes
10509-07P089-115-GECKO.LTD 7/3/02 4:09 pm Page 101

DESIGNING REFRIGERANTSA4.3
102 „ Salters Advanced Chemistry 2000 – see Copyright restrictions
Formula Code Uses Toxicity Boiling Flammable? Ozone Pricepoint /K depletion
potential
CCl3F CFC 11 PRB* low 297 no 1.0 mediumCCl2F2 CFC 12 PRB* low 243 no 1.0 mediumCCl2FCClF2 CFC 113 C* low 321 no 0.8 high
Key to symbols used in the tables:
� The code is the number used in industry to identify the compound.HCFC: hydrochlorofluorocarbonsHFC: hydrofluorocarbons.
� R = refrigeration and air conditioning; B = foam blowing agent; P = aerosol propellant (a minor use); C = cleaning solvent.
� The ozone depletion potential (ODP) is a measure of the effectiveness of the compound indestroying stratospheric ozone. CCl3F is defined as having an ODP of 1.0.
* see key below
Table 2 CFCs that were widely used
Formula Code Toxicity Boiling Flammable? Ozone Pricepoint /K depletion
potential
CH2Cl2 high 313 no <<0.01 lowCH3CH2CH3 low 231 yes 0 lowCH3CH2CH2CH3 low 273 yes 0 lowCH3OCH3 low 249 yes (very) 0 lowCHClF2 HCFC 22 low 232 no 0.06 highCF3CH2F HFC 134a low 247 no 0 very highCF3CCl2H HCFC 123 low 302 no 0.02 highCH3CCl2F HCFC 141b low 305 yes 0.11 highCH3CHF2 HFC 152a ?low 249 yes 0 high
Table 3 Possible replacement compounds
b Imagine you are in the position of Thomas Midgley in 1930 and arelooking for a suitable replacement for ammonia as a refrigerant fluid.You are investigating the properties of hydrocarbons andhalogenoalkanes.
What are the advantages and disadvantages of each of thefollowing in molecules of a refrigerant fluid:
i H atoms?ii Cl atoms?iii F atoms?
Why do you think Midgley selected CCl2F2 as a suitable replacementfor ammonia?
Part 2: Replacing CFCsIt may help to work in small groups for this part of the activity and then compare
your findings with other groups in your class.
In the late 1980s, it was shown convincingly by scientists that CFCs being
used for a wide variety of purposes were damaging the ozone layer in the
stratosphere. It was vital therefore that replacements were found. Just prior to
the acceptance of this evidence, the annual world production of CFCs was about
8.5 ¥ 105 tonnes.
The tables below give information about compounds containing C, H, Cl and
F atoms. The three CFCs that were most widely used are shown in Table 2. Table
3 gives information about possible replacement compounds. A key to the
symbols and terms used in the tables is given below the tables.
10509-07P089-115-GECKO.LTD 7/3/02 4:09 pm Page 102

„ Salters Advanced Chemistry 2000 – see Copyright restrictions 103
A4.3DESIGNING REFRIGERANTS
QUESTIONS
c Hydrogen in the molecule results in it being degraded in thetroposphere. Fluorine results in stability or inertness.
Look at the ozone depletion potentials (ODPs) of the variouscompounds.
i What features of a compound seem to give rise to a high ODP?Suggest a reason why.
ii What features give rise to a low ODP? Suggest a reason why.
Compare your answers and ideas with those of the other groups.
d On the basis of the information in the tables, which compound doyou consider to be the most suitable replacement for:
i CCl3F (CFC 11), for use as a blowing agent?ii CCl2F2 (CFC 12), for use as a refrigerant?iii CCl2FCClF2 (CFC 113), for use as a cleaning solvent?
In each case, make a shortlist of two or three, then make your finalselection. Give reasons for your choices.
What further information would you need before making a finaldecision about replacement compounds?
Part 3: International agreementsThe first major international agreement which limited production of CFCs and
other ozone-depleting compounds was the Montreal Protocol. It was signed by
thirty countries in 1987 and came into force on 1 January 1989.
The Montreal ProtocolProduction of CFCs 11, 12, 113, 114, 115:� frozen at 1986 level from 1992� reduced to 80% from 1993� reduced to 50% from 1998.
Production of halons (brominated halogenoalkanes used in fire extinguishers):� restricted to 1986 levels
In 1989 the European Council of Ministers announced that CFC production
would be phased out completely by the year 2000. The US made a similar
declaration. Later in the year the Montreal Protocol countries (then increased to
more than 60) adopted the same policy.
The Revised Montreal Protocol, London Amendment, 1990Production of CFCs:� reduced to 50% from 1995� reduced to 15% from 1997� zero by 2000.
Tetrachloromethane (used as a solvent):� reduced to 15% from 1995� zero by 2000.
Production of halons:� phased out by 2000 (with some exceptions as there are no known alternatives).
1,1,1-trichloroethane (used as a solvent):� reduced to 70% from 1995� reduced to 30% from 1997� zero by 2005.
HCFCs, with ODPs of about 0.05, should be used to replace CFCs in about 15%of applications, but this is seen as a transitional measure with an HCFC phase-outexpected for about 2030.
10509-07P089-115-GECKO.LTD 7/3/02 4:09 pm Page 103

DESIGNING REFRIGERANTSA4.3
104 „ Salters Advanced Chemistry 2000 – see Copyright restrictions
1 The Montreal protocol is still under review and continues to be amended.
Use Table 4 and the Internet to find out about the latest agreements for
CFCs, halogenoalkanes and HCFCs. To start the search, use the Salters
Advanced Chemistry web site.
2 Prepare a briefing document for a politician which:� explains the relative merits, as refrigerants, of CFCs, HCFCs, alkanes and
HFCs in terms of their constituent elements� provides an update of international agreements on the use of CFCs and
HCFCs� identifies any outstanding problems you are aware of concerning the
impact of international agreements.
Provisions of the Montreal Protocol European Union regulations enacted agreed and in force at the end of 1997 and in force
CFCs ‘Other’ Halons HCFCs CFCs ‘Other’ Halons HCFCsCFCs CFCs
Base Year 1986 1989 1986 1989 1986 1986 1986 1989Year
1993 20% 50% 50% freeze1994 75% 75% 100% 85% 85% 100%1995 100% 100%1996 100% 100% freeze2004 35% 35%2007 60%2010 65% 80%2013 95%2015 90% 100%2020 99.5%2030 100%
Table 4 Reductions in consumption of some halogen-containing compounds required by the regulations
(Based on data given, by kind permission, in R. Powell, Methods of Organic Chemistry Vol. E10a, Organo-fluorinecompounds, eds. B. Baasner, H. Hagermann, J.C. Tetlow. G. Thienne Verlag, 1999.)
10509-07P089-115-GECKO.LTD 7/3/02 4:09 pm Page 104

„ Salters Advanced Chemistry 2000 – see Copyright restrictions 105
Chemistry in the stratosphere
A5 This activity will help you record some of theinformation that has been presented in sections A1–A5 of this unit.
Now is the time to make sure you have a record of the main points covered in
sections A1–A5. It is important to make these notes as you go along.
The following activities should help you check that you have understood the
important ideas.
a Make sure you know the approximate composition of the atmosphereand the main pollutant gases.
b You have come across a lot of new terms in this part of the course, egstratosphere, radical, photodissociation, termination. Go through thetext and pick out these and others like them, then write a few lines ofexplanation for each, including an example taken from the text. (Don’tforget to look in the Activities as well as in the Storyline and theChemical Ideas.)
c Make a summary of the key points in the story concerning thefunction of ozone in the stratosphere, and why there is concern aboutthe effect CFCs have on this ozone. Your summary should be no morethan half a page long.
d Summarise the chemical reactions taking place in the stratosphere.You may find it helps to do this in the form of a diagram.
10509-07P089-115-GECKO.LTD 7/3/02 4:09 pm Page 105

„ Salters Advanced Chemistry 2000 – see Copyright restrictions 106
Which are the greenhouse gases?
In this activity, you will use information about theinfrared absorption of atmospheric gases to decidewhich will contribute to the greenhouse effect.
A6
The frequency and wavelength ranges over which certain important atmospheric
gases absorb infrared radiation are shown in Table 1.
Gas Absorption frequency range Absorption wavelength range/1014Hz /nm
N2 none noneO2 none noneH2O 0.43–0.64 6950–4670CO2 0.18–0.24 17 000–12 500CH4 0.39–0.46 and 0.85–1.03 7700–6500 and 3520–2900N2O 0.38–0.42 7800–7120CCl3F 0.25–0.33 12 000–9060O3 0.28–0.32 10 700–9340 Table 1 Infrared absorption of some
atmospheric gases
The spectrum in Figure 1 shows the infrared radiation emitted by the Earth. It
shows the energy emitted at each wavelength (and frequency). Use the
information in the table to answer the following questions.
Figure 1 Infrared radiation emitted by the Earth
a The range of wavelengths absorbed by CO2 in the atmosphere isshown in Figure 1. Mark on the Earth’s radiation spectrum theabsorption ranges (if any) of other gases that occur naturally in theatmosphere in considerable quantities: N2, O2, H2O. (It is easier touse the wavelength ranges rather than the frequency ranges.)
b Which of these four naturally abundant gases are likely to have agreenhouse effect?
c What range of wavelengths of infrared radiation will be able to escapefrom Earth without absorption by these natural greenhouse gases?This range of frequencies acts as a ‘window’ which keeps the Earthcool by allowing radiation to escape.
d Now look at the other gases in the table: CH4, N2O, CCl3F and O3.i Which are produced naturally?ii Which are produced as a result of human activities?
e Mark on the spectrum the absorption ranges of each of the gasesmentioned in d.
i Which are greenhouse gases?ii Which absorb radiation in the ‘window’ mentioned in c?
f From the information given, it is not possible to compare themagnitude of the different gases’ greenhouse effects. What furtherinformation would you need in order to do this?
Wavelength/nm
Frequency/1014 Hz
40 000 30 000 20 000 10 000
0.1 0.2 0.3 0.4 0.5 1.0
Ene
rgy
emitt
ed
CO2
Notes: N2O, dinitrogen oxide, is released by manyorganisms. Increased use of fertilisers increases therelease of N2O.
10509-07P089-115-GECKO.LTD 7/3/02 4:09 pm Page 106

© Salters Advanced Chemistry 2000 – see Copyright restrictions 107
The effect of concentration changeson chemical equilibria
A8.1 In this activity you will carry out some quick test-tubereactions to investigate the effect of changing theconcentration of a substance in an equilibriummixture.
IntroductionThe two equilibria in this activity involve coloured ions, so you can use thecolour of the solution to investigate how the position of equilibrium changeswhen the concentration of one of the reactants is increased or decreased.
Equilibrium 1Potassium chromate(VI) solution contains yellow chromate(VI) ions. In acidicsolution, orange dichromate(VI) ions are formed.
2CrO42–(aq) + 2H+(aq) D Cr2O7
2–(aq) + H2O(l)chromate(VI) ion dichromate(VI) ion
yellow orange
1 Place 2 cm3 potassium chromate(VI) solution (0.1 mol dm–3) in a test-tube.(CARE Chromates(VI) irritate the skin and are suspected carcinogens. Avoidall skin contact. Wear gloves.)
2 Add dilute sulphuric acid (CARE Irritant) drop by drop, with gentle shaking,until there is no further colour change.
3 Now add dilute sodium hydroxide solution (CARE Corrosive) drop by drop,with gentle shaking, until there is no further colour change. (Hydroxide ions,OH–(aq), remove H+(aq) ions from the solution.)
4 Repeat steps 2 and 3, and then record your observations in Table 1. Suggesta cause for each colour change (in terms of the concentration of thecoloured ions) and then say what this tells you about the change in theposition of equilibrium.
Requirements� test-tubes and rack� potassium chromate(VI) solution, 0.1 mol dm–3 (2 cm3)� protective gloves� dilute sulphuric acid, 1.0 mol dm–3 (2 cm3)� dilute sodium hydroxide solution, 2.0 mol dm–3 (2 cm3)� teat pipettes� distilled water� potassium (or ammonium) thiocyanate solution KSCN
(or NH4SCN), 0.5 mol dm–3 (2 drops)� iron(III) chloride solution, 0.5 mol dm–3 (2 drops)� solid ammonium chloride (1 spatula load)� glass stirring rod
CARE Chromates(VI) irritate the skin and are suspectedcarcinogens. Avoid all skin contact. Any spillage should bewashed off at once. Wear protective gloves.
CARE Thiocyanates and ammonium chloride are harmful.
ammonium chloride
dilute sulphuric acid
potassium chromate(VI)solution
potassium thiocyanate solution
sodium hydroxide solution
HARMFUL
IRRITANT
HARMFUL IRRITANT
HARMFUL
CORROSIVE
WEAR EYEPROTECTION
WEARPROTECTIVE
GLOVES
CARE Eye protection andgloves must be worn.

THE EFFECT OF CONCENTRATION CHANGES ON CHEMICAL EQUILIBRIAA8.1
108 „ Salters Advanced Chemistry 2000 – see Copyright restrictions
Change Observation Cause What has happened to the position of equilibrium?
concentrationFe3+(aq) increased
concentrationSCN–(aq) increased
concentrationFe3+(aq) decreased
Table 2
QUESTION
b How would the position of equilibrium be affected by increasing theconcentration of [FeSCN]2+(aq) ions?
SUMMARY
c How does changing the concentration of one of the substances in anequilibrium mixture affect the position of equilibrium? Write a shortparagraph to summarise your findings.
Change Observation Cause What has happened to the position of equilibrium?
concentrationH+(aq) increased
concentrationH+(aq) decreased
Table 1
QUESTION
a Write an ionic equation to show how hydroxide ions, OH–(aq),remove H+(aq) ions from the solution. What type of reaction is this?
Equilibrium 2Iron(III) ions and thiocyanate ions react in solution to produce a blood-red
compound:
Fe3+(aq) + SCN–(aq) D [FeSCN]2+(aq)
iron(III) ion thiocyanate ionpale yellow colourless blood red
5 Mix together 1 drop of iron(III) chloride solution (0.5 mol dm–3) and 1 drop
of potassium thiocyanate solution (0.5 mol dm–3) in a test-tube, and add
about 5 cm3 of distilled water to form a pale orange-brown solution.
6 Divide this solution into four equal parts in four test-tubes.
7 Add 1 drop of iron(III) chloride solution to one test-tube, and 1 drop of
potassium thiocyanate solution to a second. Compare the colours of these
solutions with the two remaining tubes. Enter your observations in Table 2.
8 Add a spatula-load of solid ammonium chloride to a third test-tube and stir
well. (The effect of this is to reduce the concentration of iron(III) ions in the
solution. The chloride ions in ammonium chloride react with the Fe3+(aq)
ions to produce [FeCl4]– ions.) Compare the colour of this solution with the
remaining tube and note your observation. Now complete the rest of Table 2.
10509-07P089-115-GECKO.LTD 7/3/02 4:09 pm Page 108

109„ Salters Advanced Chemistry 2000 – see Copyright restrictions 109
Measuring the concentration of carbondioxide in air samples
A8.2 In this activity you will see how pH measurements canbe used to find the concentration of carbon dioxide insamples of air. You will then consider the limitationsof the method.
Sample pH
Outdoor air 9.3Indoor air 8.7Carbon dioxide 5.9
Table 1 Sample results (bubbling the gas into thesolution for 20 minutes)
IntroductionTo understand this activity you need to know what is meant by the pH of a
solution. You will learn about this in more detail in The Oceans. For now it is
sufficient to known the following.
The pH scale is a measure of the acidity or alkalinity of a solution. Pure water
has pH = 7. Solutions with pH<7 are acidic; solutions with pH>7 are alkaline.
The pH scale represents the concentration of H+(aq) ions in a solution on a
logarithmic scale. This means that a tenfold change in the concentration of
H+(aq) ions is needed to produce a pH change of 1.
This is shown in Figure 1, which gives the hydrogen ion concentrations,
[H+(aq)], corresponding to some pH numbers.
Figure 1 The pH scale
increasingly acidic neutral increasingly alkaline
4 5 6 7 8 9 pH number
1¥10–4 1¥10–5 1¥10–6 1¥10–7 1¥10–8 1¥10–9 [H+(aq)]/mol dm–3
If the concentration of H+(aq) ions in a solution is halved, the pH only
changes by 0.3.
Using pH to measure CO2 concentration in airCarbon dioxide is a weakly acidic gas, and this property can be used to measure
the concentration of carbon dioxide in samples of air.
The carbon dioxide in an air sample is allowed to dissolve in water. Then the
acidity of the water is measured. The greater the carbon dioxide concentration
in the air sample, the more acidic the water will be. Here are the important
reactions:
CO2(g) + aq D CO
2(aq)
CO2(aq) + H
2O(l) D HCO
3–(aq) + H+(aq)
However, changes in the concentration of dissolved carbon dioxide lead to only
small changes in the pH of the solution.
If a solution of sodium hydrogencarbonate is used in place of water, the pH
of the solution also changes with the concentration of carbon dioxide in the air
sample, but the changes in pH are larger, so that the method becomes much
more sensitive.
A pump is used to bubble air through a solution of sodium hydrogencarbonate
until equilibrium is reached (about 20 minutes). The air can be drawn from
different sources for comparison (eg outdoors and indoors). Some sample results
are shown in Table 1.
The calibration graph (Figure 2) allows you to relate the pH of the sodium
hydrogencarbonate solution to the concentration of carbon dioxide in the air
sample.
(Biologists frequently use this technique to measure carbon dioxide
concentrations in air samples. Instead of using a pH meter, they often use
bicarbonate indicator. This is a standard solution of sodium
hydrogencarbonate containing a mixture of indicators. These change colour
according to the pH of the solution.)
10509-07P089-115-GECKO.LTD 7/3/02 4:09 pm Page 109

MEASURING THE CONCENTRATION OF CARBON DIOXIDE IN AIR SAMPLESA8.2
110 „ Salters Advanced Chemistry 2000 – see Copyright restrictions
QUESTIONS
a Use the sample results and the calibration graph to calculate theconcentration of gaseous carbon dioxide in each sample. (Assumethat equilibrium has been reached between the sample and thesolution.)
b What is the uncertainty associated with a pH value which is read to0.1 pH units? Calculate the percentage error for each of the pHvalues in the sample results.
c A difference of 0.1 pH units produces quite large differences afterusing the calibration graph and calculating the concentration
eg pH 9.0 gives a concentration of 2.5 ¥ 10–5 mol dm–3
but pH 8.9 gives a concentration of 3.6 ¥ 10–5 mol dm–3
What would be the percentage difference in the concentrationcalculated if the correct reading was pH 9.0 but the recorded valuewas 8.9?
d Is this method sensitive and accurate enough to detect thedifference in carbon dioxide concentration between:i normal air and carbon dioxide gas?ii air outside and inside the laboratory?
e Comment on the limitations of this method as a way of finding theconcentration of carbon dioxide in the atmosphere. How usefulwould the method be for chemists monitoring pollution of theatmosphere?
f Your results for the concentration of carbon dioxide in the airsamples are in mol dm–3. The more usual measure of gaseousconcentration is percentage by volume. Convert your results intopercentage by volume. (Assume that at room temperature and pressure 1 mole of carbon dioxide occupies 24 dm3.)
Figure 2 Calibration graph relating pH of the sodiumhydrogencarbonate solution to the logarithm of the concentration of carbon dioxide in the air sample
5 6 7 8 9 10pH
0
-1
-2
-3
-4
-5
-6
lg(C
O2
conc
entr
atio
n /m
ol d
m-3
)
10509-07P089-115-GECKO.LTD 7/3/02 4:09 pm Page 110

„ Salters Advanced Chemistry 2000 – see Copyright restrictions 111
Controlling carbon dioxide
A9 Reducing the rate of increase of carbon dioxide in theatmosphere is one of the greatest challenges for theworld as we move into the 21st century. In this activityyou will write a report using information from avariety of sources and try your hand at writing anabstract which summarises the content of your report.
Fuel Typical constituent Standard enthalpy changeof combustion of typical
constituent/kJ mol–1
coal carbon –394natural gas methane, CH4 –890gasoline octane, C8H18 –5470hydrogen hydrogen, H2 –286
Table 1 Four possible fuels
a For each fuel in Table 1, write an equation to represent itscombustion.
b For each fuel, calculate the amount in moles of carbon dioxide givenout per kJ of energy released by the fuel.
c What are the implications of your answers?
What you do1 Write a report of no more than 400 words on one of the four approaches.
Refer to the statistics on the Information Sheet (World resources and theconsumption of energy) as appropriate, and use any other sources of
information you can find. (These may be Salters Advanced Chemistry units,
textbooks, articles or the Internet.) At the end of your report, list clearly any
additional sources you have used. (This list is not included in the word
count.) You should refer to this list in your report where appropriate. For
example, where you have copied material directly from another source, this
must be indicated in the text and the source properly acknowledged.
You may be asked to make an oral presentation to the class on your
approach.
2 In the second part of this activity, a person is chosen to present a short
briefing to the class on each of the approaches. After all four briefings have
been presented, the class can work together to discuss an overall approach –
which might be a combination of some or all of the four.
The overall objective is to recommend a strategy for bringing about a
substantial reduction in the amount of carbon dioxide emitted into the
atmosphere throughout the world.
IntroductionCarbon dioxide is the greenhouse gas causing most concern. Increased carbon
dioxide emissions could upset the existing balance in the atmosphere.
Below, four possible approaches to the control and reduction of atmospheric
carbon dioxide are outlined:
Approach 1 Choose the right fuel.
Approach 2 Economise on the use of energy in general.
Approach 3 Dispose of the carbon dioxide.
Approach 4 Encourage photosynthesis.
Your teacher will probably tell you which of these approaches to work on, but
first answer the questions below.
Table 1 gives details of four possible fuels.
10509-07P089-115-GECKO.LTD 7/3/02 4:09 pm Page 111
CONTROLLING CARBON DIOXIDEA9
112 „ Salters Advanced Chemistry 2000 – see Copyright restrictions
The scale of the problemWhen tackling this activity, you must be aware of the scale of the problem. It is
enormous, because the amount of fossil fuel burned throughout the world is
now huge: about 30 thousand million tonnes (30 Gt) of carbon dioxide are
released into the atmosphere each year from human activities. The problem is
much too big for a quick, easy solution.
You should also be aware of the scale of natural processes involving carbon
dioxide compared with the scale of carbon dioxide production by humans. To
remind yourself, have a look at the diagram of the global carbon cycle in
Storyline A8.
Approach 1: Choose the right fuelSome fossil fuels give out more carbon dioxide than others when they burn.
Prepare a report on the control of carbon dioxide by selective use of fuels.
You should decide which fuels are preferable for which uses. You should
indicate any problems and drawbacks involved in this approach.
Bear in mind the following points:
� Your scheme will have to take account of the available reserves of the fuels
concerned.� Different fuels are appropriate for different uses. For example, most forms of
transport need liquid fuels.� Electricity generation is a major use of fossil fuels.� Hydrogen is a possible fuel that may have attractions, but hydrogen does not
occur naturally: it has to be manufactured.
You might also consider the implications of using fuels derived from biomass
(eg ethanol produced from grain or from wood) rather than those from fossil
fuels.
Approach 2: Economise on the use of energy in generalAll fossil fuels release carbon dioxide when they burn. Economising on the use
of energy in general will reduce consumption of fossil fuels, and so reduce
carbon dioxide emission. Energy consumption can also be reduced by increasing
the efficiency of energy conversions, particularly in power stations and motor
vehicle engines.
Prepare a report on the control of carbon dioxide by economising on the use
of energy worldwide. You should make suggestions concerning how this could
be done. You should indicate any problems and drawbacks involved in this
approach. Try to find information about some of the techniques for increasing
fuel efficiency, for example fluidised bed combustion in power stations.
Bear in mind the following points:
� Standard of living is closely related to energy consumption (but see the next
point).� There are examples, over the last 30–40 years, of energy economy and
efficiency drives in Western countries. These have led to a reduction in the
use of fossil fuels without causing a significant fall in standard of living.� Electricity generation is a major use of fossil fuels.� You may want to consider alternative energy sources. Nuclear energy may
have attractions in this context, but bear in mind that it carries with it a
number of environmental hazards.
10509-07P089-115-GECKO.LTD 7/3/02 4:09 pm Page 112

„ Salters Advanced Chemistry 2000 – see Copyright restrictions 113
A9CONTROLLING CARBON DIOXIDE
Approach 3: Dispose of the carbon dioxideIt might be possible to get rid of carbon dioxide, after it has been formed but
before it can escape into the atmosphere. The problem with this approach is the
enormous quantity of carbon dioxide involved: 30 thousand million tonnes each
year.
Carbon dioxide removal is not yet a practical possibility on a large scale,
though a number of methods have been suggested. One possibility is to use a
special solvent in which carbon dioxide is highly soluble. Exhaust gases from a
power station would be passed through the solvent so that the carbon dioxide
dissolved. The solvent would then be heated to expel the carbon dioxide. The
solvent would be recycled.
The carbon dioxide expelled from the solvent would then have to be
disposed of. The question is, where? It could in theory be liquefied and pumped
to a depth of more than 500 metres beneath the sea. At this depth the pressure
is so great that the carbon dioxide would remain at the bottom as a liquid.
Another possibility would be to dump the carbon dioxide underground in spent
oil or gas wells from which all the oil or gas had been removed.
The technology for this kind of process is expensive. It might double the
capital cost of a small coal-fired power station, and it could raise the price of
electricity by about 75%.
Prepare a report on the control of carbon dioxide by disposing of the gas.
You should indicate the advantages of this approach and mention any problems
and drawbacks involved. If you can invent other possible ways of absorbing and
disposing of carbon dioxide, you could mention these too.
Approach 4: Encourage photosynthesisPhotosynthesis removes carbon dioxide from the atmosphere, converting it to
carbohydrate and oxygen.
6CO2
+ 6H2O Æ C
6H
12O
6+ 6O
2
Worldwide, about 500 Gt of carbon dioxide are removed by photosynthesis each
year: compare this with the 30 Gt produced from the combustion of fossil fuels.
Increasing the rate of global photosynthesis will help remove carbon dioxide
from the atmosphere. Photosynthesis occurs particularly rapidly in the rain
forests of the tropics. However, the rain forests are being destroyed at a great
rate by human activities. What is more, destroying the forests actually adds more
carbon dioxide to the atmosphere when the wood is burned or decays. It is
estimated that about 2 Gt of carbon dioxide per year are released due to the
destruction of forests around the world.
At present, photosynthesis can only be carried out by plants. But a great deal
of research is going on to try and find out the exact mechanism by which
photosynthesis works. Once this is understood, it may be possible to arrange for
photosynthesis to occur in artificial systems, outside plants. There might then be
the possibility of using artificial photosynthesis to absorb atmospheric carbon
dioxide and at the same time produce carbohydrates for food or fuels.
Prepare a report on the control of carbon dioxide by encouraging
photosynthesis. You should indicate the advantages of this approach and
mention any problems and drawbacks involved. If you can think of other
possible ways of making use of photosynthesis, you could mention these too.
10509-07P089-115-GECKO.LTD 7/3/02 4:09 pm Page 113

CONTROLLING CARBON DIOXIDEA9
114 „ Salters Advanced Chemistry 2000 – see Copyright restrictions
Information Sheet: World resources and theconsumption of energy
Energy source Consumption /million tonnes of oil equivalent*
oil 3389natural gas 2016coal 2219hydroelectric 226nuclear 627
total 8477
Table 1 World consumption of different energysources, 1998 (BP Amoco Statistical Review ofWorld Energy, 1999)
Fuel Reserves /million tonnes of oil equivalent*
oil 143 000natural gas 134 000coal 656 000
total 963 000
Table 2 Estimated world reserves of fossil fuels,1998 (BP Amoco Statistical Review of WorldEnergy, 1999)
Consumption/million tonnes of oil equivalent*
Region Oil Gas Coal Hydro Nuclear Total
North America 1008 647 566 57 204 2492South and Central
America 217 77 19 45 3 361Europe 760 385 351 50 243 1788Former Soviet Union 184 746 167 20 50 897China 190 17 615 17 4 843Japan 255 63 88 9 84 499Africa 112 44 96 6 4 262
Table 3 Energy consumption in different regionsof the world, 1998 (BP Amoco Statistical Reviewof World Energy, 1999)
Fuel Percentage of generated electricity
coal 38.4oil 9.3gas 14.8nuclear 17.7hydroelectric 18.4other (inc. geothermal, solar) 1.4
Table 4 Percentage of the electricity generatedfrom different fuels worldwide in 1996 (KeyWorld Energy Statistics, IEA, 1998)
Fuel Percentage of fuel consumed
coal 24.0oil 35.3gas 20.2nuclear 6.7hydroelectric 2.3combustible residues and waste 11.1other (inc. geothermal, solar) 0.4
Table 5 World fuel consumption in 1996 (KeyWorld Energy Statistics, IEA, 1998)
* So that there can be an easy comparison between fuels, the consumption iscalculated in terms of the energy generated by oil: one tonne of oil equivalentequals 42 GJ or, for example, 1.5 tonnes of hard coal. It produces 12 MW hr ofelectricity in a modern power station.
10509-07P089-115-GECKO.LTD 7/3/02 4:09 pm Page 114

„ Salters Advanced Chemistry 2000 – see Copyright restrictions 115
Check your notes on The Atmosphere
This activity helps you get your notes in order at theend of this unit.
A10
Use this list as the basis of a summary of the unit by
collecting together the related points and arranging them in
groups. Check that your notes cover the points and are
organised in appropriate ways. Remember that you will be
coming back to many of the ideas in later units.
Most of the points are covered in the Chemical Ideas,
with supporting information in the Storyline or Activities.
However, if the main source of information is the Storyline
or an Activity, this is indicated.
� The gases present in the atmosphere, including some
major pollutants; understand values for composition by
volume measured in percentage concentration and in
parts per million (ppm) (Storyline A1).
� The idea that rotational, vibrational and electronic
energies are quantised.
� The qualitative changes in rotational, vibrational and
electronic energy of molecules caused by the absorption
of radiation of appropriate frequency.
� The relationship between frequency and energy of
electromagnetic radiation.
� The structure and reactivity of ozone and the way it is
formed and destroyed in the stratosphere; how ozone acts
as a sunscreen (Storyline A3; Activity A3.1).
� The factors that affect the rate of a chemical reaction and
the use of collision theory to explain the effects.
� The meaning of the terms: enthalpy profile and activationenthalpy.
� The use of the concept of activation enthalpy to explain
the qualitative effect of temperature changes on rate of
reaction.
� The role of catalysts in providing alternative routes of
lower activation enthalpy; homogeneous catalysis in terms
of the formation of intermediates.
� The difference between homolytic and heterolytic fission
of a covalent bond.
� The formation, nature and reactivity of radicals; the
mechanism of a radical chain-reaction involving initiation,
propagation and termination.
� The reaction of alkanes with halogens (Activities A3.2and A3.3).
� The nature and names of halogenoalkanes.
� The meaning of the terms: hydrolysis, substitution,
nucleophile and carbocation.
� Outline of the preparation of a halogenoalkane from an
alcohol and the principle stages in the purification of an
organic liquid product (Activity A4.2).
� The characteristic properties of halogenoalkanes,
comparing fluoro-, chloro-, bromo- and iodo-compounds:
boiling points, formation of radicals by interaction with
ultraviolet radiation (Storyline A3), and nucleophilic
substitution with water, hydroxide ions and ammonia.
� The mechanism of nucleophilic substitution in
halogenoalkanes.
� The use of relative electronegativity values to predict bond
polarity in a covalent bond; the relationship between
reactivity of halogenoalkenes and bond enthalpy and bond
polarity.
� The nature and uses of chlorofluorocarbons (CFCs)
(Storyline A4) and the relative advantages and
disadvantages of replacement compounds (Activity A4.3).
� The chemical basis of the depletion of ozone in the
stratosphere due to halogenoalkanes, involving the
formation of halogen atoms and the catalytic role of these
atoms in ozone destruction (Storyline A3).
� The relationship between the ‘greenhouse effect’ in the
troposphere and the absorption characteristics of
atmospheric gases (Storyline A6 and A7; Activity A6).
� A comparison of the different approaches to the control of
global warming through the control of carbon dioxide
emissions (Storyline A9; Activity A9).
� The meaning of the term: dynamic equilibrium.
� The physical and chemical changes occurring when carbon
dioxide dissolves in water, and the associated equilibria.
� The use of Le Chatelier’s Principle to explain and predict
the effects on the position of equilibrium of changes in
concentration, temperature and pressure.
10509-07P089-115-GECKO.LTD 7/3/02 4:09 pm Page 115

„ Salters Advanced Chemistry 2000 – see Copyright restrictions 118
Some important polymers: introductorydata
This activity is part of the introduction to the unit. Itwill help your data-analysis and information-retrieval skills. After carrying out the activity youshould be familiar with the names of some importantpolymers. You will find out how much of each isproduced and what the major uses are.
PR1
Polymers are a major product of the chemical industry. About 60% of all thechemicals it produces are used to make polymer products. It is now difficult toimagine life without them.
Polymers are used to make a range of different types of products (Figure 1).Some polymers are more suited to one particular application than to others. Youwill learn later in the unit how the structure of a polymer affects its propertiesand its use. The processing of a polymer is very important, too. It can determinethe way chains pack together, which affects the properties of the polymer.
coatings (eg kitchen worktops, food-can linings)
elastomers (eg rubbers)
plastics (eg films, mouldings, extrusions)
adhesives
others (eg biodegradable polymers)
fibres
Figure 1 Some uses of polymers
You will meet examples of ‘performance’ polymers for use in specialsituations – polymers that shine in the dark, heat-resistant polymers,biodegradable polymers. These form an exciting new generation of polymersthat are being developed in the 21st century.
By far the largest percentage of polymer production is concerned withmaking plastics for packaging, containers, tubes and piping.
Moulding of polymersThe polymer is often in the form of pellets. When heated these become softand can be pushed through nozzles to form pipes (for example, fordrainage) and tubes (for wires and cables). They can also be pushed throughnozzles into moulds, where they cool to form the desired shape (buckets,bowls, boxes). This is known as injection moulding. In blow moulding,air is blown into the mould to form bottles. The molten polymer can also beextruded as film (shrink wrap, bags, bin liners).
This activity is concerned with the uses of some of the more commonaddition polymers. You will be asked to note the formula of each polymer andthe formula of the monomer it is made from. But later in the unit you will learnmore about how polymers are made and how their properties and uses arerelated to their structures.
Figures 2–6 give the annual UK production and uses of the polymers,together with the world production. (You may wish to colour the sectors of thepie charts.)
10509-09P118-130-GECKO.LTD 4/3/02 10:11 Page 118

41%blow
moulding
24%injection
moulding
5%others
14%pipe
16%film
76%film
7%others
8%coating
5% injection moulding
4% wire and cable
26.5%textiles
34%packaging
7.7% housewares
3.6% buildings
5.8% furniture
5.9% others
6.8% appliances (household)
9.7% automotive
„ Salters Advanced Chemistry 2000 – see Copyright restrictions 119
PR1SOME IMPORTANT POLYMERS: INTRODUCTORY DATA
Figure 4 Uses of poly(propene)
Poly(propene)
Figure 3 Uses of ldpe / lldpe (low density andlinear low density poly(ethene))
Annual production of poly(propene)
UK 300 000 tonnesWorld 23.5 million tonnes
Poly(ethene)There are three main forms of poly(ethene). One is called high densitypoly(ethene), hdpe, and another is low density poly(ethene), ldpe. These arediscussed in this unit. The third form, linear low density poly(ethene), lldpe, isdiscussed in a later unit, Designer Polymers.
Figure 2 Uses of hdpe (high density poly(ethene))
Annual production of poly(ethene)
UK hdpe 280 000 tonneslldpe 160 000 tonnesldpe 200 000 tonnes
World hdpe 22.5 million tonneslldpe 14 million tonnesldpe 15.6 million tonnes
10509-09P118-130-GECKO.LTD 4/3/02 10:11 Page 119

QUESTIONS
information that you can find on the Internet (startyour search at the Salters Advanced Chemistry web site).i In what ways can you relate the differences in
production to the different products made fromthe five polymers?
ii What are the major differences between theuses of the high density and low density formsof poly(ethene)?
iii Poly(propene) is often said to be similar in use tohdpe. In what respects is this true? What is themajor difference in the uses of the two polymers?
SOME IMPORTANT POLYMERS: INTRODUCTORY DATAPR1
120 „ Salters Advanced Chemistry 2000 – see Copyright restrictions
26% refrigerators,furniture and
household items
31%cups andcartons
34%packaging
9%toys
Figure 6 Uses of polystyrene
Annual production of polystyrene
UK 270 000 tonnesWorld 8.5 million tonnes
Name of Formula of Formula of Main usespolymer monomer polymer
b Use a computer to produce a bar chart comparingthe UK production and world production of thesepolymers. Use the data above and any further
Poly(phenylethene) (polystyrene)
8% film and sheet
4% coating (paper/fabric)
4% tubes
3% other
2% footware9%
cables27%pipes
11%films
and sheets
5%bottles
18% extrudedsections
(eg windows)
2.5% other
0.5% records
6% flooring
plasticised
unpl
astic
ised
Figure 5 Uses of PVC
Annual production of PVC
UK 470 000 tonnesWorld 27 million tonnes
Poly(chloroethene) (polyvinyl chloride, PVC)
a Draw a table, like the one below, for the abovepolymers and complete as much of it as possible.You may not be able to give the formulae of thepolymers at this stage but you will be able to laterin the unit.
10509-09P118-130-GECKO.LTD 4/3/02 10:11 Page 120

„ Salters Advanced Chemistry 2000 – see Copyright restrictions 121
Makingpoly(phenylethene)(Optional extension)
PR2 In this activity you will use a peroxide to initiate theaddition polymerisation of an alkene. Phenylethene isa convenient alkene to use because it is a liquid witha boiling point of 145°C. Di(dodecanoyl) peroxide (orlauroyl peroxide) is the initiator.
What you do1 Place 10 cm3 of phenylethene in a boiling tube. (CARE Phenylethene is
flammable and harmful. Avoid breathing the vapour.)2 Add about 0.2 g of di(dodecanoyl) peroxide (CARE Irritant) and shake the
tube until the solid has dissolved.3 Plug the tube with cottonwool and then heat it in a beaker of boiling water
in a fume cupboard for about 20 minutes.4 Compare the contents of the tube with the original phenylethene. Is there
evidence that polymerisation is taking place?5 Leave the tube in an oven or water bath at about 50 °C until the contents
have set. (After step 3 you can pour the contents into a mould and use thatinstead of the boiling tube if you prefer.)
6 Dissolve a small quantity of the solid formed in methylbenzene. Add a fewdrops of the solution to 1 cm3 bromine water in a test-tube. Stopper the tubeand shake.
7 Now add a few drops of the monomer, phenylethene, to 1 cm3 brominewater in a separate test-tube. Stopper the tube and shake.
8 Make a record of your observations.
Requirements� phenylethene (styrene) (10 cm3)� 10 cm3 measuring cylinder� di(dodecanoyl) peroxide (0.2 g)� boiling tube and 2 test-tubes� 250 cm3 beaker� cottonwool� source of hot water� methylbenzene (5 cm3)� bromine water (2 cm3)� spatula� access to balance� access to fume cupboard
CARE You should carry out this experiment in a fume cupboard.
bromine waterHARMFUL
HARMFUL
IRRITANT OXIDISING
HIGHLYFLAMMABLE
HARMFUL FLAMMABLE
di(dodecanoyl) peroxide
methylbenzene
QUESTIONS
a What do your observations insteps 6 and 7 tell you about thestructures of the monomer andthe resulting polymer?
b The structure of phenylethene is:
Draw out part of the structure ofpoly(phenylethene).
c Di(dodecanoyl) peroxide is:
C C
H
HH
where R is a CH3(CH2)10 group.Explain how this compound actsas an initiator for thepolymerisation.
O
CR O O C R
O
WEAR EYEPROTECTION
phenylethene (styrene)
CARE Eye protectionmust be worn.
10509-09P118-130-GECKO.LTD 4/3/02 10:11 Page 121

Requirements� spaghetti (about 250 g)� 2 dm3 beaker (or saucepan)� Bunsen burner, tripod and gauze (or kitchen hob)� transparent container with a flat base and straight sides
(such as a plastic ice cream or sandwich box)� strainer
CARE Do not eat any spaghetti cooked in the laboratory.
„ Salters Advanced Chemistry 2000 – see Copyright restrictions 122
Using spaghetti to modelpolymer structure
What you do1 Cook some spaghetti, in a saucepan or large beaker, using the
manufacturer's instructions for the amount of water and length of time.2 When cooked, strain the spaghetti so that it is free of water and pour it into
the container.3 Allow it to cool.4 Turn out the solid cake. Sketch the arrangement of spaghetti strands on the
base of the solid cake.The spaghetti acts as a model for the chains in a polymer and the way
they pack together in solid materials.5 Label on your diagram:
i areas where the arrangement resembles a crystalline structureii areas where the arrangement resembles an amorphous structure.
QUESTION
Does the spaghetti model resemble a syntactic or an atacticpolymer? Explain your answer.
In this activity, you will use strands of spaghetti tomodel how the molecules of some polymers arealigned in a solid
PR3
10509-09P118-130-GECKO.LTD 4/3/02 10:11 Page 122

„ Salters Advanced Chemistry 2000 – see Copyright restrictions 123
QUESTIONS
a Which liquids contain molecules that possess dipoles?
b Which groups of atoms in these molecules are responsible for thepolarity?
Deflecting jets
PR5.1 This experiment illustrates the section in ChemicalIdeas 5.3 which is about bond polarity and dipolemoments. You are going to test streams of differentliquids to see whether they are affected by anelectrically-charged rod. If the molecules in the liquidare polar they should be attracted towards the rod.
What you do1 Set up a burette and fill it with one of the liquids provided. (CARE Some of
these liquids are flammable and some have harmful vapours. Take notice ofthe hazard warnings associated with each liquid.) To save time, each groupshould start with a different liquid and the groups should move from buretteto burette during the experiment.
2 Place an empty 250 cm3 beaker under the burette to catch the jet of liquid.You can refill the burette from the beaker at the end of your turn.
3 Charge the ruler by rubbing it vigorously with a piece of dry cloth. A woollensweater is good for this. Then turn on the burette tap so that a jet of liquidflows into the beaker.
4 Bring the ruler towards the jet but do not let them touch (see Figure 1).Observe what happens. Record how much, if at all, the jet of liquid isdeflected, and what this tells you about the structure of the molecule. (Notethat the charged rod can set up induced dipoles in the molecules of theliquid and lead to small deflections with molecules which possess nopermanent dipole. So even molecules with no permanent dipole can givesmall deflections.)
5 Repeat the experiment with the other liquids provided.6 Make out a table like the one that follows, and record your results.
Requirements� burettes (5)� water (50 cm3)� propanone (50 cm3)� ethanol (50 cm3)� cyclohexane (50 cm3)� methylbenzene (50 cm3)� 250 cm3 beakers (5)� plastic rulers (5)� protective gloves
CARE Most of the liquids used are flammable. Theremust be no naked flames in the laboratory while doing thisexperiment.
WARNING Some of the liquids may dissolve plastic, sodo not let them come into contact with the ruler.
WARNING At the end of the activity the liquids must bedisposed of properly, as directed by your teacher. Do notthrow any liquid other than water down the sink.
cyclohexaneHIGHLY
FLAMMABLE
HIGHLYFLAMMABLE
HIGHLYFLAMMABLE
HIGHLYFLAMMABLE
HARMFULmethylbenzene
Figure 1 Deflecting jets of liquids
liquid
charged rod or ruler
beaker
Liquid Structure Effect of charged rod Does the moleculeon jet of liquid possess a permanent
dipole?
ethanol C2H5OH
WEAR EYEPROTECTION
WEARPROTECTIVE
GLOVES
ethanol
propanone
CARE Eye protection anddisposable gloves must
be worn.
10509-09P118-130-GECKO.LTD 4/3/02 10:11 Page 123

„ Salters Advanced Chemistry 2000 – see Copyright restrictions 124
Viscosity in alcohols
This activity requires you to interpret experimentalobservations in terms of the ideas on intermolecularforces you have been reading about.
PR5.2
What you do1 Pour some propan-1-ol into a test-tube so that when it is stoppered there will
be a small air gap left at the top of the liquid.2 Invert the tube and record the time the bubble takes to rise through the
liquid.3 Repeat for the other two alcohols, using the other two test-tubes.
QUESTIONS
Viscosity (how thick or syrupy a liquid is) is a measure of how stronglythe molecules attract each other. In this activity, the molecules mustbe forced apart to allow the bubble to rise.
a Draw structural formulae for the three alcohols you have used.
b Explain your results in terms of the groups contained in the alcoholmolecules and the interactions between them.
Requirements� test-tubes (3)� stoppers (3)� propan-1-ol (10 cm3)� propane-1,2-diol (10 cm3)� propane-1,2,3-triol (10 cm3)� stopclock
CARE Propan-1-ol and propane-1,2-diol are flammable.Keep well away from naked flames.
propan-1-olHIGHLY
FLAMMABLE
HIGHLYFLAMMABLE
WEAR EYEPROTECTION
propane-1,2-diol
CARE Eye protectionmust be worn.
10509-09P118-130-GECKO.LTD 4/3/02 10:11 Page 124

„ Salters Advanced Chemistry 2000 – see Copyright restrictions 125
Now you see it …
PR5.3 Poly(ethenol) is used to make plastic laundry bags foruse in hospitals. The bags dissolve during thewashing, which means that hospital workers do notneed to handle the dirty linen and run the risk ofinfection. This activity introduces you to poly(ethenol),and gives you an opportunity to plan and carry outan investigation.
What you doPlan and carry out an investigation to find out how fast poly(ethenol) filmdissolves in water under different conditions such as might be present in awashing machine.
What recommendations would you make to hospitals about the length of thewash cycle and the temperature of the wash?
Requirements� poly(ethenol) film (hot-water soluble variety – several
small pieces)� 250 cm3 beaker� washing powder� glass rod� Bunsen burner, tripod and gauze� thermometer
WEAR EYEPROTECTION
CARE Eye protectionmust be worn.
10509-09P118-130-GECKO.LTD 4/3/02 10:11 Page 125

„ Salters Advanced Chemistry 2000 – see Copyright restrictions 126
Making ‘slime’
In this activity you will have the opportunity toprepare a novel material and examine its properties.You can then relate these properties to its structure.
PR5.4
What you do1 Put about 50 cm3 of poly(ethenol) solution into the polystyrene cup. Stir the
solution and note its appearance. (A few drops of food colouring orfluorescent dye may be added at this stage.)
2 Add 10cm3 of sodium borate solution and stir the mixture vigorously. Keepon stirring while the mixture is setting. When the mixture has set to a gel,remove it from the cup and continue to shape it with your hands (weargloves).
3 Investigate the properties of the ‘slime’ you have produced and compare itwith the poly(ethenol) solution you started with. ‘Slime’ is not dangerous,but as a precaution you should wear gloves and wash your hands at the endof the experiment.
ExplanationBorate ions in the sodium borate form cross-links between the poly(ethenol)chains:
poly(ethenol) chain
borate borate
poly(ethenol) chain
The forces produced by these cross-links are of a different kind to theintermolecular forces between poly(ethenol) chains. They are also stronger,which allows you to see more clearly the effects of introducing forces betweenpolymer molecules.
SummaryWrite a brief account of the properties of ‘slime’ and describe how they differfrom those of poly(ethenol). Explain your observations in terms of theintermolecular forces which are present.
Requirements� polystyrene drinking cup� sodium borate solution, 4% (10 cm3)� poly(ethenol) solution, 4% (50 cm3)� protective gloves� wooden sticks for stirring (flat-sided ones work best)� 50 cm3 measuring cylinder� 10 cm3 measuring cylinder� green food colouring or fluorescent dye (optional)
WARNING ‘Slime’ spoils carpets and can remove paint.
WEAR EYEPROTECTION
WEARPROTECTIVE
GLOVES
CARE Eye protection andgloves must be worn.
10509-09P118-130-GECKO.LTD 4/3/02 10:11 Page 126
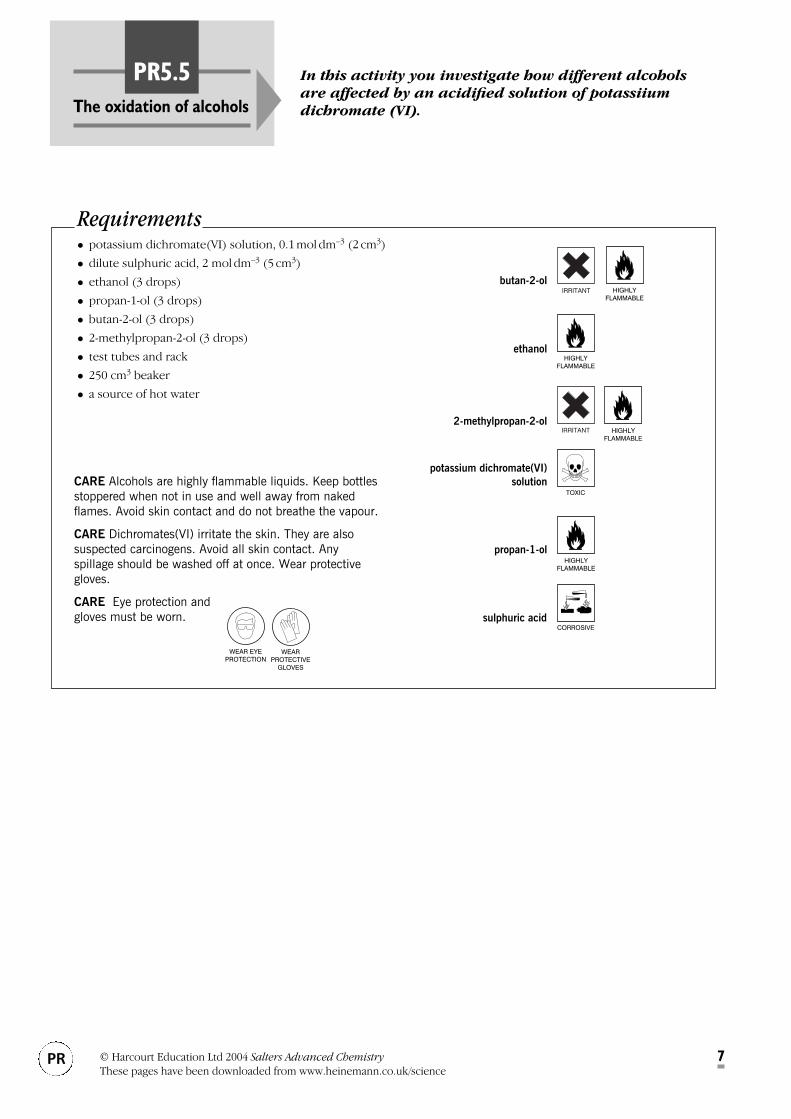
© Harcourt Education Ltd 2004 Salters Advanced ChemistryThese pages have been downloaded from www.heinemann.co.uk/science
7PR
The oxidation of alcohols
PR5.5 In this activity you investigate how different alcoholsare affected by an acidified solution of potassiiumdichromate (VI).
potassium dichromate(VI)solution
propan-1-ol
2-methylpropan-2-ol
ethanol
sulphuric acid
HIGHLYFLAMMABLE
IRRITANT
TOXIC
butan-2-ol
Requirements� potassium dichromate(VI) solution, 0.1 mol dm–3 (2 cm3)� dilute sulphuric acid, 2 mol dm–3 (5 cm3)� ethanol (3 drops)� propan-1-ol (3 drops)� butan-2-ol (3 drops)� 2-methylpropan-2-ol (3 drops)� test tubes and rack� 250 cm3 beaker� a source of hot water
CARE Alcohols are highly flammable liquids. Keep bottlesstoppered when not in use and well away from nakedflames. Avoid skin contact and do not breathe the vapour.
CARE Dichromates(VI) irritate the skin. They are alsosuspected carcinogens. Avoid all skin contact. Any spillage should be washed off at once. Wear protective gloves.
CARE Eye protection and gloves must be worn.
WEAR EYEPROTECTION
WEARPROTECTIVE
GLOVES
HIGHLYFLAMMABLE
CORROSIVE
IRRITANT
HIGHLYFLAMMABLE
HIGHLYFLAMMABLE

8PR
PR5.5THE OXIDATION OF ALCOHOLS
© Harcourt Education Ltd 2004 Salters Advanced ChemistryThese pages have been downloaded from www.heinemann.co.uk/science
Comparing different alcohols1 Place about 1 cm depth of 0.1 mol dm–3 potassium dichromate(VI) solution in
a test-tube. Add 2 mol dm–3 sulphuric acid until the tube is half full. Thendivide this mixture as equally as possible between five test-tubes.
You are going to investigate the effect of this oxidising mixture on a rangeof alcohols, for example ethanol, propan-1-ol, butan-2-ol and2-methylpropan-2-ol.
2 Add 3 drops of one of the alcohols to the oxidising mixture in one of thetubes. Be careful not to add too much alcohol. (CARE Alcohols are highlyflammable. Keep the bottle well away from naked flames.) Label the tube.
3 Repeat step 2 for all the alcohols, using a different tube for each alcohol.4 Warm the mixtures by placing the tubes in a beaker of boiling water.5 Make a note of any changes of appearance of the mixtures in the tubes. Work
out what has happened in each case, and present your results in the form ofa table showing the structural formulae of the alcohols and any productswhich are formed.
QUESTIONS
a There is a pattern in the behaviour of the alcohols towards oxidation.Describe the pattern.
b There are three different structural types of alcohol in this investigation.Suggest why the three types behave differently. Building models of aseries such as butan-1-ol, butan-2-ol and 2-methylpropan-2-ol mighthelp you see more clearly what is happening.

„ Salters Advanced Chemistry 2000 – see Copyright restrictions 127
Poly(pyrrole) – a conducting polymer
PR6 In this experiment you are going to ‘grow’ somepoly(pyrrole) on a nickel electrode and then peel offthe film of polymer so that you can test its conductingproperties. You will only be able to peel the polymeroff if the nickel electrode is very clean and smooth.
What is poly(pyrrole)?The structure of pyrrole is:
Requirements� pyrrole (0.68 g)� copper foil (1 cm wide strip)� nickel spatula� wire wool or emery cloth� ‘Brasso’ metal polish� small pieces of cloth� paper towels� sodium 4-methylbenzenesulphonate solution
(p-toluenesulphonic acid sodium salt solution),0.1 mol dm–3 (200 cm3)
� 250 cm3 beaker� 250 cm3 conical flask� 0–4.7 kW variable resistor� 12 V d.c. supply (in 2 V steps)� ammeter to read 30 mA� razor blades or equivalent� teat pipette� propanone (20 cm3)� crocodile clips� wires� microscope slides� multimeter� 1.5 V light bulb and holder� access to fume cupboard
propanoneHIGHLY
FLAMMABLE
HARMFULpyrrole
IRRITANT
sodium 4-methylbenzenesulphonate
solution
FLAMMABLE
IRRITANT
It contains an unsaturated five-membered ring consisting of four carbon atomsand one nitrogen atom.
Poly(pyrrole) has this structure:
NH
Part 1: Making poly(pyrrole)1 The copper strip should be long enough to reach to the bottom of a 250 cm3
beaker and also loop over the rim of the beaker at the top. This piece ofcopper will be one of your electrodes. Clean it with wire wool or emerycloth, and then rinse it with distilled water.
HN
N
N
N
H
H H
WEAR EYEPROTECTION
CARE Eye protectionmust be worn.
10509-09P118-130-GECKO.LTD 4/3/02 10:11 Page 127
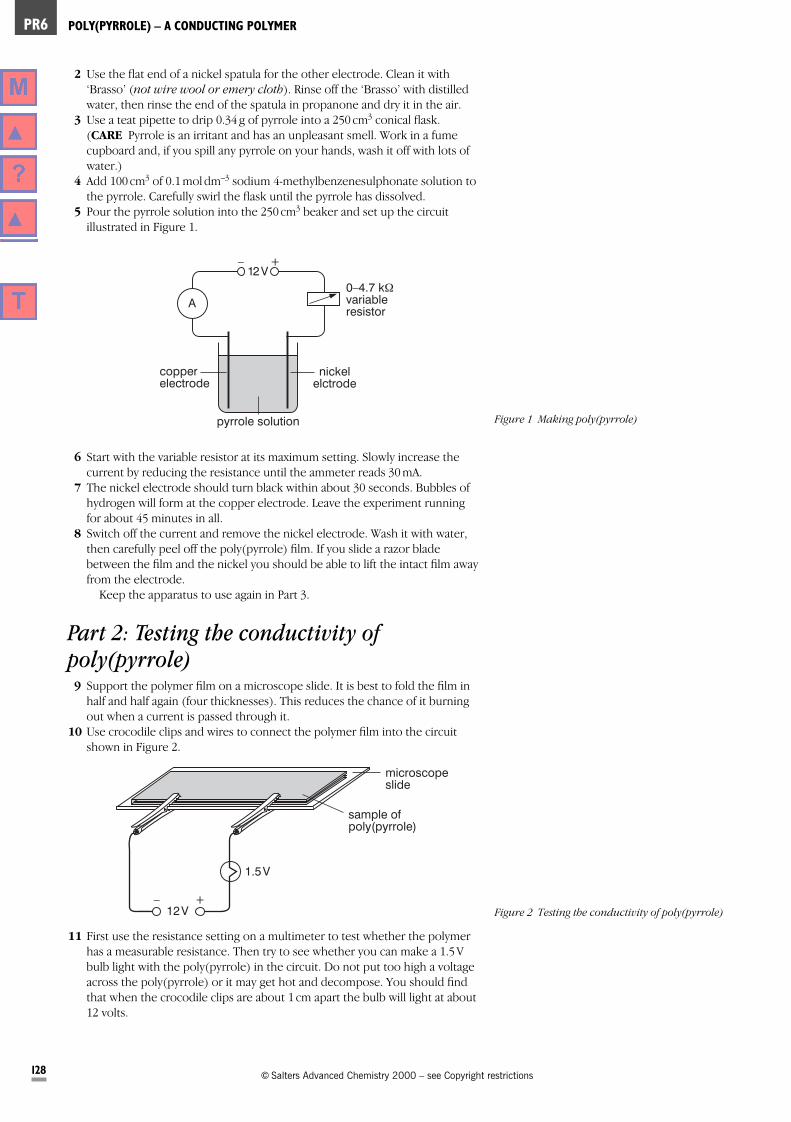
microscopeslide
12 V– +
1.5 V
sample ofpoly(pyrrole)
POLY(PYRROLE) – A CONDUCTING POLYMERPR6
128 „ Salters Advanced Chemistry 2000 – see Copyright restrictions
2 Use the flat end of a nickel spatula for the other electrode. Clean it with‘Brasso’ (not wire wool or emery cloth). Rinse off the ‘Brasso’ with distilledwater, then rinse the end of the spatula in propanone and dry it in the air.
3 Use a teat pipette to drip 0.34 g of pyrrole into a 250 cm3 conical flask.(CARE Pyrrole is an irritant and has an unpleasant smell. Work in a fumecupboard and, if you spill any pyrrole on your hands, wash it off with lots ofwater.)
4 Add 100 cm3 of 0.1 mol dm–3 sodium 4-methylbenzenesulphonate solution tothe pyrrole. Carefully swirl the flask until the pyrrole has dissolved.
5 Pour the pyrrole solution into the 250 cm3 beaker and set up the circuitillustrated in Figure 1.
A
pyrrole solution
nickelelctrode
copperelectrode
12 V– +
0–4.7 kWvariableresistor
Figure 1 Making poly(pyrrole)
6 Start with the variable resistor at its maximum setting. Slowly increase thecurrent by reducing the resistance until the ammeter reads 30 mA.
7 The nickel electrode should turn black within about 30 seconds. Bubbles ofhydrogen will form at the copper electrode. Leave the experiment runningfor about 45 minutes in all.
8 Switch off the current and remove the nickel electrode. Wash it with water,then carefully peel off the poly(pyrrole) film. If you slide a razor bladebetween the film and the nickel you should be able to lift the intact film awayfrom the electrode.
Keep the apparatus to use again in Part 3.
Part 2: Testing the conductivity ofpoly(pyrrole)9 Support the polymer film on a microscope slide. It is best to fold the film in
half and half again (four thicknesses). This reduces the chance of it burningout when a current is passed through it.
10 Use crocodile clips and wires to connect the polymer film into the circuitshown in Figure 2.
Figure 2 Testing the conductivity of poly(pyrrole)
11 First use the resistance setting on a multimeter to test whether the polymerhas a measurable resistance. Then try to see whether you can make a 1.5 Vbulb light with the poly(pyrrole) in the circuit. Do not put too high a voltageacross the poly(pyrrole) or it may get hot and decompose. You should findthat when the crocodile clips are about 1 cm apart the bulb will light at about12 volts.
10509-09P118-130-GECKO.LTD 4/3/02 10:11 Page 128

„ Salters Advanced Chemistry 2000 – see Copyright restrictions 129
PR6POLY(PYRROLE) – A CONDUCTING POLYMER
Part 3: Making a sample of poly(pyrrole)change colour12 Using a clean nickel electrode, set up a fresh experiment to make
poly(pyrrole). Start the experiment and watch it carefully. Switch it off assoon as the nickel electrode looks black. Take the electrode out of theelectrolyte and examine its colour.
13 Put the coated nickel electrode back into the circuit. Reduce the voltagesetting to 2 V and reverse the connections on the power supply so that thenickel strip becomes the negative electrode. Turn the power back on.
QUESTIONS
The poly(pyrrole) will gradually change colour. Take the electrode outof solution and examine its colour over a two-minute period.
a Is poly(pyrrole) as good a conductor as copper wire? How does theconductivity of poly(pyrrole) compare with polymers such aspoly(ethene)?
b What colour is the poly(pyrrole) you made in the first experiment?
c Is it the same colour as the polymer film you made in step 12?
d What colour was the poly(pyrrole) when it first came out of solutionin step 13?
e The poly(pyrrole) gains electrons at the negative electrode in step13. Has it been reduced or oxidised?
f Suggest why the poly(pyrrole) changes back to its original colourwhen it is exposed to air.
10509-09P118-130-GECKO.LTD 4/3/02 10:11 Page 129

„ Salters Advanced Chemistry 2000 – see Copyright restrictions 130
Check your notes on The Polymer Revolution
This activity helps you get your notes in order at theend of this unit.
PR7
Use this list as the basis of a summary of the unit bycollecting together the related points and arranging them ingroups. Check that your notes cover the points and areorganised in appropriate ways. Remember that you will becoming back to many of the ideas in later units. In particularyou will use many of the ideas about properties andstructure in the Designer Polymers unit.
Most of the points are covered in Chemical Ideas, withsupporting information in the Storyline or Activities.However, if the main source of information is the Storylineor an Activity, this is indicated.
� The historical development of addition polymers:discovery of poly(ethene) (Storyline PR2), differentkinds of poly(ethene), Ziegler-Natta catalysts (StorylinePR3), conducting and light-emitting polymers (StorylinePR6) and dissolving polymers (Storyline PR5).
� Some examples of polymers discovered by accident(Storyline in general).
� Use of the terms: polymer, repeating unit and monomer.
� The meaning of the term: addition polymerisation.
� Predicting the structural formula of the addition polymerformed from given monomer(s), and vice versa.
� The use of systematic nomenclature to name alkenes.
� Cis-trans (geometric) isomers.
� The addition reactions of alkenes with the following:bromine, hydrogen bromide, hydrogen in the presence ofa catalyst, and water in the presence of a catalyst.
� The meaning of the terms: addition and electrophile.
� The mechanism of the electrophilic addition reactionbetween bromine and alkenes.
� Whether a molecule is polar or non-polar is determined byits shape and the polarity of its bonds.
� Description and examples of the following types ofintermolecular forces: instantaneous dipole–induceddipole attractions, permanent dipole–permanent dipoleattractions and hydrogen bonding.
� The principal features of the molecular structure of water:bonding and shape of the water molecule and hydrogenbonding in water and ice.
� Explanation of the properties of addition polymers andother substances in terms of intermolecular attractions.
� The meaning of the terms: thermoplastic, thermoset andco-polymer.
� Crystallinity in polymers.
� The relationship between the properties of additionpolymers and aspects of their molecular structure: chainlength, side-groups, chain branching, chain flexibility,cross-linking and stereoregularity.
� The relationship of the properties of a dissolving polymerto its molecular structure (Storyline PR5).
10509-09P118-130-GECKO.LTD 4/3/02 10:11 Page 130
„ Salters Advanced Chemistry 2000 – see Copyright restrictions 134
The origins and development of themodern pharmaceuticalindustry
In this activity your class will divide into three groups. Each group will prepare a short presentationon one of the following topics.1 Folklore in medicine2 Medicine discovery and the nation’s health3 The British pharmaceutical industry
WM1
1: Folklore in medicineA suggested format for your presentation is a discussion between two people,one arguing the case based on your research, for traditional remedies, the otherthe case of someone who does not believe in folk medicine.
The case against might include some of the following points.
� We are civilised now: we don’t believe in medicine men, voodoo andsuperstition.
� Most of these medicines work by ‘the placebo effect’ – people believe themedicines are going to make them better, so they do. Take away the primitivebeliefs and the medicines won’t work.
� In primitive communities it was kill or cure. Any medicine was better thannone.
2: Medicine discovery and the nation’shealthYour group, in addition to searching the Internet, will look at part of theAssociation of the British Pharmaceutical Industry’s publication an A to Z ofBritish Medicines Research, given below and in Figure 1, and at a table of deathsfrom various diseases since 1935 (Table 1).
Here are some of the questions you might like to consider in your researchand presentation.
� Is there a link between trends in deaths from disease and the discovery ofmedicines?
� What other causes of longevity are there as well as improvement of medicines?� What are the main killers today? What will happen when they are tamed?� Is death rate a good measure of the nation’s health? What other measures are
there?
Extract from an A to Z of British Medicines Research
The past fifty years of British medicines research
The past 50 years have seen a revolution in our understanding of disease and itstreatment (Figure 1). It has been a half century in which:� organ transplantation has become accepted as commonplace� the structure of DNA was elucidated, opening the way for the sciences of genetic
engineering and genomics� interferon, the first of a family of naturally occurring molecules called cytokines,
was isolated and named� monoclonal antibodies were discovered, opening the way for the specific
targeting of medicines� smallpox, a centuries-old scourge of mankind, was eradicated from the planet
Finding informationYou are expected to research your topic by searching the Internet. Start bylooking at the Salters Advanced Chemistry web site which will link you to othersites which are relevant. Some suggestions for the focus of your research andhow you might organise your presentation are given below for each topic.
10509-11P134-157-GECKO.LTD 4/3/02 10:13 Page 134

„ Salters Advanced Chemistry 2000 – see Copyright restrictions 135
WM1THE ORIGINS AND DEVELOPMENT OF THE MODERN PHARMACEUTICAL INDUSTRY
� techniques for in vitro fertilisation were developed, bringing family joy to manychildless couples
� AIDS emerged and with it the discovery of a family of human viral pathogenscalled retroviruses, of which HIV is one, leading to entirely new medicines tocontain the virus
� advanced scanning techniques were developed which have transformed thediagnosis and understanding of many human diseases.
Built on these and many other developments, there has also been a revolution inthe number, specificity and safety of human medicines. It is here as much asanywhere that Britain has been in the front line: for the whole of the last half century,medical and medicines research in Britain has been the envy of the world for itsinnovative skills and high ethical standards. Even today, despite increasingpressure on funding and demands for greater safety in medical products, we stillenjoy this reputation. British hospitals are often a first choice for assessing thevalue of new medicines. Many European, Japanese and American ownedpharmaceutical companies choose to fund major research groups here. It is noaccident that today 7 of the top 25 medicines in the world, and 6 of the top 12medicines used to treat bacterial and viral infections, are the products of Britishpharmaceutical research.
But the industry can also be proud of the contribution it makes to the Britisheconomy. UK earnings from the export of medicines exceeded imports by £2.3billion in 1997. On top of that, the industry employs the skills of more than 60 000people, including 20 000 highly-trained scientists and doctors.
Disease 1935 1945 1955 1965 1975 1985 1995
Scarlet fever 499 82 21 1 – – –Whooping cough 1473 689 88 21 12 4 2Diphtheria 3408 694 13 – 1 – 1Measles 1264 728 176 115 16 11 1Typhoid 170 44 15 8 1 – –Tuberculosis (respiratory) 23 840 19 668 5837 2008 722 408 355Syphilis 3521 2378 1385 857 110 40 9Heart disease
(circulatory system) 103 613 127 969 138 313 151 718 299 669 287 054 241 871Cancer 62 602 73 753 91 340 106 474 123 769 141 618 140 791
Total deaths 477 401 481 274 518 864 549 379 582 841 590 734 565 902
Population (million) 40.65 42.63 44.44 47.67 49.47 49.99 51.52
Table 1 Deaths from various diseases in England and Wales, 1935–1995 (The Stationery Office Annual Abstract of Statistics)
A glossary of some of the diseases in the tableScarlet fever Infectious disease. High fever, sore throat. Caused bystreptococcal bacterial infection.
Whooping cough Infectious disease of mucous membrane of air passages.Frequent attacks of convulsive coughing caused by bacteria. Vaccination possible.
Diphtheria Infectious disease causing growth of membrane, often on tonsils,making swallowing difficult. The bacterium produces a toxin. Vaccination beganin 1940.
Measles Viral infection. Causes fever and rash. Vaccine available.
Typhoid A fever with ulceration of skin and bowels. Bacteria carried in sewagewhich is main cause of contagion.
Tuberculosis Disease of lungs and other organs caused by bacteria. Improvedhygiene, vaccination and chest X-rays have helped to minimise its effects.
Syphilis A sexually transmitted (or inherited) disease. Slow to manifest itself.Caused by a spirochaete. Results in death unless checked.
10509-11P134-157-GECKO.LTD 4/3/02 10:13 Page 135

THE ORIGINS AND DEVELOPMENT OF THE MODERN PHARMACEUTICAL INDUSTRYWM1
136 „ Salters Advanced Chemistry 2000 – see Copyright restrictions
19771978 � Birth of Louise Brown after Steptoe and Edwards
develop in vitro Fertilisation� Ranitidine (Glaxo) anti-ulcer treatment discovered
1979 � Smallpox eradicated from the world� Interferon gene first cloned
19801981 � Captopril (Bristol-Myers Squibb) first ACE inhibitor for
high blood pressure1982 � Fluconazole (Pfizer) – key advance in treating fungal
infections1983 � Sir John Vane awarded Nobel Prize for work on
aspirin and prostaglandins� Isolation of HIV as the cause of AIDS� Sumatriptan (Glaxo) – major advance in migraine
1984 � Cholestyramine – trial shows lowering of cholestroland coronary heart disease
� Antibiotic Augmentin (Beecham) launched1985 � Acyclovir (Wellcome) treatment for herpes launched1986 � ACE inhibitor enalapril (MSD) launched for high blood
pressure� Orthoclone (Ortho) for transplantation – first licensed
human monoclonal antibody1987 � Zidovudine (Wellcome) – first AIDS treatment
launched1988 � Lisinopril (ICI/Zeneca) ACE inhibitor for hypertension
and heart failure� Nobel Prize awarded to Sir James Black for
medicines discovery� Diclofenac (Novartis), an anti-inflammatory agent,
launched� Erythropoietin (Janssen-Cilag), natural red blood cell
stimulator, launched in the UK1989 � Omeprazole (Astra) launched for gastric ulcers
� Simvastatin (MSD) launched for lowering blood lipids� Fluoxetine (Eli Lilly) launched for depression
1990 � COX-2, a major new target for anti-inflammatorydrugs, discovered by scientists at Searle
� First gene therapy experiment in a person withadenosine deaminase deficiency
1991 � Filgrastim (Amgen) white blood-cell stimulant, G-CSFlaunched in UK
1992 � Etidronate (Procter & Gamble). First bis-phosphonatein UK for osteoporosis
199319941995 � Lamotrigine (Wellcome) – major advance launched as
monotherapy in epilepsy treatment� Interferon beta-1b (Schering Health Care) – first
treatment for multiple sclerosis1996 � Olanzapine (Eli Lilly) introduced for schizophrenia
� Ropinirole (SmithKline Beecham) launched forParkinson’s
� Saquinavir (Roche) launched – first protease inhibitorfor AIDS in UK
1997 � First medicines for Alzheimer’s disease available –Donepezil (Pfizer) and Tacrine (Parke-Davis)
� Latanoprost (Pharmacia & Upjohn) first prostaglandinanalogue for glaucoma
� Reboxetine (Pharmacia & Upjohn) first noradrenalinereuptake inhibitor for depression
1948 � Pernicious anaemia shown to be caused by Vitamin B12 deficiency
� Antibiotics chloramphenicol and chlortetracycline(the first tetracycline) discovered
1949 � Cortisone shown to be active in rheumatoid arthritis1950195119521953 � DNA double helix discovered by Watson and Crick1954 � First successful kidney transplantation in US1955 � First oral treatment for diabetes introduced
(Germany)19561957 � Interferon first isolated and named by Isaacs and
Lindenman at NIMR, London� Imipramine shown to be effective in depression� Halothane (ICI/Zeneca) anaesthetic gas introduced
19581959 � First semi-synthetic penicillin marketed1960 � Methicillin launched – active against many resistant
bacteria� Metronidazole (Rhône-Poulenc) for parasitic and
anaerobic bacterial infections1961 � Allopurinol (Wellcome) developed for gout and
arthritis1962 � 1961–3 first benzodiazepines (Roche) for depression
� First oral contraceptive launched – Anovlar (ScheringHealth Care)
� Azathioprine (Wellcome) patented for immuno-suppression
1963 � Ampicillin (Beecham) major antibiotic discovered1964 � Ibuprofen/Flurbiprofen (Boots) for arthritis and
inflammation1965 � Propranolol (ICI/Zeneca) a beta-blocker for heart
disease19661967 � Becotide (Allen & Hanbury’s) for asthma
� First heart transplant by Christiaan Barnard in South Africa
1968 � Sodium cromoglycate (Fisons) breakthrough inasthma
1969 � Salbutamol (Glaxo) introduced for asthma1970 � Levodopa (L-dopa) a major advance in Parkinson’s1971 � Mechanism of action of aspirin discovered by
Sir John Vane19721973 � Tamoxifen (ICI/Zeneca) introduced for hormone-
dependent tumours19741975 � Monoclonal antibodies discovered by Kohler and
Milstein (UK)� Clozapine (Novartis) first atypical neuroleptic for
schizophrenia enters clinical trial� Clotrimazole (Bayer) a major advance in treating
fungal infections� Nifedipine (Bayer) for angina and hypertension
1976 � Atenolol (ICI/Zeneca) a beta-blocker introduced forvarious heart conditions
� Cyclosporin (Novartis) a major advance intransplantation
� Cimetidine (SmithKline Beecham) launched for peptic ulcers
Figure 1 Time line of some major discoveries in medicines research 1948–1997
10509-11P134-157-GECKO.LTD 4/3/02 10:13 Page 136

„ Salters Advanced Chemistry 2000 – see Copyright restrictions 137
WM1THE ORIGINS AND DEVELOPMENT OF THE MODERN PHARMACEUTICAL INDUSTRY
3: The British pharmaceutical industrySearch the Internet and look at the data provided (which come from TheAssociation of the British Pharmaceutical Industry).
Here are some of the questions you may wish to address in your research andpresentation.
� How important is the pharmaceutical industry in national terms to theeconomy?
� How has the industry grown over the years?� Into which categories can the products of the industry be usefully divided?� How important is the British pharmaceutical industry internationally?
Med
icin
es a
nd p
harm
aceu
tical
s
Pow
er g
ener
atin
gm
achi
nery
Pet
role
um, e
tc
Che
mic
al m
ater
ials
and
pro
duct
s
Gas
, nat
ural
and
man
ufac
ture
d
Spe
cial
ised
mac
hine
ry
Org
anic
che
mic
als
Dye
ing,
tann
ing
and
colo
urin
g
Sci
entif
ic e
quip
men
t
Ess
entia
l oils
and
per
fum
es
Toba
cco
Bev
erag
es
Trad
e su
rplu
s /1
06 £ 4000
3000
2000
1000
0
Tele
com
mun
icat
ions
Indu
stria
l mac
hine
ry
Figure 1 UK visible trade surpluses in 1998
12 000
2000
Out
put /
106
£
1960 1970 1980 1985 1990 1992 1994 1996 1998
4000
6000
8000
10 000
Over-the-counter (OTC) medicinesExportsNHS sales
Key
Figure 2 British pharmaceutical industry outputby market sectors
Source: Pharma, Facts and Figures, Association of the British Pharmaceutical Industry, 2000
10509-11P134-157-GECKO.LTD 4/3/02 10:13 Page 137

THE ORIGINS AND DEVELOPMENT OF THE MODERN PHARMACEUTICAL INDUSTRYWM1
138 „ Salters Advanced Chemistry 2000 – see Copyright restrictions
Exports Imports Balance Exports per All UK exports/106£ /106£ /106£ employee/£ per employee
/£
1981 852 298 554 12 206 63451982 978 375 603 14 257 70881983 1074 470 604 15 817 79781984 1222 542 680 18 077 94201985 1426 590 835 21 315 10 5201986 1533 679 853 23 991 11 2051987 1621 786 835 24 339 12 7121988 1735 876 859 25 628 13 6751989 2016 1062 955 28 315 15 8161990 2258 1158 1100 31 759 17 8731991 2556 1371 1184 35 104 20 0191992 2993 1663 1330 40 553 21 7441993 3710 2019 1691 53 927 25 1131994 4005 2304 1701 57 705 28 5821995 4939 2812 2126 79 784 31 9251996 5386 3107 2279 91 597 34 3861997 5455 3192 2262 90 912* 35 4961998 5860 3418 2442 97 667*
Table 2 British pharmaceutical trade figures
Exports Imports Trade balance/106£ /106£ /106£
Germany 7741 4179 3562Switzerland 4904 2115 2790UK 5860 3418 2442Ireland 2620 486 2134France 5193 3507 1685Sweden 2142 739 1403Belgium 3056 2380 676Denmark 620 471 150Netherlands 1967 2043 –76Austria 809 1058 –249Italy 2344 2596 –252Finland 138 394 –255Portugal 87 441 –358Greece 70 600 –530Australia 393 988 –596Spain 743 1572 –828Canada 675 1525 –850US 4817 5687 –870Japan 686 1948 –1262
Table 3 World pharmaceutical trade figures, 1998Source: Pharma, Facts and Figures, Association of the British Pharmaceutical Industry, 2000
*Subject to revisionSource: Pharma, Facts and Figures, Association of the British Pharmaceutical Industry, 2000
10509-11P134-157-GECKO.LTD 4/3/02 10:13 Page 138

„ Salters Advanced Chemistry 2000 – see Copyright restrictions 139
Extraction of salicylicacid
WM2 In this activity you can extract some salicylic acid, apharmacologically active compound from a naturalsource, oil of wintergreen, which is obtained in turnfrom the shrub Gaultheriae procumbus. You then learnthe technique of thin-layer chromatography and use itto compare the extract with a pure sample of salicylicacid.
Requirements� oil of wintergreen (2 cm3)� apparatus for heating under reflux (see Figure 1)� sodium hydroxide solution, 2 mol dm–3 (25 cm3)� measuring cylinder (25 cm3)� anti-bumping granules� small Bunsen burner or electric heating mantle� 100 cm3 beakers (2)� ice (if available)� concentrated hydrochloric acid (a few cm3)� Universal Indicator paper� glass rod� Buchner funnel and apparatus for vacuum filtration� watch glass� ethanol (a few cm3)� t.l.c. plates (silica-coated)� small beaker to hold t.l.c. plate� cover for the beaker� solution of salicylic acid in ethanol (1 cm3)� solvent for chromatography – cyclohexane, ethyl
ethanoate, ethanoic acid (200:100:1)� dropping tubes or melting-point tubes (2)� u.v. light source� iodine crystals� aluminium foil or clingfilm
CARE Ultraviolet radiation is harmful to the eyes. Do not look directly at the lamp. Follow the recommended precautions concerning eye protection.
iodine
ethanol
cyclohexane
glacial ethanoic acid
HARMFUL
HARMFUL
IRRITANT
methyl 2-hydroxybenzoate, methyl salicylate
(oil of wintergreen)
sodium hydroxide solutionCORROSIVE
CORROSIVE
CORROSIVE
WEAR EYEPROTECTION
CARE Eye protection must be worn.
HIGHLYFLAMMABLE
ethyl ethanoate
concentrated hydrochloric acid
2-hydroxybenzoic acid(salicylic acid)
HIGHLYFLAMMABLE
HIGHLYFLAMMABLE
FLAMMABLE
ULTRAVIOLETRADIATION
IntroductionThe ester methyl salicylate found in nature can be convertedinto salicylic acid. It is obtained as oil of wintergreen whichused to be made by dry distillation of the leaves of theevergreen shrub Gaultheriae procumbus prevalent in the US.You may be familiar with the smell of the ester for it is presentin many medicinal preparations (for example ‘Deep Heat’ andother similar ointments used to relieve muscle pain).
In this experiment you will obtain salicylic acid from themethyl ester by hydrolysis, using dilute sodium hydroxidesolution.
What you do1 Put about 2 cm3 of oil of wintergreen (CARE Harmful) into
a 50 cm3 pear-shaped flask and add 25 cm3 of 2 mol dm–3
sodium hydroxide solution (CARE Corrosive) togetherwith a few anti-bumping granules.
2 Attach a water condenser to the flask in a vertical position(see Figure 1) and gently heat the mixture under reflux for 30minutes. Make sure the condenser water supply is on. Youcan heat the flask with a small Bunsen flame below a wiregauze or use an electric heating mantle. When the mixture isboiling, condensed droplets should be falling back into theflask at a rate of about 1 drop per second.
10509-11P134-157-GECKO.LTD 4/3/02 10:13 Page 139

EXTRACTION OF SALICYLIC ACIDWM2
140 „ Salters Advanced Chemistry 2000 – see Copyright restrictions
Figure 1 Apparatus for heating under reflux
Figure 2 Apparatus for thin-layer chromatography
water out
water in
anti-bumpinggranules
HEAT
oil ofwintergreen +sodium hydroxidesolution
lidthin-layer plate
salicylic acidsolution
extractfrom oil ofwintergreen
solvent
3 Allow the mixture to cool and pour it into a 100 cm3 beaker surrounded bycold water (and ice, if available). Using a dropper, add concentratedhydrochloric acid drop by drop (CARE Corrosive) until the mixture is acidic.Test the mixture, as you add the acid, with Universal Indicator paper, using aglass rod and small drops of the mixture.
4 Using a Buchner funnel, filter the product using vacuum filtration. Wash thesolid with a little cold water and transfer it to a watch glass.
5 Take a few crystals of the product and dissolve them in a minimum of ethanol.
6 Take a pre-dried thin-layer chromatography plate which will fit into a smallbeaker (see Figure 2). About 1 cm from the bottom of the plate draw a finepencil baseline. On the line place a small spot of the extract from stage 5. Onthe baseline also put a small spot of a solution of salicylic acid in ethanol.The spots are best made using a very fine dropping pipette or a drawn-outmelting-point tube. Apply a small quantity of the solution at a time; let it dry,and then add more. Try not to let the diameter of the drops exceed 5 mm.
7 Place some solvent for the chromatograpy in the beaker to a depth of about5 mm. (CARE Highly flammable. Avoid breathing the vapour.)
8 Place the chromatography plate in the beaker, making sure the solvent isbelow the pencil line on the plate.
9 Cover the beaker, for example with aluminium foil or a watch glass. Leavethe solvent to rise up. This will take about 15–25 minutes.
10 When the solvent has nearly reached the top of the plate, take thechromatogram out of the beaker. (CARE Avoid breathing the solvent vapour.)Place the plate in a fume cupboard and allow the solvent to evaporate.
11 You can locate the positions of the substances on the plate by examining itunder u.v. light. (CARE Do not look directly at the light source.) View theplate by reflected light.
12 Alternatively, place the sheet in another beaker with a few crystals of iodine(CARE Harmful. Avoid skin contact. Use in a fume cupboard.) Cover thebeaker with aluminium foil or clingfilm. The spots which were probably justvisible before should show up more clearly now. After the experiment,dispose of the solvent as directed by your teacher.
+
OHoil of wintergreen
salicylic acid
OC
O
OC
OH
CH3
+ CH3 OH
+
OH
OC
OC
OH
OH
H+
QUESTIONS
a Explain what is meant by heating under reflux.Why is this often necessary when heating organic liquids?
b Why is it necessary to heat the flask for such a long time?
c What do the results from the thin-layerchromatography separation tell you about thecomposition of the extract from oil of wintergreen?
d The equations for the reactions occurring in theexperiment are shown on the right. How couldyou have obtained the methanol formed duringthe experiment if you had wished to use it?
e Suggest why the mixture formed by the hydrolysisof the ester was kept as cool as possible.
10509-11P134-157-GECKO.LTD 4/3/02 10:13 Page 140

© Harcourt Education Ltd 2004 Salters Advanced ChemistryThese pages have been downloaded from www.heinemann.co.uk/science
7WM
Investigating the chemistry of the –OH group in variousenvironments
WM3 The hydroxyl (–OH) group occurs in three types oforganic compound: alcohols, phenols and carboxylicacids. Examples are:
The object of this activity is to investigate thebehaviour of the –OH group in these three compoundsand to compare this with the behaviour of 2-hydroxybenzoic acid (salicylic acid).
CH3 CH2 OH
OH
CH3 C
OH
O
sulphuric acid
methanol
phenol
iron (III) chloride
2-hydroxybenzoic acid(salicylic acid)
CORROSIVE FLAMMABLE
TOXIC
CORROSIVE
HIGHLYFLAMMABLE
HIGHLYFLAMMABLE
TOXIC
CORROSIVE
glacial ethanoic acid
ethanol
Requirements� small quantities of:
– ethanol– phenol (saturated solution in water)– ethanoic acid (2 mol dm–3 solution)– glacial ethanoic acid (for test 5)– 2-hydroxybenzoic acid (salicylic acid)
� protective gloves� Universal Indicator solution� iron(III) chloride solid� methanol (5 cm3)� concentrated sulphuric acid (access to bottle)� sulphuric acid, 2 mol dm–3 (5 cm3)� sodium carbonate solution, approximately 0.5 mol dm–3
(200 cm3)� test-tubes� 100 cm3 beakers� source of hot water
CARE Phenol can cause sores and blistering if spilt on theskin. Glycerol, propane-1,2,3-triol, can be applied tocounteract phenol burns.
CARE Alcohols are highly flammable liquids.Keep bottles stoppered when not in use and well awayfrom naked flames.Avoid skin contact and do not breathe the vapour.
WEAR EYEPROTECTION
WEARPROTECTIVE
GLOVES
CARE Eye protection andgloves must be worn.
IRRITANT
IRRITANT
2-hydroxybenzoic acid(salicylic acid)
C
OH
O
OH
ethanol phenol ethanoic acid
AVOIDALL SKINCONTACT

© Harcourt Education Ltd 2004 Salters Advanced ChemistryThese pages have been downloaded from www.heinemann.co.uk/science
8WM
Comparing ethanol, phenol, ethanoic acidand 2-hydroxybenzoic acidLook quickly through the tests you will be doing, and draw up a table to presentyour results.
For each test use 1 cm depth of the sample solution or a small spatula measureof solid.
What you do1 To each of the four substances in turn add a few drops of Universal Indicator
solution, and record the pH value.2 To each of the substances in turn add an equal volume of aqueous sodium
carbonate and warm. Test for any gas evolved.3 Dissolve a small spatula measure of solid iron(III) chloride (CARE Irritant;
stains skin and clothing) in about half a test-tube of water. Divide the solutionequally among four test-tubes and add a small quantity of each substance inturn to the tubes. Record any colour changes.
4 Cautiously smell samples of each of the four substances in turn. Make a noteof their smells.
5 Put 1 cm3 of each substance in turn into a test-tube. In the case of ethanoic acid,use the concentrated (‘glacial’) acid rather than an aqueous solution. (CAREConcentrated ethanoic acid is corrosive and flammable.) Then to each add anequal volume of methanol and a few drops of concentrated sulphuric acid(CARE Corrosive). Warm each tube and its contents gently for a few minutes inhot water in a beaker. Pour the hot solutions into beakers of dilute sodiumcarbonate solution. This neutralises any acid which remains and so removes itssmell. Cautiously smell the contents of the beakers. Note any changes of smell.
QUESTIONS
a Look at the results of the tests for 2-hydroxybenzoic acid. In whatway does it show similarities to those for the other compounds?
b What conclusion can you draw about the environments of the –OHgroups in 2-hydroxybenzoic acid?
What do you do if the organicmaterial catches fire?
Do not panic!
Place the test-tube in the rack and place awet cloth over the top.
Do not run around with the test-tube on fire.
Do not use a fire extinguisher for a smallfire in a test-tube.
WM3INVESTIGATING THE CHEMISTRY OF THE –OH GROUP IN VARIOUS ENVIRONMENTS

„ Salters Advanced Chemistry 2000 – see Copyright restrictions 144
Interpretation of themass spectrum of salicylic acid
WM4 In this activity you will practise some of the ideas youare learning about mass spectrometry, and see howchemists can identify a substance from its massspectrum.
Before starting the activity you should be familiarwith the technique of mass spectrometry. If necessary,read about this in Chemical Ideas 6.5.
This activity guides you through a sequence of steps which a chemist could takewhen using mass spectra data to confirm the structure of a substance extractedfrom willow bark and given the name salicylic acid. You can record the evidence asyou acquire it on the Information Sheet (Mass spectrum data). Rememberresearch chemists, when publishing their findings, must supply as much evidenceas possible to confirm the structure they propose for a compound even if, whenmore limited evidence is available, they already feel confident about the structure.
Finding possible formulae1 Look first at Figure 1, the mass spectrum of salicylic acid. Measure the
relative abundance of the six marked peaks. Record the mass and abundance of each peak in the appropriate box towards the bottom of the Information Sheet.
2 Decide which of these peaks gives the molecular mass of the compound.
A computer database can list the possible molecular formulae that will fit this value.There can of course be a very large number. One limited database gives 38compounds for this molecular mass. Add this number to the Information Sheet.
Using isotope peaks to establish theformulaThe number of possible compounds can be reduced by using the high-resolution mass spectrum facility. For the willow bark extract this gives anaccurate molecular mass of 138.0317. In the same database there are only twocompounds with this value: they are C2H7ON4Cl and C7H6O3. Add these possiblemolecular formulae to the Information Sheet.
Naturally occurring carbon consists of a mixture of isotopes. Most carbon is 12C,but 13C is present as 1.1% of the sample. If the active chemical in the extractcontains one carbon atom in its molecule, the molecular ion peak at a mass Mshould be accompanied by another peak at M+1 with approximately 1.1% theintensity of the molecular ion peak. Two carbons will give rise to an M+1 peak ofapproximately 2.2% relative intensity, and so on.
This means that for one carbon atom, the ratio of the intensities of M : M+1peaks will be 98.9 : 1.1; for two carbon atoms the ratio will be 97.8 : 2.2, and so on.
Figure 1 The mass spectrum of salicylic acid100
Inte
nsity
/ %
80
60
40
20
00 40 80 120 16020 60 100 140
Mass
39 6364
92
120
138
10509-11P134-157-GECKO.LTD 4/3/02 10:13 Page 144

„ Salters Advanced Chemistry 2000 – see Copyright restrictions 145
WM4INTERPRETATION OF THE MASS SPECTRUM OF SALICYLIC ACID
4 Which of these matches the spectrum of salicylic acid? Write the chemicalname and structure of salicylic acid on the Information Sheet.
Confirming the structure using thefragmentation patternMass spectrometrists can find out a lot about the structure of a molecule bylooking at the fragmentation pattern in the mass spectrum. This provides anadditional way of distinguishing 2-hydroxybenzoic acid from its two isomers, 3-and 4-hydroxybenzoic acid. It may help with this activity to build models of thethree molecules.
5 Using Table 1, write down the peaks in the mass spectrum of 2-hydroxybenzoic acid that are not shared by 3- and 4-hydroxybenzoic acid.
6 Which well-known molecule with Mr = 18 might be lost in the conversion:
138 (the whole molecule) Æ 120
in 2-hydroxybenzoic acid?7 What are the two most likely ways in which the molecule in 6 can arise from
2-hydroxybenzoic acid? Show this by ringing the relevant atoms on drawingsof the structure of the molecular ion of 2-hydroxybenzoic acid (Figure 3).
8 3- and 4-hydroxybenzoic acid do not have the same fragmentation patternbecause they cannot form an ion of mass = 120. Explain why this ion cannotform.
Table 1 Mass spectra of the three hydroxybenzoicacids
Figure 3 The molecular ion of 2-hydroxybenzoicacid
O
OH
C
OH +
Using a database to establish which isomerit isA web site, which supplies mass spectra of compounds, indicates that there arethree isomers with the molecular formula C7H6O3. The mass spectra of thesecompounds provides the following information.
2-hydroxybenzoic acidPeak 120 92 138 64 39 63Intensity 100 73 39 19 14 14
3-hydroxybenzoic acidPeak 138 121 93 65 39 91Intensity 100 75 23 16 12 12
4-hydroxybenzoic acidPeak 121 138 65 93 39 63Intensity 100 83 24 22 18 10
Inte
nsity
/ %
Mass
100
80
60
40
20
00 20 40 60 80 100 120 140 160
39.0232
53.0037
64.0370
91.9868
120.0211
138.0317
Figure 2 A more accurate version of the mass spectrum of salycylic acid
3 Figure 2 gives a more accurate mass spectrum for salicylic acid. Thisspectrum shows any isotope peaks which exist. The intensities of themolecular ion peaks have been accurately measured and are given on theInformation Sheet.
10509-11P134-157-GECKO.LTD 4/3/02 10:13 Page 145

INTERPRETATION OF THE MASS SPECTRUM OF SALICYLIC ACIDWM4
146 „ Salters Advanced Chemistry 2000 – see Copyright restrictions
Information Sheet: Mass spectrum data
Approximate molecular mass(found by fast, low-resolution scan)
Number of possible molecular formulae
Accurate molecular mass(measured by slower, high-resolution scan)
Possible molecular formulae
Isotope peaks
A group of peaks starting at the parent ion peak, due to isotopes of carbon. These peaks may be small on the spectrum, but are given here scaled up so that the largest peak in this group has abundance 100.
Molecular ion peak = 100% Indicated number of carbon atoms:M + 1 peak = 8.2%
Six largest peaks in the spectrum
Mass
Relative abundance
Identity of this sample
10509-11P134-157-GECKO.LTD 4/3/02 10:13 Page 146
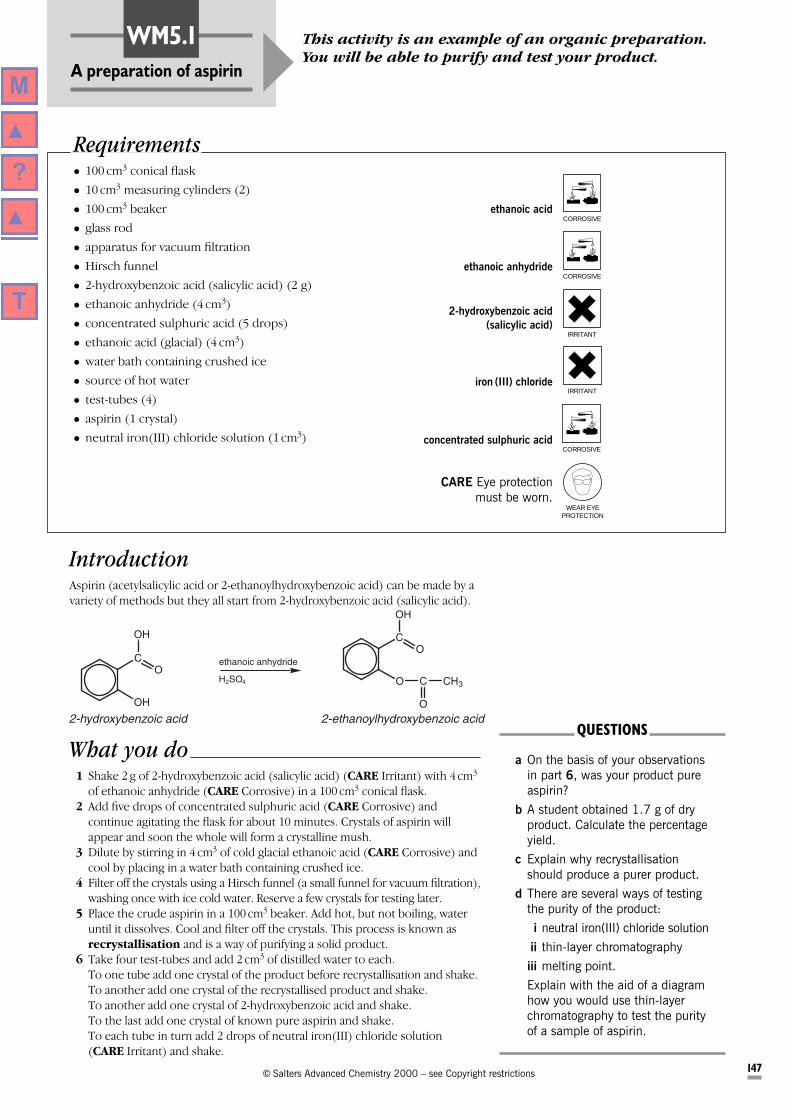
„ Salters Advanced Chemistry 2000 – see Copyright restrictions 147
A preparation of aspirin
This activity is an example of an organic preparation.You will be able to purify and test your product.
WM5.1
IntroductionAspirin (acetylsalicylic acid or 2-ethanoylhydroxybenzoic acid) can be made by avariety of methods but they all start from 2-hydroxybenzoic acid (salicylic acid).
Requirements� 100 cm3 conical flask � 10 cm3 measuring cylinders (2)� 100 cm3 beaker� glass rod� apparatus for vacuum filtration� Hirsch funnel� 2-hydroxybenzoic acid (salicylic acid) (2 g)� ethanoic anhydride (4 cm3)� concentrated sulphuric acid (5 drops)� ethanoic acid (glacial) (4 cm3)� water bath containing crushed ice� source of hot water� test-tubes (4)� aspirin (1 crystal)� neutral iron(III) chloride solution (1 cm3) concentrated sulphuric acid
2-hydroxybenzoic acid(salicylic acid)
iron (III) chloride
CORROSIVE
CORROSIVE
CORROSIVE
WEAR EYEPROTECTION
ethanoic acid
ethanoic anhydride
CARE Eye protectionmust be worn.
What you do1 Shake 2 g of 2-hydroxybenzoic acid (salicylic acid) (CARE Irritant) with 4 cm3
of ethanoic anhydride (CARE Corrosive) in a 100 cm3 conical flask.2 Add five drops of concentrated sulphuric acid (CARE Corrosive) and
continue agitating the flask for about 10 minutes. Crystals of aspirin willappear and soon the whole will form a crystalline mush.
3 Dilute by stirring in 4 cm3 of cold glacial ethanoic acid (CARE Corrosive) andcool by placing in a water bath containing crushed ice.
4 Filter off the crystals using a Hirsch funnel (a small funnel for vacuum filtration),washing once with ice cold water. Reserve a few crystals for testing later.
5 Place the crude aspirin in a 100 cm3 beaker. Add hot, but not boiling, wateruntil it dissolves. Cool and filter off the crystals. This process is known asrecrystallisation and is a way of purifying a solid product.
6 Take four test-tubes and add 2 cm3 of distilled water to each.To one tube add one crystal of the product before recrystallisation and shake.To another add one crystal of the recrystallised product and shake.To another add one crystal of 2-hydroxybenzoic acid and shake.To the last add one crystal of known pure aspirin and shake.To each tube in turn add 2 drops of neutral iron(III) chloride solution(CARE Irritant) and shake.
QUESTIONS
a On the basis of your observationsin part 6, was your product pureaspirin?
b A student obtained 1.7 g of dryproduct. Calculate the percentageyield.
c Explain why recrystallisationshould produce a purer product.
d There are several ways of testingthe purity of the product:
i neutral iron(III) chloride solution
ii thin-layer chromatography
iii melting point.
Explain with the aid of a diagramhow you would use thin-layerchromatography to test the purityof a sample of aspirin.
ethanoic anhydride
H2SO4
2-hydroxybenzoic acidOH
OC
OH
2-ethanoylhydroxybenzoic acid
OC
OH
O C CH3
O
IRRITANT
IRRITANT
10509-11P134-157-GECKO.LTD 4/3/02 10:13 Page 147

For this activity you will need to refer to the characteristic i.r. absorptionfrequencies given in the Data Sheets.
Aspirin, 2-ethanoylhydroxybenzoic acid, is manufactured commercially fromphenol by the following route:
Step 1
Step 2
QUESTIONS
a The i.r. and mass spectra of compounds A, B and C are given inFigures 1–3 on the next sheet. Identify, with as much explanation as possible, which set of spectra(Figure 1, 2 or 3) corresponds to each of the compounds A, B and C.
b Use the data of % composition by mass, given in Table 1, toconfirm your answer to part a.
Table 1 Composition by mass
„ Salters Advanced Chemistry 2000 – see Copyright restrictions 148
Using spectroscopy
WM5.2 In this activity you will analyse the infrared and massspectra of some organic molecules used in thesynthesis of the medicine, aspirin.
OH OH
OC
OH
CO2+1. NaOH; heat under pressure
2. HCl(aq)
phenol (A) 2-hydroxybenzoic acid (B)
OH
H3C
H3C C
O
C
O
O
OC
OH
O C CH3
O
ethanoic anhydride aspirin (C)
+ + CH3 OHCOO
C
OH
Compound %C %H %O
Figure 1 60.9 4.3 34.8Figure 2 60.0 4.4 35.6Figure 3 76.6 6.4 17.0
10509-11P134-157-GECKO.LTD 4/3/02 10:13 Page 148

„ Salters Advanced Chemistry 2000 – see Copyright restrictions 149
WM5.2USING SPECTROSCOPY
100 90 80 70
3000
3500
2500
1500
2000
1000
Wav
enum
ber
/ cm
Transmittance / %
100
Intensity / %
80 60 40 20 00
4080
120
160
2060
100
140
Mas
s
3963
64
92
120
138
Figu
re 1
Figu
re 2
Figu
re 3
Wav
enum
ber
/ cm
100
Transmittance / %
90 80 70 60 50 40 3035
0030
0025
0020
0015
0010
0050
0
100
Transmittance / %
90 80 70 60 50 4035
00
Wav
enum
ber
/ cm
3000
2500
2000
1500
1000
500
Mas
s
Intensity / %100 80 60 40 20 0
012
020
018
040
8016
014
010
060
20
43
92
120 13
8
163
180
Intensity / %
100
100
Mas
s
80 60 40 20 00
2040
6080
39
4047
55
65
66
94
10509-11P134-157-GECKO.LTD 4/3/02 10:13 Page 149

„ Salters Advanced Chemistry 2000 – see Copyright restrictions 150
An aspirin assay
WM6 In this activity you will follow the method used byhospital analysts to check the purity of aspirinsamples before they are considered fit to be used onthe wards.
What you do1 Grind up 1 aspirin tablet using a mortar and pestle.2 Transfer as much of the powder as possible into a specimen tube. Weigh the
tube to an accuracy of 1 mg, and record the mass.3 Use a measuring cylinder to place 10 cm3 of 95% ethanol into a 100 cm3
conical flask. Add a few drops of Phenolphthalein indicator. Then add asmuch of the powdered aspirin as you can from the specimen tube.
4 Reweigh the specimen tube to the same accuracy as before and record themass.
5 Swirl the conical flask carefully until all the aspirin powder has dissolved. Donot allow any of the solution to splash out of the flask.
6 Titrate the solution in the flask with 0.1 mol dm–3 sodium hydroxide solutionfrom a burette (CARE Eye protection must be worn). Record the volumeneeded to produce the first tinge of pale pink colour in the indicator. Thismeasures the end-point of the titration.
7 Repeat the procedure at least once more, starting with a fresh aspirin tablet.
CalculationThe equation for the reaction used in the assay is:
Requirements� aspirin tablets (300 mg)� mortar and pestle� specimen tubes (3)� access to a balance� 100 cm3 conical flask� 95% ethanol (30 cm3)� 10 cm3 measuring cylinder� sodium hydroxide solution, 0.1 mol dm–3 (60 cm3)� burette� Phenolphthalein indicator
ethanolHIGHLY
FLAMMABLE
WEAR EYEPROTECTION
+ NaOH + H2O
CO
O– Na+
O C
O
CH3
CO
OH
O C
O
CH3
Notice that 1 mol of aspirin reacts with 1 mol of sodium hydroxide. (Actually,if you were to heat the reaction mixture, a further reaction would take place andthe ester would be hydrolysed. But at room temperature this does not happen.)
1 mol of aspirin has mass of 180.2 g.Concentration of sodium hydroxide solution = . . . . . . . . mol dm–3
CARE Eye protectionmust be worn.
10509-11P134-157-GECKO.LTD 4/3/02 10:13 Page 150

„ Salters Advanced Chemistry 2000 – see Copyright restrictions 151
WM6AN ASPIRIN ASSAY
8 Calculate the purity of the aspirin tablet, using Table 1.
Assay 1 Assay 2 Assay 3
Mass of specimen tube + aspirin powder/g
Mass of specimen tube after pouring out aspirin powder/g
Mass of aspirin used/g
Volume of sodium hydroxide solution used/cm3
Amount of sodium hydroxide used/mol
Amount of aspirin which reacted with sodium hydroxide/mol
Mass of aspirin which reacted with sodium hydroxide/g
Aspirin in powder used /%
Evaluating your results and proceduresa What is the percentage error in your measurement of the mass of
aspirin used and in the volume of sodium hydroxide solution used?
b Identify any stages in your procedure which could have led to errors.Comment on the range of answers obtained for your three assays.
c Bearing in mind the sources of error you have discussed above, howmany significant figures do you think you are justified in using forthe percentage of aspirin in the powder?
9 Accurately weigh one aspirin tablet. Use your assay results to calculate themass of aspirin contained in the tablet. Suggest why the mass of the tabletand the mass of aspirin may be different. Why do you think the tablets aredescribed as ‘300 mg’ tablets?
Table 1
10509-11P134-157-GECKO.LTD 4/3/02 10:13 Page 151

„ Salters Advanced Chemistry 2000 – see Copyright restrictions 152
Which product should a pharmaceutical company develop?
In the exercise that follows, you are asked to take onthe role of a manager in a pharmaceutical companyhelping to make decisions about which products yourcompany should develop.
WM8
General informationIt is a very long process from the initial discovery of a compound which hassome pharmacological activity to the final marketing of a medicine. At any onetime, several different compounds may be available for further development, butthe process is so expensive that a company must select only a limited number ofcompounds for further investigation.
Policies are reviewed at regular intervals and the progress of work on any onecompound will be scrutinised at several key stages of development.
In this exercise, you need to be organised into groups which representdifferent management groups in a company. Some of the groups will make an‘initial technological and economic appraisal’ of two potential pharmaceuticals;the other groups will make a ‘second technological and economic appraisal’ ofthe same two compounds.
Initial technological and economic appraisalThis is the stage at which the compounds under review have been identified,synthetic routes have been established and some preliminary testing for activityand toxicity is complete. The research division of the company have put forwardtwo compounds, AP1011 and H2202, to be considered for further development.
You must consider the evidence available and produce, for each of thesecompounds, a summary of the arguments for and against taking up the option offurther development work. Since the company budget may only allow for workon one of these, you should also recommend which seems the more promisingcompound to develop.
Second technological and economic appraisal This comes after further development has been carried out. For the purpose ofthe exercise, it is assumed that the company adopted both compounds at theearlier stage and has since completed clinical trials and further studies of thebehaviour of the compound in the body. Once again, the available evidencemust be examined to produce a summary of the points for and againstproceeding with each of the compounds, and you must recommend whichshould be developed and marketed.
When the evaluations have been completed, groups which have made theinitial appraisal should compare their conclusions with groups which made thesecond appraisal.
10509-11P134-157-GECKO.LTD 4/3/02 10:13 Page 152

„ Salters Advanced Chemistry 2000 – see Copyright restrictions 153
WM8WHICH PRODUCT SHOULD A PHARMACEUTICAL COMPANY DEVELOP?
Initial technological and economic appraisalTechnical information on compound AP1011
This compound has antipyretic (fever-reducing) and analgesic (pain-relieving)properties and so may be suitable for conditions such as toothache, headache,neuralgia, sciatica, period pains and pains in ligaments, muscles and joints. It alsoreduces swelling and pain in arthritis and rheumatic fever. There is some evidencethat it may inhibit blood-clotting.
Preparation and stability AP1011 may be synthesised simply in two stages, bothwith high yield, from readily available and cheap raw materials. It seems likely thatscaling-up of this synthesis will present no major problems. Estimated cost oflarge-scale production is approximately 20p per 100 g. AP1011 has already beenshown to be stable in dry conditions for over two years.
It must be administered by mouth and can be formulated into tablets or as powderfor dispersal in water.
Action AP1011 is a drug precursor in that it is hydrolysed in the stomach andsmall intestine to form an active metabolite which is absorbed through theintestinal wall into the bloodstream.
Indications from preliminary trials No major side-effects have been found. Thereis no evidence of carcinogenic effects. The compound may produce stomachirritation and causes nausea, vomiting and/or stomach bleeding in a few cases.
Overdose can lead to a number of symptoms, including confusion and respiratoryproblems.
The LD50 is estimated to be 1750 mg/kg of body weight.*
* The toxicity of a compound is tested by finding the dose which will kill 50% of atrial group of animals (usually rats). The dose is measured in terms of thenumber of milligrams of compound per kilogram of body weight of the animal.
Initial technological and economic appraisal Technical information on compound H2202
This compound has mild sedative and hypnotic (sleep-inducing) effects and couldthus fill the gap between mild pain-relieving sedatives like paracetamol and thebenzodiazepines like Valium and Mogadon, which can be addictive with prolongeduse.
Preparation and stability Synthesis is by a two-stage process from benzene-1,2-dicarboxylic acid and glutamic acid. Both are currently manufactured asintermediates in the production of other compounds. Scaling-up is likely to bemoderately complex and the predicted cost is about £7.00 per 100 g.
The compound should be taken by mouth and can be made up into tablets. It isstable in storage.
Action H2202 is hydrolysed by the body reforming benzene-1,2-dicarboxylic acid,glutamic acid and ammonia.
Indications from preliminary trials Side-effects are almost nil. H2202 shows notoxic effects (even on fairly extreme overdose), and does not affect the liver orkidneys.
Prolonged high dosage can lead to slight disturbance of the nervous system, butthis is reversed on reduction of the dose.
The LD50 is estimated to be 5000 mg/kg of body weight.*
* The toxicity of a compound is tested by finding the dose which will kill 50% of atrial group of animals (usually rats). The dose is measured in terms of thenumber of milligrams of compound per kilogram of body weight of the animal.
10509-11P134-157-GECKO.LTD 4/3/02 10:13 Page 153

WHICH PRODUCT SHOULD A PHARMACEUTICAL COMPANY DEVELOP?WM8
154 „ Salters Advanced Chemistry 2000 – see Copyright restrictions
Second technological and economic appraisalTechnical information on compound AP1011
AP1011 has both antipyretic (fever-reducing) and analgesic (pain-relieving)properties. It is recommended for conditions involving ‘mild’ pain, includingtoothache, headache, neuralgia, sciatica, period pains and pains in ligaments,muscles and joints. For these purposes the dose rate is 600–900 mg repeatedevery 3–4 hours to a maximum of 4 doses in any 24 hours.
It has been shown to be remarkably effective in reducing swelling and pain inarthritis and rheumatic fever. For these purposes higher doses of up to 4 g per day(with corresponding increase in side-effects) may be needed.
It also has an effect of inhibiting blood-clotting and so may be used in low dose(100–200 mg per day) in inhibiting thrombosis.
Manufacture, storage and distribution AP1011 can be prepared on the semi-technical scale (kilogram quantities) in high purity and good yield. The predictedmanufacturing cost is 35p per 100 g. There are no problems with large-scalesupply of feedstock chemicals of adequate purity.
The suggested presentations are as tablets or powders (which can be dispersed inwater) containing 300 mg each. Both these forms and the bulk compound arestable indefinitely under dry storage conditions.
Predicted cost per normal daily dose compared with some competitor drugs (basedon use as analgesic):
AP1011 1pPanadol 6pParacetamol 2p
AP1011 must be administered by mouth and can be formulated into tablets or aspowder for dispersal in water.
Action AP1011 is hydrolysed in the stomach and small intestine to form an activecompound which is absorbed through the intestinal wall into the bloodstream.
It acts by inhibiting the synthesis of prostaglandins (PGs). These are complexcyclic carboxylic acids and are identified by letter labels (PGE, PGF, etc.). Theyhave many functions, among which are production of redness, heat, swelling andpain. Reductions in these symptoms are therefore experienced after taking themedicine. Some aspects of blood-clotting are also affected by prostaglandins,hence AP1011 is of use in inhibiting thrombosis.
Side-effects/contra-indications AP1011 appears effective and relatively safe inuse. Long-term use does not lead to tolerance* or dependence†.
AP1011 has no effect on the central nervous system, liver or kidneys except inoverdose. It can produce stomach bleeding, but this is in small amount and usuallyunnoticed by the patient (normal persons may experience slight stomach bleedingwithout taking the medicine).
0.2% of the population are intolerant of the compound and up to 28% of chronicasthma sufferers may have a bout of asthma brought on by using it.
Blood disorders such as anaemia can be caused in some patients, mainly as aresult of blood loss. These cases recover on removal of the medicine and whereessential symptoms may be controlled using iron tablets.
If taken during early pregnancy, AP1011 may induce abortion.
Cases of prolonged labour and excess bleeding in mother and baby at birth havebeen attributed to the medicine.
No tumour-inducing or carcinogenic effects related to the medicine have beenobserved.
The LD50 is estimated to be 1750 mg/kg of body weight.‡
Care should be taken when prescribing to patients already taking other medicines.
Symptoms of overdose are tinnitus (ringing in the ears), dizziness, confusion andrespiratory problems.
AP1011 lowers blood-clotting ability and can produce longer bleeding times afterwounds, but this effect is of benefit in the prevention of thrombosis.
* ‘Tolerance’ refers to the ability of the body to build up resistance to a compoundso that larger and larger doses are needed to produce a given effect.
† Addiction to the compound.‡ The toxicity of a compound is tested by finding the dose which will kill 50% of a
trial group of animals (usually rats). The dose is measured in terms of thenumber of milligrams of compound per kilogram of body weight of the animal.
10509-11P134-157-GECKO.LTD 4/3/02 10:13 Page 154

„ Salters Advanced Chemistry 2000 – see Copyright restrictions 155
WM8WHICH PRODUCT SHOULD A PHARMACEUTICAL COMPANY DEVELOP?
Second technological and economic appraisalTechnical information on compound H2202
H2202 is a mild sedative and hypnotic (sleep-inducing) drug. It fills the gapbetween mild pain-relieving sedatives such as paracetamol, and benzodiazepineslike Valium and Mogadon which are addictive with prolonged use. H2202 isneither addictive nor toxic in overdose.
It is especially useful as a sedative during labour but can also be given to womenwho complain of nervousness, inability to sleep, or morning sickness duringpregnancy. It also has more general uses for mild sleep induction.
Dose rate as a sedative is 25 mg up to three times a day.
As a hypnotic, dose rate is up to a maximum of 200 mg.
Manufacture, storage and distribution A satisfactory semi-technical scaleproduction process has been established and no difficulty is foreseen in scaling thisup for full production. The process is relatively simple, but the eventual cost ofmanufacture is estimated as about £35 per 100 g, mainly due to the cost of usingmanufactured chemicals as feedstocks.
H2202 is administered by mouth in tablet form. Normal tablet-forming equipmentcan be used to produce tablets in two presentations, containing either 25 mg or100 mg of the active compound each.
Both the tablets and the bulk compound are stable in dry storage.
The principal competitors (e.g. Mogadon and Valium) are addictive. H2202 is non-addictive and has a substantially higher LD50.*
Action H2202 is a white crystalline solid. It is hydrolysed in the body givingbenzene-1,2-dicarboxylic acid, glutamic acid and ammonia. The mode of action inthe body is not yet fully understood.
Side-effects/contra-indications In many patients there are no side-effects fromsmall doses over short periods. Some patients experience one or more of thefollowing side-effects: giddiness, nausea, shivering, constipation or symptomssimilar to a ‘hangover’. In a few cases effects on circulation are reported producingcoldness or ‘pins-and-needles’ in hands or feet. These effects clear up on removalof the medicine.
At high dosage, disturbance of the central nervous system can take place andtrembling is noticeable. Dosage over a long period can lead to polyneuritis, anervous degeneration which is non-reversible. In pregnant women, H2202 cancross the placenta (the organ in the womb which provides the developing embryowith nutrients), hence there is a possible effect if the medicine is taken during thefirst two months of pregnancy.
* The toxicity of a compound is tested by finding the dose which will kill 50% of atrial group of animals (usually rats). The dose is measured in terms of thenumber of milligrams of compound per kilogram of body weight of the animal.
10509-11P134-157-GECKO.LTD 4/3/02 10:13 Page 155

WHICH PRODUCT SHOULD A PHARMACEUTICAL COMPANY DEVELOP?WM8
156 „ Salters Advanced Chemistry 2000 – see Copyright restrictions
Technical and economic appraisal: management group briefing and evaluation report formAttached to this form are reports from Research Division on compounds for which they have completed preliminary screening since ourlast meeting. Please produce an evaluation of the information for each of these and recommend suitability for further development andclinical trials, using the points which follow.
Compound under evaluation:
1 Activity
a What types of activity are already established?
What symptoms/illnesses/conditions may be treatable?
Is this likely to lead to a large market for the product?
b Are there indications of any other possible types of activity?
What additional uses might result from this?
Does this lead to a large additional potential market?
2 Manufacture, storage, delivery
a Manufacture: comment on likely costs and difficulty
b Stability: will it be possible to hold stocks for a reasonable period?
c Can the medicine be formulated in an attractive and convenient way?
d How will the likely cost compare with competitor medicines?
3 Contra-indications
a Known side-effects:
b Effects of overdose:
c LD50 calculated for average adults (body weight 65 kg)
d Are there any groups of people who should not use the medicine?
4 Risk/benefit ratio
a Do the benefits of using the medicine outweigh the side-effects for the large majority of those likely to use the medicine? (Circle the appropriate balance)
very good / good / acceptable / poor / very poor
5 Cost/benefit ratio
a How does the cost of the treatment compare with the value of its effects?
very good / good / acceptable / poor / very poor
6 Recommendation
a Should we proceed to clinical trials of this compound?
b If so, what special points will need to be evaluated?
c Please compare the potential of this compound with any other considered at this stage, and recommend an order of preference for development funding.
10509-11P134-157-GECKO.LTD 4/3/02 10:13 Page 156

© Harcourt Education Ltd 2004 Salters Advanced ChemistryThese pages have been downloaded from www.heinemann.co.uk/science
10WM
Check your notes onWhat’s in a Medicine?
This activity helps you get your notes in order at theend of this unit.
WM9
Use this list as the basis of a summary of the unit bycollecting together the related points and arranging them ingroups. Check that your notes cover the points and areorganised in appropriate ways. Remember that you will becoming back to many of the ideas in later units.
Most of the points are covered in the Chemical Ideas,with supporting information in the Storyline or Activities.However, if the main source of information is the Storylineor an Activity, this is indicated.
� Be able to recognise members of the followinghomologous series: phenols, acyl chlorides and esters.
� The use of systematic nomenclature to name carboxylicacids and esters.
� The acidic nature of carboxylic acids.
� The reactions of alcohols with carboxylic acids to formesters.
� The characteristic properties of phenols, including: acidicnature, test with iron(III) chloride solution, and reactionwith acyl chlorides to form esters.
� The increasing relative strengths as acids of alcohols,phenols and carboxylic acids.
� The technique of heating under reflux for reactionsinvolving volatile liquids (Activity WM2).
� The technique of thin-layer chromatography (t.l.c.) andthe interpretation of results (Activity WM2).
� How the following forms of spectroscopy can be used forthe elucidation of molecular structure: mass spectrometry(m.s.) and infrared spectroscopy (i.r.).
� The interpretation of mass spectra (molecular ion andsignificance of the fragmentation pattern) for salicylic acidand simple compounds containing a limited range offunctional groups (hydroxyl, carbonyl, carboxylic acid andester groups).
� The interpretation of infrared spectra for salicylic acid andsimple compounds containing a limited range offunctional groups (hydroxyl, carbonyl, carboxylic acid andester groups).
� How more effective medicines can be obtained bymodifying the structure of existing medicines (StorylineWM5).
� The procedures used in developing and establishing thesafety of a medicine (Storyline WM8 and ActivityWM8).