Chemistry Education Research and...
23
This journal is © The Royal Society of Chemistry 2016 Chem. Educ. Res. Pract. Cite this: DOI: 10.1039/c6rp00200e Development and evaluation of a chemistry- specific version of the academic motivation scale (AMS-Chemistry) Yujuan Liu, a Brent Ferrell, b Jack Barbera* c and Jennifer E. Lewis* ad Fundamentally concerned with motivation, self-determination theory (SDT) represents a framework of several mini-theories to explore how social context interacts with people’s motivational types categorized by degree of regulation internalization. This paper aims to modify an existing theory-based instrument (Academic Motivation Scale, or AMS) and provide validity evidence for the modified instrument (Academic Motivation Scale-Chemistry) as a measure of seven types of student motivation toward chemistry. The paper explores how motivation as measured by AMS-Chemistry is related to student academic achievement and attendance. In a pilot study, the unmodified AMS showed good reliability, reasonable data fit, and the ability to detect motivational differences by sex in college chemistry courses. Based on the pilot study results, expert panel discussions, and cognitive interviews with students, the Academic Motivation Scale – Chemistry (AMS-Chemistry) was developed. AMS-Chemistry was administered to university students in a first semester general chemistry course twice within a semester. An examination of validity evidence suggested that the AMS-Chemistry data could be used to investigate student motivation toward chemistry. Results showed students were extrinsically motivated toward chemistry on average, and there was an overall motivational difference favoring males with a medium effect size. Correlation studies showed motivation was not associated with academic achievement at the beginning of the term, but intrinsic motivation subscales (to know, to experience, and to accomplish) were positively associated with academic achievement at the end of the term. Results also showed that students who persisted in class attendance scored higher on intrinsic motivation subscales than those who did not persist. The 28-item AMS-Chemistry is easy to administer and can be used to better understand students’ motivation status and how it might change across the curriculum. Faculty interested in promoting student intrinsic motivation may also use the AMS-Chemistry to evaluate the impact of their efforts. Introduction In a report to the President by the President’s Council of Advisors on Science and Technology (PCAST) (2012), universities in the United States are called on to produce one million addi- tional college graduates with degrees in science, technology, engineering, and mathematics (STEM) over the next decade if the United States is to retain its historical preeminence in science and technology. The same report points out that one of the three aspects of a student’s experience that affects persistence in STEM is motivation, which is a complex construct and is often accessed from different (or multiple) theoretical perspectives (Koballa and Glynn, 2007), such as social-cognitive theory (Pintrich et al., 1993; Glynn et al., 2009, 2011), expectancy-value theory (Wigfield, 1994; Wigfield and Eccles, 2000), and self-determination theory (Deci and Ryan, 2000, 2008). Motivation has been linked to student learning (Chiu and Chow, 2010; Yen et al., 2011; Gonzalez and Paoloni, 2015). Motivation has also been identi- fied as one of the factors that can affect students’ scientific literacy (Glynn et al., 2011; Vaino et al., 2012), and the need to enhance students’ scientific literacy has been well-established (American Association for the Advancement of Science (AAAS), 1993; National Research Council (NRC), 1996; OECD, 2009; EURYDICE, 2011; Lam and Lau, 2014). Therefore, research on student motivation should be promoted to help us better understand how to improve scientific literacy as well as students’ persistence in STEM areas. Indeed, motivation has been highly valued by researchers because of its consequences (Deci and Ryan, 2000). Studies have shown positive effects of a Department of Chemistry, University of South Florida, Tampa, FL, USA b Department of Natural Sciences and Mathematics, Lee University, Cleveland, TN, USA c Department of Chemistry, Portland State University, Portland, OR, USA. E-mail: [email protected] d Center for the Improvement of Teaching & Research on Undergraduate STEM Education, University of South Florida, Tampa, FL, USA. E-mail: [email protected] Received 1st October 2016, Accepted 21st November 2016 DOI: 10.1039/c6rp00200e www.rsc.org/cerp Chemistry Education Research and Practice PAPER Published on 21 December 2016. Downloaded on 03/01/2017 13:55:21. View Article Online View Journal
Transcript of Chemistry Education Research and...
This journal is©The Royal Society of Chemistry 2016 Chem. Educ. Res. Pract.
Cite this:DOI: 10.1039/c6rp00200e
Development and evaluation of a chemistry-specific version of the academic motivation scale(AMS-Chemistry)
Yujuan Liu,a Brent Ferrell,b Jack Barbera*c and Jennifer E. Lewis*ad
Fundamentally concerned with motivation, self-determination theory (SDT) represents a framework of
several mini-theories to explore how social context interacts with people’s motivational types
categorized by degree of regulation internalization. This paper aims to modify an existing theory-based
instrument (Academic Motivation Scale, or AMS) and provide validity evidence for the modified
instrument (Academic Motivation Scale-Chemistry) as a measure of seven types of student motivation
toward chemistry. The paper explores how motivation as measured by AMS-Chemistry is related to
student academic achievement and attendance. In a pilot study, the unmodified AMS showed good
reliability, reasonable data fit, and the ability to detect motivational differences by sex in college
chemistry courses. Based on the pilot study results, expert panel discussions, and cognitive interviews
with students, the Academic Motivation Scale – Chemistry (AMS-Chemistry) was developed. AMS-Chemistry
was administered to university students in a first semester general chemistry course twice within a semester.
An examination of validity evidence suggested that the AMS-Chemistry data could be used to investigate
student motivation toward chemistry. Results showed students were extrinsically motivated toward chemistry
on average, and there was an overall motivational difference favoring males with a medium effect size.
Correlation studies showed motivation was not associated with academic achievement at the beginning of
the term, but intrinsic motivation subscales (to know, to experience, and to accomplish) were positively
associated with academic achievement at the end of the term. Results also showed that students who
persisted in class attendance scored higher on intrinsic motivation subscales than those who did not persist.
The 28-item AMS-Chemistry is easy to administer and can be used to better understand students’ motivation
status and how it might change across the curriculum. Faculty interested in promoting student intrinsic
motivation may also use the AMS-Chemistry to evaluate the impact of their efforts.
Introduction
In a report to the President by the President’s Council ofAdvisors on Science and Technology (PCAST) (2012), universitiesin the United States are called on to produce one million addi-tional college graduates with degrees in science, technology,engineering, and mathematics (STEM) over the next decade ifthe United States is to retain its historical preeminence in scienceand technology. The same report points out that one of the threeaspects of a student’s experience that affects persistence in STEMis motivation, which is a complex construct and is often accessed
from different (or multiple) theoretical perspectives (Koballa andGlynn, 2007), such as social-cognitive theory (Pintrich et al., 1993;Glynn et al., 2009, 2011), expectancy-value theory (Wigfield, 1994;Wigfield and Eccles, 2000), and self-determination theory(Deci and Ryan, 2000, 2008). Motivation has been linked tostudent learning (Chiu and Chow, 2010; Yen et al., 2011;Gonzalez and Paoloni, 2015). Motivation has also been identi-fied as one of the factors that can affect students’ scientificliteracy (Glynn et al., 2011; Vaino et al., 2012), and the need toenhance students’ scientific literacy has been well-established(American Association for the Advancement of Science (AAAS),1993; National Research Council (NRC), 1996; OECD, 2009;EURYDICE, 2011; Lam and Lau, 2014). Therefore, research onstudent motivation should be promoted to help us betterunderstand how to improve scientific literacy as well as students’persistence in STEM areas. Indeed, motivation has beenhighly valued by researchers because of its consequences(Deci and Ryan, 2000). Studies have shown positive effects of
a Department of Chemistry, University of South Florida, Tampa, FL, USAb Department of Natural Sciences and Mathematics, Lee University, Cleveland,
TN, USAc Department of Chemistry, Portland State University, Portland, OR, USA.
E-mail: [email protected] Center for the Improvement of Teaching & Research on Undergraduate STEM
Education, University of South Florida, Tampa, FL, USA. E-mail: [email protected]
Received 1st October 2016,Accepted 21st November 2016
DOI: 10.1039/c6rp00200e
www.rsc.org/cerp
Chemistry EducationResearch and Practice
PAPER
Publ
ishe
d on
21
Dec
embe
r 20
16. D
ownl
oade
d on
03/
01/2
017
13:5
5:21
.
View Article OnlineView Journal

Chem. Educ. Res. Pract. This journal is©The Royal Society of Chemistry 2016
academic motivation on student retention (Lau, 2003; Tinto,2006; Huett et al., 2008; Alivernini and Lucidi, 2011) andstudents’ persistence in science education (Lavigne et al., 2007).The effect of academic motivation on students’ learning andacademic achievement has been studied widely; however, theresults vary across student level, subject matter, and culturalcontext, even when the same tool is used to measure motivation(Taylor et al., 2014). For example, no significant associations werefound between extrinsic or intrinsic motivation and second-yearpsychology students’ grade point average (GPA) for the eightmodules taken in their second and third year at university inthe United Kingdom (Baker, 2004), yet studies of high school andcollege students in Canada and Sweden revealed a persistentlinkage between intrinsic motivation and GPA (Taylor et al., 2014).In one recent case, a relationship between motivation towardchemistry and academic achievement was observed only for onecohort of general chemistry students at a historically Blackcollege in the United States (Hibbard et al., 2016). However,across a range of studies in different learning contexts withdifferent measurement tools, generally students of higher moti-vation are able to do better on knowledge tests and get higherachievement scores. For specific examples, see research withchemistry students from ten different high schools in Turkey(Akbas- and Kan, 2007), with Taiwanese college students in anonline learning environment (Tseng and Tsai, 2010), and withBavarian 10th graders engaged in a one-day outreach laboratoryexperience on plant genetics (Goldschmidt and Bogner, 2016).
Students’ class attendance is a recurring research topicbecause attendance has been found to be an important generalpredictor of academic performance (Crede et al., 2010). Poorattendance patterns predict poorer grades even as early aselementary school in the United States (Morrissey et al., 2014).At the college level, attendance to lectures is one of the factorsassociated with high academic achievement for undergraduatesas disparate as prospective doctors in Saudi Arabia and prospectiveteachers in Sweden (Abdulghani et al., 2014; Alzhanova-Ericssonet al., 2015). However, the relationship between attendance andperformance may not be straightforward. For example, twodifferent studies of the relationship between attendance andacademic performance for microeconomics students, one inItaly and one in Taiwan, drew different conclusions. In bothstudies, individual student attendance was a robust predictor ofacademic performance (Stanca, 2006; Chen and Lin, 2015), butfor the Taiwan study, total attendance – class size on any givenday – was actually negatively associated with performance(Chen and Lin, 2015). One possible confound for attendancestudies is that motivation has long been identified as relating toattendance (Wegge and Kleinbeck, 1993; Devadoss and Foltz,1996; Moore et al., 2008). Indeed, for the Taiwan study, theresearchers surmise that the relationship between motivationand attendance was not sufficiently strong, such that theunmotivated students gained a benefit from attending classbut had a negative impact on their more motivated peers bychanging the overall class environment. A qualitative study ofbusiness students’ reasons for missing lectures at a university inIreland revealed that the majority of rationales could be ascribed
to low motivation (Moore et al., 2008). Research has also foundthat motivation is positively related to attendance for collegesophomores, juniors, and seniors in agriculture-related courses(Devadoss and Foltz, 1996); however, the relationship betweenattendance and motivation for first year college chemistry studentshas not been studied extensively.
With regard to students’ motivational characteristics toward aspecific science domain, there is evidence that even in pre-primaryschool, children express some differences in their motivationtoward different specific tasks and topics (Schunk et al., 2008)and science disciplines (Mantzicopoulos et al., 2008). If themajority of students (about 96%) do not express the wish tostudy chemistry at university, neutral and negative attitudesindicating a low motivation to study and learn chemistry areexpected (Salta and Tzougraki, 2004). Individual interest ina specific content area has, however, been identified as apotentially malleable factor, depending strongly on the socialenvironment (Schiefele, 1991). Some research has indicatedthat gender is the most significant variable influencing atti-tudes towards science/chemistry (Osborne et al., 2003). Femalesare under-represented in science fields (Ong et al., 2011), so it isimportant to investigate females’ motivation status in thecontext of science courses. When looking into female and malesubgroups in different research contexts, a lot of discrepancieswere found. Some studies of the sex effect in Germany (Zieglerand Heller, 2000) and the United States (Desy et al., 2011) foundmales to be generally more motivated in secondary school,while others working in a Greek context found that secondaryschool girls had higher motivation relative to boys (Salta andKoulougliotis, 2015). Student motivation may also change withtime. Studies of attitudes toward science at different timepoints in multiple countries show decreases by age or schoolyear, and the decline may sharply increase for students in theirmid-teens (Osborne et al., 2003). Decreases in student motiva-tion with increasing time in school have been reported foruniversity students in the United States (Brouse et al., 2010).Decreases have also been observed even within a single termfor nursing students in Sweden (Nilsson and WarrenStomberg, 2008) and engineering students in the United States(He et al., 2015).
Motivation toward chemistry specifically is of interest tochemistry instructors and chemistry education researchers.However, the current availability of individual scales to measurestudent motivation in college chemistry is limited (Pintrich et al.,1993; Glynn et al., 2009, Ferrell and Barbera, 2015; Ferrell et al.,2016). Bauer and colleagues (Chan and Bauer, 2014, 2016) usedthe 81-item Motivated Strategies and Learning Questionnaire(MSLQ) (Pintrich et al., 1993) in an entry level general chemistrycourse utilizing a peer-led active learning environment. Theresearchers found that motivation scores, together with otheraffective factors, could be used to identify at-risk students andthat students of high- medium- and low-affective clusters haddifferent learning strategies. The Science Motivation Questionnaire(SMQ) can be administered to science and non-science majors tomeasure motivation toward science including self-efficacy, self-determination, intrinsic motivation, career motivation, and grade
Paper Chemistry Education Research and Practice
Publ
ishe
d on
21
Dec
embe
r 20
16. D
ownl
oade
d on
03/
01/2
017
13:5
5:21
. View Article Online

This journal is©The Royal Society of Chemistry 2016 Chem. Educ. Res. Pract.
motivation (Glynn et al., 2011; Hibbard et al., 2016). Ferrell andBarbera (2015) studied three different constructs (student interest,effort belief, and self-efficacy) connected to the expectancy-valuetheory (Wigfield, 1994; Wigfield and Eccles, 2000) of motivation ingeneral chemistry courses and found that chemistry majorsreported higher levels on the constructs than the non-chemistrymajors. They also explored the relationships among the constructsand with students’ academic achievement (Ferrell et al., 2016).However, no construct of extrinsic motivation was explored. TheMSLQ and SMQ have motivational scales that can be adapted for achemistry context (see, for example, Salta and Koulougliotis, 2015,and Hibbard et al., 2016); however, none of the above instrumentswere designed based on self-determination theory. Clarity regard-ing the theoretical underpinnings of an instrument can preventmiscommunication about the interpretation of specific findings. Inany case, to explore student motivation toward chemistry, it is veryimportant to have a sound assessment that yields reliable andvalid interpretations (Arjoon et al., 2013). While developing aninstrument from scratch is possible, the adaptation of an existingtheory-based instrument is more practical as the modified instru-ment is expected to maintain alignment with theory. The ultimatepurpose of the study is to develop and provide validity evidence fora self-determination-theory-based instrument to explore studentmotivation toward chemistry in college chemistry courses.
Self-determination theory
While most theories have treated motivation as a one-dimensionalconstruct that varies only in amount (Deci and Ryan, 2008),self-determination theory (SDT) has regarded motivation as amultidimensional concept that can vary not only in amount butalso in type (Deci and Ryan, 2000; Ryan and Deci, 2000).
SDT is a broad framework to study human motivation andpersonality (Ryan and Deci, 2000; Baker, 2003; Reeve et al.,2004; Jang et al., 2009; Liu et al., 2014). According to SDT, whencertain basic needs are satisfied, students are more psycholo-gically healthy and intrinsically motivated (Black and Deci, 2000;Vaino et al., 2012; Hagger et al., 2015; Kiemer et al., 2015).SDT makes a basic distinction between intrinsic motivation,extrinsic motivation, and amotivation, with each placed along acontinuum, as shown in Fig. 1. Amotivation, at one end of thecontinuum, is not necessarily accompanied by lack of effort.Amotivation would also describe doing an activity with onlyforced responsibility and no interest at all. Intrinsic motivation,on the other end of the continuum, describes doing an activityout of interest, ‘‘deriv[ing] spontaneous satisfaction from theactivity itself’’ (Gagne and Deci, 2005). Intrinsic motivation hasbeen linked to positive consequences for students. For example,
students who are intrinsically motivated are more likely to per-form better in primary and secondary school (Lepper et al., 2005),more likely to persist in science for high school students(Vallerand et al., 1997; Lavigne et al., 2007) and STEM fields forundergraduates (French et al., 2005; Maltese and Tai, 2011), andless likely to drop out from college (Vallerand, 1992; Allen, 1999;Morrow and Ackermann, 2012).
In the middle of the continuum, human motivation can benonintrinsic but can vary in the degree to which the value andregulation of the active behaviour have been internalized. Oneof the mini-theories within SDT, organismic integration theory,further categorizes extrinsic motivation into four different types(Deci and Ryan, 2000). As shown in Fig. 1, the four typesof extrinsic motivation are external regulation, introjectedregulation, identified regulation, and integrated regulation,ranging from most external to more internal types of regula-tion. External regulation is the least self-determined formand results from external rewards or constraints. Introjectedregulation is more self-determined than external regulation; atthis level people begin to internalize the reasons for theiractions. Identified regulation means that people begin to valueand judge the importance of their actions, and their behaviorbecomes internalized. Integrated regulation is the highest levelof self-determination in the external motivation category.It means that a person’s behavior is fully autonomous. Thislevel is similar to intrinsic motivation. However, integratedregulation is based on the importance of the behavior for theperson’s internalized values, while intrinsic motivation is basedon the person’s inner interests (Reeve et al., 2004).
The learning environment plays an important role in theformation of student motivation (Potvin and Hasni, 2014), andstudents exhibit different characteristics with different types ofmotivation. According to SDT, when teachers are perceived asbeing controlling during their teaching, students are likely tobe less autonomous with respect to studying, a predictionwhich was borne out in a study of secondary schools in Belgium(Soenens et al., 2012). SDT also predicts that, when teachers areperceived as high on autonomy support, students will be moreautonomous with respect to studying, which has also beenobserved in Belgian secondary schools (Vansteenkiste et al.,2012). In an autonomy-supported context, where students areprovided with choices to do different things in class and theinstructors are encouraging, intrinsic motivation will be stimu-lated and maintained (Lepper and Henderlong, 2000; Chirkovand Ryan, 2001; Reeve, 2012). Students who have intrinsicmotivation tend to learn because of their inner curiosity andinterest and are more active in learning (Zimmerman, 2000;
Fig. 1 The self-determination continuum, showing types of motivation and associated types of regulation.
Chemistry Education Research and Practice Paper
Publ
ishe
d on
21
Dec
embe
r 20
16. D
ownl
oade
d on
03/
01/2
017
13:5
5:21
. View Article Online
Chem. Educ. Res. Pract. This journal is©The Royal Society of Chemistry 2016
Deci and Ryan, 2008). Students with high levels of intrinsicmotivation usually learn better, as expressed by higheracademic achievement (Tseng and Tsai, 2010). In a morecontrolled context, where students have few or no choicesregarding class activities, intrinsic motivation will be blockedand extrinsic motivation will be more likely to be developed(Deci and Ryan, 2000). Students who have extrinsic motivationtend to learn or complete assignments because of externalpressure (e.g., my parents want me to learn) or reward (e.g., fora high grade) (Felder and Brent, 2005). In controlled class-room situations accompanied by little external pressure orlittle hope of reward, one can also imagine significant movementtoward amotivation.
Academic motivation scale
The motivation continuum implies that students can havedifferent degrees of the different types of motivation, and SDTsuggests that social contextual events can enhance or diminishintrinsic motivation (Ryan and Deci, 2000). Measuring differ-ences in degree for the different types of motivation would enableresearchers to study motivation in different instructional con-texts and to determine to what extent these relationships arepresent; however, only a few instruments that are based onthe motivational continuum currently exist. For example, thelearning self-regulation questionnaire (srq-learning) has itemsreflecting external regulation, introjected regulation, identifiedregulation, and intrinsic motivation and has been used by manyresearchers in original and modified forms (Ryan and Connell,1989; Goudas et al., 1994; Black and Deci, 2000; Levesque et al.,2004; Vansteenkiste et al., 2004, 2012; Soenens et al., 2012).Scores from the instrument are intended to indicate autono-mous versus controlled motivation, but there are no items tomeasure amotivation or integrated regulation. The SituationalMotivation Scale is intended to measure amotivation, externalregulation, identified regulation, and intrinsic motivation(Guay et al., 2000), but there are no items to measure introjectedregulation or integrated regulation.
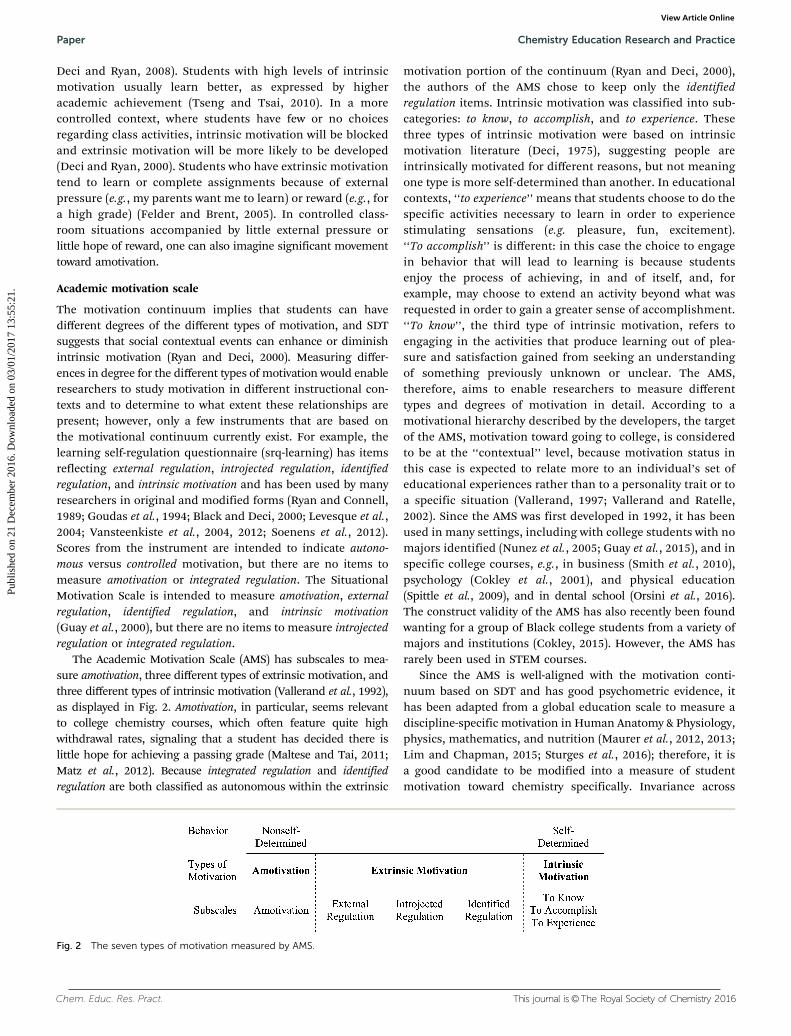
The Academic Motivation Scale (AMS) has subscales to mea-sure amotivation, three different types of extrinsic motivation, andthree different types of intrinsic motivation (Vallerand et al., 1992),as displayed in Fig. 2. Amotivation, in particular, seems relevantto college chemistry courses, which often feature quite highwithdrawal rates, signaling that a student has decided there islittle hope for achieving a passing grade (Maltese and Tai, 2011;Matz et al., 2012). Because integrated regulation and identifiedregulation are both classified as autonomous within the extrinsic
motivation portion of the continuum (Ryan and Deci, 2000),the authors of the AMS chose to keep only the identifiedregulation items. Intrinsic motivation was classified into sub-categories: to know, to accomplish, and to experience. Thesethree types of intrinsic motivation were based on intrinsicmotivation literature (Deci, 1975), suggesting people areintrinsically motivated for different reasons, but not meaningone type is more self-determined than another. In educationalcontexts, ‘‘to experience’’ means that students choose to do thespecific activities necessary to learn in order to experiencestimulating sensations (e.g. pleasure, fun, excitement).‘‘To accomplish’’ is different: in this case the choice to engagein behavior that will lead to learning is because studentsenjoy the process of achieving, in and of itself, and, forexample, may choose to extend an activity beyond what wasrequested in order to gain a greater sense of accomplishment.‘‘To know’’, the third type of intrinsic motivation, refers toengaging in the activities that produce learning out of plea-sure and satisfaction gained from seeking an understandingof something previously unknown or unclear. The AMS,therefore, aims to enable researchers to measure differenttypes and degrees of motivation in detail. According to amotivational hierarchy described by the developers, the targetof the AMS, motivation toward going to college, is consideredto be at the ‘‘contextual’’ level, because motivation status inthis case is expected to relate more to an individual’s set ofeducational experiences rather than to a personality trait or toa specific situation (Vallerand, 1997; Vallerand and Ratelle,2002). Since the AMS was first developed in 1992, it has beenused in many settings, including with college students with nomajors identified (Nunez et al., 2005; Guay et al., 2015), and inspecific college courses, e.g., in business (Smith et al., 2010),psychology (Cokley et al., 2001), and physical education(Spittle et al., 2009), and in dental school (Orsini et al., 2016).The construct validity of the AMS has also recently been foundwanting for a group of Black college students from a variety ofmajors and institutions (Cokley, 2015). However, the AMS hasrarely been used in STEM courses.
Since the AMS is well-aligned with the motivation conti-nuum based on SDT and has good psychometric evidence, ithas been adapted from a global education scale to measure adiscipline-specific motivation in Human Anatomy & Physiology,physics, mathematics, and nutrition (Maurer et al., 2012, 2013;Lim and Chapman, 2015; Sturges et al., 2016); therefore, it isa good candidate to be modified into a measure of studentmotivation toward chemistry specifically. Invariance across
Fig. 2 The seven types of motivation measured by AMS.
Paper Chemistry Education Research and Practice
Publ
ishe
d on
21
Dec
embe
r 20
16. D
ownl
oade
d on
03/
01/2
017
13:5
5:21
. View Article Online

This journal is©The Royal Society of Chemistry 2016 Chem. Educ. Res. Pract.
gender has been found (Grouzet et al., 2006; Caleon et al.,2015), which suggests the use of the AMS to test hypotheses ofgender differences in relation to academic motivation. Thestudies with college students have revealed higher degrees ofself-determination for female students. For example, Vallerandet al. (1992), reported an ANOVA result showing that femalesfrom a Canadian university had significantly higher values forall three intrinsic motivation types, introjected regulation, andidentified regulation; however, the effect sizes were small(d = 0.15–0.34) (Cohen, 1988). The results from a Spanishuniversity sample showed that female students scored signifi-cantly higher on identified regulation and the three scales ofintrinsic motivation, but lower on external regulation thanmale students (Nunez et al., 2005). This study was conductedusing t-tests at an alpha level of 0.01; the effect sizes werebetween 0.31–0.39 (small) except for the to know subscale(d = 0.52, medium). When the participants were pre-chemistryteachers in Turkey, females got higher scores in all motivationtypes; however, the results showed only significant differencesbetween males and females on the to experience subscale(d = 0.56, medium effect size) (Eymur and Geban, 2011).A meaningful difference between males and females has beendetected in elementary pre-service teachers on the subscales ofextrinsic motivation and amotivation (Acisli, 2012). Resultsfrom Spittle et al. (2009), a study based on participants in aregional university in Australia, showed that female studentsscored significantly higher on the to know (d = 0.43) andto accomplish subscales (d = 0.30).
When the participants are college students from the UnitedStates, studies show higher degrees of self-determination forfemale students but with differences on detailed motivationtype through the same t-tests at alpha level of 0.001. A sampleof students (75% undergraduate students, 25% graduate stu-dents) in business courses (Smith et al., 2010) showed signifi-cant differences on amotivation, three extrinsic motivationsubscales, two intrinsic motivation subscales (to know andto accomplish), but the effect sizes were small, ranging from0.09 (to know) to 0.43 (identified regulation). On the other hand,a sample of students enrolled in undergraduate collegepsychology courses showed motivational scores favoringfemales with effect sizes ranging from 0.02 (to experience) to0.40 (identified regulation), but there was no evidence that malestudents and female students differ on any of the motivationtypes, which may be due to a smaller sample size in this study(Cokley et al., 2001). Since the findings regarding differencesbetween males and females are not consistent across context,more studies are needed to explore specific contexts.
Researchers have reported positive relationships betweenintrinsic motivation subscales and academic achievement(Areepattamannil et al., 2011), especially for to know and toexperience subscales (Eymur and Geban, 2011). For studentsin an introductory organic chemistry course, their interest/enjoyment scores, which are regarded as the measure of intrinsicmotivation in the Intrinsic Motivation Inventory (McAuley et al.,1989), were positively correlated with their academic achieve-ment consisting of average grades of four exams and final course
grade (Black and Deci, 2000). Sometimes intrinsic motivationfails to show the expected positive relationship with achievementin chemistry. For example, studies in Slovenia found only weakevidence that intrinsic motivation to learn chemistry is positivelyassociated with elementary students’ (Devetak et al., 2009) orfirst-year pre-service primary school teachers’ (Jurisevic et al.,2008) chemistry achievement. In some cases, both extrinsicand intrinsic motivation have been positively associated withstudents’ overall academic achievement, e.g., for tertiary levelGPA in South Africa (Goodman et al., 2011), but a negativepredictive effect of extrinsic motivation on overall academicachievement has also been observed, e.g., for Indian immigrantadolescents in Canada (Areepattamannil et al., 2011).
General chemistry is challenging (Stuckey et al., 2013;Thomas and McRobbie, 2013; Villafane et al., 2014; Gonzalezand Paoloni, 2015) and students often struggle with thechemistry concepts covered in a typical course (Cooper, 2010).It has also been documented that general chemistry courseshave low retention rates (Lifton et al., 2007; deProphetisDriscoll et al., 2010). Students need to achieve well enough topass this course to register for more advanced chemistry/science courses, and motivation toward chemistry will be apotential variable affecting student academic achievement.Therefore, it is crucial to study motivation in college chemistrycourses to measure the status and changes of student motiva-tion because students of different degrees of self-determinedmotivation may express different degrees of engagement inactivities and different association with academic achievement.In addition, student motivation is likely to change according tothe learning environment. This level of information can helpfaculty and education researchers to understand why generalchemistry is challenging for some students and results inlow retention rates. Having robust information about studentmotivation embedded in a solid base of theory will allowchemistry instructors to make informed decisions regardingthe strategies they use to engage students in learning chemistry.
Research purpose
The present study has several goals. First, in a pilot study, weuse the AMS in college chemistry courses to determine if theAMS functions in those courses according to the theory, andwhether the AMS is sufficiently sensitive to pick up potentialdifferences by sex. Second, we modify the AMS to a theory-based and chemistry-relevant instrument (AMS-Chemistry)through discussions and cognitive interviews, gather additionalvalidity evidence, and proceed with score interpretationregarding student motivation toward chemistry. We note thatthis effort moves the instrument more toward the intent tomeasure a situational level of motivation rather than thecontextual level of the original AMS (Vallerand, 1997; Vallerandand Ratelle, 2002). Finally, we determine how student motiva-tion toward chemistry is associated with lecture attendance andacademic achievement earlier and later in the semester.
In accordance with these goals, the current study addressessix specific research questions. The first two questions relate tothe pilot study with the AMS:
Chemistry Education Research and Practice Paper
Publ
ishe
d on
21
Dec
embe
r 20
16. D
ownl
oade
d on
03/
01/2
017
13:5
5:21
. View Article Online

Chem. Educ. Res. Pract. This journal is©The Royal Society of Chemistry 2016
(1) How does the AMS function with general chemistrystudents? To what extent are the scores aligned with SDT asintended by the measurement model?
(2) What is the ‘‘motivation toward college’’ status of thesestudents as measured by the AMS? When looking at female andmale subgroups, how do they differ on motivation towardcollege?
The remaining four questions concern the AMS-Chemistry:(3) What validity evidence supports the use of a modified
AMS (AMS-Chemistry) to examine ‘‘motivation toward chemistry’’in general chemistry?
(4) What is the motivation toward chemistry status of thesestudents over a semester? When looking at female and malesubgroups, how do they differ on motivation toward chemistry?
(5) How is motivation toward chemistry correlated withstudent academic achievement earlier and later during thesemester?
(6) How is motivation early in the semester associated withstudents’ attendance later in the semester?
Method
The study includes three stages: (1) a pilot study with the AMS,(2) instrument modification and gathering of validity evidencefor the modified instrument (AMS-Chemistry), and (3) scoreinterpretation with the AMS-Chemistry data from generalchemistry students. The details for each stage will be outlinedseparately in the subsequent sections.
Pilot study
The purpose of the pilot study was to make sure the AMSfunctioned in accordance with self-determination theory incollege chemistry courses and therefore was a suitable candi-date to be modified to measure motivation toward chemistry.The AMS (Vallerand et al., 1992) asks:
Why do you go to college?The 28 items measure amotivation, three types of extrinsic
motivation, and three types of intrinsic motivation. Sampleitems include ‘‘For the pleasure that I experience when I feelcompletely absorbed by what certain authors have written’’ and‘‘I don’t know; I can’t understand what I am doing in school’’.A seven-point Likert scale was used, with 1 for ‘‘does notcorrespond at all’’, 2 and 3 for ‘‘correspond a little’’, 4 for‘‘corresponds moderately’’, 5 and 6 for ‘‘corresponds a lot’’,and 7 for ‘‘corresponds exactly’’. Please see Appendix 1 forall items.
Participants
During stage 1, a quantitative approach was used to gatherevidence for internal structure validity and internal consistencyreliability. The pilot study was conducted at a large publicresearch university in the western United States. The AMS wasadministered to general chemistry students during class time inSpring 2012, as a paper and pencil test. The administration took
place during the 9th week of the semester, two weeks afterExam 2 and two weeks prior to Exam 3. Students were given20 minutes to complete the 28-item instrument and demo-graphics form. To ameliorate stereotype threat (Steele andAronson, 1997), the four demographic items were placed at theend of the survey on a separate page. The item formats includedmultiple choice for year in school (four categories plus a freeresponse option), gender (two categories), race/ethnicity (sixcategories plus a free response option), and free response fordeclared major.
Students enrolled in first- and second-semester generalchemistry courses took part in the study. The participants wereadult students (18 years or older). The data were not sensitivein nature and accidental disclosure would not place the parti-cipants at risk; no identifiers linked individuals to theirresponses. Consent to use the student data was gathered usinga cover page on the survey, clearly stating that participationin the study was voluntary and anonymous. A total of 242responses were collected with consent forms from four classes,with a response rate between 60% and 78% in each class. Afterchecking for missing data and careless responses (e.g., thesame response for all the questions), a total of 238 studentshad complete responses to the AMS, which were used for dataanalysis. Among these 238 students, about 3
4 (77.8%) werefreshmen and sophomores, and 60.9% were females. About34 of the students (75.2%) reported to be White. Students werefrom more than 23 majors, including Biological Sciences(29.0%), Sports and Exercise Science (24.7%), Chemistry(12.6%), and Athletic Training (6.3%).
Instrument modification and validity evidence
The AMS-Chemistry is designed to probe course-specific moti-vation and therefore asks students:
Why are you enrolled in this chemistry course?All 28 items were retained from the original AMS and
modified to fit the context of a chemistry course. A five-point-Likert scale is used, with 1 for ‘‘not at all’’, 2 for ‘‘a little’’, 3 for‘‘moderately’’, 4 for ‘‘a lot’’, and 5 for ‘‘exactly’’. In many cases,the word ‘‘chemistry’’ was simply substituted for the word‘‘college’’. With others, more global changes to the wordingwere necessary to make the statements more relevant to achemistry student population. Evidence for content validitywas gathered by having an expert panel, comprised of theauthors of this manuscript and an educational psychologistwith expertise in achievement motivation, review the modifieditems. The AMS-Chemistry items were then used in a series ofstudent interviews to determine if the original intent of theitems were retained, and therefore, if further revisions wereneeded.
Interview participants
In stage 2, students were recruited from a first-semester generalchemistry course at a public university in the western UnitedStates during the fall of 2012. Interview participants wererecruited via an announcement during lecture. In accordance
Paper Chemistry Education Research and Practice
Publ
ishe
d on
21
Dec
embe
r 20
16. D
ownl
oade
d on
03/
01/2
017
13:5
5:21
. View Article Online
This journal is©The Royal Society of Chemistry 2016 Chem. Educ. Res. Pract.
with Institutional Review Board policy, students were informedthat their participation had no impact on their course gradeand that they would be volunteering for a research studyregarding their academic motivations. Interested studentsvolunteered by adding their name to a sign-up sheet passedout and collected by one of the authors (BF). Volunteerswere selected at random and contacted via email to arrange a30 minute interview time-slot. From the pool of volunteers,eleven students were interviewed.
Interview protocol
All interviews took place in a private interview room to ensureboth participant confidentiality and audio quality. Prior tocompleting any of the AMS-Chemistry items, students wereasked about their past experiences in chemistry courses, theirreasons for enrolling in the course, and their perceptions ofhow chemistry relates to their future goals. Following the initialdiscussion, students were asked to complete the AMS-Chemistryinstrument, consisting of 28 items.
Upon completion of the instrument, the students read eachitem aloud and explained their reasoning for the answer choicethey made. If a student’s reasoning did not match their answerchoice, probing questions were asked in order to clarifytheir interpretation of the item and how it matched theiranswer choice and reasoning. This methodology is importantin establishing evidence for the response process validity(Arjoon et al., 2013) of the modified instrument, ensuringproper readability and consistency between students’ answerchoices and reasoning among the target population (Barberaand VandenPlas, 2011). In addition to asking probing questionsregarding a single item and its interpretation, clarity wassought when a student’s response to an item did not matchtheir responses to the other items in the same subscale (e.g.,to experience). As the instrument contains four items per subscale,each item should be measuring similar aspects of student motiva-tion and thus elicit similar responses.
Survey participants
In stage 3, the AMS-Chemistry was administered as a paper-and-pencil survey to students enrolled in one section of generalchemistry. The students were given 10 minutes during lecturetime to complete the 28-item survey. The survey was adminis-tered twice; ‘‘Time 1’’ (fourth week of classes) data was used toinvestigate internal structure, and both ‘‘Time 1’’ and ‘‘Time 2’’data were used for score interpretation. Participants werestudents enrolled in a first semester general chemistry coursefor science majors during Spring 2013 at a large southeasternpublic research university in the United States. The study protocolwas submitted to the Institutional Review Board for review.Standard procedures were followed: students were informed thatresponding to the survey was voluntary and their responses wouldhave no impact on their course grade. To avoid stereotype threat,demographic information (sex, major, year in school, race/ethnicity) was obtained from institutional records.
At Time 1, 222 students took the survey during the fourthweek of classes. 14 students had missing data or careless
responses (e.g., ‘‘3’’ for all the items), which yielded 208students with usable complete data. Of the 208 students,62.0% were females; 25.5% were Biology majors and 33.7%were Biomedical Science majors; 54.3% were White and 19.2%were Hispanic students; and 78.4% were first-year or sophomorestudents.
At Time 2, 100 students took the survey during the 14th weekof classes. Six students had incomplete or all ‘‘3’’ for theirresponses; therefore, 94 students’ responses were available fordata analysis. For the 94 students, 62.8% were female;23.4% were Biology and 38.3% were Biomedical Sciencemajors; 54.3% were White and 20.2% were Hispanic students;and 68.1% were first-year or sophomore students.
The section that participated in the study was from a largerpopulation who were enrolled in the first semester generalchemistry course in Spring 2013 in the institution. Based on theavailable demographic information (Appendices 2–4), studentswho responded to the survey at Time 1 were very similar to allstudents enrolled in terms of sex, race/ethnicity, and priorachievement as determined by standardized tests (e.g., SAT),but a little more representative of sophomores and BiomedicalScience majors. Students who responded to the survey at Time 2were slightly more representative of males, Biomedical Sciencemajors, and juniors.
Chemistry academic achievement measures
There were four instructor-created exams and a final exam inSpring 2013. All of the questions were multiple choice. Exam 1was administered two days after the first administration of theAMS-Chemistry. Exam 3 was administered three days after thesecond administration. Since motivation can change on thebasis of the immediate social context, only Exam 1 and Exam 3grades were used as measures of chemistry academic achievementfor this study.
Data analysis
The quantitative data were evaluated via statistical analyses.For internal structure validity, confirmatory factor analysis(CFA) was conducted on the instrument scores in Mplus 5.2.A minimum of five to ten respondents per item is oftenrecommended for factor analysis (Brown, 2006, p. 413) andall the items were set to load on their assumed factors only. Themodel was identified by fixing the first item on each factor at 1.If the target model is very close to the best possible model, w2
will not be large and significant; however, as w2 is likely to beinflated if a model is based on a large number of scoresin general, additional fit statistics are often examined. TheComparative Fit Index (CFI) varies from 0 to 1 where 1 suggestsa perfect fit for the model. A value 40.95 is consideredadequate fit (Hu and Bentler, 1999), and 40.90 is consideredas acceptable fit (Cheng and Chan, 2003). The Root MeanSquare Error of Approximation (RMSEA) can range from 0 toinfinity and is a measure of the approximate model fit in thepopulation (Steiger, 1990). In general, RMSEA values o0.05are considered close fit and o0.08 are considered reason-able fit (Browne and Cudeck, 1992; MacCallum et al., 1996).
Chemistry Education Research and Practice Paper
Publ
ishe
d on
21
Dec
embe
r 20
16. D
ownl
oade
d on
03/
01/2
017
13:5
5:21
. View Article Online

Chem. Educ. Res. Pract. This journal is©The Royal Society of Chemistry 2016
The standardized root mean squared residual (SRMR) is notsample size dependent. The value ranges from 0 to 1 and is a‘‘badness of fit’’ measure based on the standardized fittedresiduals. By standardizing the residuals, the scale of thevariables is taken into account (Schermelleh-Engel et al., 2003).Hu and Bentler (1995) suggested that an SRMR value ofo0.05 is indicative of good fit and o0.10 is acceptable fit.Based on what is commonly accepted in the literature, we usedthe following cut-off values as an evaluation of reasonablemodel fit beyond the chi-square test statistic: RMSEA o 0.08,SRMR o 0.10, CFI 4 0.90 (Hu and Bentler, 1999; Cheng andChan, 2003).
The internal consistency of the AMS and AMS-Chemistry wasexamined by using Cronbach’s alpha coefficients. A benchmarkof 0.7 (Murphy and Davidshofer, 2005) is usually suggested.The Cronbach’s alpha coefficients for the subscales of AMSwere analyzed through SPSS software version 22.0. Descriptivestatistics of the items and subscales were obtained using SAS9.3. Univariate and multivariate normality, outliers, and homo-geneity of variances were also examined. To examine whetherfemales and males differ on the set of motivational variables,multivariate analysis of variance (MANOVA) and follow-upunivariate analysis of variance (ANOVA) were performed usingSAS 9.3. MANOVA and ANOVA were also conducted to deter-mine if there were any statistically significant differences on theseven subscales by attendance using SAS 9.3. MANOVA wasconducted at an alpha level of 0.05 and the follow-up ANOVAswere conducted at an alpha level of 0.007 (0.05/7) to controltype-1 error. The multivariate assumption tests and outlierassessment results are provided in Appendix 7.
Regarding the qualitative data, all interviews were audiorecorded and transcribed. The transcripts were then coded forsignificant statements and emergent themes, based on eachitem and its corresponding subscale (Creswell, 2007). Thestrategy for coding was guided by the associations betweenthe items and the subscales to which each item belonged (seeAppendix 5 and Table 4 for alignment of items to subscales).This coding scheme allowed for evaluation of how the studentsinterpreted each item within a subscale and how each itemcompared to other items in the same subscale.
ResultsPilot study
The pilot study addressed the first two research questions:(1) how does the AMS function with general chemistry students?and (2) what is the ‘‘motivation toward college’’ status of thestudents?
Validity evidence for AMS internal structure
The internal structure of the data was evaluated to determinewhether the seven-factor proposed model for the AMS functionswell in a general chemistry context. Using the variance–covar-iance matrix for the 28 items, a robust maximum-likelihoodmethod of estimation (Satorra and Bentler, 1994; Bentler, 1995;
Brown, 2006, p. 379) was employed for a confimatory factoranalysis because the data were not normally distributed. Theanalysis yielded fit values of 0.90 for CFI, 0.069 for RMSEA, and0.066 for SRMR, although the proposed model did not reachstatistical nonsignificance (SB w2 = 698.67, df = 329, p o 0.001).The loadings for each item were significant and ranged from0.582 to 0.902.
Correlations between pairs of measured-variable residualswere added to the proposed model after inspection of themodification indices, since similar wording, reverse wording,or formatting in items (Brown, 2006, p. 167), adjacency ofitems, and respondents’ misunderstanding of differencesbetween items/factors could result in correlations between theitem residuals (e.g., Gerbing and Anderson, 1984; Cole et al.,2007). For example, item 11 (For the pleasure that I experiencewhen I read interesting authors) and item 18 (For the pleasure thatI experience when I feel completely absorbed by what certainauthors have written) have similar wording and item format;therefore, the residuals of these two items could highly corre-late with each other. Some students could possibly not be ableto differentiate item 8 (In order to obtain a more prestigiousjob later on) from item 10 (Because eventually it will enable me toenter the job market in a field that I like) since these two itemsboth reflect extrinsic motivation. When four such correlatedresiduals were added to the model, the results showed that themodel fit the data reasonably well: CFI 0.92, RMSEA 0.061,and SRMR 0.060. The new loadings were between 0.586 and0.907 (Appendix 5), the biggest change in loading was 0.1, andthe biggest change in correlation between factors was 0.081,suggesting the added correlations between item residuals hadlittle effect on the model. Although the model still did not reachstatistical nonsignificance (SB w2 = 609.32, df = 325, p o 0.001),the improvement in fit was significant: difference in chi-square89.35, df = 4, p o 0.05. Other more parsimonious models weretried, but the model fit (Appendix 6) was not as good as for theseven-factor model.
Internal consistency for AMS
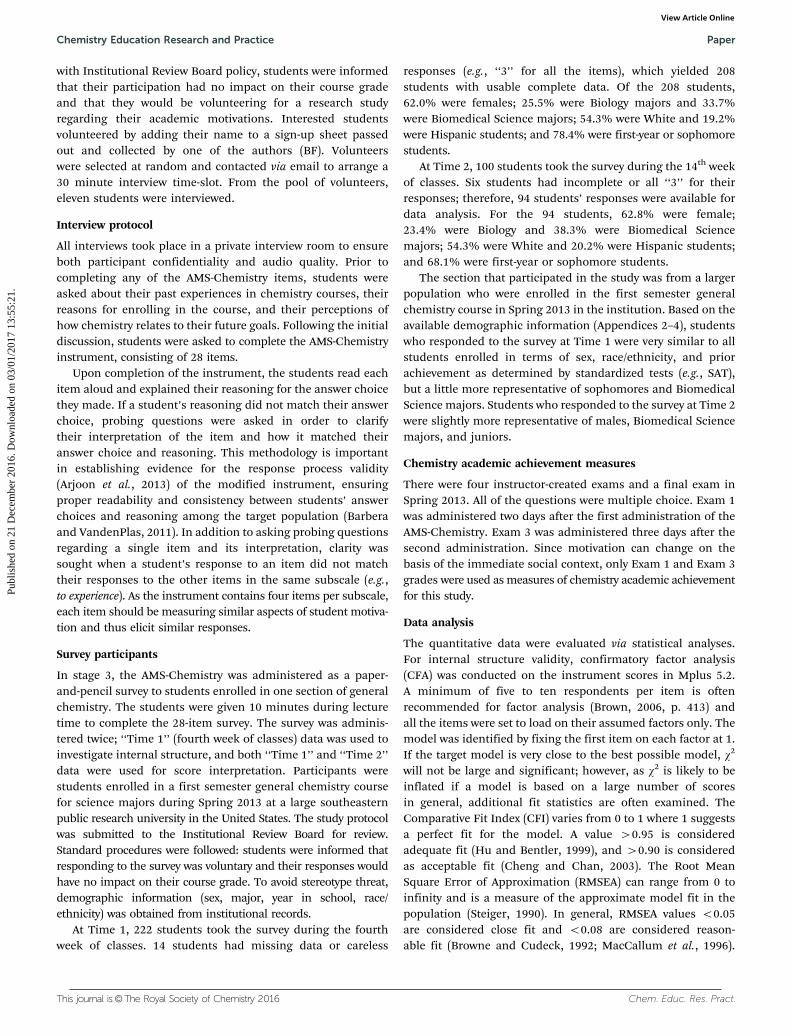
The Cronbach’s alpha coefficients for subscales of AMS aredisplayed in Table 1. For the seven subscales, the alphacoefficients were between 0.77 (identified regulation) and 0.90(amotivation), suggesting the internal consistency was good forall seven subscales.
Both the confirmatory factor analysis and internal consis-tency results provided good psychometric evidence for theseven-factor model of the AMS; therefore, score interpretationusing the model can be supported.
AMS motivation status and sex differences
The Likert-style response options for the AMS items range from1 to 7; a mean greater than 4 for a subscale suggests thestatement corresponds a lot or exactly to the students’ reasonsfor going to college. For six of the subscales, a higher scoreindicates students are more motivated. For amotivation, on thecontrary, a higher score indicates students are less motivated.The mean, standard deviation, skewness, and kurtosis for each
Paper Chemistry Education Research and Practice
Publ
ishe
d on
21
Dec
embe
r 20
16. D
ownl
oade
d on
03/
01/2
017
13:5
5:21
. View Article Online
This journal is©The Royal Society of Chemistry 2016 Chem. Educ. Res. Pract.
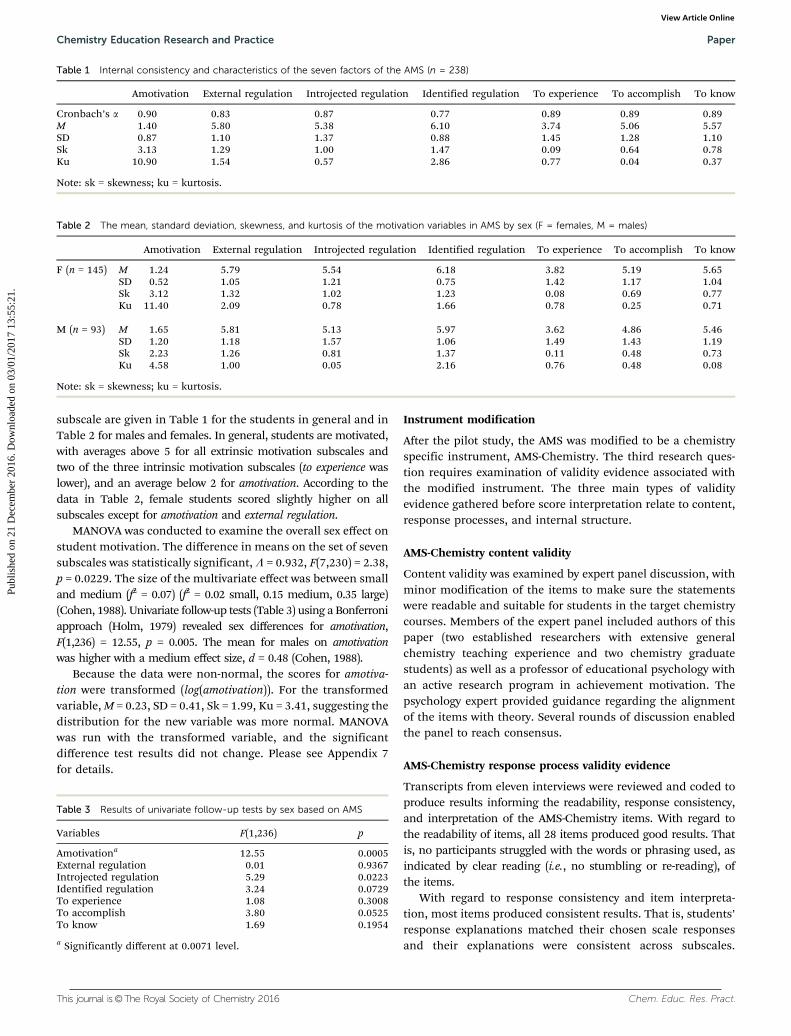
subscale are given in Table 1 for the students in general and inTable 2 for males and females. In general, students are motivated,with averages above 5 for all extrinsic motivation subscales andtwo of the three intrinsic motivation subscales (to experience waslower), and an average below 2 for amotivation. According to thedata in Table 2, female students scored slightly higher on allsubscales except for amotivation and external regulation.
MANOVA was conducted to examine the overall sex effect onstudent motivation. The difference in means on the set of sevensubscales was statistically significant, L = 0.932, F(7,230) = 2.38,p = 0.0229. The size of the multivariate effect was between smalland medium (f2 = 0.07) (f2 = 0.02 small, 0.15 medium, 0.35 large)(Cohen, 1988). Univariate follow-up tests (Table 3) using a Bonferroniapproach (Holm, 1979) revealed sex differences for amotivation,F(1,236) = 12.55, p = 0.005. The mean for males on amotivationwas higher with a medium effect size, d = 0.48 (Cohen, 1988).
Because the data were non-normal, the scores for amotiva-tion were transformed (log(amotivation)). For the transformedvariable, M = 0.23, SD = 0.41, Sk = 1.99, Ku = 3.41, suggesting thedistribution for the new variable was more normal. MANOVAwas run with the transformed variable, and the significantdifference test results did not change. Please see Appendix 7for details.
Instrument modification
After the pilot study, the AMS was modified to be a chemistryspecific instrument, AMS-Chemistry. The third research ques-tion requires examination of validity evidence associated withthe modified instrument. The three main types of validityevidence gathered before score interpretation relate to content,response processes, and internal structure.
AMS-Chemistry content validity
Content validity was examined by expert panel discussion, withminor modification of the items to make sure the statementswere readable and suitable for students in the target chemistrycourses. Members of the expert panel included authors of thispaper (two established researchers with extensive generalchemistry teaching experience and two chemistry graduatestudents) as well as a professor of educational psychology withan active research program in achievement motivation. Thepsychology expert provided guidance regarding the alignmentof the items with theory. Several rounds of discussion enabledthe panel to reach consensus.
AMS-Chemistry response process validity evidence
Transcripts from eleven interviews were reviewed and coded toproduce results informing the readability, response consistency,and interpretation of the AMS-Chemistry items. With regard tothe readability of items, all 28 items produced good results. Thatis, no participants struggled with the words or phrasing used, asindicated by clear reading (i.e., no stumbling or re-reading), ofthe items.
With regard to response consistency and item interpreta-tion, most items produced consistent results. That is, students’response explanations matched their chosen scale responsesand their explanations were consistent across subscales.
Table 1 Internal consistency and characteristics of the seven factors of the AMS (n = 238)
Amotivation External regulation Introjected regulation Identified regulation To experience To accomplish To know
Cronbach’s a 0.90 0.83 0.87 0.77 0.89 0.89 0.89M 1.40 5.80 5.38 6.10 3.74 5.06 5.57SD 0.87 1.10 1.37 0.88 1.45 1.28 1.10Sk 3.13 �1.29 �1.00 �1.47 0.09 �0.64 �0.78Ku 10.90 1.54 0.57 2.86 �0.77 �0.04 0.37
Note: sk = skewness; ku = kurtosis.
Table 2 The mean, standard deviation, skewness, and kurtosis of the motivation variables in AMS by sex (F = females, M = males)
Amotivation External regulation Introjected regulation Identified regulation To experience To accomplish To know
F (n = 145) M 1.24 5.79 5.54 6.18 3.82 5.19 5.65SD 0.52 1.05 1.21 0.75 1.42 1.17 1.04Sk 3.12 �1.32 �1.02 �1.23 0.08 �0.69 �0.77Ku 11.40 2.09 0.78 1.66 �0.78 0.25 0.71
M (n = 93) M 1.65 5.81 5.13 5.97 3.62 4.86 5.46SD 1.20 1.18 1.57 1.06 1.49 1.43 1.19Sk 2.23 �1.26 �0.81 �1.37 0.11 �0.48 �0.73Ku 4.58 1.00 �0.05 2.16 �0.76 �0.48 �0.08
Note: sk = skewness; ku = kurtosis.
Table 3 Results of univariate follow-up tests by sex based on AMS
Variables F(1,236) p
Amotivationa 12.55 0.0005External regulation 0.01 0.9367Introjected regulation 5.29 0.0223Identified regulation 3.24 0.0729To experience 1.08 0.3008To accomplish 3.80 0.0525To know 1.69 0.1954
a Significantly different at 0.0071 level.
Chemistry Education Research and Practice Paper
Publ
ishe
d on
21
Dec
embe
r 20
16. D
ownl
oade
d on
03/
01/2
017
13:5
5:21
. View Article Online
Chem. Educ. Res. Pract. This journal is©The Royal Society of Chemistry 2016
Two items (13 and 14, shown below) required wording changesto address subscale consistency. These wording changes wererelatively minor, but were deemed necessary based on discus-sions with a number of the participants.
Item 13 (original): For the satisfaction I experience whilesucceeding in my academic goals.Item 13 (revised): For the satisfaction I experience whilesucceeding in chemistry.Item 14 (original): Because when I succeed in chemistry Ifeel important.Item 14 (revised): Because when I succeed in chemistry I feelsmart.When several of the students compared these items to
others in the same subscale, there were inconsistencies in theirLikert-scale responses as well as how they interpreted the items.For example, when comparing categorically identical items 6and 13 (to accomplish), one student stated, ‘‘Well, my overallacademic goals are different than my satisfaction with understandingchemistry. I don’t think that those are the same at all.’’
Several other participants had different Likert-scale responsesto items 6 and 13. This repeated discrepancy prompted discussionin almost every interview. We found that most participantsinterpreted ‘‘understanding chemistry’’ (from item 6) differentlythan success in their ‘‘academic goals’’ (from item 13). Because weare interested in how students view their motivation in chemistryspecifically, it is important that the student answers each itemaccording to their experience in the chemistry classroom.Therefore, to focus student responses on their chemistryexperiences the modification from ‘‘my academic goals’’ to‘‘chemistry’’ was made.
The original version of item 14 posed a different problem.Many students were reluctant to choose the Likert responses‘‘corresponds a lot’’ or ‘‘corresponds exactly’’ on this itembecause they viewed the relationship between academicsuccess and self-perception of importance to be negative.One student commented, ‘‘When I read, ‘I feel important’, tome, it sounds like I’m saying, ‘Oh, I know chemistry, I understandchemistry better than you do’ or something. So, I don’t feel thatway.’’ Other students regarded ‘feeling important’ as some-thing with an external origin, a judgment placed on them byothers. This is not consistent with other items in this subscale(introjected regulation), as they are directed toward measuringone’s self-derived reasons for taking the course, independentof others’ views. We feel that the wording change to ‘feelsmart’ is more aligned with other items in the introjectedregulation subscale and places more of a personal dimensionto judging oneself.
All other items were left unchanged based on the responseswe received from the participants. The Likert-scale responsesfor the remaining items and the reasoning given for theresponses seemed to match well for items of the same sub-scale. The changes made above to items 13 and 14 were basedon many similar responses among the participants thatreflected incongruence within a particular subscale. Althoughthere was not total agreement between participant responsesfor the remaining items, no consistent issues were found. In
addition, no problems of poor readability were reported forany of the items; therefore, none of the phrasing requiredmodification. The final items in AMS-Chemistry are displayedin Table 4.
AMS-Chemistry internal structure validity evidence
The dataset at Time 1 was used to examine the internalstructure validity of the AMS-Chemistry. For all the 28 items,the skewness is between 1.63 and �1.47, and kurtosis is between2.04 and�0.90 except for item 5 (Sk = 1.87, Ku = 3.13), suggestingthe data is approximately normally distributed; therefore, maxi-mum likelihood was used to conduct confirmatory factor analysis.For the seven-factor internal structure, the loadings as shown inTable 4 for each item are significant and range from 0.617 to 0.908except that item 12 has a standardized loading of 0.430. The CFIvalue (0.94) as displayed in Table 5 met the suggested criterion ofgreater than 0.90, the SRMR value (0.058) met the suggestedcriterion of smaller than 0.08, and RMSEA value (0.059) met thesuggested criterion of smaller than 0.06. Although the model didnot reach statistical nonsignificance (w2 = 565.33, df = 329,p o 0.001), the results showed that this model is very close tothe true underlying model of the data.
Two parsimonious models were tried to test the robustnessof the seven-factor model. The five-factor model has amotivation,external regulation, introjected regulation, identified regulation, andintrinsic motivation (comprising to experience, to accomplish, and toknow), while the one-factor model groups all 28 items into onefactor. The results showed that the seven-factor model showedthe best fit. The five-factor model also showed good fit indices;however, the w2 change of 54.01 with a change of degrees offreedom of 11 suggested that the seven-factor model fits the datasignificantly better than the five-factor model. Therefore, the seven-factor model is more appropriate for data interpretation. Thesample size (n = 94) at Time 2 was too small for confirmatoryfactor analysis as a minimum of five to ten respondents per item isoften recommended for factor analysis (Brown, 2006, p. 413);therefore, CFA was not conducted at Time 2.
Internal consistency reliability
The internal consistencies of the subscales were estimated byCronbach’s alpha coefficients. Results showed satisfactorylevels of internal consistency at both Time 1 and Time 2 as shownin Table 6. Regarding the seven subscales, the alpha coefficientswere between 0.74 and 0.91. At Time 2, the alpha coefficients werebetween 0.79 and 0.90 for the seven subscales. The psychometricevidence suggested that the scores from AMS-Chemistry weresufficiently reliable and valid for our interpretation.
AMS-Chemistry score interpretation
The quantitative data gathered at Time 1 and Time 2 was alsoused to address research questions 4–6 regarding studentmotivation status at the two time points, possible differencesbetween male and female students, and relationships withacademic achievement and attendance.
Paper Chemistry Education Research and Practice
Publ
ishe
d on
21
Dec
embe
r 20
16. D
ownl
oade
d on
03/
01/2
017
13:5
5:21
. View Article Online

This journal is©The Royal Society of Chemistry 2016 Chem. Educ. Res. Pract.
General motivation status
We hypothesized that the students in our sample would bemore likely to be extrinsically motivated than intrinsicallymotivated as only about 1% declared a major in Chemistry,with the majority (about 60%) majoring in Biology or Bio-medical Science. Regarding students’ motivation structure,the means of the subscales were examined. The Likert-styleresponse options for the AMS-Chemistry items range from 1to 5; a mean greater than 3 for a subscale indicates thestatements tended to correspond a lot or exactly to the students’reasons for enrolling in this chemistry course.
Motivation structure earlier in the semester. When the AMS-Chemistry was administered at Time 1, the skewness values forthe subscale scores were between �0.88 and 1.30 (Table 7), andkurtosis values were between �0.63 and 1.51; therefore, thesubscale scores were approximately normally distributed. Themean of amotivation was 1.64, suggesting that students weregenerally motivated to enroll in the first semester of generalchemistry. The three extrinsic motivation subscales had meansgreater than 3 with the highest mean for identified regulation
Table 4 Standardized loading from the confirmatory factor analysis of AMS-Chemistry (n = 208)
Item Factor loading Statement
Factor: amotivationQ5 0.868 Honestly, I don’t know; I really feel that I am wasting my time taking chemistry courses.Q12 0.430 I once had good reasons for taking chemistry courses; however, now I wonder whether I should continue.Q19 0.652 I don’t know why I take chemistry courses, I couldn’t care less about them.Q26 0.631 I don’t know; I can’t understand what I am doing taking chemistry courses.
Factor: external regulationQ1 0.683 Because without having taken chemistry I would not find a high-paying job later on.Q8 0.867 In order to obtain a better job later on.Q15 0.859 Because I want to have a well-paying career.Q22 0.832 In order to have a better salary later on.
Factor: introjected regulationQ7 0.837 To prove to myself that I am capable of succeeding in chemistry.Q14 0.867 Because when I succeed in chemistry I feel smart.Q21 0.767 To show myself that I am an intelligent person.Q28 0.883 Because I want to show myself that I can succeed in studying chemistry.
Factor: identified regulationQ3 0.745 Because I think that chemistry courses will help me better prepare for the career I have chosen.Q10 0.625 Because taking chemistry will enable me to enter the job market in a field that I like.Q17 0.636 Because taking chemistry courses will help me make more informed choices about my career options.Q24 0.824 Because I believe that chemistry courses will improve my skills in my chosen career.
Factor: to experienceQ4 0.807 For the feelings I experience when I am communicating chemistry ideas to others.Q11 0.752 For the pleasure that I experience when I perform chemistry experiments.Q18 0.725 For the enjoyment I experience when I think about the world in terms of atoms and molecules.Q25 0.905 For the satisfaction I experience while learning about various chemistry topics.
Factor: to accomplishQ6 0.872 For the satisfaction I experience while improving my understanding of chemistry.Q13 0.818 For the satisfaction I experience while succeeding in chemistry.Q20 0.862 For the satisfaction I feel as I work toward an understanding of chemistry.Q27 0.835 Because chemistry courses allow me to experience satisfaction in my quest for knowledge.
Factor: to knowQ2 0.697 Because I experience pleasure and satisfaction while learning new things.Q9 0.866 For the pleasure I experience when I learn new things about chemistry.Q16 0.908 For the pleasure that I experience in broadening my knowledge about chemistry.Q23 0.617 Because studying chemistry allows me to continue to learn about things that interest me.
Table 5 Fit indices of the confirmatory factor analysis of AMS-Chemistry(n = 208)
w2 df w2 change Ddf CFI SRMR RMSEA
Seven-factor 565.33 329 54.01 11 0.94 0.058 0.059Five-factor 619.34 340 0.93 0.061 0.063One-factor 1655.44 350 0.69 0.118 0.134
Table 6 Internal consistency reliability for the seven factors of the AMS-Chemistry
Cronbach’s alpha
Time 1 (n = 208) Time 2 (n = 94)
Amotivation 0.74 0.86External regulation 0.88 0.90Introjected regulation 0.90 0.83Identified regulation 0.79 0.79To experience 0.88 0.88To accomplish 0.91 0.90To know 0.86 0.84
Chemistry Education Research and Practice Paper
Publ
ishe
d on
21
Dec
embe
r 20
16. D
ownl
oade
d on
03/
01/2
017
13:5
5:21
. View Article Online

Chem. Educ. Res. Pract. This journal is©The Royal Society of Chemistry 2016
(3.94). The three intrinsic motivation scales had means equal orlower than 3, and to experience showed the lowest mean of 2.45.These results appear to be consistent with the hypothesis.
Motivation structure later in the semester. When the AMS-Chemistry was administered at Time 2, the absolute values ofskewness and kurtosis for the subscale scores were less than1, so the data were approximately normally distributed. Forthe 94 students (Table 7), the means of the subscales showedthat students were still motivated to be enrolled in thiscourse, as the mean of amotivation was 1.81. Students stillscored higher on extrinsic motivation subscales (meansbetween 3.13 and 3.68) than on intrinsic motivation sub-scales (means between 2.56 and 3.08), again consistent withthe hypothesis.
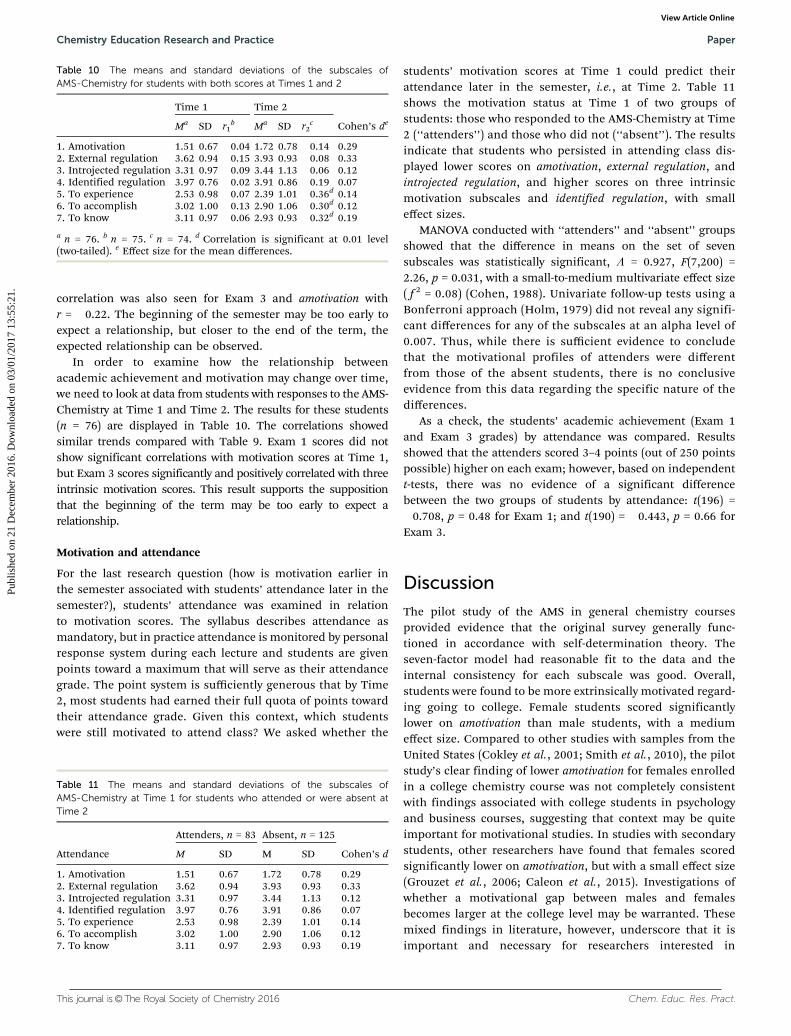
For the students who had complete responses at bothTime 1 and Time 2 (n = 76), the motivational structure at eachtime was very similar to that displayed in Table 7 (seeTable 10 for details). The largest difference, for amotivation,was still quite small, approximately one tenth of a standarddeviation.
Sex differences
Time 1 data has been separated by sex in Table 8, revealing thatfemale students scored higher on introjected regulation andidentified regulation but lower on the three intrinsic motivationsubscales. The MANOVA results for the sex subgroups showedthat the difference in means on the set of seven subscales wasstatistically significant, L = 0.85, F(7,200) = 5.04, p o 0.001,with a medium multivariate effect size (f2 = 0.17) (Cohen, 1988).Univariate follow-up tests using a Bonferroni approach
(Holm, 1979) were conducted; however, there were no statisti-cally significant sex differences for any of the individual sub-scales at 0.007 alpha level. The effect sizes for differencesbetween females and males, as shown by Cohen’s d valuesin Table 8, were between 0 and 0.38 (small). For the secondadministration of AMS-Chemistry, the sample size was toosmall for inferential tests; therefore, the differences by sexwere not examined at Time 2. These results are not conclusivewith respect to sex differences for the students in this study,but do suggest that, with a reasonably large sample, AMS-Chemistry has the potential to be sufficiently sensitive formaking these comparisons.
Motivation and chemistry achievement
As academic achievement is another important factor forstudent persistence in STEM, the relationship with academicachievement is examined here. Given the timing of exams withrespect to the administration of the AMS-Chemistry, weassume motivation scores at Time 1 should correlate moststrongly with Exam 1 scores, and motivation scores at Time 2should correlate most strongly with Exam 3. Based on resultsin the literature (Taylor et al., 2014), we hypothesize that, ifthere is a correlation, it would be strongest for the intrinsicmotivation subscales. The correlation results are displayed inTable 9.
The magnitudes of the correlations as shown in Table 9 weresmall (0.08 or less) and nonsignificant for Exam 1. Exam 3scores, however, were significantly and positively correlatedwith three intrinsic motivation subscales, and r ranged from0.33 to 0.35, a medium effect (Cohen, 1988). A small negative
Table 7 The descriptive statistics for the subscales of AMS-Chemistry at Times 1 and 2
Time 1 (n = 208) Time 2 (n = 94)
M SD Sk Ku M SD Sk Ku
Amotivation 1.64 0.74 1.30 1.51 1.81 0.93 0.95 �0.14External regulation 3.81 0.94 �0.77 0.24 3.46 1.07 �0.59 �0.25Introjected regulation 3.39 1.07 �0.37 �0.63 3.13 0.98 0.11 �0.45Identified regulation 3.94 0.82 �0.88 0.63 3.68 0.95 �0.65 0.23To experience 2.45 1.00 0.47 �0.26 2.56 1.05 0.40 �0.54To accomplish 2.95 1.04 �0.04 �0.52 2.97 1.02 0.20 �0.46To know 3.00 0.95 0.02 �0.49 3.08 0.97 0.10 �0.60
Note: sk = skewness; ku = kurtosis.
Table 8 Female and male students’ motivation structure at Time 1 basedon AMS-Chemistry
F, n = 129 M, n = 79
Cohen’s dM SD M SD
1. Amotivation 1.64 0.72 1.64 0.79 02. External regulation 3.80 0.93 3.82 0.97 0.023. Introjected regulation 3.46 1.10 3.27 1.02 0.184. Identified regulation 3.99 0.80 3.85 0.85 0.175. To experience 2.33 0.99 2.64 0.99 0.316. To accomplish 2.92 1.08 3.00 0.97 0.087. To know 2.87 0.99 3.22 0.84 0.38
Table 9 Correlation of AMS-Chemistry subscales with Exam scores
Exam 1, n = 208 Exam 3, n = 94
1. Amotivation �0.08 �0.22b
2. External regulation �0.03 0.073. Introjected regulation �0.04 0.134. Identified regulation 0.03 0.165. To experience 0.02 0.34a
6. To accomplish 0.08 0.35a
7. To know 0.07 0.33a
a Correlation is significant at 0.01 level (two-tailed). b Correlation issignificant at 0.05 level (two-tailed).
Paper Chemistry Education Research and Practice
Publ
ishe
d on
21
Dec
embe
r 20
16. D
ownl
oade
d on
03/
01/2
017
13:5
5:21
. View Article Online
This journal is©The Royal Society of Chemistry 2016 Chem. Educ. Res. Pract.
correlation was also seen for Exam 3 and amotivation withr = �0.22. The beginning of the semester may be too early toexpect a relationship, but closer to the end of the term, theexpected relationship can be observed.
In order to examine how the relationship betweenacademic achievement and motivation may change over time,we need to look at data from students with responses to the AMS-Chemistry at Time 1 and Time 2. The results for these students(n = 76) are displayed in Table 10. The correlations showedsimilar trends compared with Table 9. Exam 1 scores did notshow significant correlations with motivation scores at Time 1,but Exam 3 scores significantly and positively correlated with threeintrinsic motivation scores. This result supports the suppositionthat the beginning of the term may be too early to expect arelationship.
Motivation and attendance
For the last research question (how is motivation earlier inthe semester associated with students’ attendance later in thesemester?), students’ attendance was examined in relationto motivation scores. The syllabus describes attendance asmandatory, but in practice attendance is monitored by personalresponse system during each lecture and students are givenpoints toward a maximum that will serve as their attendancegrade. The point system is sufficiently generous that by Time2, most students had earned their full quota of points towardtheir attendance grade. Given this context, which studentswere still motivated to attend class? We asked whether the
students’ motivation scores at Time 1 could predict theirattendance later in the semester, i.e., at Time 2. Table 11shows the motivation status at Time 1 of two groups ofstudents: those who responded to the AMS-Chemistry at Time2 (‘‘attenders’’) and those who did not (‘‘absent’’). The resultsindicate that students who persisted in attending class dis-played lower scores on amotivation, external regulation, andintrojected regulation, and higher scores on three intrinsicmotivation subscales and identified regulation, with smalleffect sizes.
MANOVA conducted with ‘‘attenders’’ and ‘‘absent’’ groupsshowed that the difference in means on the set of sevensubscales was statistically significant, L = 0.927, F(7,200) =2.26, p = 0.031, with a small-to-medium multivariate effect size( f 2 = 0.08) (Cohen, 1988). Univariate follow-up tests using aBonferroni approach (Holm, 1979) did not reveal any signifi-cant differences for any of the subscales at an alpha level of0.007. Thus, while there is sufficient evidence to concludethat the motivational profiles of attenders were differentfrom those of the absent students, there is no conclusiveevidence from this data regarding the specific nature of thedifferences.
As a check, the students’ academic achievement (Exam 1and Exam 3 grades) by attendance was compared. Resultsshowed that the attenders scored 3–4 points (out of 250 pointspossible) higher on each exam; however, based on independentt-tests, there was no evidence of a significant differencebetween the two groups of students by attendance: t(196) =�0.708, p = 0.48 for Exam 1; and t(190) = �0.443, p = 0.66 forExam 3.
Discussion
The pilot study of the AMS in general chemistry coursesprovided evidence that the original survey generally func-tioned in accordance with self-determination theory. Theseven-factor model had reasonable fit to the data and theinternal consistency for each subscale was good. Overall,students were found to be more extrinsically motivated regard-ing going to college. Female students scored significantlylower on amotivation than male students, with a mediumeffect size. Compared to other studies with samples from theUnited States (Cokley et al., 2001; Smith et al., 2010), the pilotstudy’s clear finding of lower amotivation for females enrolledin a college chemistry course was not completely consistentwith findings associated with college students in psychologyand business courses, suggesting that context may be quiteimportant for motivational studies. In studies with secondarystudents, other researchers have found that females scoredsignificantly lower on amotivation, but with a small effect size(Grouzet et al., 2006; Caleon et al., 2015). Investigations ofwhether a motivational gap between males and femalesbecomes larger at the college level may be warranted. Thesemixed findings in literature, however, underscore that it isimportant and necessary for researchers interested in
Table 10 The means and standard deviations of the subscales ofAMS-Chemistry for students with both scores at Times 1 and 2
Time 1 Time 2
Cohen’s deMa SD r1b Ma SD r2
c
1. Amotivation 1.51 0.67 �0.04 1.72 0.78 �0.14 0.292. External regulation 3.62 0.94 �0.15 3.93 0.93 0.08 0.333. Introjected regulation 3.31 0.97 �0.09 3.44 1.13 0.06 0.124. Identified regulation 3.97 0.76 �0.02 3.91 0.86 0.19 0.075. To experience 2.53 0.98 0.07 2.39 1.01 0.36d 0.146. To accomplish 3.02 1.00 0.13 2.90 1.06 0.30d 0.127. To know 3.11 0.97 0.06 2.93 0.93 0.32d 0.19
a n = 76. b n = 75. c n = 74. d Correlation is significant at 0.01 level(two-tailed). e Effect size for the mean differences.
Table 11 The means and standard deviations of the subscales ofAMS-Chemistry at Time 1 for students who attended or were absent atTime 2
Attendance
Attenders, n = 83 Absent, n = 125
Cohen’s dM SD M SD
1. Amotivation 1.51 0.67 1.72 0.78 0.292. External regulation 3.62 0.94 3.93 0.93 0.333. Introjected regulation 3.31 0.97 3.44 1.13 0.124. Identified regulation 3.97 0.76 3.91 0.86 0.075. To experience 2.53 0.98 2.39 1.01 0.146. To accomplish 3.02 1.00 2.90 1.06 0.127. To know 3.11 0.97 2.93 0.93 0.19
Chemistry Education Research and Practice Paper
Publ
ishe
d on
21
Dec
embe
r 20
16. D
ownl
oade
d on
03/
01/2
017
13:5
5:21
. View Article Online

Chem. Educ. Res. Pract. This journal is©The Royal Society of Chemistry 2016
motivation of science majors to gather data in science courses,because students’ motivation is likely to depend on thecourses they are enrolled in at the time. Since our interestwas eventually to be able to determine students’ motivationstatus toward chemistry courses rather than toward college,our pilot study provided sufficient evidence that it would bepromising to move forward and modify the AMS into achemistry-specific theory-based measure of motivation forcollege chemistry courses.
With the assistance of an expert panel review processand information from cognitive interviews with students, theAMS was successfully modified into the AMS-Chemistry. Con-firmatory factor analysis of data gathered in a college chem-istry course provided validity evidence for the internalstructure of the instrument, showing that the seven-factorAMS-Chemistry model had reasonable fit to the data. Nocorrelated errors were included in the model, and the fitindices were better than those of the AMS, indicating thatthe modified items work well and the AMS-Chemistry func-tioned even better than the AMS in a similar setting. Themodel fit and the correlations between subscales (Appendix 8)demonstrate that the AMS-Chemistry still functions in accor-dance with SDT. Internal consistency reliability as estimatedby Cronbach’s alpha remained good for each separate sub-scale. The quality of the validity evidence was sufficient towarrant interpreting AMS-Chemistry scores with regard toseven types of motivation.
Regarding motivation toward chemistry courses, thecurrent study showed that the students enrolled in a firstsemester college general chemistry course at a large publicresearch university in the southeastern United States aremainly extrinsically motivated toward that course. With afinding such as this, instructors can be made aware thatassigning students grades for homework and other assign-ments, reminding them about deadlines, and focusing onpoints as a reward for attendance could support these extrinsi-cally motivated students to some degree, but may not be helpingthem to develop intrinsic motivation (Deci et al., 1999). Themotivational status observed for these students with this newinstrument was different from former studies using the AMS toprobe college students enrolled in a variety of courses, whereCanadian and Argentinean students generally had higher meanson intrinsic motivation subscales regarding going to college(Ratelle et al., 2007; Stover et al., 2012). This different observationfor the AMS-Chemistry in a college general chemistry coursemakes sense given the required nature of that course for allstudents who intend to major in some area of science, notnecessarily in chemistry, and was consistent with studies ofmotivation toward chemistry in which few students intendedto study chemistry (Salta and Tzougraki, 2004; Salta andKoulougliotis, 2015). At the end of semester, students were stillextrinsically motivated toward chemistry but with decreasedmotivation. The decrease of motivation over a semester wasconsistent with findings in other college courses in literature(Nilsson and Warren Stomberg, 2008; He et al., 2015). Whenexamining female and male subgroups, the current study
showed an overall difference but did not provide any evidenceof difference for a specific subscale. Compared with studiesin non-U.S. settings where female high school students weresimilarly or more motivated than males toward chemistry(Akbas- and Kan, 2007) and had greater self-determinationregardless of age (Salta and Koulougliotis, 2015), the currentstudy suggested a sex difference in motivation toward chemistryfavoring males, but additional investigation is necessary.
The correlation between motivational variables and examgrades differed at two time points within a semester. Specifi-cally, the results showed no evidence of association betweenstudents’ motivation scores and their academic achievementon the first exam, but three intrinsic motivation subscalescorrelated significantly and positively with academic achieve-ment later in the semester. Compared with other studies onmotivation toward chemistry, each using a different measure,where only weak associations with chemistry achievementwere found at the end of a term (Jurisevic et al., 2008; Devetaket al., 2009), the association was present for only one cohortof students (Hibbard et al., 2016), or the association wassimilarly strong (Akbas- and Kan, 2007), it seems necessaryto continue to investigate this issue by using AMS-Chemistryin additional research contexts. The observed increase inassociation between achievement and motivation in this studyover a semester also suggests that it would be valuable toexamine student motivation and achievement at multiple timepoints, not just near the beginning and end of one term. As wewould like to see students be motivated toward the chemistrycourses they are taking, it will be important to explore whatlearning environments can increase student intrinsic motiva-tion scores, even in large classroom settings. Based on SDT,when the three psychological basic needs are met, intrinsicmotivation can be promoted (Black and Deci, 2000; Vainoet al., 2012; Hagger et al., 2015; Kiemer et al., 2015). Therefore,instructors may want to utilize active-learning methods suchas group work and demonstrate their concern for students byproviding guidance and positive feedback, to create a sense ofrelatedness both to other students and to the instructor.Instructors may also want to work toward developing coursematerials that are appropriately scaffolded yet challenging, sothat students can develop a sense of competence with thesubject. Finally, to support the development of a sense ofautonomy, instructors may want to explore options suchas cafeteria grading or open inquiry experiments to createmore opportunities for students to make choices (Reeve, 2012;Orsini et al., 2016).
Reeve (2009) has proposed five instructional behaviors thatinstructors should use in order to be autonomy supportive.First, instructors can capitalize on students’ natural interests,for example by providing opportunities for student-selectedprojects or creating immersive student-driven technology-based learning activities. Second, instructors can explain theirchoices in teaching methods, and describe why the chosenactivities are worth doing. Third, instructors can choosepermissive language, inviting student viewpoints and discus-sion, instead of issuing verbal directives. Fourth, instructors
Paper Chemistry Education Research and Practice
Publ
ishe
d on
21
Dec
embe
r 20
16. D
ownl
oade
d on
03/
01/2
017
13:5
5:21
. View Article Online

This journal is©The Royal Society of Chemistry 2016 Chem. Educ. Res. Pract.
can create conditions that enable self-paced learning, forexample, by implementing a flipped classroom teaching method(Seery, 2015). Last, instructors can acknowledge and accept stu-dents’ emotions, whether positive or negative, for example, byemploying verbal mirroring strategies to demonstrate understand-ing without judgment.
The study also showed that motivation scores could predictthe attendance of students, as students whose autonomousmotivation was higher at the beginning of semester had betterattendance later in the semester, which aligns with findingsfor college students enrolled in agriculture-related courses(Devadoss and Foltz, 1996). These quantitative results were alsoconsistent with a qualitative study linking non-attendance tolectures with low motivation (Moore et al., 2008). Given thestudy in Taiwan suggesting a negative overall effect on achieve-ment if less motivated students attend class alongside theirmore motivated peers (Chen and Lin, 2015), the true remedy,rather than compulsory attendance, may be to promote intrin-sic motivation. Therefore, we can try to motivate students byconnecting chemistry concepts with real life and their futurecareers to move them toward the more self-determined end ofthe motivation continuum, and in that way increase attendancewhile maintaining achievement in introductory college chem-istry courses.
Limitations
This study has several limitations. For example, the sampleswere convenient and were drawn from particular coursesat particular institutions; therefore, the results may onlyrepresent the students in these unique contexts but not beapplicable to other situations. Accordingly, we recommendthat instructors use this instrument to gather data from theirown classes for interpretation, and we also hope thatother researchers will continue to investigate the psycho-metric properties of scores obtained with different samples.As is usual for motivation studies, self-reported scores fromstudents were used for the analysis. Participants’ self-reportedscores may or may not be evaluating their real motivation typeand level, for example because of social desirability or throughlack of self-awareness. As the instrument continues to be used,continuing to gather evidence regarding the relationshipbetween instrument scores and other variables thought to berelated to motivation will be helpful. From the discussion ofdata cleaning and missing data, it should be clear that not allstudents responded to the instruments, so response biasmight exist because it is possible that the students respondingto the survey were more motivated. Finally, the sample sizewas not large enough for evaluation of the invariance ofthe measurement model for male and female subgroups, sothose comparative findings should be taken with caution. Ameasurement invariance study (Xu et al., 2016) based on large-scale data collection would be a useful next step for thisinstrument, either to identify needed modifications or tobuild the body of psychometric evidence.
Conclusion
First, the validity evidence gathered in this study (content,response process, internal structure, and relationshipswith other variables) suggests that the AMS-Chemistry canbe used in other college chemistry courses to examinestudent motivation toward chemistry. While from a devel-opmental validity perspective there is much work to bedone gathering additional evidence with multiple samples,with this initial study AMS-Chemistry has been well-positioned to serve as a theory-based instrument to mea-sure motivation along the SDT continuum in order toidentify nuances in student motivation. Second, multipleadministrations of the AMS-Chemistry within a course andacross the curriculum, for a longitudinal or cross-sectionalstudy, are likely to be a fruitful way to examine changes inmotivation as students progress through a degree program.Because SDT has multiple mini-theories that augment thedescription of the motivation continuum, it is a goodsource for the development of testable interventions thatintend to fulfill students’ basic needs for autonomy, com-petence, and relatedness in order to provide a productiveenvironment for the development of greater intrinsic moti-vation. The AMS-Chemistry can be used before and afterstudent-centered educational reforms are implemented toexplore students’ motivational perceptions for the effect ofeducational reform. Seeing evidence that student scoresincrease on the subscales at the more self-determined endof the continuum over time would be affirmation that atargeted reform is having the intended effect. Last, beingable to track the situational level motivation scores in thisway may help to address other important issues such asscientific literacy and persistence in science education,most particularly to shed light on the pressing problem ofattrition of students from college chemistry courses.
Furthermore, scores from AMS-Chemistry may be inter-preted in other ways in the future, with support from alter-native measurement models. One approach in the literaturecategorizes identified regulation and intrinsic motivation asautonomous motivation (Vansteenkiste et al., 2004), andexternal regulation and introjected regulation as controlledmotivation (Vansteenkiste et al., 2012), and may also mea-sure amotivation as a separate construct (Ratelle et al., 2007).The comparison between a z-score for autonomous motivationand a z-score for controlled motivation has been called theRelative Autonomy Index (RAI) (Black and Deci, 2000).Another approach sums weighted subscale scores, withintrinsic motivation scales weighted positively and externalmotivation scales weighted negatively, either to create Self-Determination Indices (SDI) that represent the overall levelof an individual’s self-determination (Levesque et al., 2004),or to create a different type of RAI (Goudas et al., 1994;Soenens et al., 2012). An exploration of measurementmodels that would support these interpretations would beinteresting and potentially valuable future work with AMS-Chemistry data.
Chemistry Education Research and Practice Paper
Publ
ishe
d on
21
Dec
embe
r 20
16. D
ownl
oade
d on
03/
01/2
017
13:5
5:21
. View Article Online
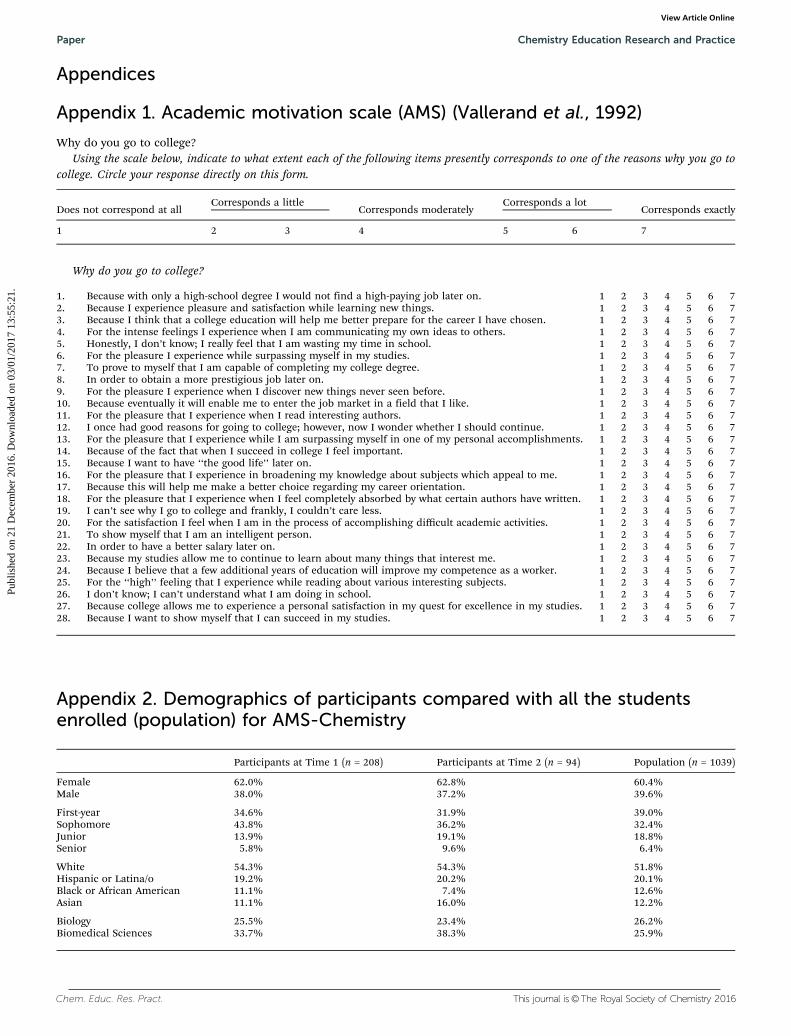
Chem. Educ. Res. Pract. This journal is©The Royal Society of Chemistry 2016
Appendices
Appendix 1. Academic motivation scale (AMS) (Vallerand et al., 1992)
Why do you go to college?Using the scale below, indicate to what extent each of the following items presently corresponds to one of the reasons why you go to
college. Circle your response directly on this form.
Does not correspond at allCorresponds a little
Corresponds moderatelyCorresponds a lot
Corresponds exactly
1 2 3 4 5 6 7
Why do you go to college?
1. Because with only a high-school degree I would not find a high-paying job later on. 1 2 3 4 5 6 72. Because I experience pleasure and satisfaction while learning new things. 1 2 3 4 5 6 73. Because I think that a college education will help me better prepare for the career I have chosen. 1 2 3 4 5 6 74. For the intense feelings I experience when I am communicating my own ideas to others. 1 2 3 4 5 6 75. Honestly, I don’t know; I really feel that I am wasting my time in school. 1 2 3 4 5 6 76. For the pleasure I experience while surpassing myself in my studies. 1 2 3 4 5 6 77. To prove to myself that I am capable of completing my college degree. 1 2 3 4 5 6 78. In order to obtain a more prestigious job later on. 1 2 3 4 5 6 79. For the pleasure I experience when I discover new things never seen before. 1 2 3 4 5 6 710. Because eventually it will enable me to enter the job market in a field that I like. 1 2 3 4 5 6 711. For the pleasure that I experience when I read interesting authors. 1 2 3 4 5 6 712. I once had good reasons for going to college; however, now I wonder whether I should continue. 1 2 3 4 5 6 713. For the pleasure that I experience while I am surpassing myself in one of my personal accomplishments. 1 2 3 4 5 6 714. Because of the fact that when I succeed in college I feel important. 1 2 3 4 5 6 715. Because I want to have ‘‘the good life’’ later on. 1 2 3 4 5 6 716. For the pleasure that I experience in broadening my knowledge about subjects which appeal to me. 1 2 3 4 5 6 717. Because this will help me make a better choice regarding my career orientation. 1 2 3 4 5 6 718. For the pleasure that I experience when I feel completely absorbed by what certain authors have written. 1 2 3 4 5 6 719. I can’t see why I go to college and frankly, I couldn’t care less. 1 2 3 4 5 6 720. For the satisfaction I feel when I am in the process of accomplishing difficult academic activities. 1 2 3 4 5 6 721. To show myself that I am an intelligent person. 1 2 3 4 5 6 722. In order to have a better salary later on. 1 2 3 4 5 6 723. Because my studies allow me to continue to learn about many things that interest me. 1 2 3 4 5 6 724. Because I believe that a few additional years of education will improve my competence as a worker. 1 2 3 4 5 6 725. For the ‘‘high’’ feeling that I experience while reading about various interesting subjects. 1 2 3 4 5 6 726. I don’t know; I can’t understand what I am doing in school. 1 2 3 4 5 6 727. Because college allows me to experience a personal satisfaction in my quest for excellence in my studies. 1 2 3 4 5 6 728. Because I want to show myself that I can succeed in my studies. 1 2 3 4 5 6 7
Appendix 2. Demographics of participants compared with all the studentsenrolled (population) for AMS-Chemistry
Participants at Time 1 (n = 208) Participants at Time 2 (n = 94) Population (n = 1039)
Female 62.0% 62.8% 60.4%Male 38.0% 37.2% 39.6%
First-year 34.6% 31.9% 39.0%Sophomore 43.8% 36.2% 32.4%Junior 13.9% 19.1% 18.8%Senior 5.8% 9.6% 6.4%
White 54.3% 54.3% 51.8%Hispanic or Latina/o 19.2% 20.2% 20.1%Black or African American 11.1% 7.4% 12.6%Asian 11.1% 16.0% 12.2%
Biology 25.5% 23.4% 26.2%Biomedical Sciences 33.7% 38.3% 25.9%
Paper Chemistry Education Research and Practice
Publ
ishe
d on
21
Dec
embe
r 20
16. D
ownl
oade
d on
03/
01/2
017
13:5
5:21
. View Article Online

This journal is©The Royal Society of Chemistry 2016 Chem. Educ. Res. Pract.
Appendix 4. Examination of the academic background of all the students withcomplete usable data for AMS-Chemistry at Time 1
n M SD Sk Ku
SATV 179 549.61 72.07 �0.29 �0.22SATM 179 554.08 72.08 �0.29 1.09SATT 179 1103.69 127.30 �0.39 0.66
Note: Sk = skewness, Ku = kurtosis.
Appendix 5. Standardized loading from the confirmatory factor analysis for AMS(n = 238)
Item
Factor loading
Amotivation External regulation Introjected regulation Identified regulation To experience To accomplish To know
Q5 0.869Q12 0.878Q19 0.907Q26 0.825Q1 0.586Q8 0.772Q15 0.751Q22 0.892Q7 0.727Q14 0.792Q21 0.809Q28 0.845Q3 0.619Q10 0.616Q17 0.748Q24 0.726Q4 0.739Q11 0.784Q18 0.801Q25 0.845Q6 0.762Q13 0.811Q20 0.835Q27 0.869Q2 0.731Q9 0.835Q16 0.846Q23 0.843
Note: there were correlated errors between q2 and q6, q8 and q10, q11 and q18, q12 and q19.
Appendix 3. Examination of the academic background of all the studentsenrolled in first semester general chemistry for AMS-Chemistry, n = 1039
n M SD Sk Ku
SATV 800 544.89 76.09 0.17 0.57SATM 800 548.81 67.86 �0.09 0.69SATT 800 1093.70 125.01 �0.13 0.55
Note: Sk = skewness, Ku = kurtosis.
Chemistry Education Research and Practice Paper
Publ
ishe
d on
21
Dec
embe
r 20
16. D
ownl
oade
d on
03/
01/2
017
13:5
5:21
. View Article Online

Chem. Educ. Res. Pract. This journal is©The Royal Society of Chemistry 2016
Appendix 7. Multivariate assumptions and MANOVAMultivariate assumption tests and outlier assessments for sex difference based on AMS
The tests of the multivariate normality assumption [B1p = 23.0371, w2 (df = 84, n = 238) = 928.14, p o 0.001; B2p = 102.98, zupper =27.47, zlower = 25.96] suggested violation of the normality assumption. However, the deviation from multivariate normality has onlya small effect on Type I error (Stevens, 2002, p. 262), and given the sample size, multivariate analysis of variance (MANOVA) wasexpected to be robust to this violation (Stevens, 2002, p. 262). An outlier assessment test revealed two outliers with Mahalanobisdistances of 52.36 and 44.14. The MANOVA was rerun without the outliers, but the significant difference test results did notchange. Therefore, the complete data set was used for analysis and interpretation.
MANOVA was run with the transformed variable (log(amotivation)) and other seven untransformed variables and showedsignificant differences between males and females: F(7,230) = 2.09, p = 0.046; for the univariate follow up test, females and malesdiffered on amotivation: F(1,236) = 10.13, p = 0.0017. Because the assumption of homogeneity of variance was violated (w2 (df = 28) =114.57, p o 0.001) (Morrison, 1976), and the smaller sample size is associated with larger variance, the violation was not robust forthe data. Therefore, n = 93 female students were randomly pulled out, together with the male students (n = 93), and MANOVA wasrerun with the original variables and with the transformed variable (amotivation). The significant difference test results did notchange. Therefore, it was safe to conclude that the male and female students were different on a set of the seven motivation variables,and female students scored significantly lower on amotivation.
Regarding sex difference based on AMS-Chemistry
Tests of the multivariate normality assumption {B1p = 6.05, w2 (df = 84, n = 208) = 213.39, p o 0.001; B2p = 65.92, zupper = 1.87, zlower =0.32} suggested violation of the normality assumption. However, the deviation from multivariate normality has only a small effecton Type I error (Stevens, 2002), and given the sample size, MANOVA was expected to be robust to this violation(Stevens, 2002, p. 262). An outlier assessment test revealed one outlier with Mahalanobis distance of 20.87. The MANOVA wasrerun without the outliers, but the significant difference test results did not change. Therefore the complete data set was used foranalysis and interpretation. Since the Chi-Square value is not significant at the 0.1 level, (w2 (df = 28, n = 208) = 29.22, p = 0.40)suggesting no violations to the homogeneity of variance (Morrison, 1976), a pooled covariance matrix was used in the test.
Regarding attendance based on AMS-Chemistry
Tests of the multivariate normality assumption {B1p = 6.05, w2 (df = 84, n = 208) = 213.43, p o 0.001; B2p = 66.49, zupper = 2.24,zlower = 0.68} suggested violation of the normality assumption. However, MANOVA was expected to be robust to this violation(Stevens, 2002, p. 262) given the sample size. An outlier assessment test revealed one outlier with Mahalanobis distance of 21.51.The MANOVA was rerun without the outliers, but the significant difference test results did not change. Therefore the completedata set was used for analysis and interpretation. Regarding the homogeneity of variance assumption, (w2 (df = 28,n = 208) = 26.46, p = 0.55), suggesting the data did not violate this assumption (Morrison, 1976).
Appendix 6. Fit indices of alternative confirmatory factor analyses of AMS (n = 238)
SBw2 df CFI SRMR RMSEA
Five-factor 1073.81 340 0.80 0.075 0.095One-factor 2095.31 350 0.52 0.134 0.145
Paper Chemistry Education Research and Practice
Publ
ishe
d on
21
Dec
embe
r 20
16. D
ownl
oade
d on
03/
01/2
017
13:5
5:21
. View Article Online

This journal is©The Royal Society of Chemistry 2016 Chem. Educ. Res. Pract.
References
Abdulghani H. M., Al-Drees A. A., Khalil M. S., Ahmad F.,Ponnamperuma G. G. and Amin Z., (2014), What factorsdetermine academic achievement in high achieving under-graduate medical students? A qualitative study, Med. Teach.,36(suppl 1), S43–S48.
Acisli S., (2012), Examination of the academic motivation ofelementary pre-service teachers according to various variances,Energy Educ. Sci. Technol., Part B, 4(4), 2319–2326.
Akbas- A. and Kan A., (2007), Affective factors that influencechemistry achievement (motivation and anxiety) and thepower of these factors to predict chemistry achievement-II,J. Turk. Sci. Educ., 4, 10–19.
Alivernini F. and Lucidi F., (2011), Relationship between socialcontext, self-efficacy, motivation, academic achievement, andintention to drop out of high school: a longitudinal study,J. Educ. Res., 104(4), 241–252.
Allen D., (1999), Desire to finish college: an empirical link betweenmotivation and persistence, Res. High. Educ., 40(4), 461–485.
Alzhanova-Ericsson A. T., Bergman C. and Dinnetz P., (2015),Lecture attendance is a pivotal factor for improving prospec-tive teachers’ academic performance in teaching and learn-ing mathematics, J. Further High. Educ., 1–15.
American Association for the Advancement of Science (AAAS),(1993), Benchmarks for science literacy, New York: Longman.
Areepattamannil S., Freeman J. G. and Klinger D. A., (2011),Intrinsic motivation, extrinsic motivation, and academicachievement among Indian adolescents in Canada andIndia, Soc. Psychol. Educ., 14(3), 427–439.
Arjoon J. A., Xu X. and Lewis J. E., (2013), Understanding thestate of the art for measurement in chemistry educationresearch: examining the psychometric evidence, J. Chem.Educ., 90(5), 536–545.
Baker S. R., (2003), A prospective longitudinal investigationof social problem-solving appraisals on adjustment touniversity, stress, health, and academic motivation andperformance, Pers. Indiv. Differ., 35(3), 569–591.
Baker S. R., (2004), Intrinsic, extrinsic, and amotivationalorientations: their role in university adjustment, stress,
Table A1 Intercorrelations for the AMS-Chemistry subscales at Time 1, n = 208
1 2 3 4 5 6 7
1. Amotivation 12. External regulation �0.09 13. Introjected regulation �0.23a 0.40a 14. Identified regulation �0.50a 0.58a 0.50a 15. To experience �0.28a 0.29a 0.63a 0.47a 16. To accomplish �0.33a 0.34a 0.78a 0.53a 0.85a 17. To know �0.38a 0.27a 0.63a 0.53a 0.84a 0.85a 1
a Correlation is significant at 0.01 level (two-tailed).
Table A2 Intercorrelations for the AMS-Chemistry subscales at Time 2, n = 94
1 2 3 4 5 6 7
1. Amotivation 12. External regulation 0.06 13. Introjected regulation �0.22a 0.10 14. Identified regulation �0.37a 0.46a 0.25a 15. To experience �0.25a 0.08 0.50a 0.37a 16. To accomplish �0.37a 0.03 0.62a 0.41a 0.84a 17. To know �0.42a 0.15 0.48a 0.46a 0.81a 0.85a 1
a Correlation is significant at 0.01 level (two-tailed).
Appendix 8. Correlation studies
The correlations among the subscales are often examined to examine how well the instrument is aligned with SDT. Because theAMS-Chemistry is based on SDT, the intercorrelations between these subscales were expected to display a quasi-simplex pattern:the adjacent subscales would show stronger correlations than subscales that are farther away. At Time 1, the results showedthat the adjacent subscales usually had stronger correlations, but with very few deviations as shown in Table A1. Regarding thethree intrinsic motivation subscales, strong correlations are expected, and the results showed that the three intrinsic motivationsubscales (to know, to accomplish, and to experience) were strongly correlated, r = 0.84 or 0.85 at Time 1. At Time 1, amotivationshowed negative correlation with the other subscales because amotivation suggests non-regulated and extrinsic motivation andintrinsic motivation subscales suggest positive regulation.
When AMS-Chemistry was administered at Time 2, the correlations (shown in Table A2) had similar trends but few weresignificant at an alpha level of 0.01. In general, the correlations suggested that the AMS-Chemistry scores were in accordance withthe theory.
Chemistry Education Research and Practice Paper
Publ
ishe
d on
21
Dec
embe
r 20
16. D
ownl
oade
d on
03/
01/2
017
13:5
5:21
. View Article Online
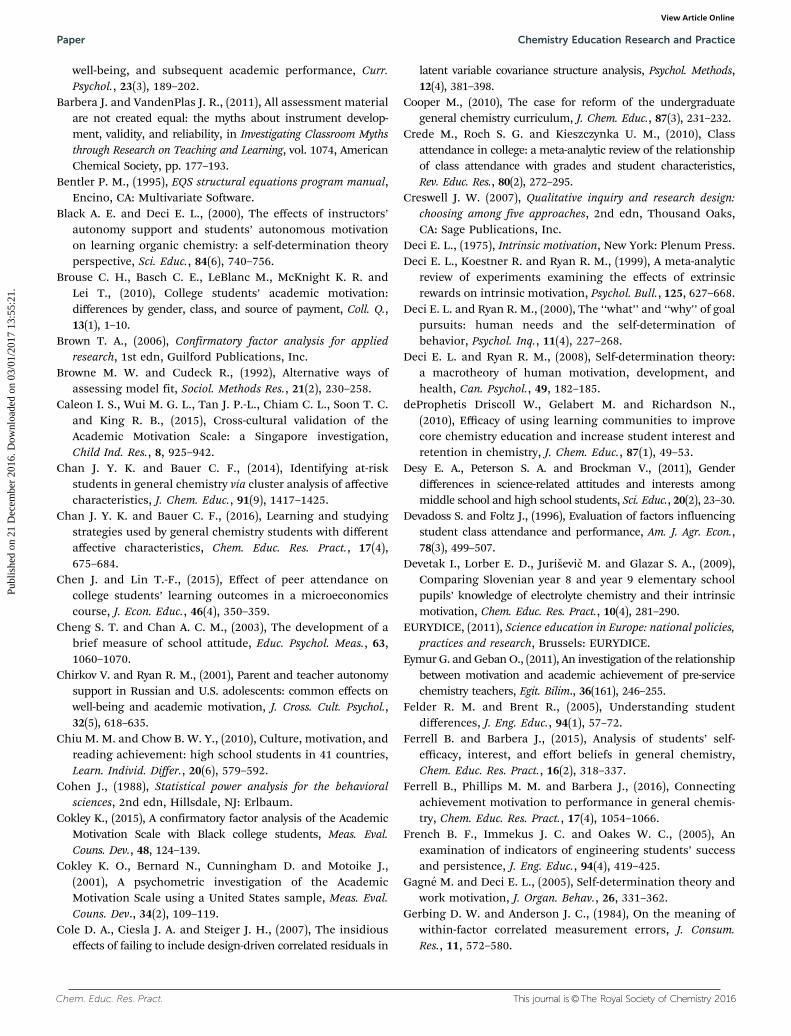
Chem. Educ. Res. Pract. This journal is©The Royal Society of Chemistry 2016
well-being, and subsequent academic performance, Curr.Psychol., 23(3), 189–202.
Barbera J. and VandenPlas J. R., (2011), All assessment materialare not created equal: the myths about instrument develop-ment, validity, and reliability, in Investigating Classroom Mythsthrough Research on Teaching and Learning, vol. 1074, AmericanChemical Society, pp. 177–193.
Bentler P. M., (1995), EQS structural equations program manual,Encino, CA: Multivariate Software.
Black A. E. and Deci E. L., (2000), The effects of instructors’autonomy support and students’ autonomous motivationon learning organic chemistry: a self-determination theoryperspective, Sci. Educ., 84(6), 740–756.
Brouse C. H., Basch C. E., LeBlanc M., McKnight K. R. andLei T., (2010), College students’ academic motivation:differences by gender, class, and source of payment, Coll. Q.,13(1), 1–10.
Brown T. A., (2006), Confirmatory factor analysis for appliedresearch, 1st edn, Guilford Publications, Inc.
Browne M. W. and Cudeck R., (1992), Alternative ways ofassessing model fit, Sociol. Methods Res., 21(2), 230–258.
Caleon I. S., Wui M. G. L., Tan J. P.-L., Chiam C. L., Soon T. C.and King R. B., (2015), Cross-cultural validation of theAcademic Motivation Scale: a Singapore investigation,Child Ind. Res., 8, 925–942.
Chan J. Y. K. and Bauer C. F., (2014), Identifying at-riskstudents in general chemistry via cluster analysis of affectivecharacteristics, J. Chem. Educ., 91(9), 1417–1425.
Chan J. Y. K. and Bauer C. F., (2016), Learning and studyingstrategies used by general chemistry students with differentaffective characteristics, Chem. Educ. Res. Pract., 17(4),675–684.
Chen J. and Lin T.-F., (2015), Effect of peer attendance oncollege students’ learning outcomes in a microeconomicscourse, J. Econ. Educ., 46(4), 350–359.
Cheng S. T. and Chan A. C. M., (2003), The development of abrief measure of school attitude, Educ. Psychol. Meas., 63,1060–1070.
Chirkov V. and Ryan R. M., (2001), Parent and teacher autonomysupport in Russian and U.S. adolescents: common effects onwell-being and academic motivation, J. Cross. Cult. Psychol.,32(5), 618–635.
Chiu M. M. and Chow B. W. Y., (2010), Culture, motivation, andreading achievement: high school students in 41 countries,Learn. Individ. Differ., 20(6), 579–592.
Cohen J., (1988), Statistical power analysis for the behavioralsciences, 2nd edn, Hillsdale, NJ: Erlbaum.
Cokley K., (2015), A confirmatory factor analysis of the AcademicMotivation Scale with Black college students, Meas. Eval.Couns. Dev., 48, 124–139.
Cokley K. O., Bernard N., Cunningham D. and Motoike J.,(2001), A psychometric investigation of the AcademicMotivation Scale using a United States sample, Meas. Eval.Couns. Dev., 34(2), 109–119.
Cole D. A., Ciesla J. A. and Steiger J. H., (2007), The insidiouseffects of failing to include design-driven correlated residuals in
latent variable covariance structure analysis, Psychol. Methods,12(4), 381–398.
Cooper M., (2010), The case for reform of the undergraduategeneral chemistry curriculum, J. Chem. Educ., 87(3), 231–232.
Crede M., Roch S. G. and Kieszczynka U. M., (2010), Classattendance in college: a meta-analytic review of the relationshipof class attendance with grades and student characteristics,Rev. Educ. Res., 80(2), 272–295.
Creswell J. W. (2007), Qualitative inquiry and research design:choosing among five approaches, 2nd edn, Thousand Oaks,CA: Sage Publications, Inc.
Deci E. L., (1975), Intrinsic motivation, New York: Plenum Press.Deci E. L., Koestner R. and Ryan R. M., (1999), A meta-analytic
review of experiments examining the effects of extrinsicrewards on intrinsic motivation, Psychol. Bull., 125, 627–668.
Deci E. L. and Ryan R. M., (2000), The ‘‘what’’ and ‘‘why’’ of goalpursuits: human needs and the self-determination ofbehavior, Psychol. Inq., 11(4), 227–268.
Deci E. L. and Ryan R. M., (2008), Self-determination theory:a macrotheory of human motivation, development, andhealth, Can. Psychol., 49, 182–185.
deProphetis Driscoll W., Gelabert M. and Richardson N.,(2010), Efficacy of using learning communities to improvecore chemistry education and increase student interest andretention in chemistry, J. Chem. Educ., 87(1), 49–53.
Desy E. A., Peterson S. A. and Brockman V., (2011), Genderdifferences in science-related attitudes and interests amongmiddle school and high school students, Sci. Educ., 20(2), 23–30.
Devadoss S. and Foltz J., (1996), Evaluation of factors influencingstudent class attendance and performance, Am. J. Agr. Econ.,78(3), 499–507.
Devetak I., Lorber E. D., Jurisevic M. and Glazar S. A., (2009),Comparing Slovenian year 8 and year 9 elementary schoolpupils’ knowledge of electrolyte chemistry and their intrinsicmotivation, Chem. Educ. Res. Pract., 10(4), 281–290.
EURYDICE, (2011), Science education in Europe: national policies,practices and research, Brussels: EURYDICE.
Eymur G. and Geban O., (2011), An investigation of the relationshipbetween motivation and academic achievement of pre-servicechemistry teachers, Egit. Bilim., 36(161), 246–255.
Felder R. M. and Brent R., (2005), Understanding studentdifferences, J. Eng. Educ., 94(1), 57–72.
Ferrell B. and Barbera J., (2015), Analysis of students’ self-efficacy, interest, and effort beliefs in general chemistry,Chem. Educ. Res. Pract., 16(2), 318–337.
Ferrell B., Phillips M. M. and Barbera J., (2016), Connectingachievement motivation to performance in general chemis-try, Chem. Educ. Res. Pract., 17(4), 1054–1066.
French B. F., Immekus J. C. and Oakes W. C., (2005), Anexamination of indicators of engineering students’ successand persistence, J. Eng. Educ., 94(4), 419–425.
Gagne M. and Deci E. L., (2005), Self-determination theory andwork motivation, J. Organ. Behav., 26, 331–362.
Gerbing D. W. and Anderson J. C., (1984), On the meaning ofwithin-factor correlated measurement errors, J. Consum.Res., 11, 572–580.
Paper Chemistry Education Research and Practice
Publ
ishe
d on
21
Dec
embe
r 20
16. D
ownl
oade
d on
03/
01/2
017
13:5
5:21
. View Article Online

This journal is©The Royal Society of Chemistry 2016 Chem. Educ. Res. Pract.
Glynn S. M., Taasoobshirazi G. and Brickman P., (2009),Science Motivation Questionnaire: construct validation withnonscience majors, J. Res. Sci. Teach., 46(2), 127–146.
Glynn S. M., Brickman P., Armstrong N. and Taasoobshirazi G.,(2011), Science Motivation Questionnaire II: validation withscience majors and nonscience majors, J. Res. Sci. Teach.,48(10), 1159–1176.
Goldschmidt M. and Bogner F. X., (2016), Learning aboutgenetic engineering in an outreach laboratory: influence ofmotivation and gender on students’ cognitive achievement,Int. J. Sci. Educ., Part B, 6(2), 166–187.
Gonzalez A. and Paoloni P.-V., (2015), Perceived autonomy-support, expectancy, value, metacognitive strategies andperformance in chemistry: a structural equation model inundergraduates, Chem. Educ. Res. Pract., 16(3), 640–653.
Goodman S., Jaffer T., Keresztesi M., Mamdani F., Mokgatle D.,Musariri M. and Schlechter A., (2011), An investigation ofthe relationship between students’ motivation and academicperformance as mediated by effort, S. Afr. J. Psychol., 41(3),373–385.
Goudas M., Biddle S. and Fox K., (1994), Perceived locus ofcausality, goal orientations, and perceived competence inschool physical education classes, Brit. J. Educ. Psychol., 64,453–463.
Grouzet F. M., Otis N. and Pelletier L. G., (2006), Longitudinalcross-gender factorial invariance of the Academic MotivationScale, Struct. Equ. Modeling, 13, 73–98.
Guay F., Vallerand R. J. and Blanchard C., (2000), On theassessment of Situational intrinsic and extrinsic Motivation:The Situational Motivation Scale (SIMS), Motiv. Emot., 24,175–213.
Guay F., Morin A. J. S., Litalien D., Valois P. and Vallerand R. J.,(2015), Application of exploratory structural equationmodeling to evaluate the Academic Motivation Scale,J. Exp. Educ., 83(1), 51–82.
Hagger M. S., Koch S. and Chatzisarantis N. L. D., (2015), Theeffect of causality orientations and positive competence-enhancing feedback on intrinsic motivation: a test of additiveand interactive effects, Pers. Indiv. Differ., 72, 107–111.
He W., Gajski D., Farkas G. and Warschauer M., (2015),Implementing flexible hybrid instruction in an electricalengineering course: the best of three worlds? Comput. Educ.,81, 59–68.
Hibbard L., Sung S. and Wells B., (2016), Examining theeffectiveness of a semi-self-paced flipped learning formatin a college general chemistry sequence, J. Chem. Educ.,93(1), 24–30.
Holm S., (1979), A simple sequentially rejective multiple testprocedure, Scand. J. Stat., 6(2), 65–70.
Hu L. and Bentler P. M., (1995), Evaluating model fit, London:Sage.
Hu L. and Bentler P. M., (1999), Cutoff criteria for fit indexes incovariance structure analysis: conventional criteria versusnew alternatives, Struct. Equation Model., 6(1), 1–55.
Huett J. B., Kalinowski K. E., Moller L. and Huett K. C., (2008),Improving the motivation and retention of online students
through the use of arcs-based e-mails, Am. J. Distance Educ.,22(3), 159–176.
Jang H., Reeve J., Ryan R. M. and Kim A., (2009), Can self-determination theory explain what underlies the productive,satisfying learning experiences of collectivistically orientedKorean students? J. Educ. Psychol., 101(13), 644–661.
Jurisevic M., Glazar S. A., Pucko C. R. and Devetak I., (2008),Intrinsic motivation of pre-service primary school teachersfor learning chemistry in relation to their academic achievement,Int. J. Sci. Educ., 30(1), 87–107.
Kiemer K., Groschner A., Pehmer A.-K. and Seidel T., (2015),Effects of a classroom discourse intervention on teachers’practice and students’ motivation to learn mathematics andscience, Learn. Instr., 35, 94–103.
Koballa Jr. T. R. and Glynn S. M., (2007), Attitudinal andmotivational constructs in science learning, in Abell S. K.and Lederman N. G. (ed.), Handbook of research on scienceeducation, Mahwah, NJ: Lawrence Erlbaum Associates,pp. 75–102.
Lam T. Y. P. and Lau K. C., (2014), Examining factors affectingscience achievement of Hong Kong in PISA 2006 using hierar-chical linear modeling, Int. J. Sci. Educ., 36(15), 2463–2480.
Lau L. K., (2003), Institutional factors affecting student retention,Education, 124(1), 126–136.
Lavigne G. L., Vallerand R. J. and Miquelon P., (2007),A motivational model of persistence in science education:a self-determination theory approach, Eur. J. Psychol. Educ.,22(3), 351–369.
Lepper M. R. and Henderlong J., (2000), Turning ‘‘play’’ into‘‘work’’ and ‘‘work’’ into ‘‘play’’: 25 years of research onintrinsic versus extrinsic motivation, In Harackiewicz C. S.J. M. (ed.), Intrinsic and extrinsic motivation: the search foroptimal motivation and performance, San Diego, CA, US:Academic Press, pp. 257–307.
Lepper M. R., Corpus J. H. and Iyengar S. S., (2005), Intrinsicand extrinsic motivational orientations in the classroom:age differences and academic correlates, J. Educ. Psychol.,97(2), 184–196.
Levesque C., Zuehlke A. N., Stanek L. R. and Ryan R. M., (2004),Autonomy and competence in German and Americanuniversity students: a comparative study based on self-determination theory, J. Educ. Psychol., 96, 68–84.
Lifton D., Cohen A. and Schlesinger W., (2007), Utilizing first-year curricula linkage to improve in-major persistence tograduation: results from a four-year longitudinal study, fall2000-spring 2004, J. Coll. Stud. Ret., 9(1), 113–125.
Lim S. Y. and Chapman E., (2015), Adapting the AcademicMotivation Scale for use in pre-tertiary mathematics class-rooms, Math. Educ. Res. J., 27, 331–357.
Liu W. C., Wang C. K. J., Kee Y. H., Koh C., Lim B. S. C. and ChuaL., (2014), College students’ motivation and learning strate-gies profiles and academic achievement: a self-determinationtheory approach, Educ. Psychol., 34(3), 338–353.
MacCallum R. C., Browne M. W. and Sugawara H. M., (1996),Power analysis and determination of sample size for covariancestructure modeling, Psychol. Methods, 1(2), 130–149.
Chemistry Education Research and Practice Paper
Publ
ishe
d on
21
Dec
embe
r 20
16. D
ownl
oade
d on
03/
01/2
017
13:5
5:21
. View Article Online

Chem. Educ. Res. Pract. This journal is©The Royal Society of Chemistry 2016
Maltese A. V. and Tai R. H., (2011), Pipeline persistence:examining the association of educational experiences withearned degrees in STEM among us students, Sci. Educ.,95(5), 877–907.
Mantzicopoulos P., Patrick H. and Samarapungavan A., (2008),Young children’s motivational beliefs about learningscience, Early Child. Res. Q., 23(3), 378–394.
Matz R. L., Rothman E. D., Krajcik J. S. and Banaszak HollM. M., (2012), Concurrent enrollment in lecture and labora-tory enhances student performance and retention, J. Res. Sci.Teach., 49(5), 659–682.
Maurer T., Allen D., Gatch D. B., Shankar P. and Sturges D.,(2012), Students’ academic motivations in allied healthclasses, Internet J. Allied Health Sci. Pract., 10, 6.
Maurer T. W., Allen D., Gatch D. B., Shankar P. and Sturges D.,(2013), Students’ academic motivations in three disciplines,J. Scholarship Teach. Learn., 13, 77–89.
McAuley E., Duncan T. and Tammen V. V., (1989), Psychometricproperties of the Intrinsic Motivation Inventory in a compe-titive sport setting: a confirmatory factor analysis, Res. Q.Exercise Sport, 60(1), 48–58.
Moore S., Armstrong C. and Pearson J., (2008), Lecture absen-teeism among students in higher education: a valuable routeto understanding student motivation, J. Higher Educ. PolicyManage., 30, 15–24.
Morrison D.F., (1976), Multivariate Statistical Methods, p. 252.Morrissey T. W., Hutchison L. and Winsler A., (2014), Family
income, school attendance, and academic achievement inelementary school, Dev. Psychol., 50(3), 741–753.
Morrow J. A. and Ackermann M. E., (2012), Intention to persistand retention of first-year students: the importance of moti-vation and sense of belonging, Coll. Stud. J., 46, 483–491.
Murphy K. R. and Davidshofer C. O., (2005), Psychologicaltesting: principles and applications, 6th edn, Upper saddleriver, NJ: Prentice Hall.
National Research Council (NRC), (1996), National Science Educa-tion Standards, Washington, DC: National Academy Press.
Nilsson K. E. and Warren Stomberg M. I., (2008), Nursingstudents motivation toward their studies – a survey study,BMC Nurs., 7, 1–7.
Nunez J. L., Martin-Albo J. and Navarro J. G., (2005), Validity ofthe Spanish version of the echelle de motivation en education,Psicothema, 17(2), 344–349.
OECD, (2009), PISA 2009 assessment framework—key competenciesin reading, mathematics and science, Paris: OECD Publishing.
Ong M., Wright C., Espinosa L. L. and Orfield G., (2011), Inside thedouble bind: a synthesis of empirical research on undergraduateand graduate women of color in science, technology, engineer-ing, and mathematics, Harvard Educ. Rev., 81(2), 172–208.
Orsini C., Evans P., Binnie V., Ledezma P. and Fuentes F.,(2016), Encouraging intrinsic motivation in the clinicalsetting: teachers’ perspectives from the self-determinationtheory, Eur. J. Dent. Educ., 20, 102–111.
Osborne J., Simon S. and Collins S., (2003), Attitudes towardsscience: a review of the literature and its implications, Int.J. Sci. Educ., 25(9), 1049–1079.
Pintrich P. R., Smith D. A., Garcıa T. and McKeachie W. J.,(1993), Reliability and predictive validity of the MotivatedStrategies for Learning Questionnaire (MSLQ), Educ. Psychol.Meas., 53(3), 801–813.
Potvin P. and Hasni A., (2014), Interest, motivation and attitudetowards science and technology at k-12 levels: a systematicreview of 12 years of educational research, Stud. Sci. Educ.,50(1), 85–129.
President’s Council of Advisors on Science and TechnologyPCAST, (2012), Engage to excel: producing one million addi-tional college graduates with degrees in science, technology,engineering, and mathematics. Report to the President,Washington, DC: Executive Office of the President.
Ratelle C. F., Guay F., Vallerand R. J., Larose S. and Senecal C.,(2007), Autonomous, controlled, and amotivated types ofacademic motivation: a person-oriented analysis, J. Educ.Psychol., 99(4), 734.
Reeve J., (2009), Why teachers adopt a controlling motivatingstyle toward students and how they can become moreautonomy supportive, Educ. Psychol., 44, 159–175.
Reeve J., (2012), A self-determination theory perspective onstudent engagement, in Christenson S., Reschly A., WylieC., (ed.), Handbook of research on student engagement,New York: Springer Science+Business Media, pp. 149�172.
Reeve J., Deci E. L. and Ryan R. M., (2004), Self-determinationtheory: a dialectiacal framework for understanding socio-cultural influences on student motivation, in McInerneyD. M. and Etten S. V. (ed.), Big theories revisted, InformationAge Publishing, Inc., pp. 31–60.
Ryan R. M. and Connell J. P., (1989), Perceived locus of causalityand internalization: examining reasons for acting in twodomains, J. Pers. Soc. Psychol., 57, 749–761.
Ryan R. M. and Deci E. L., (2000), Self-determination theory andthe facilitation of intrinsic motivation, social development,and well-being, Am. Psychol., 55(1), 68–78.
Salta K. and Koulougliotis D., (2015), Assessing motivationto learn chemistry: adaptation and validation of ScienceMotivation Questionnaire II with Greek secondary schoolstudents, Chem. Educ. Res. Pract., 16(2), 237–250.
Salta K. and Tzougraki C., (2004), Attitudes toward chemistryamong 11th grade students in high schools in Greece, Sci.Educ., 88(4), 535–547.
Satorra A. and Bentler P. M. (1994), Corrections to test statisticsand standard errors in covariance structure analysis, invon Eye A. and Clogg C. C. (ed.), Latent variable analysis:applications for developmental research, Thousand Oaks,CA: Sage, pp. 399–419.
Schermelleh-Engel K., Moosbrugger H. and Muller H., (2003),Evaluating the fit of structural equation models: tests ofsignificance and descriptive goodness-of-fit measures,Methods of Psychological Research Online, 8(2), 23–74.
Schiefele U., (1991), Interest, learning, and motivation, Educ.Psychol., 26(3–4), 299–323.
Schunk D. H., Pintrich P. R. and Meece J. L., (2008), Motivationin education: theory, research, and applications, Upper SaddleRiver, New Jersey: Pearson.
Paper Chemistry Education Research and Practice
Publ
ishe
d on
21
Dec
embe
r 20
16. D
ownl
oade
d on
03/
01/2
017
13:5
5:21
. View Article Online
This journal is©The Royal Society of Chemistry 2016 Chem. Educ. Res. Pract.
Seery M. K., (2015), Flipped learning in higher educationchemistry: emerging trends and potential directions, Chem.Educ. Res. Pract., 16(4), 758–768.
Smith K. J., Davy J. A. and Rosenberg D. L., (2010), An examinationof the validity of the Academic Motivation Scale with a UnitedStates business student sample, Psychol. Rep., 106(2), 323–341.
Soenens B., Sierens E., Vansteenkiste M., Dochy F. and Goossens L.,(2012), Psychologically controlling teaching: examining outcomes,antecedents, and mediators, J. Educ. Psychol., 104, 108–120.
Spittle M., Jackson K. and Casey M., (2009), Applying self-determination theory to understand the motivation forbecoming a physical education teacher, Teach. Teach. Educ.,25(1), 190–197.
Stanca L., (2006), The effects of attendance on academicperformance: panel data evidence for introductory micro-economics, J. Econ. Educ., 37(3), 251–266.
Steele C. M. and Aronson J., (1997), A threat in the air: howstereotypes shape intellectual identity and performance,Am. Psychol., 52(6), 613–629.
Steiger J. H., (1990), Structural model evaluation and modification:an interval estimation approach, Multivar. Behav. Res., 25(2),173–180.
Stevens J. P., (2002), Applied multivariate statistics for the socialsciences, Mahwah, NJ: London.
Stover J. B., de la Iglesia G., Boubeta A. R. and Liporace M. F.,(2012), Academic Motivation Scale: adaptation and psycho-metric analyses for high school and college students,Psychol. Res. Behav. Manag., 5, 71–83.
Stuckey M., Hofstein A., Mamlok-Naaman R. and Eilks I.,(2013), The meaning of ‘relevance’ in science educationand its implications for the science curriculum, Stud. Sci.Educ., 49(1), 1–34.
Sturges D., Maurer T. W., Allen D., Gatch D. B. and Shankar P.,(2016), Academic performance in human anatomy andphysiology classes: a 2-yr study of academic motivationand grade expectation, Adv. Physiol. Educ., 40, 26–31.
Taylor G., Jungert T., Mageau G. A., Schattke K., Dedic H.,Rosenfield S. and Koestner R., (2014), A self-determinationtheory approach to predicting school achievement over time:the unique role of intrinsic motivation, Contemp. Educ.Psychol., 39(4), 342–358.
Thomas G. P. and McRobbie C. J., (2013), Eliciting metacognitiveexperiences and reflection in a year 11 chemistry classroom: anactivity theory perspective, J. Sci. Educ. Technol., 22(3), 300–313.
Tinto V., (2006), Research and practice of student retention:what next? J. Coll. Stud. Ret., 8(1), 1–19.
Tseng S.-C. and Tsai C.-C., (2010), Taiwan college students’ self-efficacy and motivation of learning in online peer assess-ment environments, Internet High. Educ., 13(3), 164–169.
Vaino K., Holbrook J. and Rannikmae M., (2012), Stimulatingstudents’ intrinsic motivation for learning chemistry throughthe use of context-based learning modules, Chem. Educ. Res.Pract., 13(4), 410–419.
Vallerand R. J., (1992), Intrinsic, extrinsic, and amotivationalstyles as predictors of behavior: a prospective study, J. Pers.,60, 599–620.
Vallerand R., (1997), Toward a hierarchical model of intrinsicand extrinsic motivation, in Zanna M. (ed.), Advances inexperimental social psychology, vol. 29, New York: AcademicPress, pp. 271–360.
Vallerand R. J. and Ratelle C. F., (2002), Intrinsic and extrinsicmotivation: a hierarchical model, in Deci E. L. and Ryan R. M.(ed.), Handbook of self-determination research, Rochester:The University of Rochester Press, pp. 37–60.
Vallerand R. J., Pelletier L. G., Blais M. R., Briere N. M., SenecalC. and Vallieres E. F., (1992), The Academic MotivationScale: a measure of intrinsic, extrinsic, and amotivation ineducation, Educ. Psychol. Meas., 52, 1003–1017.
Vallerand R. J., Fortier M. S. and Guay F., (1997), Self-determination and persistence in a real-life setting towarda motivational model of high school dropout, J. Pers. Soc.Psychol., 72(5), 1161–1176.
Vansteenkiste M., Simons J., Lens W., Sheldon K. M. and DeciE. L., (2004), Motivating learning, performance, and persis-tence: the synergistic effects of intrinsic goal contents andautonomy-supportive contexts, J. Pers. Soc. Psychol., 87,246–260.
Vansteenkiste M., Sierens E., Goossens L., Soenens B., DochyF., Mouratidis A., Aelterman N., Haerens L. and Beyers W.,(2012), Identifying configurations of perceived teacherautonomy support and structure: associations with self-regulated learning, motivation and problem behavior, Learn.Instr., 22, 431–439.
Villafane S. M., Garcia C. A. and Lewis J. E., (2014), Exploringdiverse students’ trends in chemistry self-efficacy through-out a semester of college-level preparatory chemistry, Chem.Educ. Res. Pract., 15(2), 114–127.
Wegge J. and Kleinbeck U., (1993), Motivational factors inabsence from work – the influence of achievement andaffiliation-related factors on attendance at the workplace,Z. Exp. Angew. Psychol., 40(3), 451–486.
Wigfield A., (1994), Expectancy-value theory of achievementmotivation: a developmental perspective, Educ. Psychol.Rev., 6, 49–78.
Wigfield A. and Eccles J. S., (2000), Expectancy-value theoryof achievement motivation, Contemp. Educ. Psychol., 25,68–81.
Xu X., Kim E. S. and Lewis J. E., (2016), Sex difference in spatialability for college students and exploration of measurementinvariance, Learn. Individ. Differ., 45, 176–184.
Yen H.-C., Tuan H.-L. and Liao C.-H., (2011), Investigating theinfluence of motivation on students’ conceptual learningoutcomes in web-based vs. Classroom-based science teachingcontexts, Res. Sci. Educ., 41(2), 211–224.
Ziegler A. and Heller K. A., (2000), Approach and avoidancemotivation as predictors of achievement behavior in physicsinstructions among mildly and highly gifted eighth-gradestudents, J. Educ. Gifted, 23(4), 343–359.
Zimmerman B. J., (2000), Attaining self-regulation: a socialcognitive perspective, in Boekaerts M., Pintrich P. R. andZeidner M. (ed.), Handbook of self-regulation, San Diego,CA: Academic, pp. 13–39.
Chemistry Education Research and Practice Paper
Publ
ishe
d on
21
Dec
embe
r 20
16. D
ownl
oade
d on
03/
01/2
017
13:5
5:21
. View Article Online