Chemical treatment of backsawn Tasmanian Oak with ... · PDF file1.2 Stylised depiction of an...
222
Chemical treatment of backsawn Tasmanian Oak with Polyethylene Glycol (PEG) prior to drying By John Ralph, B.App.Sc.(Sport Science), B.Biomed.Sc.(Hons.) A thesis submitted in fulfilment of the degree of Doctor of Philosophy School of Human Life Sciences University of Tasmania, Launceston December, 2006
Transcript of Chemical treatment of backsawn Tasmanian Oak with ... · PDF file1.2 Stylised depiction of an...
Chemical treatment of
backsawn Tasmanian Oak
with Polyethylene Glycol (PEG) prior to drying
By
John Ralph, B.App.Sc.(Sport Science), B.Biomed.Sc.(Hons.)
A thesis submitted in fulfilment of the degree of
Doctor of Philosophy
School of Human Life Sciences
University of Tasmania, Launceston
December, 2006
ii
Table of Contents Page No. DECLARATION vi LIST OF ABBREVIATIONS vii LIST OF FIGURES viii LIST OF TABLES xii ACKNOWLEDGMENTS xiii PUBLICATIONS xvi PRESENTATIONS TO LEARNED SOCIETIES xvi ABSTRACT xvii
CHAPTER ONE - GENERAL INTRODUCTION (LITERATURE REVIEW) 1.1 Introduction 1 1.2 Eucalyptus species 2 1.2.1 Taxonomy and Classification of Eucalyptus sp. 2
1.2.2 History of Eucalyptus sp. 4 1.2.3 Tasmanian Oak 5
1.3 Wood Composition and growth 7 1.3.1 Cell structure in plants 7 1.3.2 Growth and development of the tree structure 8 1.3.3 Sapwood and heartwood 9 1.3.4 Earlywood and latewood 10 1.3.5 Composition of a typical wood fibre 11 1.3.6 Structure and function of the cell layers 14 1.3.7 Wood macrostructure 16 1.4 Wood-water considerations 19 1.4.1 Water and cellulose 19 1.4.2 Moisture loss in drying timber 23 1.4.3 Measurement of wood moisture content 26 1.5 Shrinkage in wood 28 1.5.1 Anisotropy 29 1.5.2 Anisotropic considerations for drying sawn timber 32 1.6 Defects caused during drying 37 1.6.1 Collapse 37 1.6.2 Checking 39 1.6.3 Drying defect in Tasmanian Oak 41 1.6.4 The rationale of chemical treatment of timber before drying 42

iii
1.7 Polyethylene glycol 44 1.7.1 Timber treatment with PEG 44 1.7.2 Contemporary, industrial use of PEG in wood 47 1.8 The chemistry of polyethylene glycol 49 1.8.1 The solubility of PEG 50 1.8.2 The effect of PEG on water 53 1.8.3 Water Activity (aw) 55 1.8.4 Movement of PEG in wood 57 1.8.5 PEG binding to cellulose 58 1.8.6 Variables affecting movement of PEG in timber 63
1.9 Summary 64 CHAPTER TWO – PEG PENETRATION IN TASMANIAN OAK 2.1 General Introduction 65 2.2 Staining procedures for the detection of polyethylene glycol in timber 66 2.2.1 Introduction 66 2.2.2 Methods 67 2.2.2.1 Sample preparation 67 2.2.2.2 Incubation 68 2.2.2.3 Preparation of sample slices 69 2.2.2.4 Staining methods 69 2.2.2.5 Visualising PEG penetration in timber 70 2.2.3 Results 70 2.2.4 Discussion 73 2.2.5 Conclusion 76 2.3 Quantifying PEG penetration in Tasmanian Oak 77 2.3.1 Introduction 77 2.3.2 Method 78 2.3.2.1 Determining a suitable PEG concentration 78 2.3.2.2 Effects of temperature, concentration and species 79 2.3.2.3 Data Analysis 79 2.3.3 Results 81 2.3.3.1 Determining a suitable PEG concentration 81 2.3.3.2 Effects of time, temperature and PEG molecular weight on PEG penetration in Tasmanian Oak 81 2.3.4 Discussion 87 2.3.5 Conclusion 92 2.4 PEG penetration in drying timber 94 2.4.1 Introduction 94 2.4.2 Method 95 2.4.3 Results 96 2.4.4 Discussion 97 2.4.5 Conclusion 98

iv
2.5 Histological inspection of PEG in Tasmanian Oak 99 2.5.1 Introduction 99 2.5.2 Method 99 2.5.3 Results 100 2.5.4 Discussion 103 2.5.5 Conclusion 105 2.6 General Conclusion 106 CHAPTER THREE – THE PHYSICAL EFFECTS OF PEG TREATMENT ON MOISTURE CONTENT AND DIMENSIONAL STABILITY OF TASMANIAN OAK DURING DRYING 3.1 General Introduction 108 3.2 Differences in dimensional change in Tasmanian Oak due to 109 pre-treatment with PEG 3.2.1 Introduction 109 3.2.2 Method for assessing dimensional change 109 3.2.3 Results 113 3.2.3.1 Shrinkage 113 3.2.3.2 Mass lost (as moisture) 115 3.2.3.3 Dimensional change 115 3.2.3.4 Visual assessment of the timber 116 3.2.4 Discussion 117 3.3 The effect of PEG treatment on moisture content loss in Tasmanian Oak 118 3.3.1 Introduction 118 3.3.2 General method for drying trials 118 3.3.2.1 Obtaining samples 118 3.3.2.2 Sample preparation 119 3.3.2.3 Chemical treatment 119 3.3.2.4 Obtaining sample slices 120 3.3.2.5 Obtaining slice sections and moisture content determination 120 3.3.2.6 Analysis 121 3.3.3 Method for timber treated with PEG an SDS 122 3.3.4 Results 125 3.3.5 Discussion 129 3.3.6 Conclusion 133 3.4 Tangential moisture content profiles 134 3.4.1 Introduction 134 3.4.2 Methods 135 3.4.3 Results 136 3.4.4 Discussion 142 3.4.5 Conclusion 145

v
3.5 The effect of increasing PEG concentration on moisture loss, 146 shrinkage and dimensional stability in Tasmanian Oak 3.5.1 Introduction 146 3.5.2 Methods 147 3.5.2.1 Assessment of shrinkage 149 3.5.2.2 Assessment of distortion 149 3.5.3 Data analysis 149 3.5.4 Results 150 3.5.4.1 Change in Moisture Content 150 3.5.4.2 Shrinkage 156 3.5.4.3 Comparison of moisture loss and shrinkage 158 3.5.4.4 Distortion 162 3.5.5 Discussion 163 3.5.5.1 Moisture loss 163 3.5.5.2 Shrinkage 168 3.5.5.3 Moisture loss and shrinkage 169 3.5.5.4 Assessment of distortion 171 3.5.6 Conclusion 171 3.6 An investigation into the effects of water activity on drying Tasmanian Oak 172 3.6.1 Introduction 172 3.6.2 Method 174 3.6.3 Results 178 3.6.4 Discussion 180 3.6.5 Conclusion 183 CHAPTER FOUR – GENERAL DISCUSSION, RECOMMENDATIONS AND GENERAL CONCLUSION 4.1 General Discussion & Recommendations 184 4.2 General Conclusion 192 REFERENCES 194 APPENDICES (ON CD) Appendix 1 – Moisture content loss profiles from Section 3.3 Appendix 2 – Moisture content loss profiles from Section 3.4 and 3.5 Appendix 3 – Design and development of constant conditions chamber from Section 3.6

vi
DECLARATION I certify that this thesis contains no material which has been accepted for the award of any
other degree or diploma in any Institute, College or University, and that, to the best of my
knowledge and belief, it contains no material previously published or written by another
person except where due reference is made in the text.
John Ralph
STATEMENT OF AUTHORITY OF ACCESS
This thesis may be made available for loan and limited copying in accordance with the
Copyright Act 1968.
John Ralph

vii
List of Abbreviations
aw – Water activity
ERH – Equilibrium relative humidity
IMC – Initial moisture content
IRP – Initial rate of penetration
FRP – Final rate of penetration
MC – Moisture content
NaCl – Sodium chloride
ODW – Oven dry weight
PEG – Polyethylene glycol
RH – Relative humidity
SDS – Sodium dodecyl sulphate
SEM – Standard error of the mean

viii
List of Figures Figure Page 1.1 Growth divisions in young wood. 8 1.2 Stylised depiction of an annular growth ring border. 10 1.3 Cross section of a wood cell wall showing cell wall layers and composition of the three solid wood components. 13 1.4 Structure of a wood cell (fibre). 15 1.5 Microscopic appearance of hardwood and softwood. 17 1.6 Interaction of water with cellulose hydroxide groups in the plant cell wall. 20 1.7 Effects of water interaction with the wood structure. 21 1.8 Orientations in timber. 30 1.9 Typical shrinkage curves for the three dimensional aspects of timber geometry. 31 1.10 Sawlog cutting pattern for obtaining quartersawn and backsawn timber. 33 1.11 Shrinkage patterns caused by differential tangential and radial shrinkage. 33 1.12 Cutting patterns for obtaining maximum backsawn and quartersawn timber. 35 1.13 End view of a drying backsawn board. 39 1.14 Schematic projections of polyethylene glycol (≈ PEG 200) with four repeating ethoxy units. 49 1.15 Co-ordination of the PEG molecular chain in water. 52 1.16 Changes in water activity (aw) with changes in water mole fraction by the addition of varying molecular weight PEGs. 56 1.17 Theoretical interaction of PEG with cellulose with hydroxide groups in the plant cell wall. 59 2.1 Manual slicer for cutting transverse sections. 67 2.2 Malaprade staining reactions on filter paper. 70 2.3 Iodine-stained samples of E. obliqua. 71

ix
2.4 Staining of PEG-treated samples of E. regnans. 71 2.5 (a) Photomicrographs of stained sections showing extent of PEG penetration.
72 2.5 (b) Photomicrographs of stained sections showing extent of PEG penetration 73 2.6 Representative samples of penetration in E. regnans incubated for 96 hours PEG-400 solutions of concentrations. 81 2.7 PEG-400 (30% v/v) penetration in E. delegatensis at three incubation temperatures. 84 2.8 PEG penetration (30% v/v) in E. regnans at 60°C at three molecular weights of PEG. 84 2.9 PEG-600 (30% v/v) penetration (±SEM) in Tasmanian Oak species after incubation at 60°C. 85 2.10 Initial Rate and Final Rate of Penetration of PEG-1000 (30%v/v) penetration at three temperatures: 30°C, 45°C and 60°C. 86 2.11 Penetration of 30% PEG-400 (v/v) in air-dried E. regnans. 96 2.12 E. regnans treated with PEG 600 (Transverse, 600x). 100 2.13 E. regnans treated with PEG 600 (Transverse, 700x). 101 2.14 E. regnans treated with PEG 600 (Radial, 100x). 101 2.15 E. regnans treated with PEG 600 (Radial, 400x). 102 2.16 E. regnans treated with PEG 600 (Tangential, 400x) . 102 2.17 E. regnans treated with PEG 600 (Tangential, 600x). 103 3.1 Numbering the positions of individual samples in control and PEG-treated charges of E. delegatensis. 110 3.2 Obtaining middle sections for reconditioning and assessment of deviation from original shape. 111 3.3 Determining angle of deflection from the perpendicular angles of freshly sawn timber and dried timber. 112 3.4 Cumulative % radial shrinkage in E. delegatensis for untreated control samples or samples treated with 30% PEG-400 (v/v). 113 3.5 Cumulative % tangential shrinkage in E. delegatensis for untreated control samples or samples treated with 30% PEG-400 (v/v). 114

x
3.6 Cumulative % mass lost in E. delegatensis for untreated control samples and samples treated with 30% PEG-400 (v/v). 115 3.7 Distinction of Inner and Outer sample groups. 121 3.8 Chemical structure of sodium dodecyl sulphate. 123 3.9 Cutting pattern to obtain a radial cross section of the core of treated and untreated samples. 124 3.10 Average Moisture Content (% MC) loss from outer-stacked untreated E. regnans controls or treated with PEG 400 (30% v/v) or saturated SDS solution. 125 3.11 Average Moisture Content (% MC) loss from inner-stacked untreated E. regnans controls or treated with PEG 400 (30% v/v) or saturated SDS solution. 126 3.12 Core moisture content profiles at T = 0h and T = 384h for least exposed
samples in charges of untreated E. regnans and samples treated with saturated SDS or 30% PEG 400. 127
3.13 Representative core moisture content profiles at T = 528h for most
central samples from charges of untreated control and treated with SDS or PEG 400 (30% v/v). 128
3.14 Representative core moisture content profiles at T = 1200h for most
central samples from charges treated with 30% (v/v) PEG, saturated SDS and untreated control. 128
3.15 Cutting pattern to obtain a tangential cross section of the core of treated and untreated samples. 136 3.16 Comparison of whole %MC in inner and outer samples. 137 3.17 Comparison of core %MC values in inner and outer samples. 138 3.18 Moisture content profiles for whole and core slices. 139 3.19 Representative tangential %MC profiles for individual PEG-treated and untreated E. regnans. 140 3.20 Absolute %MC difference between outer tangential surfaces (case pieces) of E. regnans treated with PEG 400 (30% v/v) and untreated control. 141 3.21 Reproducible method of obtaining comparable moisture content and dimensional data. 148
xi
3.22 Cutting pattern to obtain a radial and tangential cross section of slices from treated and untreated sample boards. 148 3.23 Moisture Content (% MC) over 1200 hours of drying time in PEG-treated and untreated E. Regnans 150 3.24 Change in %MC between T = 0h and T = 18h. 152 3.25 ∆ MC % between Inner and Outer sample boards. 153 3.26 Mean ∆ %MC between radial and tangential cutting patterns in whole and core samples. 154 3.27 Representative core moisture content profiles at T = 384h 155 3.28 Radial dimensional change in E. regnans over a drying period of 1200 hours. 156 3.29 Tangential dimensional change in E. regnans over a drying period of 1200 hours. 157 3.30 Radial dimensional loss v average %MC loss in E. regnans. 159 3.31 Tangential dimensional loss v average %MC loss in E. regnans. 160 3.32 Comparison of incremental %shrinkage for individual treatments. 161 3.33 Mean deflection angles in PEG-treated and untreated E. regnans before (T = 0h) and after air drying (T = 1392h). 162 3.34 Schematic layout of constant conditions chamber with front view and side view. 177 3.35 Average moisture content (±SEM) in E. regnans treated with respective aqueous solutions and aw. 178 3.36 Average moisture content (±SEM) in E. regnans treated with respective aqueous solutions and aw. 179 4.1 Overview of key academic, methodological and commercial findings in the current body of research. 185
xii
List of Tables Table Page 1.1 Taxonomical derivation of Eucalyptus sp. 3 1.2 Description of the Tasmanian Oak eucalypts. 6
2.1 Average penetration distance of PEG for samples incubated in 30% PEG at molecular weights of 400, 600 and 1000 at temperatures of 30ºC, 45ºC and 60ºC for between 2 and 7 days. 82 2.2 Representative confidence intervals (C.I.s) for Day 2 and Day 7 for samples incubated in 30% (v/v) of PEG at molecular weights of 400, 600 and 1000 at temperatures of 30ºC, 45ºC and 60ºC. 83 2.3 Estimate of Mean Depth for treatment combinations of PEG molecular weight (MW) and temperature. 85 3.1 Mean deflection° (α) for treated and untreated samples before and after reconditioning. 115 3.2 Visual assessment of control and PEG-treated E. delegatensis. 116 3.3 Supplemental data from Figure 3.23. 151 3.4 Significant difference for all treatment combinations as assessed by T-test. 153 3.5 Percentage radial and tangential loss and ratio of tangential and radial loss in treated and untreated timber. 156 3.6 Chemical molecular weight, molality, concentration (w/v) and the aw depression achieved. 174 3.7 Rate of moisture loss for each treatment type and untreated control between T = 0h and T = 141h. 180 4.1 Future research directions from the current body of research. 187
xiii
Acknowledgements
I would like to thank my employers, previously Tasmanian Kiln-Dried Timbers, and
currently Timber Resources, for having the far-sighted vision to invest in research for a
commercial outcome. This is a seemingly rare quality in much of the Tasmanian timber
industry and I believe that the field-work that will result from this preliminary study can
reap a very great reward. My Father, Fred Ralph, has been the commercial driving force
behind both of these companies and the outcomes of this project would not have been
possible without his involvement.
At the University of Tasmania (Launceston) I would like to extend my gratitude to
Professor Madeleine Ball, Head of the School of Human Life Sciences, for giving me
every opportunity to complete this thesis. Professor Ball was of great strategic assistance
in the latter stages of this project’s completion and I thank her for her support. I would
also like to thank the School of Chemistry (Murray Frith in particular) for providing me
with an office and lab space for use during the first half of this study.
Associate Professor Dominic Geraghty willingly assisted in my moments of greatest
need, batted for me when no-one else would (or sometimes should!) have and will be
greeted with a complimentary pint of the dark stuff should we meet in any institution that
has the presence of mind (and good taste) to have Guinness on tap. Go raibh mile maith
agaibh. My final nod of academic gratitude goes to Dr Steve Edwards. Steve has been
almost omnipresent for my extensive years of academic endeavour and it is fitting that he
filled many and varied roles in the current project. Figure 3.30 and 3.31 are “Edwards
Graphs”. As Steve and Dominic were my co-supervisors on my Honours project, it is
perhaps appropriate that they both played their respective roles in the ‘next step’.
xiv
Jill Wells, Research Librarian at the UTL Library, did an incredible job of tracking down
the most obscure references to the subject matter in this thesis and I’m sure she is just as
glad as I am that the river of Document Delivery Request forms has dried up. Other
providers of invaluable information were Linda Clarke (Wood Conservator, Queen
Victoria Museum & Art Gallery, Launceston), Dr Ian Godfrey (Curator, Organic
Materials), Western Australian Maritime Museum), Dr Greg Young (Department of
Canadian Heritage), Bill McGlynn (Research Assistant, Forest Products Laboratory,
Wisconsin, USA), Dr Per Hoffmann (Curator, Deutsches Schiffahrtsmuseum, Germany),
Dr Luiz Oliveira (Senior Wood Drying Scientist, Forintek, Canada), Jugo Ilic (Senior
Wood Scientist, CSIRO, Forestry and Forest Products Division) and Steven van Dulken
(British Library). I would like to also thank those who assisted with interpreting some of
the articles from their native languages: Kerstin Larsson, Gundars Simsons and the late
Kurt Beyer II. I am also very grateful for the guidance of Dr Iain Robertson, Dr Anitra
Hobby and Dr Des FitzGerald in the ‘black art’ of statistics. A special thanks to Alieta
Eyles (then PhD candidate, CRC Forestry (Hobart)), Dr Geoff Grossell and Mr Barry
Gormley for their assistance with the histology in this thesis.
Timber research was a completely new field of endeavour for me and I was very reliant
initially on completely new sources of information and advice. My thanks go to Dr
Trevor Innes from the Timber Research Unit at UTL. Trevor’s ongoing support
throughout the project has been invaluable and his practical and theoretical knowledge of
kiln drying Tasmanian eucalypts make him a prominent member of the timber research
community in Australia. My research is better for exposure to that.

xv
The timber industry functions properly only when people of great practical skill and
knowledge are involved and my research has benefited greatly from the observations and
contributions of people at all levels of the industry. In particular, I would like to
acknowledge the assistance and encouragement of Mr Des Taylor, Mr Craig Lewis and
Mr Peter Watson.
PhD candidates struggle to succeed without committed support outside of Academia.
Simon Gladman, once again, put in the hard yards with hours (and hours!) of data entry
and keeping the computers running like they should. Garry Murray built, from scratch,
equipment that otherwise did not exist and which was integral to the completion of the
early projects.
Jaqui Stevenson and Sally Fahey, each in their own ways, have been such marvellous
supporters of me and, in turn, the completion of this project. Sally became proactive in
her support by becoming the world’s finest Lab, um, Assistant. If you ever need
something glued with araldite, have I got the girl for you!
This thesis is dedicated to my late Grandmother, Laurie Ralph, who awoke in me a
passion for learning from a very early age.
xvi
Publications
Ralph, J.F. (2002), Treatment of backsawn Tasmanian Eucalypt timber prior to kiln
drying: a chemical method of reducing drying stress, Abstracts for 37th Australasian
Timber Drying Group Meeting, Launceston, Tasmania, April 2-5, 2002.
Ralph, J.F. & Edwards, S.J. (2004), PEG penetration in three commercially important
Tasmanian eucalypt species, Wood.Fib.Sci., 36(4):611-619.
Ralph, J.F. (2006), PEG Penetration and the Effects of PEG Pretreatment in Air-Dried
Eucalyptus, Wood.Fib.Sci., 38(1):139-143.
Presentations to Learned Societies
Ralph, J.F. (2002), Treatment of backsawn Tasmanian Eucalypt timber prior to kiln
drying: a chemical method of reducing drying stress, 37th Australasian Timber Drying
Group Meeting, Launceston, Tasmania, April 2-5, 2002.
Ralph, J.F. (2003) Chemical treatment of backsawn Tasmanian Oak with polyethylene
glycol, Seminar for Wood Scientists, CSIRO Forestry & Forest Products Division,
Clayton, Victoria, March 28th, 2003.

xvii
Abstract
A series of experiments was conducted with the view of obtaining baseline information
on the use of polyethylene glycol (PEG) on Tasmanian Oak for the purpose of improving
the quality of the seasoned structural timber product. Tasmanian Oak is the marketing
name for a triad of Tasmanian-grown eucalypt species (E. delegatensis, E. obliqua, and E.
regnans). Incubation of freshly-milled timber in aqueous PEG solutions prior to
seasoning follows on from investigations in northern hemispheric timber species such as
hoop pine and spruce in the middle of the 20th Century.
PEG penetrates freshly sawn Tasmanian Oak in a manner which is considerate of
incubation time, temperature, PEG molecular weight/size and timber density.
Histological examination indicated that PEG penetrated completely throughout the
structure of the wood substance in three orientations (transverse, radial and tangential).
During air-drying of PEG soaked timber, further migration of PEG into Tasmanian Oak is
negligible. The rate of moisture content loss in Tasmanian Oak was shown to be retarded
by PEG pre-treatment although the ability to prevent moisture loss was not concomitant
with dimensional stability. An investigation to explain the change in rate of moisture loss
examined effects on the thermodynamic property, water activity. Results indicated that a
change in solution water activity could partly expain changes in the rate of moisture
content loss, but more research is required to better divine this relationship.
Shrinkage in Tasmanian Oak was reduced after treatment with aqueous PEG 400
solutions at or above 30% (v/v), with a greater percentage reduction in tangential
shrinkage compared to reduction in radial shrinkage. This is significant as backsawn

xviii
(a.k.a. flatsawn) timber, with its broader tangential face, was in particular focus. The
reduction in shrinkage was consistent with PEG concentration in the incubating medium.
A decrease in the formation of drying defect, such as surface and internal checking
accompanied the improvement in keeping sawn dimensions.
Backsawn Tasmanian Oak obtained from young trees (less than 20 years) from plantation
resource presents a challenging profile for commercial timber drying and will become
more prevalent as the logging of old-growth forests is phased out. Timber seasoners may
be faced with options of longer drying times or lower yields due to drying defect unless a
method can be developed to provide added protection to the sawn timber product during
drying. At this stage, pre-treatment of Tasmanian Oak with PEG shows the hallmarks of
providing a solution to this emerging dilemma.
1
1.1 Introduction
The nature of the timber resource in Australia and Worldwide has changed in the last
100 years with a shift from old growth (native) forests to regrowth forests and now
forest plantations. With a need to balance environmental/ecological concerns and
demand for the resource, timber sourced from plantation-grown trees is likely to play
an increasing role in provision of hardwood products (Northway, 2001). In the last
50 years, the amount of timber being cut from regrowth trees in Tasmania has
increased from 38% to 62%.
On May 13th, 2005 a new deal for Tasmanian Forests was announced by Australian
Prime Minister, John Howard, and Tasmanian Premier, Paul Lennon, to ensure the
vast reduction of resource available from old growth forests. A resource of
plantation eucalypts for use as structural timber will continue to increase in
prominence in the future.
The method of rapidly growing Eucalypts in plantations and harvesting after less
than 20 years growth is having an impact on downstream processing: the nature of
the cell structure of wood from regrowth trees is different when compared to old
growth and regrowth wood. The cells from plantation timbers have larger lumens
and a thinner cell wall and both of these factors cause regrowth timber to succumb to
the forces created within the timber during rapid drying.
The drying schedules used to successfully kiln dry old growth timber are simply too
harsh for regrowth timber, and drying defect in the form of surface and internal
checks are a common malady. Furthermore, younger trees have smaller diameters
and, in order to saw boards of larger width, the log must be sawn in the backsawn
2
(aka flatsawn) orientation. Timber sawn in the backsawn orientation has the largest
tangential aspect. Due to anisotropic shrinkage, the tangential face is most
susceptible to shrinkage and drying defects. With these obstacles to navigate, there
may be justification in the added expense of a chemical pre-treatment to alleviate
drying stresses in regrowth timber. Industrial timber treatments such as copper-
chrome-arsenate and borate are common and these practices suggest that it is
possible for a business to incur the added expense of a chemical treatment regime
and still be economically viable.
A review of the relevant literature precedes the experimental chapters. This includes
an overview of species Eucalyptus, in particular E. obliqua, E. delegatensis, E.
regnans that are collectively marketed as ‘Tasmanian Oak’. The history of
polyethylene glycol (PEG) use in the timber industry is also included.
1.2 Eucalyptus species
1.2.1 Taxonomy and classification and distribution of Eucalyptus sp.
The plant Kingdom is divided first into Phyla, which include divisions such as ferns,
seed bearing plants and mosses. Beyond this, perhaps the most important
taxonomical distinction in terms of commercial, structural timber production is at the
class level. The two Classes of seed bearing plants are the angiosperms and the
gymnosperms. Gymnosperms include all conifers, the Order that encompasses pines,
cedars and spruces. The gymnosperms are all cone-bearing trees and are regarded as
softwoods. The angiosperms all have flowers, bear covered seeds and can be Sub-
classed into two groups: the mono- and dicotyledons. The monocots include palms,
bamboo, grasses and wheat, these being distinctly different from dicots such as
myrtles, bottlebrushes and eucalypts, which are all hardwoods.

3
The notion of hardwood and softwood is ambiguous as the physical hardness of the
timber can be variable and does not agree with the binomial taxonomical division.
The distinction refers to the specific gravity or density of the timber: hardwoods and
softwoods are above and below a critical value of 0.41 g/mL respectively
(Northington & Goodin, 1984). Eucalyptus species (sp.), is an angiosperm (and
therefore a hardwood) and this study will be confined to three Eucalypts grown in
Tasmania: E. obliqua, E. delegatensis and E. regnans.
Since the original classification of eucalypts around the time of European Settlement
in Australia, there have been revisions of the species with additions to, and deletions
from, the list. As new methods of analysis became available, novel suggestions for
reordering the species seemed to follow. Not surprisingly, since the advancement of
DNA sequencing, the ‘who’s who’ of Eucalyptus sp., and how each species should
be classified, has been a hotbed of contention. Table 1.1 is a general taxonomical
summary of Eucalyptus sp.
Table 1.1 Taxonomical derivation of Eucalyptus sp. (Hooker, 1860; Curtis & Morris, 1975; Morgan, 1981; Raven et al., 1981; Northington & Goodin, 1984; Kirkpatrick & Backhouse, 1985; Hoadly, 1990; Eaton & Hale, 1993; Waterson, 1997). Descriptor Classification Distinguishing features Kingdom Plantae Lack locomotive movement, possess cell walls, no obvious nervous
or sensory organs Division Anthophyta Flowering plants Class Angiospermopsida Broad leaved plants with encapsulated seeds Sub-class Dicotyledones Two cotyledons (primary seed leaves of the embryo plant) arising
from the germinated seed. Super-order Rosidae Flowers of most members contain distinct petals, rarely uniting to
form a lobed corolla tube. Spirally arranged stamens often numerous with gynoecium apocarpus or monocarpus
Order Myrtiflorae Opposite leaves; flower parts in cycles rather than in spirals, differentiation of xylem around isolated strands of phloem in the stem.
Family Myrtacae Leaves simple, usually dotted with aromatic glands Sub-Family Leptospermoideae Usually dry capsular fruits, opening at the summit Genus Eucalyptus Many dry, woody seeded fruits. Sepals and petals fused to make an
operculum that is shed when the stamen matures.

4
More than 700 species of eucalypt are endemic to Australia yet 75 per cent of the
continent supports only 25 species (Breeden & Breeden, 1972). There are 12 native
species in Timor, Papua New Guinea, some Indonesian islands and Mindanao in the
southern Philippines (Zacharin, 1972). Of the 12, five are found exclusively in
Australia and New Guinea (Breeden & Breeden, 1972) while two species, E.
urophylla and E. deglupta, do not occur naturally in Australia (Zacharin, 1972). The
latter is the only eucalypt to grow naturally in the northern hemisphere (Boland et al.,
1984).
Although certain species may be found in specific localities, eucalypts are found in
every state of Australia. The combined abilities of eucalypts to grow rapidly, even in
areas of lower rainfall, and an extraordinary ability to thrive after fire, have given
rise to large tracts of forest, especially in Australia’s southeast (Vandenbeld, 1988).
In areas where vegetation is well supported, eucalypts are absent from tropical and
subtropical rainforests along the eastern coastline of mainland Australia and
temperate rainforests in Victoria and Tasmania (Boland et al., 1984), but abut them
with striking demarcation (Vandenbeld, 1988).
1.2.2 History of Eucalyptus sp.
The precise history of the eucalypt origin is not known, as the fossil record of the
plant has only been traced back 35 million years to the Oligocene epoch. It is
possible that eucalypts descended into a single group from as many as nine (long
extinct) rainforest ancestors (Vandenbeld, 1988). The absence of native eucalypts in
New Zealand, South America, South Africa, Madagascar and Southern India suggest
that species development occurred after the break-up of Gondwanaland, the Southern
Hemispheric supercontinent (Lange, 1981). In contrast, the genus Nothofagus is

5
found on the continents of the Southern Hemisphere (only) and is considered a plant
of Gondwanan origin (Hill & Orchard, 1999). Moreover, the establishment of the
Genus Eucalyptus might be at the point where the Order Myrtiflorae branched off as
the family Myrtacae (Lange, 1981). Although almost exclusively a native to the
Southern Hemisphere, plantations of eucalypts have been successfully grown to
latitudes 45º north of the equator (Zacharin, 1978).
The word ‘eucalyptus’ came from the Greek εν (well) and καλνπτω (to cover) and
pertains to the appearance of the bud cap (calyptra) of the operculum that is
dispensed when the flowers blossom (Hooker, 1860). The name has since proven to
not accurately describe all members of Eucalyptus sp. as the Angophora subgenera
have small petals and supports Barrow’s (2000, p.9) opinion that a genus is a
“…grouping of questionable natural significance”.
In 1790, Surgeon-General to the Settlement John White and Dr James Smith
described a gummy resin from E. resinifera as the “..astringent inspissated juice of
the brown gum tree of New Holland” (White, 1790, p.233). Although it was quickly
utilised and lauded as a treatment of dysentery, its legacy has simply been its name:
although not all eucalypts exude the gum, the term ‘gum tree’ is the ubiquitous,
common name for any tree of the species.
1.2.3 Tasmanian Oak
Hooker (1860) described a species of eucalypt as E. gigantea after the size of the
trees. While this name was intended for what, in the late 19th Century, became
accepted as E. delegatensis, further investigation of Hooker’s ‘species’ revealed that
E. gigantea consisted of not one, but three, species - the same three classed as
6
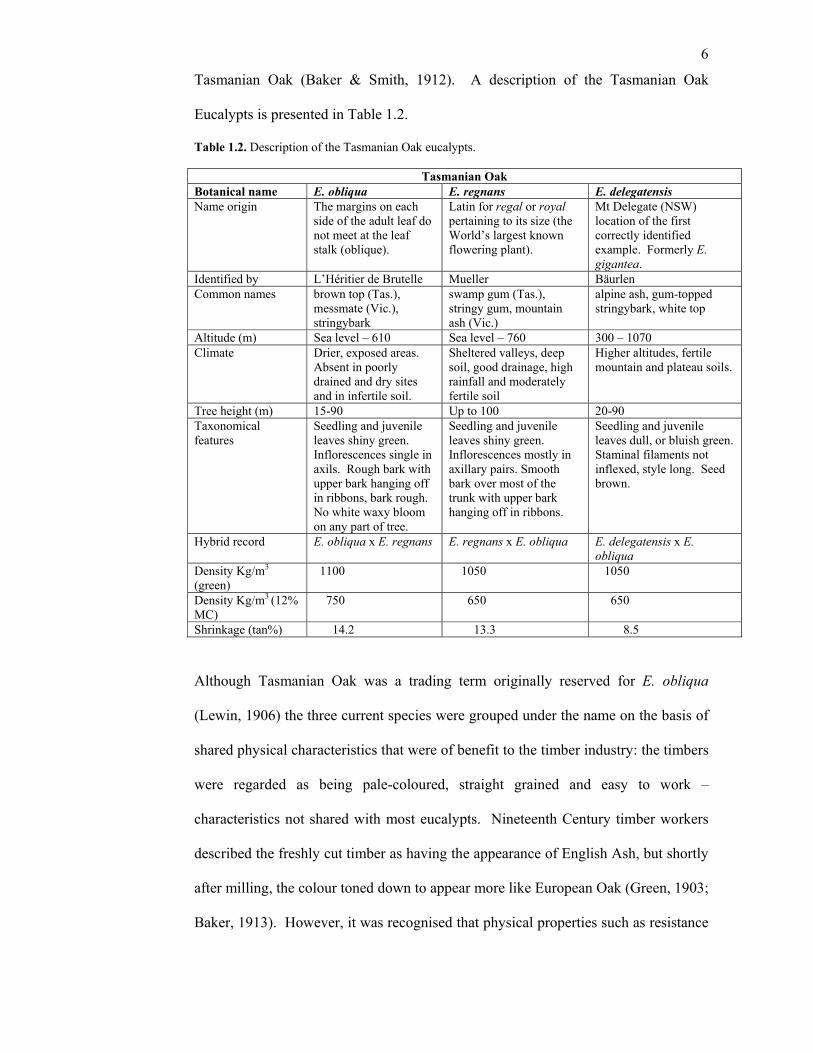
Tasmanian Oak (Baker & Smith, 1912). A description of the Tasmanian Oak
Eucalypts is presented in Table 1.2.
Table 1.2. Description of the Tasmanian Oak eucalypts.
Tasmanian Oak Botanical name E. obliqua E. regnans E. delegatensis Name origin The margins on each
side of the adult leaf do not meet at the leaf stalk (oblique).
Latin for regal or royal pertaining to its size (the World’s largest known flowering plant).
Mt Delegate (NSW) location of the first correctly identified example. Formerly E. gigantea.
Identified by L’Héritier de Brutelle Mueller Bäurlen Common names brown top (Tas.),
messmate (Vic.), stringybark
swamp gum (Tas.), stringy gum, mountain ash (Vic.)
alpine ash, gum-topped stringybark, white top
Altitude (m) Sea level – 610 Sea level – 760 300 – 1070 Climate Drier, exposed areas.
Absent in poorly drained and dry sites and in infertile soil.
Sheltered valleys, deep soil, good drainage, high rainfall and moderately fertile soil
Higher altitudes, fertile mountain and plateau soils.
Tree height (m) 15-90 Up to 100 20-90 Taxonomical features
Seedling and juvenile leaves shiny green. Inflorescences single in axils. Rough bark with upper bark hanging off in ribbons, bark rough. No white waxy bloom on any part of tree.
Seedling and juvenile leaves shiny green. Inflorescences mostly in axillary pairs. Smooth bark over most of the trunk with upper bark hanging off in ribbons.
Seedling and juvenile leaves dull, or bluish green. Staminal filaments not inflexed, style long. Seed brown.
Hybrid record E. obliqua x E. regnans E. regnans x E. obliqua E. delegatensis x E. obliqua
Density Kg/m3 (green)
1100 1050 1050
Density Kg/m3 (12% MC)
750 650 650
Shrinkage (tan%) 14.2 13.3 8.5
Although Tasmanian Oak was a trading term originally reserved for E. obliqua
(Lewin, 1906) the three current species were grouped under the name on the basis of
shared physical characteristics that were of benefit to the timber industry: the timbers
were regarded as being pale-coloured, straight grained and easy to work –
characteristics not shared with most eucalypts. Nineteenth Century timber workers
described the freshly cut timber as having the appearance of English Ash, but shortly
after milling, the colour toned down to appear more like European Oak (Green, 1903;
Baker, 1913). However, it was recognised that physical properties such as resistance

7
to fungal attack, breaking strain and resistance to wear were superior to its European
look-alike (Lewin, 1906).
It was thought that the apparent similarities between the three species of Eucalypt
timbers removed the need for speciation of the trees and they were processed and
marketed in mixed species under the name of ‘Tasmanian Oak’ or ‘Tasmanian
Hardwood’. In Victoria, the Tasmanian Oak species became the three major
eucalypt types marketed as the ‘Victorian Ash’ group of eucalypts (Turnbull et al.,
1938).
1.3 Wood Composition and growth
The main components of wood are cellulose, hemicellulose, lignin and water and it is
water, cellulose and the relationship between them, which will be in focus in this
review.
1.3.1 Cell structure in plants
The origins of the modern knowledge of cell structure can be attributed to Robert
Hooke who, in 1665, published Micrographia and in it, coined the term ‘cell’ to
describe the appearance of cork under a microscope. A full review of the evolution
of plant cell structure would mention the works of Schleiden (1837 - ‘all plants are
made of cells and the growth of plants came from the production of new cells’) and
Perhaps the first recognised attempt to experimentally determine the constituency of wood was Johann Baptist von Helmont. In 1648, von Helmont planted a young willow tree in exactly 200lb (90.8Kg) of soil which had been dried in a furnace. The vessel containing the soil and the willow seed was covered with a metal plate so that the only weight added to the soil was from water, which von Helmont added for five years. After extracting the tree and drying the soil, the difference from the original 200lb weight was 2oz yet the tree had increased in mass by 165lb (74Kg). From this observation, van Helmont concluded that wood was made from only one substance – water.

8
Virchow (1855 - the comprehensive Cell Theory). A thorough review of the
developments in plant anatomy from the time of Theophrastus of Eresus, the father
of botanical science, is presented elsewhere (Eames & MacDaniels, 1925).
1.3.2 Growth and development of the tree structure
The stem of the tree is tapered, which allows the broadest base of support for the
growing tree. The growth layer of the tree is termed the cambium and it is from the
cambial layer that all tree tissue grows, both inward and outward. The region which
is formed outward from the cambium is the phloem whereas the tissue formed
inward of the cambium is the xylem. Exterior to the phloem region is the epidermis.
A region of meristematic tissue – the periderm – replaces the epidermis. Regarded as
having three layers (phelloderm, phellogen and phellem) the periderm together with
the outermost layers of dead phloem form the tree bark while the xylem constitutes
the wood of the tree (Figure 1.1).
XylemPith
Phloem
Figure 1.1 Growth divisions in young wood (adapted from Porter & de Hoedt, 1987). The pith is at the centre of the tree and the xylem consists of alternating bands of earlywood and latewood. The cambial zone is the region where all growth takes place. Phloem cells grow outward of the cambium and three-layered periderm together with dead phloem cells form the bark.

9
As new phloem cells are produced from the cambium, older phloem cells are pushed
further outward. The further the phloem cells are pushed out, the less active they
become until they die and as corky, lignified cells, become part of the outer bark
(periderm). With the transport of physiological substances dependent on an intact
phloem, the function of bark becomes clear: protection of the phloem by preventing
water penetration, absorption of mechanical shock and damage and insulation against
high temperatures (Porter & de Hoedt, 1987).
The developing xylem produces thick, lignified cells that stretch the cambium layer.
In response, new cambium cells are produced and the circumference of the cambium
increases as the production of new xylem and phloem cells continues. At the centre
of the forming tree, is a region, largely composed of parenchyma cells, called the
pith. The pith is the vestigial remnant of the primary tree stem and may also contain
xylem and phloem cells.
1.3.3 Sapwood and heartwood
The phloem transports sugars, organic and inorganic nutrients and water throughout
the tree. Plant cells in the xylem live in a region of the xylem known as sapwood.
Dead xylem cells accumulate as the tree matures and sapwood is transformed into
heartwood. Consequently, the xylem of mature trees consists predominantly of dead
cells (heartwood) through which water moves. Water movement through the xylem
is dependent on cellular anatomy and this varies among species. The xylem cells
deep within the tree stem become increasingly filled with metabolic by-products such
as resins, gums, oils and tannins which create impediments to the flow of sap
(Hoadly, 1990). This region is of little value in the in the production of sawn timber
product.
10
In many tree species, heartwood and sapwood can be visually differentiated, as
heartwood, with extractives high in phenol and tannin, is darker. Parenchyma cells
(see Figure 1.5) also die and no longer contain food for the tree. The chance of attack
by insects and fungi may be reduced due to toxic extractive deposits. In conifers,
bordered pits also aspirate which prevents the movement of fluid into the dead cells.
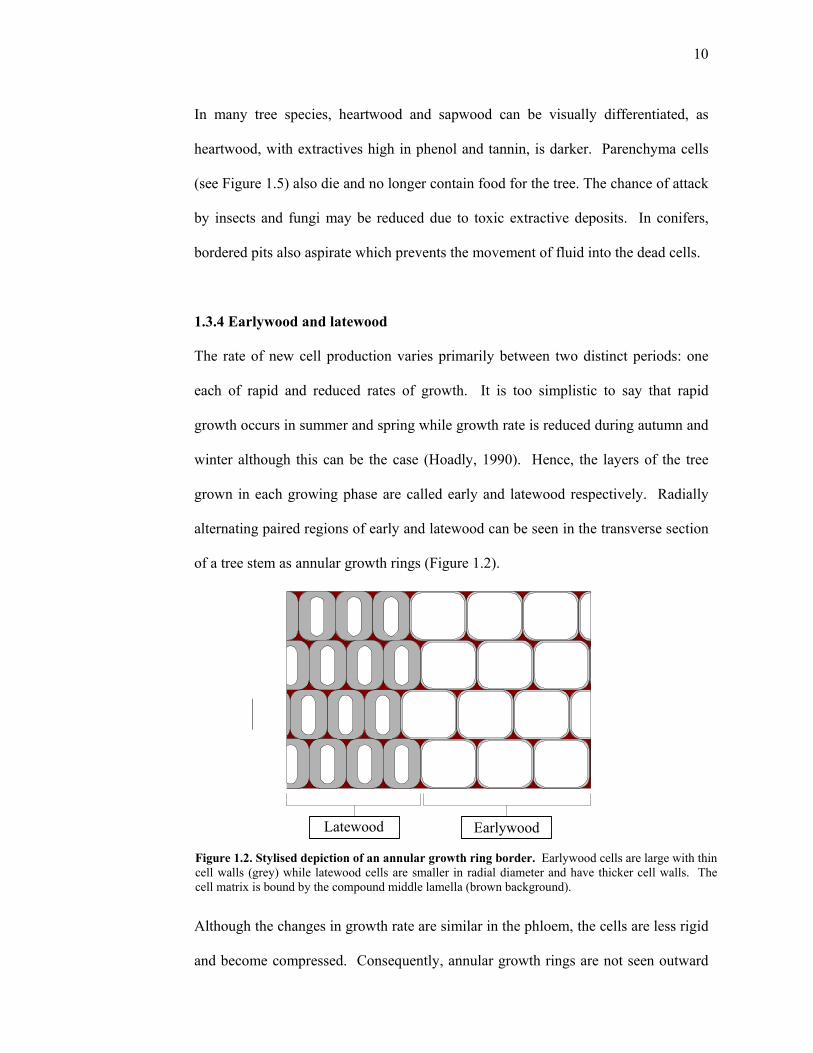
1.3.4 Earlywood and latewood
The rate of new cell production varies primarily between two distinct periods: one
each of rapid and reduced rates of growth. It is too simplistic to say that rapid
growth occurs in summer and spring while growth rate is reduced during autumn and
winter although this can be the case (Hoadly, 1990). Hence, the layers of the tree
grown in each growing phase are called early and latewood respectively. Radially
alternating paired regions of early and latewood can be seen in the transverse section
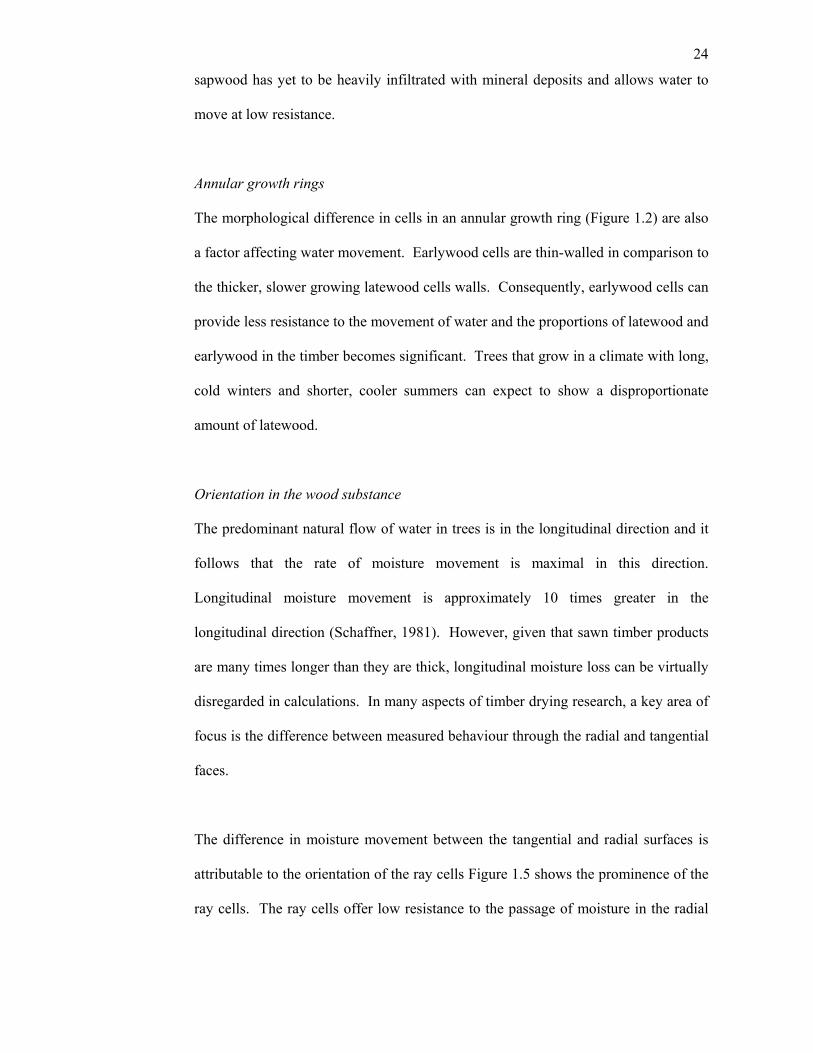
of a tree stem as annular growth rings (Figure 1.2).
Latewood Earlywood
Although the changes in growth rate are similar in the phloem, the cells are less rigid
and become compressed. Consequently, annular growth rings are not seen outward
Figure 1.2. Stylised depiction of an annular growth ring border. Earlywood cells are large with thin cell walls (grey) while latewood cells are smaller in radial diameter and have thicker cell walls. The cell matrix is bound by the compound middle lamella (brown background).

11
of the cambium (Northington & Goodin, 1984). The rings of earlywood are thicker
than those in latewood, but the total thickness of each type will depend on the species
of tree and the environmental conditions under which it was grown.
The cells in early and latewood differ considerably in composition and morphology.
Because of the slower growth rate in winter (or no growth if winter is severe), the
cells in latewood are smaller than those in early wood. In contrast, cells growing in
summer have a requisite for water storage and have larger cytoplasmic volume and
thinner cell walls. The difference in cell wall thickness is a significant factor in
differential shrinkage during drying as the thicker cell walls in latewood undergo
greater degrees of shrinkage than the thinner walls in earlywood.
1.3.5 Composition of a typical wood fibre
A feature that distinguishes plant cells from animal cells is the presence of a cell wall
surrounding the cytoplasm. The cell wall is non-living and is composed of secretion
products from the cell’s cytoplasm. The components of these secretions will be
discussed below (and shown in Figure 1.3), and it may appropriate to describe the
cell wall as a ‘wooden box that contains the plant cytoplasm’ (Porter & de Hoedt,
1987) as the cell wall components provide the structural rigidity throughout the wood
substance.
A Cell divides to form two cells, the two newly formed cells being bound together
through a layer called the middle lamella. Initially, the middle lamella consists of
pectin but is later infiltrated with lignin. At this stage, the cell wall of each cell
begins to develop in a two-stage process. The primary cell wall, predominantly
consisting of cellulose and hemicelluloses, is laid down next to the middle lamella.
12
In the second stage, the cell wall thickens inwards towards the cytoplasm and this
also consists mainly of cellulose. As cells become the skeleton of the wood
substance, the cell wall is infiltrated with hemicelluloses and lignin. The rigidity
provided by lignin allows the cell to maintain its shape after the cell dies.
The amounts of cellulose, hemicellulose and lignin in the cell wall (determined
genetically) are a significant determinant of the cell’s function; leaves, stems,
branches, roots and reproductive organs have different cellular structure to achieve
their function. The focus of this paper will be on secondary xylem of the hardwood
tree stem as it is the stem from which sawn boards are cut.
The terms ‘wood cell’ and ‘wood fibre’ can be used interchangeably and refer to the
libriform cells of hardwoods and the tracheids of softwoods. Vessel elements in
hardwoods and parenchyma cells in softwoods and hardwoods are not considered
fibres (Fardin, 2002). In hardwoods, fibres are long and narrow with pointed ends,
thick walls and a small cavity allowing little opportunity for water transport (Porter
& de Hoedt, 1987). Tracheids, in gymnosperms, serve both as conductive and
support cells. In the angiosperms (hardwoods), vessels and fibres are formed in
addition to tracheids. Although tracheids (softwoods) and vessels (hardwoods)
function as conduits for water, they are hardened with lignin to provide structural
support.
As trees grow, the secondary walls (described below) thicken and the size of the cell
lumen decreases. From this description, an increase in whole trunk strength as the
timber matures becomes apparent – younger trees do not have the strength of older
13
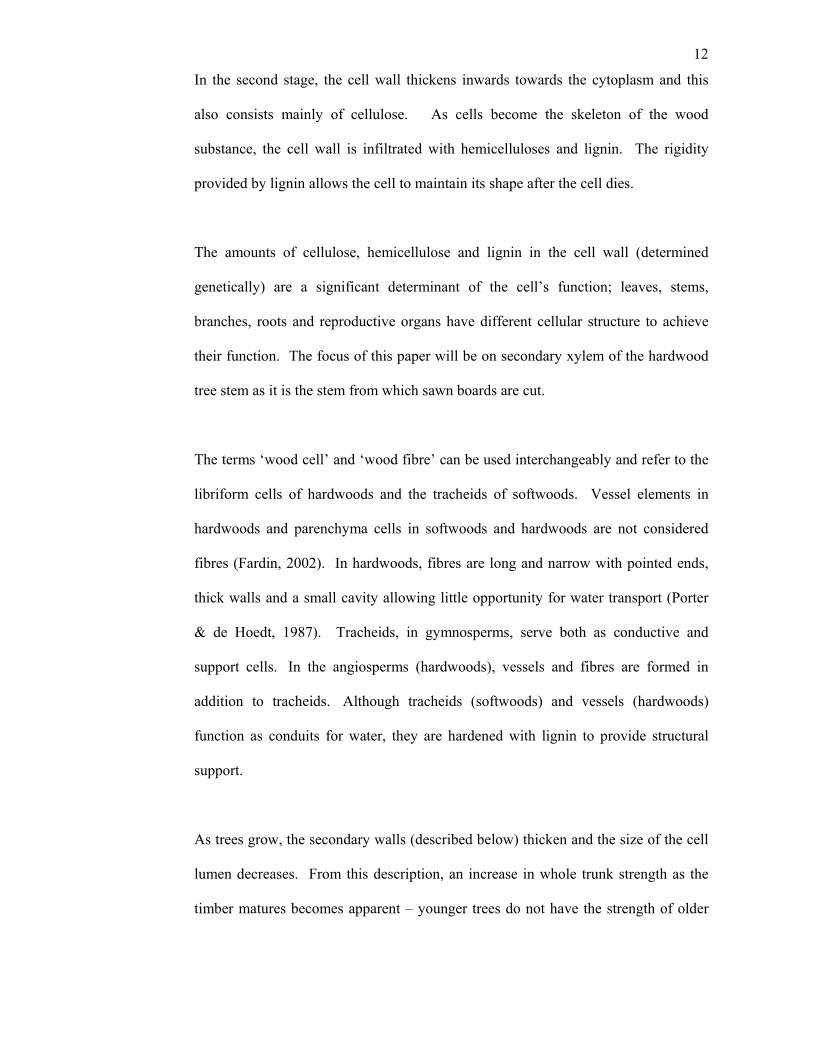
trees because they have thinner cell walls. The description of tree cell structure
begins with the basic building block of the wood structure: the cellulose microfibril.
LumenCompound Middle lamellaPrimary wall
Secondary wallS1 layerS2 layerS3 layer
LIGNINCELLULOSE
HEMICELLULOSE
Middle lamellaLumen
S2
S3
Microfibrils typically have a diameter of 35Å and contain about 40 cellulose chains.
Clusters of microfibrils aggregate to form ordered sheets of cellulose fibres called
lamellae (Timell, 1964). The microfibrils wind around the cell axis in a helical
fashion in a dextral (Z helix) or sinistral (S helix) direction (Eaton & Hale, 1993).
Although providing the greatest strength in the longitudinal orientation, microfibrils
are offset at an angle to the cell axis with this angle called the microfibril or micellar
angle. The variation in microfibril angle is considered one of the most significant
determinants of mechanical properties in wood (Fardin, 2002). Angle variation not
Figure 1.3. Cross section of a wood cell wall showing cell wall layers and composition of the three solid wood components (Porter & de Hoedt, 1987). The cell wall divisions are described below.
14
only occurs between species, but within a single tree with the micellar angle
lessening with distance from the pith (Porter & de Hoedt, 1987).
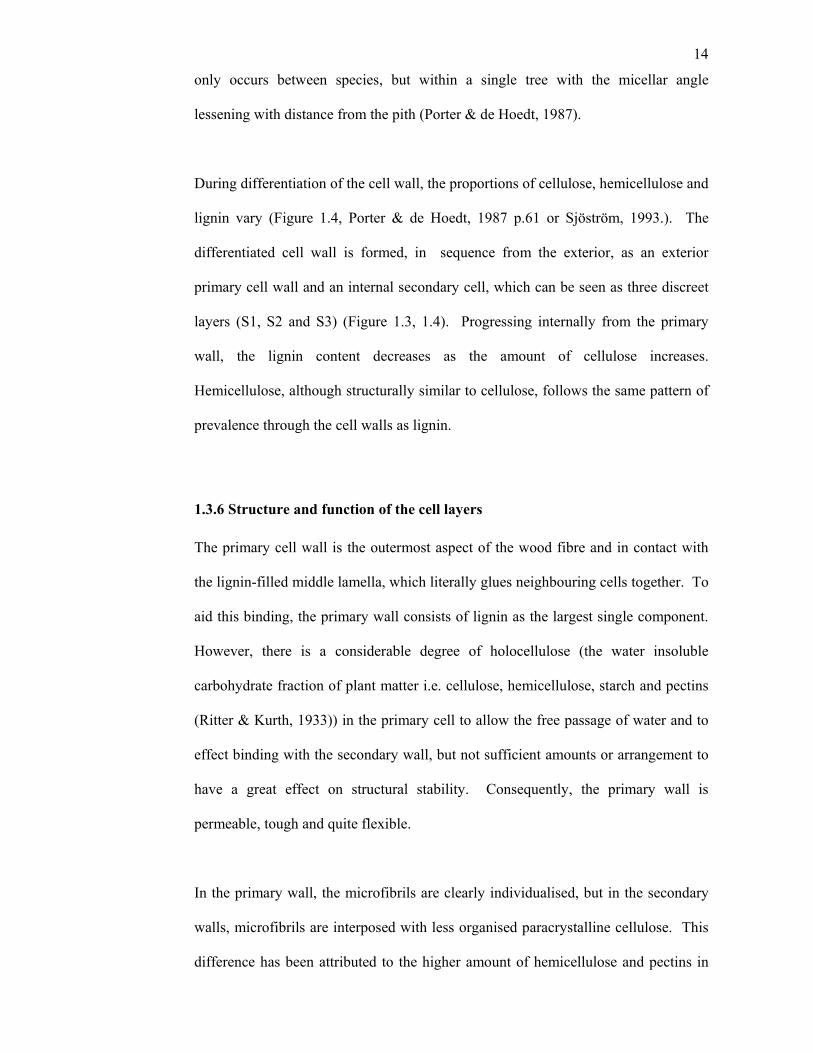
During differentiation of the cell wall, the proportions of cellulose, hemicellulose and
lignin vary (Figure 1.4, Porter & de Hoedt, 1987 p.61 or Sjöström, 1993.). The
differentiated cell wall is formed, in sequence from the exterior, as an exterior
primary cell wall and an internal secondary cell, which can be seen as three discreet
layers (S1, S2 and S3) (Figure 1.3, 1.4). Progressing internally from the primary
wall, the lignin content decreases as the amount of cellulose increases.
Hemicellulose, although structurally similar to cellulose, follows the same pattern of
prevalence through the cell walls as lignin.
1.3.6 Structure and function of the cell layers
The primary cell wall is the outermost aspect of the wood fibre and in contact with
the lignin-filled middle lamella, which literally glues neighbouring cells together. To
aid this binding, the primary wall consists of lignin as the largest single component.
However, there is a considerable degree of holocellulose (the water insoluble
carbohydrate fraction of plant matter i.e. cellulose, hemicellulose, starch and pectins
(Ritter & Kurth, 1933)) in the primary cell to allow the free passage of water and to
effect binding with the secondary wall, but not sufficient amounts or arrangement to
have a great effect on structural stability. Consequently, the primary wall is
permeable, tough and quite flexible.
In the primary wall, the microfibrils are clearly individualised, but in the secondary
walls, microfibrils are interposed with less organised paracrystalline cellulose. This
difference has been attributed to the higher amount of hemicellulose and pectins in
15
the primary wall which obstruct the association between crystalline and
paracrystalline cellulose (Sherman, 1954).
Secondary wall middle layer S2
Secondary wall outer layer S1
Secondary wall inner layer S3
Middle lamella
Primary wall
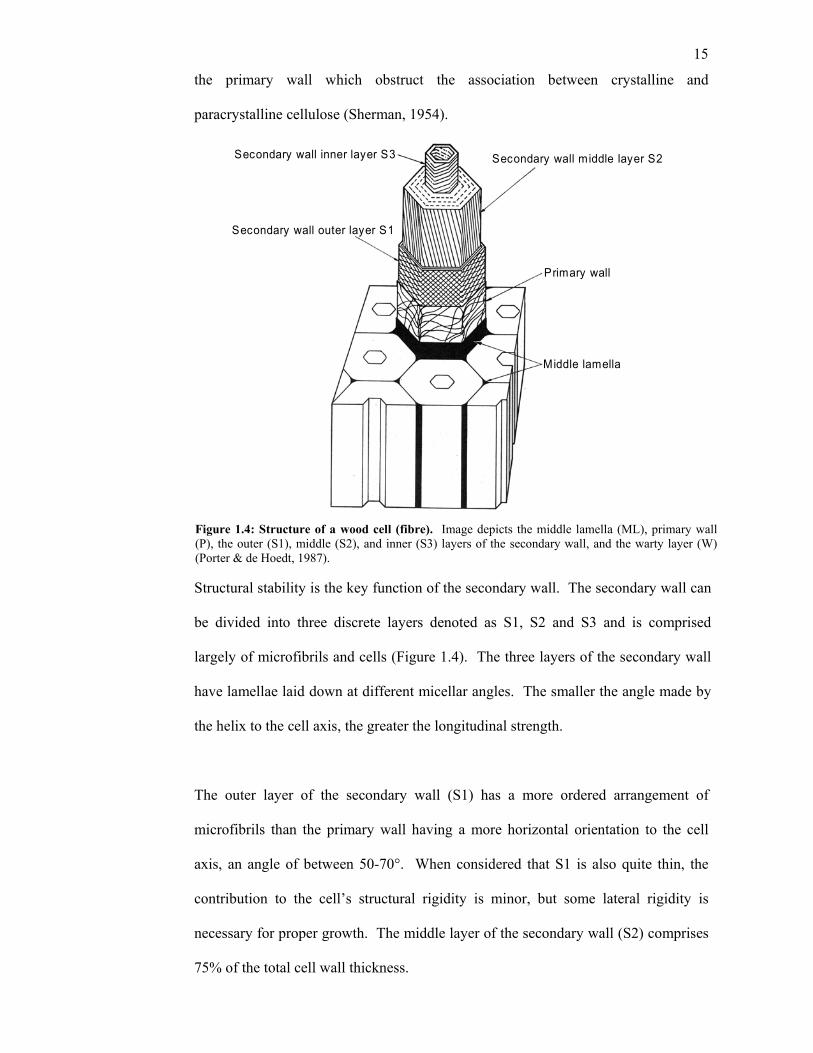
Structural stability is the key function of the secondary wall. The secondary wall can
be divided into three discrete layers denoted as S1, S2 and S3 and is comprised
largely of microfibrils and cells (Figure 1.4). The three layers of the secondary wall
have lamellae laid down at different micellar angles. The smaller the angle made by
the helix to the cell axis, the greater the longitudinal strength.
The outer layer of the secondary wall (S1) has a more ordered arrangement of
microfibrils than the primary wall having a more horizontal orientation to the cell
axis, an angle of between 50-70°. When considered that S1 is also quite thin, the
contribution to the cell’s structural rigidity is minor, but some lateral rigidity is
necessary for proper growth. The middle layer of the secondary wall (S2) comprises
75% of the total cell wall thickness.
Figure 1.4: Structure of a wood cell (fibre). Image depicts the middle lamella (ML), primary wall (P), the outer (S1), middle (S2), and inner (S3) layers of the secondary wall, and the warty layer (W) (Porter & de Hoedt, 1987).
16
The micellar angle in the S2 layer (10-30°) is significantly less than the other
secondary layers and the glucose chains are twisted. The vast quantity and
arrangement of the lamellae in the S2 layer underscore its function as the primary
means of strength in the wood cell and therefore wood in general. The S3 layer is
the most internal and has the greatest micellar angle of departure of 60-90° to the
vertical.
1.3.7 Wood macrostructure
Most wood cells are arranged vertically, thus dictating the direction in which the
wood is most likely to split. This direction is called the grain (Porter & de Hoedt,
1987; Hoadly, 1990). When the grain runs parallel with the tree stem, it is called
straight grain but owing to many environmental (climate, topographical) and genetic
factors, the grain may cross the parallel line of the tree stem and form spiral grain.
As previously described, the structural rigidity in hardwoods is provided by
longitudinally orientated fibres that consist of macroclusters of ordered cellulose
chains interposed with semicrystalline cellulose, hemicellulose and lignin. The
macrostructure is shown in Figure 1.5.
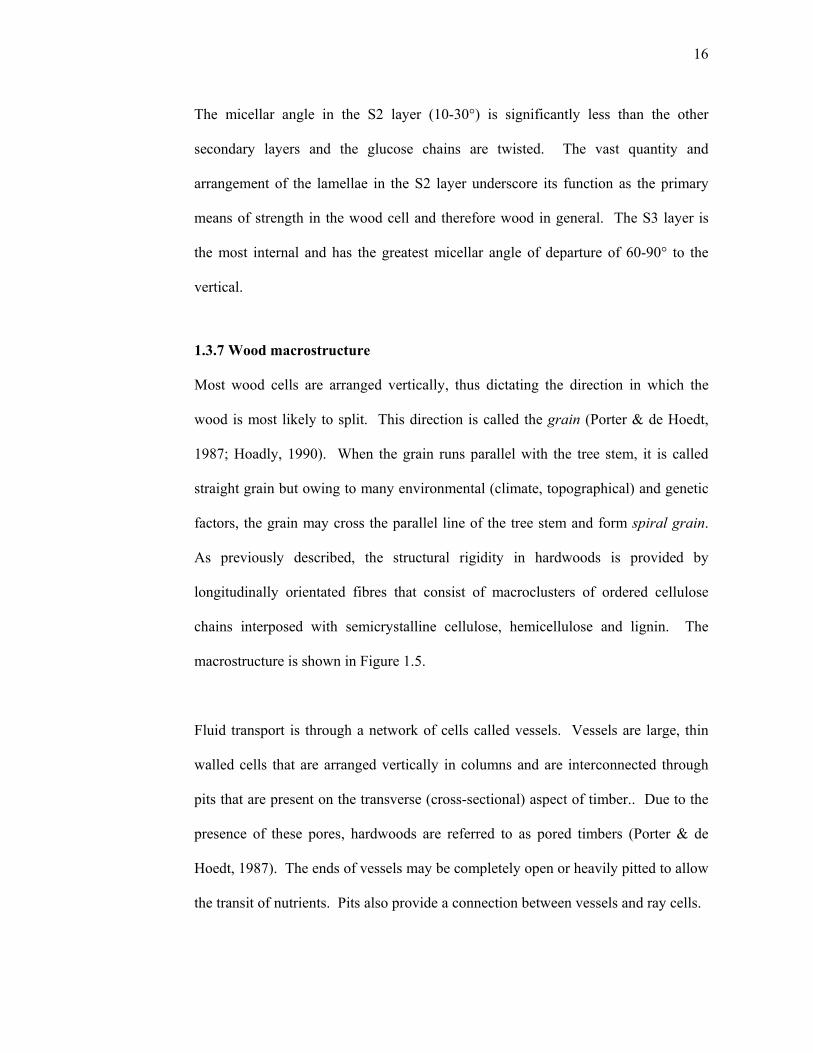
Fluid transport is through a network of cells called vessels. Vessels are large, thin
walled cells that are arranged vertically in columns and are interconnected through
pits that are present on the transverse (cross-sectional) aspect of timber.. Due to the
presence of these pores, hardwoods are referred to as pored timbers (Porter & de
Hoedt, 1987). The ends of vessels may be completely open or heavily pitted to allow
the transit of nutrients. Pits also provide a connection between vessels and ray cells.

17
Radial surface
Med
ulla
ry ra
y
ATransverse
surface
Vessels
(pores)
Tangential surface
Transverse
surface
Med
ulla
ry ra
y
Radial surface
Tangential surface
Tracheids
B
Ray cells are perpendicular to the grain and ribbons of cells, called medullary rays,
can be seen projecting radially from the pith to the cambium on the transverse aspect.
The cells are stacked longitudinally on the narrow edge of the cell wall and transport
foodstuffs in the xylem to be stored until required by the growing cambium layer.
Figure 1.5. Microscopic appearance of hardwood and softwood. Hardwood (A) and softwood cells (B) are intersposed with radially projected ray cells although they are vastly more numerous in hardwood. Hardwoods also have large, axially directed, thin-walled vessels or pores (adapted from Porter & de Hoedt, 1987).

18
Unlike fibres, ray cells do not have a structural function and are thin-walled.
However the formation of splits in the timber is related to the position of ray cells
which does result in reduced strength
Axial or longitudinal parenchyma cells are arranged parallel with fibres and vessels,
function as storage vessels, and include living material (Hoadly, 1990). The cells are
short, block-shaped and contribute little to structural support. Parenchyma cells may
be subclassified in hardwoods as wood parenchyma, ray parenchyma and
parenchyma associated with canals or ducts (Porter & de Hoedt, 1987). Wood
parenchyma can account for up to 20% of the wood volume and may also be further
classed by whether they are associated with vessels (paratracheal) or not
(apotracheal). These distinctions can be of great value in determining the identity of
a wood sample.
Ray parenchyma contribute 18% of the wood volume in hardwoods (compared to 6%
in softwoods). These cells run perpendicularly and radially to the tree axis. There
may be single (uniseriate) or, more commonly in hardwoods, many (multiseriate) ray
cells in the ray parenchyma. Parenchyma cells associated with ducts or canals assist
in the distribution of gummy and resinous material. When associated in such a
fashion, the parenchyma cells have a secretory function and are called epithelial
cells. These cells become more active, or are formed anew in the event of physical
injury to the tree.
This section has reviewed the relevant anatomical structures that comprise wood
substance. With the overview of wood anatomy complete, practical and theoretical

19
aspects of timber drying will be considered with an introduction to the role of water
in wood substance.
1.4 Wood-water considerations
1.4.1 Water and cellulose
The ability for material to absorb water from moist air to form a moist solid or a
solution is termed hygroscopicity (Sharp, 1990). The pioneering work on water-
cellulose relationships was conducted by Cross & Bevan (1918) who initially
proposed that water retained by cellulose formed a continuous series of hydrates.
Although this was later proven to be erroneous (Sheppard & Newsome, 1934), their
work had uncovered the fundamental issue that hydroxyl groups on the cellulose
fibre attracted water and that the continuous presence of that interaction lead to
varied forms of the cellulose structure. Despite the multitude of structural forms,
water was shown by x-ray studies to be between cellulose units rather than within
them (Stamm, 1934). Hence, changes to the wood fibre-water relationship can have
a significant impact on the structural characteristics of the wood fibre. This can be
viewed in terms of changes to either water vapour (in the form of atmospheric
humidity) or liquid water (water content around the cellulose fibre) (Sheppard &
Newsome, 1934).
The interaction of water and cellulose (Figure 1.6) results in higher measured bond
energies. Babbitt (1942) explained the additional bond energy by allowing for two
hydrogen bonds, connected with the oxygen atoms in water molecules, and with two
oxygen atoms in the hydroxyl groups in cellulose. Through x-ray and density
studies, Hermans (1949) provided compelling evidence for water-cellulose bonding
with the observation that the space available for water to bind to cellulose matches

20
the irregular contours along the cellulose molecule and the fact that there are six
hydroxyl groups and four ether oxygens (i.e. two ring and two bridge oxygens) per
cellobiose unit. In addition, it was shown that the formation of water around
cellulose in amorphous and more ordered regions was the same.
O
H H
OH
OH
A
OH
O
H H
O
OH
OH
H H
OH
OH
O
H
H
OH
B
Figure 1.6. Interaction of water (black) with cellulose hydroxide groups (green) in the plant cell wall (heavy dashed line). Hydrogen bonding (red) may occur at primary sites [A] and secondary sites [B] (after Enderby, 1955).
Enderby (1955) proposed that binding between water and cellulose can occur at
primary (where the sorption of one water molecule saturates the sorption site) and
secondary sites (which allow for the binding of more than one molecule). King
(1960) derived an equation based on Enderby’s (1955) work to allow for these two
forms of sorption, which are called the Enderby-King sorption equations.
Stamm (1964a) measured the change in heat that accompanied the interaction
(sorption) of water and noted that the value of the differential heat sorption for
several cellulose-like materials (including wood) were within a narrow range which
was comparable to that of hydrogen bonding. Rees & Skerrett (1968) indicated that
the hydrogen atoms at C1, C3 and C5 of D-glucose residues in cellulose and perhaps
those at the surfaces of C2, C4 and also O5 can interact with water and consequently,

21
cellodextrins can form rigid conformations in aqueous solution. Although cellulose
has no charge, its partial polarity allows binding to water through any number of
hydroxyl groups and the ring oxygen (Lehninger et al., 1990). Ihnat & Goring
(1967a-b) concluded that the linear rigidity in the cellulose chain is improved in the
presence of water. It could be that when water is removed from the cell structure,
there is a tendency for the cellulose chain to lose its rigidity and fold due to a
‘deswelling’ of the polymer chain (Ihnat & Goring (1967b).
Stamm (1959a) reviewed research on the diffusion of water in wood and summarised
it as being a complex combination of flowing liquid diffusing through the coarse
capillary structure and bound water diffusing through the wood substance. McMillin
(1963) indicates that water may only move between cellulose fibrils in the
amorphous regions of the cell wall. When water is absorbed into the wood cell wall
(Figure 1.7), hydrostatic pressure is applied to the cell structure that can cause
deformation of the intermolecular bonds.
Figure 1.7. Effects of water interaction with the wood structure. Initially, a monomolecular layer of water in submicroscopic capillaries is strong in attractive forces to cause a negative swelling in the wood fibres from its original position (green, dashed lines) to a new and closer position (green, solid lines). As more water molecules are absorbed, hydrostatic pressure is exerted by water against the wood fibres (blue arrows) and returns fibres to the original position. The wood fibres resist swelling through inter- and intra- molecular bond strength (red arrows) (Venkateswaran, 1970).
22
This is partially successful and is called turgor or swelling and can be considered to
occur in the cellulose fibres and then transmitted to an increase in external timber
dimensions (Tarkow, 1959). Swelling is limited as the bonds, through repulsive van
der Waals’ forces, are able to resist the force applied by water. Another controlling
mechanism is the equilibrium that is established due to the relative vapour pressure
of the air.
When swelling pressure is equal to the relative vapour pressure, then no swelling in
the wood will occur. However, at pressures greater than relative vapour pressure, the
swelling pressure begins to apply sufficient hydrostatic pressure to cause movement
in the timber structure. Under the same conditions, a smaller molecular weight
molecule will give rise to higher pressures than a larger molecular weight molecule.
In void free gels, very high swelling pressure has been measured but pressures in
timber are limited to the compressive strength perpendicular to the grain (Stamm,
1964a).
A relevant observation is that equilibrium now exists between the hydrostatic
pressure and the opposing pressure applied by the chemical bonds in cellulose. The
amount of hydrostatic pressure is a function of the amount of water present in the
submicroscopic capillaries and hence there is a direct relationship between the
amount of swelling in the cell wall and the amount of water present. It follows that a
loss of water will cause shrinkage in the cell wall. Ultimately, it is this shrinkage
that causes the generation of drying stresses in timber.

23
1.4.2 Moisture loss in drying timber
During normal biological function, water moves from the tree roots via the sapwood
to deliver mineral salts to the leaves and returns from the leaves to supply the
cambium and other living cells with sugars and starches. The factors which affect
water in wood, and the mechanisms by which water moves, is of critical significance
to successfully drying sawn timber products. These factors are described below.
Tree Age
Cell wall lamellae are laid down progressively and cell wall thickness is cumulative.
In many species, younger trees will, on the whole, have thinner cell walls and offer
less opposition to water movement. In plantations, trees are bred for rapid growth
and the cell structure of these trees is coarse with a large cell lumen to cell fibre ratio
(Schaffner, 1981) and this overall decrease in density is concomitant with decreased
opposition to water movement.
Location in the wood substance
Water moves throughout the entire cellular matrix of a tree but, owing to structural
differences, the rate of water movement is dependent on its location in the matrix and
also the geometric aspect along which it is moving. Generally, ease of water
movement increases with distance from the pith. However, an exception to this
arises when compressive failure in the pith which can be associated with growth
stress. When producing sawn hardwood timber products, where possible, the pith is
avoided. The heartwood is the dead part of the xylem and although the vessel
structures are in place to allow moisture movement, they can be obstructed by the
deposition of insoluble extractives and the aspiration of cell contents into
neighbouring cells. Water flow still occurs, but does meet some resistance. The
24
sapwood has yet to be heavily infiltrated with mineral deposits and allows water to
move at low resistance.
Annular growth rings
The morphological difference in cells in an annular growth ring (Figure 1.2) are also
a factor affecting water movement. Earlywood cells are thin-walled in comparison to
the thicker, slower growing latewood cells walls. Consequently, earlywood cells can
provide less resistance to the movement of water and the proportions of latewood and
earlywood in the timber becomes significant. Trees that grow in a climate with long,
cold winters and shorter, cooler summers can expect to show a disproportionate
amount of latewood.
Orientation in the wood substance
The predominant natural flow of water in trees is in the longitudinal direction and it
follows that the rate of moisture movement is maximal in this direction.
Longitudinal moisture movement is approximately 10 times greater in the
longitudinal direction (Schaffner, 1981). However, given that sawn timber products
are many times longer than they are thick, longitudinal moisture loss can be virtually
disregarded in calculations. In many aspects of timber drying research, a key area of
focus is the difference between measured behaviour through the radial and tangential
faces.
The difference in moisture movement between the tangential and radial surfaces is
attributable to the orientation of the ray cells Figure 1.5 shows the prominence of the
ray cells. The ray cells offer low resistance to the passage of moisture in the radial
25
direction. However, there are no water carrying vessels of significance on the
tangential aspect and bulk water movement in that direction is minimal.
Water will move in a direction and a manner that is energetically favourable. For
illustration, water loss may be seen as progressing through a series of stages.
However, these stages do not occur in isolation. As each stage is reached, there is an
increase in the amount of energy required to cause the moisture loss. In drying sawn
wood, water will leave the exterior surfaces of the board first before the core dries.
Furthermore, larger capillaries in the wood structure will be evacuated before
moisture in the finer capillaries begins to move. Water contained in the cell spaces
moves through the semi-permeable cell wall and into the vessels. Finally, water that
is chemically bound to the cell structure or as crystalline hydrates will be removed.
The various mechanisms, which have been investigated to explain the movement of
water in wood, are described below.
In wood, water exists in three states: free liquid, free vapour and chemically bound.
These states not only have differing physical and chemical properties, but their
proportions and the nature of the interaction between water and cellulose alters with
changes in wood moisture content (Babbitt, 1977). Schaffner (1981) lists a number
of possible mechanisms, which can effect water movement including capillary flow
of liquid water, viscous flow of water vapour, thermal diffusion, gaseous diffusion
and the mechanical movement of moisture owing to shrinkage in wood.
Although there is no single, all encompassing model to describe the movement of
water in wood, the underlying principle for all theories is the same: moisture in wood
moves from a region of high concentration to a region of low concentration until
26
such time as the moisture content of the wood is in equilibrium with its environment
(Walker, et al., 1993). The point at which there is no net loss of moisture between
wood and the environment is regarded as the equilibrium moisture content (EMC).
Measuring EMC and monitoring the moisture content of wood during drying is
explained below.
1.4.3 Measurement of wood moisture content
In Australia, the accepted method for accurate moisture content (MC) determination
is the oven dry method. The mass of the timber sample is determined and then the
sample is dried in an oven at 103°C ± 2°C until there is no further change in the
mass. The sample is then reweighed and the MC is determined with the following
calculation:
%MC = X 100Sample Mass - Oven Dry Mass
Oven Dry Mass
MC is expressed as the mass lost (essentially the mass of water) due to oven drying
as a percentage of the dry fibre weight (Waterson, 1997). That is to say, when half
of the sample mass is water, the MC will be 100%. It is possible to have MC values
over 100% and in the case of some species of pine, the green MC is 200%.
To monitor changes in MC during drying, sample boards are weighed at Time
(Hours) = 0 and any future masses are compared with the green mass. The sample is
not oven dried and the difference in mass is taken between the initial MC (IMC) of
the sample at the beginning of drying and the mass of the sample board at the
sampling time. IMC is determined by either oven drying a replicate sample board at
Time (Hours) = 0 and conferring the IMC to the sample board to be used repeatedly

27
and/or oven dry the original sample board when drying is over using the oven dry
method described above.
Although this is the gold standard for obtaining accurate MC results, the method
takes some time and ultimately, the results obtained only indicate what MC the
timber ‘used to have’. Methods for immediate results include moisture metre probes,
which calculate moisture content based on the amount of electrical resistance
encountered in the timber, or a psychrometric chart which can estimate an EMC
under a known set of environmental conditions. Similarly, Australia is a country of
very diverse environmental conditions and timber must be dried with the average
EMC of the timber’s final destination in mind. Outdoor timber in Brisbane,
Queensland typically has an EMC in a range of 12-17% while the EMC for outdoor
timber in Kalgoorlie, Western Australia is below 10% (Waterson, 1997).
Central to the problems that face timber seasoners is that as water content in wood
varies, the dimensions of the sawn wood changes. In any event, properly seasoned
hardwood eucalypt timber that has experienced no loss of dimension from its original
green state is not currently possible. Furthermore, Rozsa (2000) showed that through
the trial of various methods of pre-treatment of Eucalypts, 10-15% of the samples
developed some form of drying degrade regardless of intervention. Therefore,
efforts can be focused on minimising loss of dimension and the prevention of drying
defects that arise from excessive drying stresses. The build up of drying stresses
arises fundamentally from moisture loss and resultant shrinkage in the timber.

28
1.5 Shrinkage in wood
Although the water/shrinkage relationship may be intuitive, it has also been
demonstrated experimentally. Loss of water causes timber to shrink in a manner
such that the volumetric shrinkage is “practically equal” to the volume of water lost
below fibre-saturation point (Stamm, 1935, p.401). Reinfusion of water into the dried
timber causes timber with water caused the timber to expand to its re-dried
dimension.
How wood actually shrinks is still debated, but there are two basic schools of
thought. Firstly, when water is removed from the wood fibres, hydrogen bonds are
formed between hydroxide groups of neighbouring molecules of cellulose,
hemicellulose and lignin. The attractive forces between the respective hydroxide
groups are sufficient to draw the molecules together to ‘bridge the gap’ and form
hydrogen bonds of energetically favoured lengths. Despite the forming of these new
bonds, energetics (the transformation of energy within a system) favours the
subsequent reconstitution of water into the wood substance upon rewetting.
The other postulate is that when water evacuates the cell structure, there is a
deformation in the cell wall (similar to removing the bracing from a mineshaft),
although not to the point where the timber is deformed. It may be possible that both
of these systems are in effect and that some degree of deformation must occur before
the neighbouring molecules are close enough to form hydrogen bonds. Shrinkage
per se does not cause irreversible damage to timber during seasoning (although
cellular collapse, which is a result of shrinkage, does). Moreover, it is the rate and
differing amounts of shrinkage along with differential shrinkage along the varying

29
orientations (radial, longitudinal and tangential) in the timber that are most critical.
This differential shrinkage along different geometric planes is a property described as
anisotropy.
1.5.1 Anisotropy
The relevance of this to seasoning timber is that the amount of shrinkage by
percentage in each dimension is different. This is due to the location of water and
the orientation of fibres in the wood structure (in particular, in the S layers with
lamellae laid down at different fibre angles (see Figure 1.4)). As wood dries below
FSP, the long cellulose chains are drawn together, but because the crystalline
cellulose lattice remains relatively unchanged and the hydrophobic lignin (see
Defence 1) is in itself unaffected by the moisture content, there is negligible
shrinkage along the length of the fibres. Consequently, longitudinal shrinkage is
negligible. There is however, a measurable amount of shrinkage in the radial and
tangential directions and significant difference in shrinkage between the town
orientations. Figure 1.8 shows the three geometric faces of timber from a wedge cut
from the pith.
The maximum amount of shrinkage occurs across the transverse face (Figure 1.8) as
this is, in effect, the total combination of tangential and radial shrinkage (Stamm,
1959b). However, transverse shrinkage is only a significant factor when cross-
sections of a log have been cut. The circumference shrinks more than the diameter
causing the opening up a v-shaped split that can run all the way to the pith. Samples
cut in this manner are most susceptible to drying stress, but are of minor commercial
significance in boards. In total, the combination of tangential and radial shrinkage is
approximately equal to the total volumetric shrinkage in the wood.

30
The milling of longitudinally directed square and rectangular lumber is virtually the
sole focus of the hardwood and softwood sawmilling industries worldwide. As such,
the focus of this study will be on this form of sawn wood product and it is therefore
the shrinkage along the tangential and radial orientations that will be of particular
note.
Cross or transverse facePith
Tangential facesRadial faces
The general shrinkage patterns in the tangential, radial and longitudinal aspects of
timber are represented in Figure 1.9. In most species of wood, shrinkage along the
longitudinal aspect is negligible while the tangential shrinkage can be up to twice
that of the radial (Englerth & Mitchell, 1967).
Figure 1.8. Orientations in timber. The pith is at the centre of the tree with the radial surface directed towards the bark and parallel with the axial plane. In this figure, the transverse plane projects towards the exterior of the tree and is perpendicular to the axis. The tangential face is parallel with the axis but perpendicular to the radial surface (Porter & de Hoedt, 1987).

31
0 10 20 300
2
4
6
8
Tangential
Radial
Longitudinal
Moisture content %
Shri
nkag
e (%
of g
reen
siz
e)
Stamm (1934) stated that the ray cells (Figure 1.5) have their longitudinal aspect in
the radial direction and thus restrain dimensional changes in that direction. Greenhill
(1940) concurred and maintained that this was also the case for Australian hardwood
timbers.
Greenhill (1940) also provided values for radial and tangential shrinkage for E.
delegatensis (T 8.4%; R 5.3%), E. obliqua (T 13.8; R 5.8%), E. regnans (T 14.2%; R
7.2%) but also indicated that the amount of shrinkage in either orientation was not a
function of the species density (kg/m3). This was also supported by Chafe (1986)
who found that the strong, positive correlation exists between the ratio of volumetric
shrinkage and specific gravity was not observed in Eucaylptus sp. as it was in other
species. However, Chafe & Ilic (1990)found there was a strong positive correlation
for volumetric shrinkage:specific gravity in the case of Tasmanian E. regnans and
Figure 1.9. Typical shrinkage curves for the three dimensional aspects of timber geometry (Porter & de Hoedt, 1987).

32
that the observed increase in cell collapse below fibre saturation point due to greater
external shrinkage as a result of drying stress.
1.5.2 Anisotropic considerations for drying sawn timber
The review has thus far described the chemical micro and macrostructural anatomy
of wood. The species eucalyptus has been given focus. Shrinkage has been
discussed in detail and the notion of anisotropy has been described. It has been
shown previously that shrinkage occurs maximally in the tangential aspect and it
follows that timber with the largest tangential face will experience the greatest
amount of shrinkage. The next section explains why all of this information is
important to drying sawn timber.
Timber boards with a predominant tangential face are called backsawn, flatsawn or
plainsawn boards. Timber with a predominant radial face is called quartersawn.
Figure 1.10 shows the manner in which a log would be cut to obtain backsawn and
quartersawn boards.
There are two aspects of note: firstly, the difference in grain appearance on the
predominant face is markedly different between backsawn and quartersawn boards.
Quartersawn boards have a straight grain while backsawn boards have a looped
grain. Secondly, even though each type of cut produces a predominant face (either
radial or tangential), the side of the board is from the other face. Even though there
are relatively lesser amounts of this direction on the side, the physical rules that
govern shrinkage, and water loss, still apply.

33
2A
3A
1
2B
3B
Figure 1.10. Sawlog cutting pattern for obtaining quartersawn and backsawn timber. The cross-sectional aspect of a saw log (blue) shows the annular growth rings and the orientation for backsawn and quartersawn boards [1]. A cross-section of a quartersawn board is shown [2A] with the prominent radial surface coloured grey [2B]. A cross-section of a backsawn board is shown [3A] with the prominent tangential coloured green [3B].
Given that the tangential aspect has a greater degree of shrinkage, the amount of
manifestation of that shrinkage, and the distortion of the original sawn board product
will be different in each case. This is highlighted in Figure 1.11.
Figure 1.11. Shrinkage patterns caused by differential tangential and radial shrinkage from moisture loss. Quartersawn boards (red ring) maintain their sawn shape much better than backsawn boards (blue ring) (Stamm & Hansen, 1937).
34
Even though shrinkage does occur in quartersawn material, the seasoned product
maintains its original dimension to a greater degree than backsawn timber because
the ratio of radial surface to tangential surface in a quartersawn board favours the
radial direction, which compensates for the higher shrinkage in the tangential
direction. The distortion, clearly visible in some backsawn boards (cupping), is due
to differential tangential shrinkage between the two opposing tangential faces of the
board. Due to the circumference shrinking more than the diameter, cupping occurs
along the growth rings and away from the pith and, as backsawn boards are milled
with a greater tangential surface than radial surface, the cupping is more pronounced
than in quartersawn material. The amount of cupping has a direct impact on the
grading of timber and this in turn dictates the selling price. The Australian Standard
for visually grading timber for structural purposes (AS 2082–2000, 2000; p.45) states
that cupping is to be measured on the “…concave surface as the maximum
perpendicular distance of any point on the surface from a straight line joining the
arrises of that surface.”
Cupping is such a serious defect that although timber can be classed into one of four
grades, the tolerance for cupping is the same from Grade 1 (best grading) to Grade 4
(worst grading): not exceeding 1mm of cupping per 50mm of width. On this
evidence alone, it is not surprising to find that timber cut for structural purposes in
southeastern Australia is overwhelmingly of the quartersawn orientation. However,
there are advantages for cutting a predominance of backsawn timber.
Figure 1.12 shows standard log cutting patterns for obtaining maximum backsawn
timber (a) and quartersawn timber (b). To cut quartersawn timber requires greater
manipulation of the flitch. Hence quartersawn timber takes longer to cut and, owing
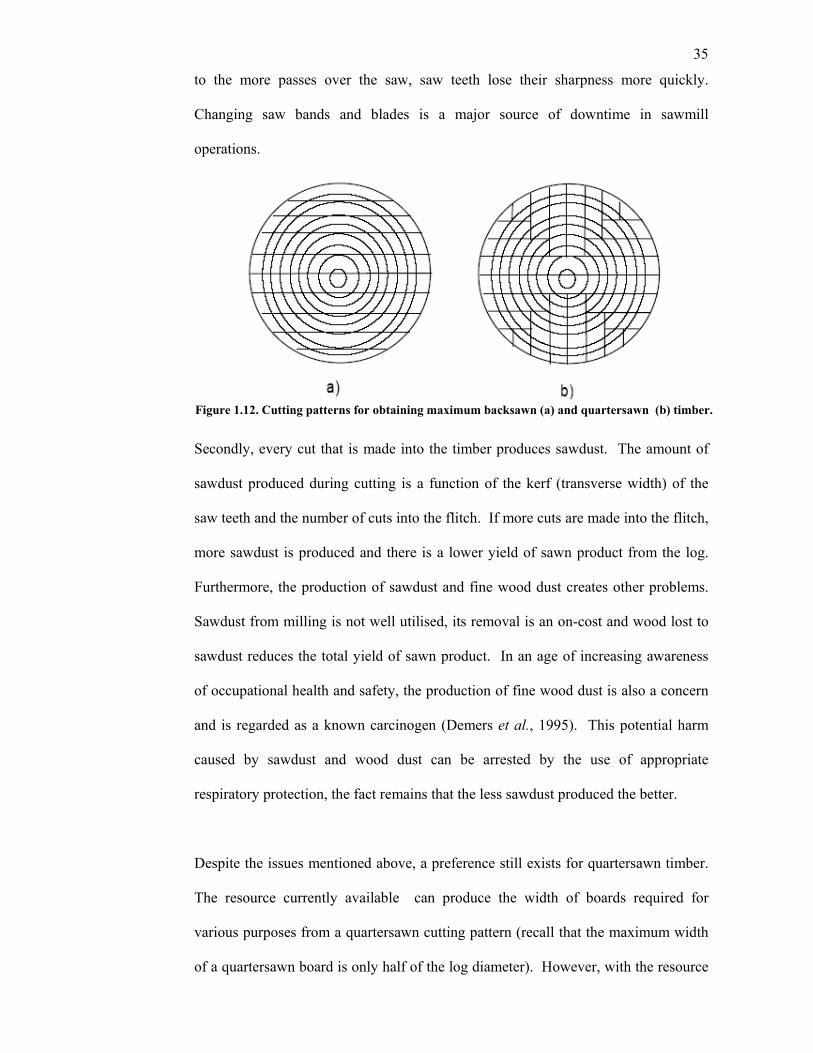
35
to the more passes over the saw, saw teeth lose their sharpness more quickly.
Changing saw bands and blades is a major source of downtime in sawmill
operations.
Secondly, every cut that is made into the timber produces sawdust. The amount of
sawdust produced during cutting is a function of the kerf (transverse width) of the
saw teeth and the number of cuts into the flitch. If more cuts are made into the flitch,
more sawdust is produced and there is a lower yield of sawn product from the log.
Furthermore, the production of sawdust and fine wood dust creates other problems.
Sawdust from milling is not well utilised, its removal is an on-cost and wood lost to
sawdust reduces the total yield of sawn product. In an age of increasing awareness
of occupational health and safety, the production of fine wood dust is also a concern
and is regarded as a known carcinogen (Demers et al., 1995). This potential harm
caused by sawdust and wood dust can be arrested by the use of appropriate
respiratory protection, the fact remains that the less sawdust produced the better.
Despite the issues mentioned above, a preference still exists for quartersawn timber.
The resource currently available can produce the width of boards required for
various purposes from a quartersawn cutting pattern (recall that the maximum width
of a quartersawn board is only half of the log diameter). However, with the resource
Figure 1.12. Cutting patterns for obtaining maximum backsawn (a) and quartersawn (b) timber.

36
increasingly coming from younger, plantation timber with smaller log diameters, this
may not always be the case and logs may need to be sawn with a greater yield of
backsawn boards to meet market requirements for timber dimension.
The statistics indicate an emerging dilemma: the dimensions of plantation timbers at
the time of harvest are less than from regrowth timbers and much less than old
growth forests. This is not the forum for a debate on the greater political issues
surrounding the harvesting of forests, but alludes to a primary motivation for the
current research.
In cutting to the quartersawn pattern, the log is first cut into four quadrant-shaped
flitches (quarters). In doing so, the maximum board width that can be obtained from
the quartersawing pattern would appear to be equal to the radius of the log.
However, as the pith of the log is of no structural use, it is cut from the width of the
board. Therefore, the true maximum available width of a quartersawn board is less
than half of the original log radius. This may not have been a problem in Lewin’s
(1906) day, but with the reduction in log diameters cutting orientation becomes an
issue of prominence. Figure 1.12 shows that maximum width boards are obtained
using a backsawn cutting pattern and it may come to be in the not too distant future,
that to obtain boards of above a given width will require cutting in the backsawn
orientation. Even if this is not to be, there are areas of the market where backsawn
timber is preferred.

37
1.6 Defects caused during drying
1.6.1 Collapse
One of the first problems encountered in drying timber is collapse. Pankevicius
(1960) explained collapse as occurring in very small fibres of wood initially filled
with free water. In the event that the free water is removed quickly from these fibres
without being replaced by air, this gives rise to a very strong hydrostatic tension in
the remaining free water. If liquid tension exceeds crushing strength of the fibre
walls, the walls implode and cause collapse.
Collapse in drying eucalypt timber was first recorded by Atkinson (1826, p.39) who
noted that upon exposure to the sun that the vasculature of native Australian
hardwood contracts so quickly that that the wood wast “…apt to cone and cast”.
Cunningham (1827, p.171) noted that the contraction in younger trees was “…most
amazing.” The Ash Eucalypts are particularly noted for collapse and the Tasmanian
Ash eucalypts (Tasmanian Oak) are considerably more susceptible than their
mainland Australian counterparts. This has been attributed to the accelerated growth
that occurs in young trees in Tasmania’s wetter climate.
Although collapse can vary between trees within a species, and even boards sawn
from different parts of one log, there appears one constant: immature wood collapses
more than older wood and this observation explains the frequency of collapse in
plantation timber (Kauman, 1966). Severe collapse appears to be more prevalent in
the wood laid down earlier in life. Growth is rapid in the juvenile phase and most of
the growth is earlywood. Consequently, the bands of stronger latewood, which have
a much higher compressive strength are further apart (Bissett & Ellwood, 1951).

38
Collapse also appears to occur 1.5 to 3 times more in the tangential direction than the
radial (Kauman, 1966). Visually, collapse appears as ripples and ridges on the board
faces and can be a recoverable form of drying degrade.
Steam reconditioning is a method utilised when the timber has dried below FSP but
is yet to reach its final desired MC. The timber is placed in a chamber that is heated
by the application of steam. The heat plasticises the wood in an atmosphere of very
high humidity and allows the collapsed cells to regain their original shape without
the timber drying out further. However, if collapse has been severe and the cell walls
have been broken, the collapse is irrecoverable.
Liquid forces and collapse
Hydrostatic pressure is illustrated in Figure 1.7 and was the basis of the first theory
on collapse as postulated by Tiemann (1915). Kauman (1966) further clarified the
notion of liquid tension as being the liquid surface tension effects that occur in
confined spaces. Ellwood et al. (1960) provided equations that indicated the
hydrostatic tension, which can develop, is a function of the capillary radii.
Water in wood is not pure and consequently, surface tension and vapour pressure of
the aqueous solution of extractives will be lower than pure water. Further addition in
a solute (i.e. a chemical pre-treatment) would seek to further reduce this surface
tension.
Stamm and Loughborough (1942) questioned Tiemann’s (1906) theory and
suggested that collapse arose from the generation of compression stresses.
Contemporary theorists and practitioners understand that drying stresses and liquid
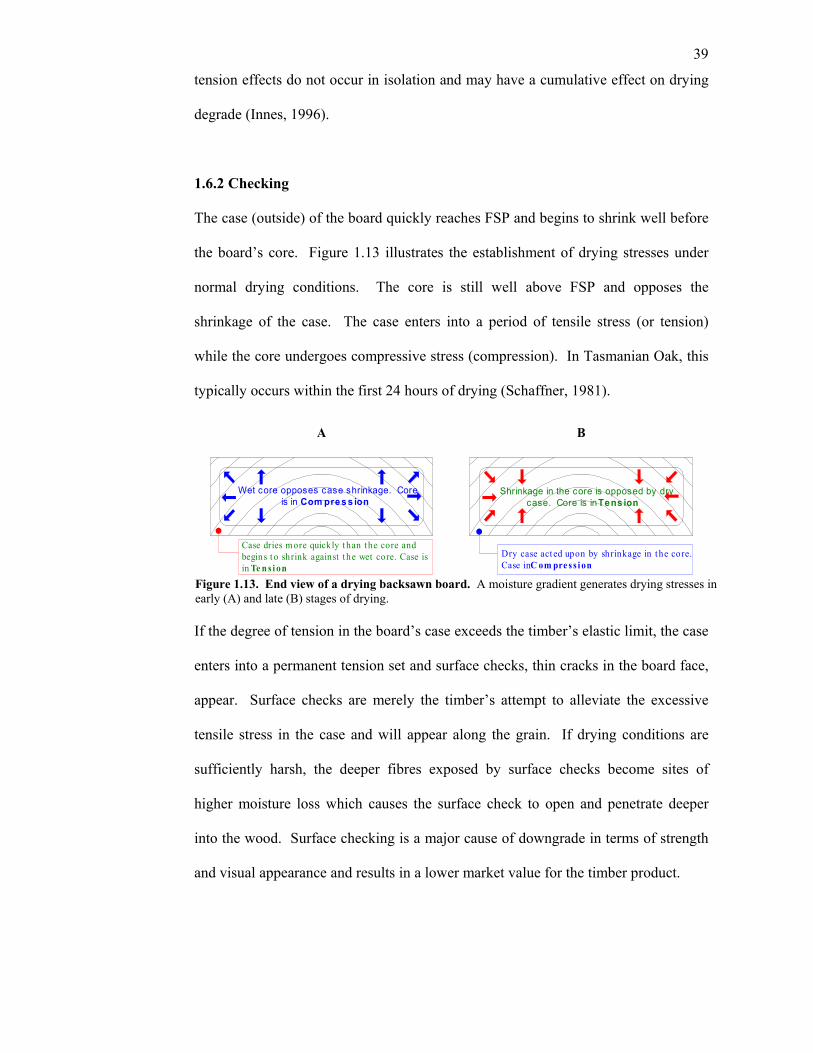
39
tension effects do not occur in isolation and may have a cumulative effect on drying
degrade (Innes, 1996).
1.6.2 Checking
The case (outside) of the board quickly reaches FSP and begins to shrink well before
the board’s core. Figure 1.13 illustrates the establishment of drying stresses under
normal drying conditions. The core is still well above FSP and opposes the
shrinkage of the case. The case enters into a period of tensile stress (or tension)
while the core undergoes compressive stress (compression). In Tasmanian Oak, this
typically occurs within the first 24 hours of drying (Schaffner, 1981).
Case dries more quickly t han the core andbegins t o shrink against t he wet core. Case isin Te n s i on.
Wet core opposes case shrinkage. Coreis in Com pres s ion.
Shrinkage in the core is opposed by drycase. Core is in Tens ion.
Dry case act ed upon by shrinkage in t he core.Case in C om pre ss i on.
A B
If the degree of tension in the board’s case exceeds the timber’s elastic limit, the case
enters into a permanent tension set and surface checks, thin cracks in the board face,
appear. Surface checks are merely the timber’s attempt to alleviate the excessive
tensile stress in the case and will appear along the grain. If drying conditions are
sufficiently harsh, the deeper fibres exposed by surface checks become sites of
higher moisture loss which causes the surface check to open and penetrate deeper
into the wood. Surface checking is a major cause of downgrade in terms of strength
and visual appearance and results in a lower market value for the timber product.
Figure 1.13. End view of a drying backsawn board. A moisture gradient generates drying stresses in early (A) and late (B) stages of drying.

40
As drying continues, the core begins to shrink. Even in properly seasoned timber,
the drier case will begin to oppose this shrinkage and thus compression forms in the
case while the core enters into a period of tensile stress. At EMC, the case of the
board has a degree of compression while the core experiences low levels of tension.
When the case has been permanently expanded due to excessive tensile stress,
surface checks close as the core falls below FSP and begins to shrink. However, the
surface checks may be sufficiently large to have entered the core and as core tension
increases, the surface of the timber gains a cupped appearance. The amount of
compressive stress in the case is proportional to the amount of tensile stress incurred
in the early stages of drying (Schaffner, 1981). Although deleterious, extensive
modelling (Innes, 1996) has shown that tensile stresses in the inner parts of drying E.
regnans boards formed late in drying (arising as a result of the tension set formed in
the outer parts of boards early in drying and shrinkage in the inner parts of boards
later in drying) almost never reach a level that would cause internal checking. The
phenomenon of internal checking, or honeycombing, is associated with collapse.
The act of reconditioning collapsed timber returns timber boards to their intended
shape, during which, some surface checks may coincidently close. However, surface
checking per se is a non-recoverable form of drying degrade. Surface checking can
be removed by planing the surface of the boards. This improves the appearance of
the timber, but decreases the overall timber yield. Internal checks are wholly and
totally irrecoverable.
Aetiology of surface checks
The origins of surface check formation may stem from the milling process. Thunell
& Aoyama (1966) showed that timber, even when milled with a bandsaw, caused
crushing and distortion of up to eight cell layers. This cell damage being a causative
41
factor in the production of surface checking, was demonstrated when ‘blanking’ or
planing the board surfaces prior to drying reduced the frequency and severity of
surface checking. The appearance of surface checks as deepening cracks in the
board surface checks indicates the direction of tension release is radial (Mackay,
1972). This suggests that the radially orientated structure with lowest resistance to
tensile stresses would be a likely source of surface check. The ray cells are a
prominent radially directed structure, but ray cells are regarded as having quite
prominent tensile strength (Schniewind, 1963). Mackay (1972) found that tensile
stress maxima was located in the vessels of Tasmanian E. obliqua and suggested that
this was due to a number of factors including the relative size of the vessels relative
to the rays in the tangential plane. The end consequence is that surface checks will
follow the direction of the ray cells, but not necessarily occur in them (Schniewind,
1963).
1.6.3 Drying defect in Tasmanian Oak
For some time it has been recognised that collapse is a major problem in Australian
hardwoods, warranting steam reconditioning (Greenhill, 1936b), and that young
eucalypts are particularly susceptible to severe collapse (Elliott, 1933). Severe
collapse was established as a specific term to describe volumetric shrinkage that was
5% greater than normal. This extra shrinkage was attributed solely to collapse
(Greenhill, 1940). An important factor is high initial moisture content, which further
exposes Tasmanian-grown plantation hardwoods as the rainfall in Tasmania in the
areas where trees are harvested can experience significant rainfall through all
seasons. With Tasmanian Oak regarded as a highly refractory timber and prone to
collapse, timber from this species grown in areas of high rainfall and harvested
sooner rather than later has very high potential for collapse.

42
It follows that a timber that readily collapses may also easily form surface and
internal checks. As surface checking is related to shrinkage, it can be understood
why the tangential board face is particularly susceptible to surface checking. When
timber is cut in the backsawn orientation, the broad face of the board has a tangential
aspect and thus is most likely to accumulate surface checks without carefully
controlled drying. Mackay (1972) stated that Tasmanian E. obliqua was so prone to
surface checking that backsawing of the species had been abandoned as a
commercial practise. Evidence of continuing disdain of this practise was provided
from the light-hearted derision the author received from mill operators when
describing the aims of the current research. Methods of reducing collapse and other
drying defects in backsawn Tasmanian Oak are therefore worthy of investigation. In
this study, the investigation centres on the use of a chemical treatment prior to drying
to attempt to arrest the onset of permanent drying defect. A chemical pre-treatment
method is one such method.
1.6.4 The rationale of chemical treatment of timber before drying
When water acts as a solvent on a solute, the aqueous solution has a lower
equilibrium relative humidity (ERH) than pure water. Addition of further solute
decreases the ERH of an aqueous solution further. When a milled timber product is
exposed to a solution, water in the wood becomes a solution with a lower ERH than
the water in the untreated portion of the wood. Consequently, the treated portion
maintains its green dimensions while the untreated core would be at or exceeding its
ERH. As a consequence, the surface of the wood remains moister compared to an
untreated control, while the core moisture moves towards the surface of the board

43
and evaporates according to the temperature, relative humidity and airflow of the
environment that the board is in.
The chemical has replaced water on the board surface but there is moisture still in
abundance and, as such, the surface fibres of treated wood have a higher EMC
compared to untreated controls dried under the same conditions. Consequently,
chemically treated timber will not check when the drying conditions are just
sufficiently severe to cause checking in untreated timber. Furthermore, water-
soluble chemicals are able to replace water within the cell lumen and cell walls and
thereby reduce the shrinkage that can occur by the loss of structural water. Chemical
treatments do not generally accelerate the drying rate, but they do allow timber to be
dried under harsher conditions that would otherwise yield saleable timber from the
untreated control.
Although there are many aspects to successfully drying chemically treated timber,
the central paradigm is as follows: rapid, low stress drying requires the use of a
chemical with a lowERH. This may allow greater moisture loss (compared to
untreated timber) at a given temperature and humidity thereby reducing the
temperature at which younger, less robust, timber would be exposed to during kiln-
drying (if following current drying regimes).Upon achieving a satisfactory dried
timber product in a reasonable time period, the ideal scenario would be to provide the
market with timber that has no added chemicals. Consequently, the chemical used
to dry the timber must be removed from the timber when no longer required. Despite
the obstacles created by this paradigm, there are significant additional benefits
afforded by chemical treatments, the most significant being an ability to reduce

44
shrinkage. For this study, the chemical under investigation is polyethylene glycol
(PEG).
1.7 Polyethylene glycol
Timber seasoning is but one of many potential uses for PEG and the compound was
commercially produced for the first time in 1940 by the Carbide and Carbon
Chemicals Company (Union Carbide Corporation, 1999). From its initial
production, PEG was viewed with interest by the pharmaceutical and cosmetics
industries (Spielman, 1980) as well as a detergent and an industrial lubricant in
rolling and cutting oil formulations (Salvage, 1970).
1.7.1 Timber treatment with PEG
After World War II, there was a resurgence in modifying wood through chemical
treatment with Stamm (1946) and Loughborough (1948) providing thorough reviews
of progress in the field to those times. In 1946, Rolf Morén and Bertil Centerwall
from the Swedish pulp and chemical company Mo och Domsjö Aktiebolag began
research with PEG for treating cellulose fibres (Morén, 1964). In the 1950s, Mo och
Domsjö Aktiebolag patented the Morén and Centerwall PEG method for timber
treatment in Sweden (1952) and Great Britain (1956).
According to Brown (1989), the first experiments using PEG for timber treatment
were by Alfred Stamm in 1934 - six years before PEG was industrially produced.
However, no publications were forthcoming at this time regarding research with
PEG. Moreover, Stamm’s seminal works on PEG (1956b, 1959b) did not cite any of
his own prior research on PEG. Brown’s (1989) assertion also appears to be
challenged by Morén (1964) who was earlier a successful nominee for the first patent

45
of the use of PEG for timber treatment and Ericks (1953) for the use of PEG in
treating plywood.
The methods described by Morén (1964) included complete impregnation of timber
veneer flitches and surface impregnation of boards prior to kiln drying. It was
immediately apparent that timber treated with PEG had a vastly reduced level of
surface checking which, in some cases, was completely eliminated, and while the
total yield of sawn wood was increased in a shorter kiln drying time. In 1951-52,
pressure treatments were developed which not only increased the infusion rate of
PEG into timber, but could also incorporate antifungal agents, fireproofing
compounds and insecticides. PEG was also produced by Mo och Domsjö Aktiebolag
and marketed under the name MoDo.
Stamm (1956b) conducted experiments for fortifying timber with Carbowax (the
tradename for PEG produced by Union Carbide). Glycerine and PEGs of molecular
weights varying from 200 to 6000 were used to assess the performance of different
PEGs to relieve shrinkage in small timber samples. When compared with an
untreated control, glycerine and PEGs were shown to reduce shrinkage caused by
loss of water in timber over a range of relative humidities. However, once PEG
molecular weight exceeded 1000, the ability to arrest shrinkage in the timber was
reduced. It was concluded that this was due to a combination of the loss of solubility
in water, increased molecular size and the consequent decreased diffusion into the
cell walls.
Stamm’s (1956b) research was seen as pivotal but was limited in its applicability
owing to sample sizes used. Jahn (1959) indicated that there had been much activity
46
in the area of timber treatment with PEG since Stamm’s (1956b) publication
particularly with commercially sized timber. In 1959, three publications were
produced from the Forest Products Laboratory (FPL) on the performance of PEG on
timbers of commercial value.
PEG was used for timber seasoning of green timber at the Crane Creek Gun Stock
Corporation when Harold Mitchell, an associate to Stamm’s early PEG research,
treated rifle stocks and blanks with PEG (Spielman, 1980). Walnut blanks treated
with PEG were kiln-dried in less time without degrade than untreated examples and
the finished gun stocks were found to be shrink-, swell- and warp-resistant and
suitable for extreme terrains (Mitchell & Wahlgren, 1959). The increased structural
rigidity of PEG-treated gunstocks was shown to have a direct impact on the accuracy
of the rifle (Dawson et al., 1962).
The success of PEG in treating timber was not universal and results were not always
viewed positively. Ellwood et al. (1960) found that shortly after timber was
immersed in undiluted PEG it became apparent that water was being drawn from the
timber faster than the rate of PEG penetration. Two days after immersion was
commenced, the blocks rose to the top of the liquid, suggesting that osmotic removal
of water had occurred leaving voided cell cavities. Histological examination showed
penetration by PEG to a depth of 3mm but the wood had clearly collapsed in the
centre.
Rietz (1969), who found that the use of a saturated PEG solution was not effective in
preventing surface checking in red oak boards, published more negative findings.
Although the results were negative, they highlighted the osmotic power that PEG had

47
and justified Stamm’s (1956a) conclusion that an aqueous PEG solution was more
suitable for aiding the drying of timber. Kreicuma & Svalbe (1972) found the
strength of pine sapwood reduced by at least 10% in any direction after treatment
with PEG 1000.
It was not well known around this time whether the use of PEG on large-scale milled
timber was an economically viable option, although the process was suitable for this
purpose (Mitchell, 1966). The most significant draw backs to using PEG were the
cost of the chemical, treatment time required and the hygroscopicity of the
compound. Despite the outstanding performance of PEG as a bulking agent in the
drying of green timber, the cost of the chemical was prohibitive and eventually
caused its chief exponent to concede and look (unsuccessfully) for cheaper
alternatives (Stamm, 1974). PEG has become a contemporary chemical of choice for
timber hobbyists and use in small- and large-scale timber preservation.
1.7.2 Contemporary, industrial use of PEG in wood
PEG has also found perhaps an unexpected use in the additional treatment of CCA
treated power poles in Canada. Gilbert et al. (1997) investigated the effects of a
combination of CCA-PEG 1000 on the climability of power poles by linesmen.
During the 1980s, PEG 1000 had been added to the traditional CCA pine treatment to
soften the outer shell of the poles to allow easier pilodyn penetration (Cooper et al.
1995; Trumble & Messina, 1985). However, it was found that after the pole was
penetrated for the first time, there was a loss of 74% of the PEG 1000 in the area
immediately surrounding the puncture within 24 months. This shows the fallibility
of the compound as a long term bulking agent but, for the very same reason, water-
48
soluble agents may be best suited for temporary modification of wood properties
while drying green timber.
There has been less research in the area of timber treatment with PEG in recent years
as recent authors (Brown, 1989) in related fields attest. Alma et al. (1996) compared
PEG 1000 with new vinyl monomer timber treatments. Despite the 60 years that had
passed since the first use of PEG for stabilising timber, PEG 1000 showed greater
resistance to shrinkage than either styrene or styrene methylmethacrylate. A recent
review (Rowell, 1999) of timber modification describes PEG in a method of
fortifying timber prior to application with a urethane coating. Modifications of this
method include the introduction of isocyanate vapour to PEG-treated timber causing
the formation of a polyurethane resin within the timber. This has been used as a
highly successful method for readying timber for flooring (Richardson, 1993) and
tabletops are still prepared with a PEG-based treatment (Rowell, 1999). Although
PEG has been shown to successfully aid the production of solid timber products, the
cost of the chemical rendered it cost-prohibitive to be considered on a large scale:
sufficient timber yields were being obtained from unassisted, conventional drying
methods. This may not be the case in Tasmania for the new millennium.
This section has reviewed the history and uses of the chemical treatment of timber.
For centuries, chemicals have been used to prolong the lifespan of milled timber
products. In the 20th Century, methods were developed which reduced the
deleterious effects of timber drying (particularly kiln drying). This has culminated in
PEG being one of the standout performers in this area and has been chosen for
investigation in this current research. The history of the development of PEG in this
role has been described ending with a description of its current uses. The next
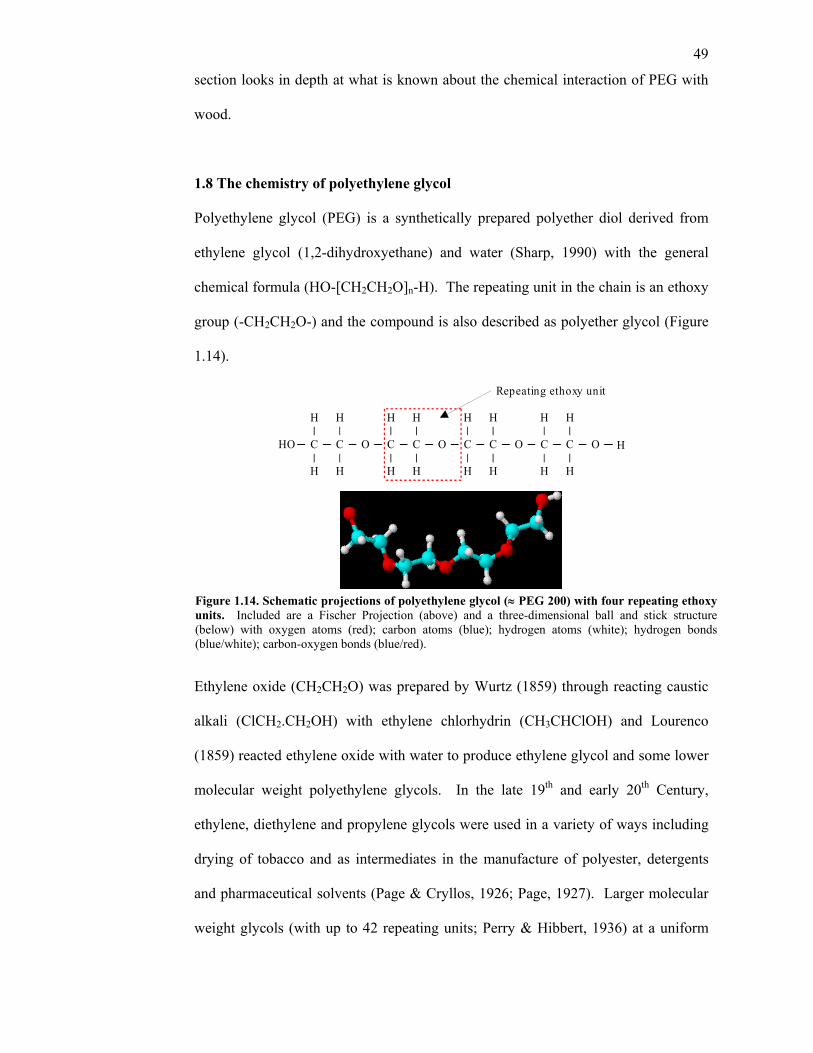
49
section looks in depth at what is known about the chemical interaction of PEG with
wood.
1.8 The chemistry of polyethylene glycol
Polyethylene glycol (PEG) is a synthetically prepared polyether diol derived from
ethylene glycol (1,2-dihydroxyethane) and water (Sharp, 1990) with the general
chemical formula (HO-[CH2CH2O]n-H). The repeating unit in the chain is an ethoxy
group (-CH2CH2O-) and the compound is also described as polyether glycol (Figure
1.14).
HHO O O O
H
H
C
H
H
C
H
H
C
H
H
C
H
H
C
H
H
C
H
H
C
H
H
C O
Repeating ethoxy unit
Ethylene oxide (CH2CH2O) was prepared by Wurtz (1859) through reacting caustic
alkali (ClCH2.CH2OH) with ethylene chlorhydrin (CH3CHClOH) and Lourenco
(1859) reacted ethylene oxide with water to produce ethylene glycol and some lower
molecular weight polyethylene glycols. In the late 19th and early 20th Century,
ethylene, diethylene and propylene glycols were used in a variety of ways including
drying of tobacco and as intermediates in the manufacture of polyester, detergents
and pharmaceutical solvents (Page & Cryllos, 1926; Page, 1927). Larger molecular
weight glycols (with up to 42 repeating units; Perry & Hibbert, 1936) at a uniform
Figure 1.14. Schematic projections of polyethylene glycol (≈ PEG 200) with four repeating ethoxy units. Included are a Fischer Projection (above) and a three-dimensional ball and stick structure (below) with oxygen atoms (red); carbon atoms (blue); hydrogen atoms (white); hydrogen bonds (blue/white); carbon-oxygen bonds (blue/red).
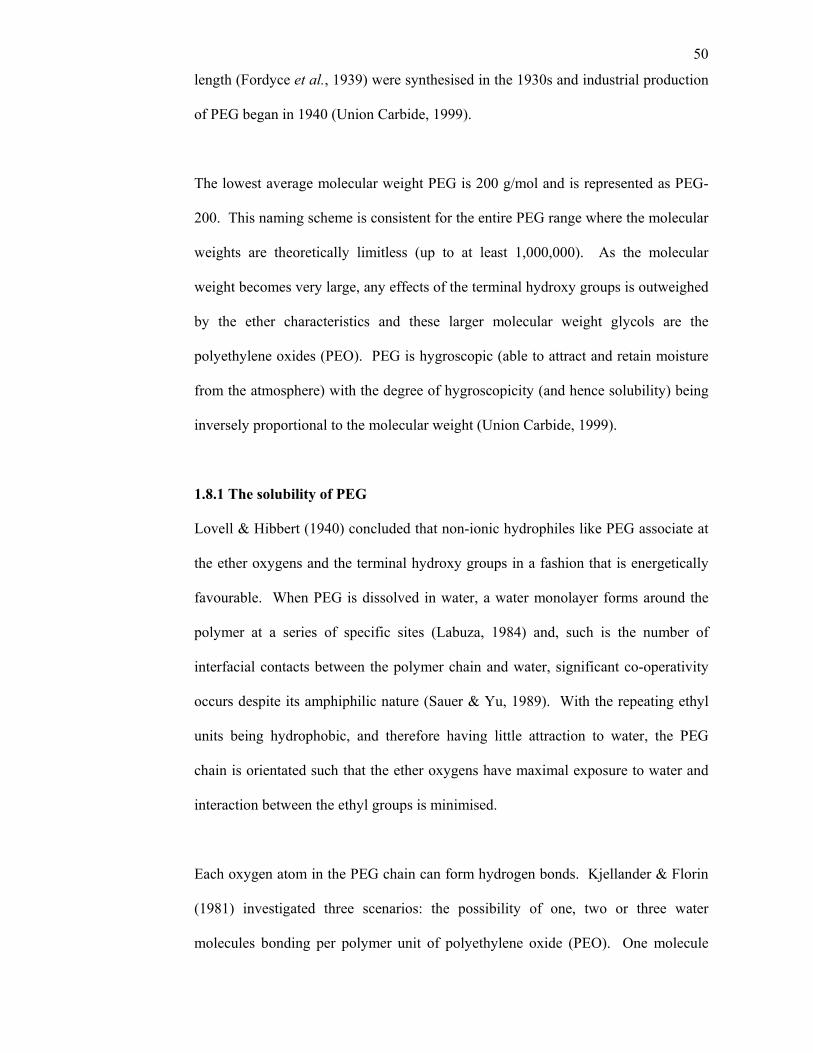
50
length (Fordyce et al., 1939) were synthesised in the 1930s and industrial production
of PEG began in 1940 (Union Carbide, 1999).
The lowest average molecular weight PEG is 200 g/mol and is represented as PEG-
200. This naming scheme is consistent for the entire PEG range where the molecular
weights are theoretically limitless (up to at least 1,000,000). As the molecular
weight becomes very large, any effects of the terminal hydroxy groups is outweighed
by the ether characteristics and these larger molecular weight glycols are the
polyethylene oxides (PEO). PEG is hygroscopic (able to attract and retain moisture
from the atmosphere) with the degree of hygroscopicity (and hence solubility) being
inversely proportional to the molecular weight (Union Carbide, 1999).
1.8.1 The solubility of PEG
Lovell & Hibbert (1940) concluded that non-ionic hydrophiles like PEG associate at
the ether oxygens and the terminal hydroxy groups in a fashion that is energetically
favourable. When PEG is dissolved in water, a water monolayer forms around the
polymer at a series of specific sites (Labuza, 1984) and, such is the number of
interfacial contacts between the polymer chain and water, significant co-operativity
occurs despite its amphiphilic nature (Sauer & Yu, 1989). With the repeating ethyl
units being hydrophobic, and therefore having little attraction to water, the PEG
chain is orientated such that the ether oxygens have maximal exposure to water and
interaction between the ethyl groups is minimised.
Each oxygen atom in the PEG chain can form hydrogen bonds. Kjellander & Florin
(1981) investigated three scenarios: the possibility of one, two or three water
molecules bonding per polymer unit of polyethylene oxide (PEO). One molecule

51
was dismissed as no hydrogen bonds are left available for cross-linking between
water chains. Two molecules were more likely with every water molecule bonding
at least once to the repeating polymer unit. While this adequately formed a solvent
shell and allowed for water-water bonds, there was no allowance for free (bulk)
water that would be only attached to other water molecules.
From this premise, the Kjellander & Florin (1981) concluded that each ether oxygen
is bonded to three water molecules – two molecules bind to the ether oxygen while a
third water molecule is dedicated to bind to both of the PEG-bound water molecules
(Figure 1.15).
It could be suggested that this relationship will not be uniform or static and would be
greatly dependent on the concentration of the solution. However, it does provide a
model for bonding that forms the solvent shell. Brownstein (1981) was more
succinct by stating that each bound water molecule is able to bond to two others,
allowing the rapid development of a large solvent shell and not just a thin monolayer
of water molecules.
52
CH 2CH
2
CH2
CH 2CH 2
CH2
CH2
CH 2
H HO
H HO
H HO
HHO
HHO
HHO
H HO
H HO
H HO
Clearly, the greater the dilution, the more water would be present as bulk water. The
complexing of water with PEG through hydrogen bonding (rather than chemical
bonding) has also been supported by the observation that PEG in solution becomes
insoluble when heated over 100°C. At this point the kinetic energy of the vibrating
water molecules exceeds the attractive force of intermolecular hydrogen bonds and
the water molecules enter the vapour phase.
The binding of PEG to a continuous chain of water molecules provides the best
geometrical conditions for unstrained coupling of PEG and water (Kjellander &
Florin, 1981) but, in solution, the size of the PEG molecule cannot be easily
predicted. The molecule is not rigid like cellulose, but has flexible linkages, which
allow it to twist and bend (Brownstein, 1981). Furthermore, the forming of hydrogen
bonds between terminal groups and ether oxygens in adjacent PEG molecules adds to
the uncertainty (Afifi-Effat & Hay, 1971). Brownstein (1981) suggested that the
Figure 1.15. Co-ordination of the PEG molecular chain in water. Ether oxygens are orientated to form hydrogen bonds (red) with water molecules while interaction between hydrophobic ethyl groups and water is minimised. Three water molecules are attributed to each ether oxygen (after Kjellander & Florin, 1981).
53
average length of the molecule is proportional to the square root of the molecular
weight.
PEG is infinitely miscible in water up to molecular weights of 1000 (Stamm, 1956b).
As the molecular weight of PEG increases, so too does the ether characteristics. At
low molecular weights, the terminal hydroxy groups are able to contribute to the
hydrophilic behaviour of the molecule, but this impact is lessened as the proportion
of hydrophobic repeating groups increases (Bilz et al., 1993). Higher molecular
weight PEGs would be totally insoluble except for the high electronegativity of the
oxygen atoms in the repeating ether unit of the polymer chain (Brownstein, 1981)
and it is the combination of hydrophilic terminal hydroxide groups and hydrophobic
repeating ether units that give rise to the PEG molecule’s inherent flexibility. As a
contrast, polypropylene (PPO) has a similar backbone structure to PEG (CH-O-
CHCH3), but PPO molecules also have methyl groups along the chain that cause
steric hindrance of the water molecule, weaken the hydrogen bond energy and cause
early separation of the two substances (Kjellander & Florin, 1981).
1.8.2 The effect of PEG on water.
The presence of PEG in solution also has some impact on the structure of unbound
water. The water molecules closest to the polymer chain are bound most avidly to
form the innermost layer of the solvent shell. The molecules are orientated such that
the δ+ region of the water molecule faces the PEG molecule.
The energy absorbed by the water-PEG bonds is very high which has an effect
beyond the water molecules around the PEG molecule. Effects on the more random
features of the bulk water can be seen beyond this point as the effects of an added

54
solute are not entirely localised: a unique quality in liquid water is that at a constant
temperature and pressure, water in solution must decrease its density to attain
equilibrium and this is in opposition to the self-associating hydrogen bonds
(Wiggins, 1990).
At lower density, water molecules move further apart which serves to make the
hydrogen bonds straighter, stronger and with an increase in chemical potential
beyond the region of the solvent shell. The increased bond strength causes a higher
level of order in the fluid structure and consequently chemical potential increases
(Wiggins, 1990). The strength of factors opposing a loss of chemical potential are
greater than those that promote it (Paine, 1982) and thus the volume of the water
molecules must expand further than other liquids to exceed the distance of maximum
hydrogen bond strength and yield a decrease in chemical potential (Wiggins, 1990).
Alternatively, a small change in chemical potential will result in a large increase in
the molar volume of water. Despite this expansion, the net density of the solution
increases because the size and mass of the PEG molecules more than compensates
for any effects of water molecule distribution due to re-establishing equilibrium.
This induced arrangement has an effect on the next layer of water molecules which,
when faced with an ordered and consistent layer of outwardly facing δ-, causes
orientation of the next layer (Wiggins, 1990). However, when larger amounts of
bulk water are present between solvent molecules, the orientating effect that PEG has
on water molecules is minimised. The impact of an aqueous solution of PEG mixing
with non-PEG water can be quantified by the effects on free energy.

55
1.8.3 Water activity (aw)
Free energy is a thermodynamic function, which, on a molar basis, is denoted as
chemical potential or the potential for the water to do work. Factors that determine
the chemical potential are temperature, pressure and the thermodynamic activity of
the substance involved. For water, the thermodynamic activity is regarded as the
activity of water (aw) (Labuza, 1984). The aw at any given temperature and pressure
will be a direct function of the amount of easily broken and reformed hydrogen
bonds and, hence. aw is at a maximum when the water is pure. Due to the presence
of all manner of biological molecules in timber, water in wood will be below aw for
pure water. It follows that the addition of a large macromolecule such as PEG to the
water within wood will cause a marked decrease in aw.
Norrish (1966) derived an equation for the theoretical determination of change in aw
after the addition of sugars (sucrose, invert sugar, glucose) and polyols (sorbitol,
glycerol) to create binary non-electrolyte solutions. The equation was found to agree
very well with experimental data and was expressed by Chirife & Ferro Fontán,
(1980) as:
aw = X1 exp (-K X22) where:
aw = activity of water
X1 = mole fraction of water
X2 = mole fraction of solute
K = activity constant of the solute
The equality indicates that an increase in K and/or X2 (particularly as the term is
squared) will result in a decrease in aw. Chirife & Ferro Fontán (1980) determined
the K values for PEG-200, -400 and -600 and found that the K value increases
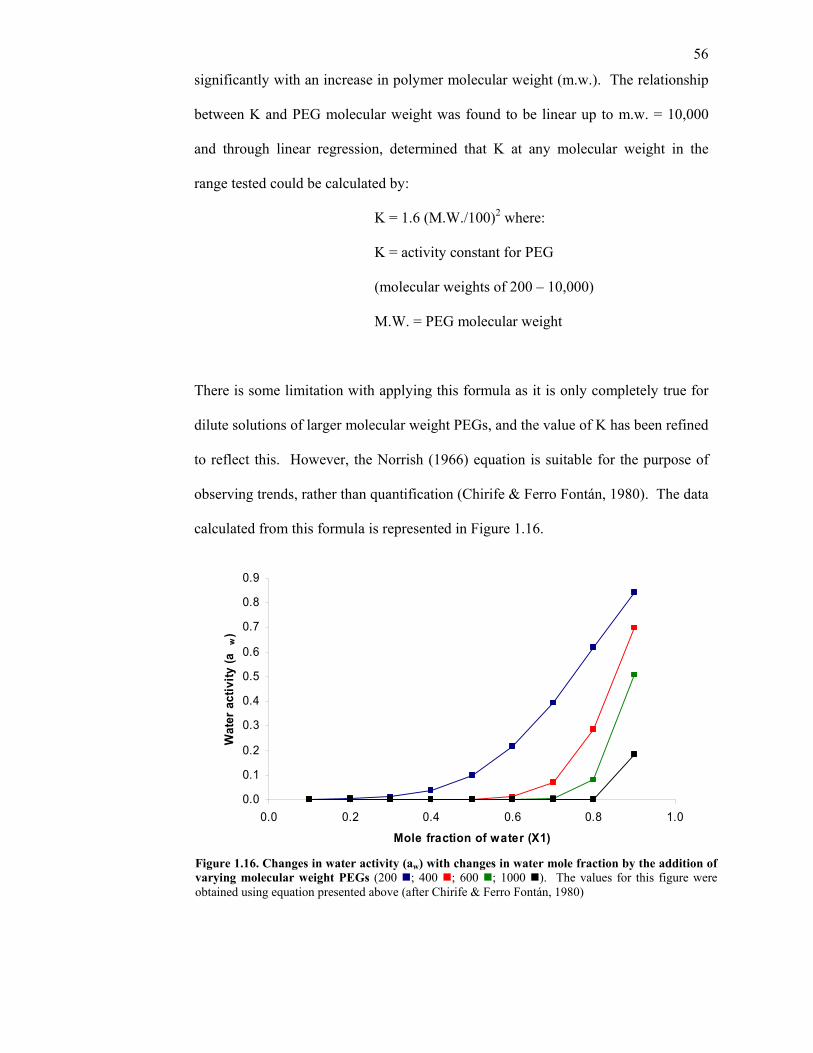
56
significantly with an increase in polymer molecular weight (m.w.). The relationship
between K and PEG molecular weight was found to be linear up to m.w. = 10,000
and through linear regression, determined that K at any molecular weight in the
range tested could be calculated by:
K = 1.6 (M.W./100)2 where:
K = activity constant for PEG
(molecular weights of 200 – 10,000)
M.W. = PEG molecular weight
There is some limitation with applying this formula as it is only completely true for
dilute solutions of larger molecular weight PEGs, and the value of K has been refined
to reflect this. However, the Norrish (1966) equation is suitable for the purpose of
observing trends, rather than quantification (Chirife & Ferro Fontán, 1980). The data
calculated from this formula is represented in Figure 1.16.
0.0
0.1
0.2
0.3
0.4
0.5
0.6
0.7
0.8
0.9
0.0 0.2 0.4 0.6 0.8 1.0
Mole fraction of water (X1)
Wat
er a
ctiv
ity (a
w)
Figure 1.16. Changes in water activity (aw) with changes in water mole fraction by the addition of varying molecular weight PEGs (200 ; 400 ; 600 ; 1000 ). The values for this figure were obtained using equation presented above (after Chirife & Ferro Fontán, 1980)

57
Figure 1.16 demonstrates that a reduction of the mole fraction of water down to 0.8
(and the concomitant addition of 0.2 mole fraction of PEG) causes a reduction in aw
that is PEG molecular weight-dependent. In the case of XPEG-1000=0.2, aw≈0 but it
should be noted that for these mole fractions to be met would require the addition of
1.39L of PEG 1000 to every 0.1L of water. With these volumes involved, it is
immediately apparent why aw is so dramatically reduced. The effects of a more
realistic solution (PEG 1000 30% v/v) on aw would be a reduction from 1.000 to
0.9680.
The demonstrated effect of PEG on water activity may have beneficial effects in the
seasoning of timber: wood that was been coated with a surface layer of PEG may
retard the loss of moisture from the surface of drying timber. This may reduce the
possibility of collapse in the early phases of drying and ameliorate the establishment
of a moisture gradient that exists between the case and core of sawn timber as drying
progresses.
1.8.4 Movement of PEG in wood
When PEG is applied to sawn wood, the first contact is, due to the sawing process,
with a fabricated surface that may contain exposed cell lumens and ruptured
structures. This contrived interface between timber and chemical increases the rate
at which PEG can begin to be adsorbed. Furthermore, polymers that are capable of
hydrogen bonding have the greatest specific adsorption capacity in timber (Tarkow
& Southerland, 1964).
Principles of thermodynamics indicate that when green wood is placed in an aqueous
PEG solution, the PEG molecules will move from a region of high concentration (the
58
solution) to a region of low concentration (the wood) in order to establish
equilibrium. Similarly, water inside the wood will move outwards in a counter
current to the influx of PEG molecules (Loughborough, 1948). If the sample remains
in the liquid for a sufficient time, allowing for loss of water through evaporation,
equilibrium will be attained between the PEG and water concentrations of the timber
and the solution. The establishment of a concentration gradient is the most
significant factor in determining the direction, but there are other factors that
determine the rate of movement in a given direction. These factors include
temperature, PEG concentration, wood permeability, moisture content in wood,
molecular size and solubility of the polymer (Alma et al., 1996).
1.8.5 PEG binding to cellulose
Owing to the similarity between water/cellulose and water/PEG bonding, it follows
that a comparable relationship could exist between cellulose and PEG. The precise
mechanism of PEG binding to cellulose is not known, but the weight of evidence in
favour of a mechanism involving hydrogen bonding with cellulose is considerable.
This mechanism is also the one chosen to describe the interaction of cellulose with
cyanoethyl ether (Baechler, 1959) and a model similar to water binding to cellulose
is favoured (Alma, et al., 1996, Figure 1.17).
Workers in the field (Noack, 1969, Hoffmann, 1988) tend to support a model that
incorporates hydrogen bonding between PEG and wood carbohydrates. Noack
(1969) found that timber treated with PEG-1000 and –4000 had lower moisture
content at moderate relative humidity than the calculated value and alluded to the
blocking of hygroscopic centres in the wood structure by a wood-PEG compound.

59
OH
OH
OH
OH
OH
A BHO
H
CH2 CH2 O n
PEG has been shown to be absorbed from transient capillaries in the form of a
compressed, high-density random coil (Ishimaru, 1976). When absorbed into the
submicroscopic capillaries, PEG can form hydrogen bonds with cellulose through
terminal hydroxyl groups and polymer unit oxygen atoms. There is little energy
required to form such bonds and this may be supplied by the heat energy of a warm
PEG solution (Parrent, 1985). When of sufficiently high solubility, PEG may
penetrate the cell wall and exchange with water. As water is driven from timber in a
drying process, PEG, with a boiling point higher than water, remains in the cell wall
(Ishimaru, 1976). Stamm & Harris (1953) coined the term for this process (though
not necessarily with PEG) as bulking the cell wall. The precise mechanism for PEG
entering the cell wall and the manner in which it stays bound (presumably to
cellulose) is not known.
Frey-Wyssling (1954) and Tarkow (1959) indicated that in the cell wall, water
gathers in the areas where amorphous cellulose is present rather than in the
Figure 1.17. Theoretical interaction of PEG (black) with cellulose with hydroxide groups (green) in the plant cell wall (heavy dashed line). Hydrogen bonding (red) may occur with oxygen atoms in PEG terminal OH groups [A] or with the ether oxygen [B] in the PEG repeating ether unit (after Alma et al., 1995).
60
interstices of the ordered cellulose matrix. Similarly, it would be expected that PEG
could be found in abundance at these sites. In addition, if sufficiently small in
molecular size, the nonpolar PEG molecule may be undeterred by the hydrophobic
regions of the ordered cellulose sheets and may infiltrate areas in the cell wall
structure where water may not be present and further enhance the bulking effect.
In fresh timber, the hygroscopic centres are mostly located on the outside of a
compact fibrillar cell wall and are accessible to the PEG molecules (Hoffmann,
1988). Accessibility to these sites however is contingent on penetrating two solvent
shells: on the cell wall and around the PEG molecule. Hoffmann (1988) noticed that
PEG 200 has a poor ability to form hydrogen bonds with cellulose, and this may be
due to the low ratio (2:3) of terminal hydroxy groups to ether oxygens in the PEG
200 chain. With the low ratio, the hydrophilic nature of the OH groups has greater
impact, and the solvent shell about the PEG molecule is retained. Consequently,
PEG and cellulose both retain their bound water, and potential bonding sites
(hygroscopic centres) on the polymer chain are not made available to link with the
plant cell wall. However, Parrent (1985) opined that the bulking properties of sugars
do not wholly rely on the formation of chemical bonds, but can effect bulking and
antishrink characteristics through steric hindrance alone. The same could be said for
PEG.
The hygroscopicity of wood is due to the OH groups on cellulose and when PEG
binds with cellulose, the number of available OH groups that can bind to atmospheric
water is reduced (Parrent, 1985). Although the ether oxygens can bind water, they
are far less hygroscopic than hydroxyl groups (Stamm, 1946). Rather than create a
void, PEG substitutes the position of water. This reduces the amount of hydrostatic

61
pressure that can be imparted on the cell structure and, by removing the variable
factor (water) and retaining the desired property (structural rigidity), dimensional
stability is improved (Stamm, 1964a).
Every liquid and solid has a pressure that needs to be overcome before forming
vapour. In time, equilibrium will be attained between the number of molecules
leaving to form the vapour and the number of molecules leaving the vapour to form
the liquid or solid. The pressure, exerted by the solid or liquid at any given
temperature where this equilibrium occurs, is the vapour pressure of a substance
(Sharp, 1990). If the pressure on the solid or liquid (the atmospheric pressure) is
higher than the vapour pressure, fewer molecules will form the vapour. Conversely,
when the pressure on a solid or liquid is lower than the vapour pressure, more
molecules will form the vapour.
Because of the many covalent bonds that form a PEG molecule, the structure is
stable and this gives rise to an inherently low vapour pressure in neat solutions. PEG
has a low vapour pressure relative to water, as does an aqueous solution of PEG.
The effect of this is two-fold. Firstly, when a PEG solution is absorbed into timber, a
region of low vapour pressure is created around the surface of the timber, which,
with time and the simultaneous establishment of a concentration gradient, progresses
inwards. A pressure difference is established between the middle of the sample and
the outer layer. The pressure gradient induces water in the high-pressure region at
the centre of the timber to move outwards to the area of low pressure in an attempt to
achieve equilibration. As more water reaches the surface of the sample, it is
exchanged for PEG in a counter current mechanism and PEG is transported from
solution into the wood.
62
Secondly, as PEG has a lower vapour pressure than water, when water is driven from
timber in a kiln, PEG will be retained in the wood substance. Stamm (1934, 1937)
suggested that as water is removed from the capillary structures, the increasing
concentration of the remaining solute further promotes migration into the cell wall.
Håfors (1990) noted that waterlogged wood samples immersed in various PEG
solutions were lighter when weighed immediately after treatment. It was reasoned
that owing to greater ease of movement, water molecules diffuse from the wood and
into the solution creating a partial vacuum in the wood and further promoting the
infusion of PEG into the timber. However this is not the case with all non-volatile
organic compounds. Although capable of absorbing 50% of its mass in water,
glycerine was vapourised during oven drying of timber (Stamm, 1956a). The higher
molecular weight PEGs (>1000) are unable to move into the cell wall after saturation
in water has been reached. This may be due to steric hindrance as well as increased
viscosity of the solution leading to lengthened diffusion times (Stamm, 1964b).
However, there is a potential benefit to higher molecular weight PEG molecules
being retained in the vascular tissue: with a greater ether component, larger PEG
molecules are able to dissolve water insoluble extractives that can obstruct the
passage of water through drying timber and may contribute to drying stresses
(Stamm & Harris, 1936).
A review of the structure and function of water and the key elements of wood
substance illustrates the manner in which the substances are arranged at a molecular
level. From this account, a series of experiments and their observations will
endeavour to provide greater insight into the manner in which PEG and other
compounds interact with wood.
63
1.8.6 Variables affecting movement of PEG in timber
Molecular weight
Stamm (1956b) indicated that solubility is a larger factor than molecular size. Prager
& Long (1951) found that the degree of branching in polyisobutylene molecules was
a greater factor affecting diffusion of polyisobutylene than molecular size or
concentration, while Aggebrandt & Samuelson (1964) found that PEGs with a degree
of polymerisation greater than 3600 were unable to enter the cellulose phase. This
may not totally prevent the bulking effect from taking place in higher molecular
weigh PEGs. The inverse relationship between PEG penetration and molecular
weight may be interpreted as a function of steric hindrance (Ishimaru, 1976), but the
effects of ether characteristics (both of which affect solubility in water) should also
be considered. On a practical note, Yamaguchi et al. (1999a-b) concluded that
significant bulking using PEGs 8500-21700 was due to coating the outside of cell
walls and thus preventing the movement of water.
Concentration
Stamm (1959c) found that, for the purposes of dimensionally stabilising timber prior
to kiln drying, a 35% w/v solution of PEG 1000 was the best compromise between
solubility, stabilising capability and ability to withstand high humidities (only when
humidity was above 90% did the timber begin to felt damp).
Temperature
Heating can allow greater penetration of the cell wall. The cause of this may be two-
fold: (1)- depolymerisation of the PEG macromolecule and the subsequent formation
of lower molecular weight chains and (2) - heat-induced relaxation of the cell wall

64
structure which holds water can allow penetration into the cell wall (Yamaguchi et
al., 1999a).
Wood structure
The greatest resistance to (and hence a determinant of) movement of a water-soluble
molecule into the wood cell may be the tertiary layer. After treatment with PEG
3000, the secondary layer was swollen while the outer layer remained unchanged but
this may also be due to other factors (molecular size and solubility) as well (Tarkow
et al., 1966). This is expected as the outer layer of the cell wall has the highest lignin
content (Fengel & Wegener, 1989). However, it should be observed that while the
dimensions of the tertiary layer do not change when exposed to a PEG solution,
neither does it inhibit the passage of PEG to the internal layers of the cell wall.
1.9 Summary
This section has introduced wood - in particular Eucalyptus sp. and Tasmanian Oak -
and its components as a chemical construct. Furthermore, theories on causes of
drying degrade in timber, the consequences of this degrade and the motivations for
timber seasoning have been reviewed. Ultimately, the effects of all forms of drying
degrade have the same result: a decrease in the sale value of and reduction in the
usable lifespan of a timber product. PEG has been employed as a means to achieve
this outcome and the experimental chapters seek to add to that body of knowledge.
The aims of this investigation are to better understand:
• The effects of a PEG pretreatment on Tasmanian eucalypt species, namely E.
delegatensis, E. obliqua and E. regnans (known collectively as Tasmanian
65
Oak) prior to drying; in particular, when timber has been milled in the
backsawn (a.k.a. flatsawn) orientation.
• The degree of penetrance and location of PEG in the wood structure.
• Changes in dimension and moisture content of the timber, differences in these
factors between chemically treated samples and untreated samples of
Tasmanian Oak will be measured in a variety of ways. Observed phenomena
will be discussed with reference to the chemical nature of the treatments used
and of the wood structure.
• At the completion of this study, it is intended that substantial and significant
knowledge will have been added to what little knowledge currently exists on
the chemical treatment of Tasmanian Oak prior to drying.

65
Chapter 2 - PEG penetration in Tasmanian Oak
2.1 General Introduction
It has been over 50 years since significant amounts of research have been conducted
on the use of polyethylene glycol (PEG) to aid the drying of commercially sawn
timber. Furthermore, investigation into the use of PEG with particular reference to
Tasmanian Oak has never been conducted. Consequently, the investigation must
begin from a position of no prior knowledge.
The experiments conducted in this chapter reflect the need to gather data on the more
fundamental aspects of the PEG-Tasmanian Oak relationship and also on methods to
be used for further research. Although basic in its outlook, its necessity cannot be
understated and, indeed, much work from this chapter was deemed worthwhile of
publication when subjected to peer review (Ralph & Edwards, 2004; Ralph, 2005).
At the completion of these experiments, a solid practical and theoretical foundation
was formed from which the effects of PEG pre-treatment on commercially important
aspects of timber drying such as change in moisture content and dimensional stability
could be observed.

66
2.2 Staining procedures for the detection of polyethylene glycol in timber.
2.2.1 Introduction
A review of the literature found that staining procedures would be the most
appropriate method for the analysis of PEG penetration in timber. Staining methods
known to be specific for PEG were investigated for their use in identifying the
location of PEG in Tasmanian Oak. Two methods were selected on the basis of their
simplicity and the generation of a rapid, confidant result. This investigation seeks to
determine which method is most suitable for significant works throughout this
research.
Method 1: Malaprade Reaction (Malaprade, 1928)
Compounds containing two hydroxyl groups undergo cleavage of carbon-carbon
bonds when treated with periodic acid to yield aldehydes:
RCHOCHOHR' + HIO4 RCHO + ++ R'CHO H2O HIO3
The initial solution is a rich brown colour and when reacted with PEG, turns mustard-
yellow. The staining method was championed by Hoffmann (1983) and is still
considered by that author to be appropriate (Hoffmann, 2001) although a simplified
version (Babinski, 2000) has been proposed.
Method 2: Cobalt Thiocyanate (Gnamm, 1943; van der Hoeve, 1948)
Cobalt thiocyanate binds with cellulose-bound PEG to form a complex that is
insoluble in xylene. PEG stains blue and untreated timber remains its natural colour.
Van der Hoeve (1948) adapted Gnamm’s (1943) ammonium cobalt thiocyanate
method for the qualitative in vitro testing of alcohols, ketones and esters to produce a
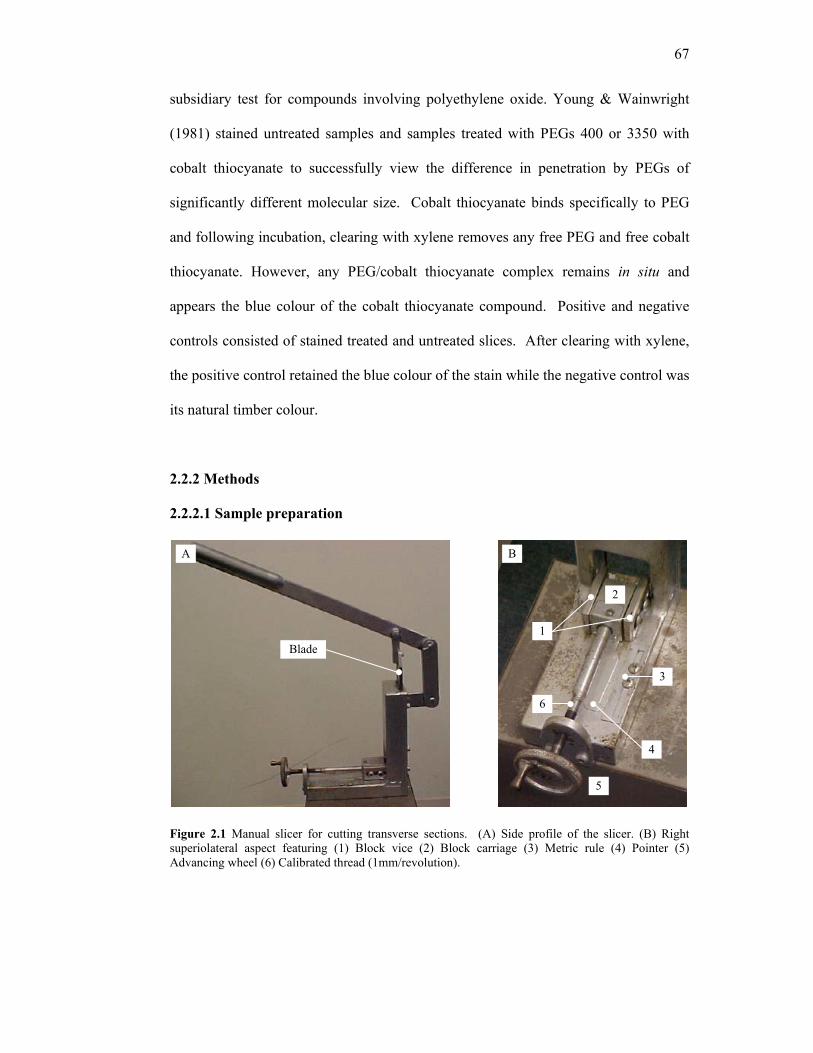
67
subsidiary test for compounds involving polyethylene oxide. Young & Wainwright
(1981) stained untreated samples and samples treated with PEGs 400 or 3350 with
cobalt thiocyanate to successfully view the difference in penetration by PEGs of
significantly different molecular size. Cobalt thiocyanate binds specifically to PEG
and following incubation, clearing with xylene removes any free PEG and free cobalt
thiocyanate. However, any PEG/cobalt thiocyanate complex remains in situ and
appears the blue colour of the cobalt thiocyanate compound. Positive and negative
controls consisted of stained treated and untreated slices. After clearing with xylene,
the positive control retained the blue colour of the stain while the negative control was
its natural timber colour.
2.2.2 Methods
2.2.2.1 Sample preparation
Blade
A
5
2
1
4
3
6
B
Figure 2.1 Manual slicer for cutting transverse sections. (A) Side profile of the slicer. (B) Right superiolateral aspect featuring (1) Block vice (2) Block carriage (3) Metric rule (4) Pointer (5) Advancing wheel (6) Calibrated thread (1mm/revolution).

68
Samples of Tasmanian Oak heartwood (40mm x 20mm x 60mm) were placed in a
purpose-built manual slicer (Figure 2.1). A section was cut from the transverse face of
the block to expose a smooth face to promote evenness of infusion. Sample blocks
were then immersed in tap water for 96 hours at room temperature to achieve
maximum moisture content. This high moisture content enhances the rate of PEG
infusion (Jahn, 1959; Spielman, 1982). In future, timber will be green-off-saw to
reflect normal conditions.
To prevent penetration into timber samples along the wood fibres, one group of
samples (n=3) had the transverse faces sealed with araldite prior to immersion in the
PEG solution.
2.2.2.2 Incubation
The samples were placed in a solution of 20% (w/v) PEG 400 as described by several
workers as being suitable for impregnating archaeological timber (Pang, 1981; Young
& Wainright, 1981; Hoffman, 1983). Controls were soaked in distilled water and
both the test and control samples were incubated in sealed containers in a waterbath.
Although each sealed container of samples were in close proximity in the waterbath,
incubating solutions could not be mixed. The temperature was set at 60°C which
allowed maximal rate of diffusion by PEG into the wood without compromising the
structure of the PEG molecules or the wood fibres (Pang, 1981).The water
temperature was also below the melting point of araldite (68ºC).
69
2.2.2.3 Preparation of sample slices
After 96 hours, samples were removed and 2mm slices cut from the transverse face
with a manual slicer. For samples sealed with araldite, the end was removed first to a
longitudinal depth of 3mm before test slices were taken. All test slices were then
placed in an oven at 103°C±2 to be completely dried. This must be achieved prior to
staining otherwise the reagent becomes too diluted to give an adequate colour reaction
(Hoffmann, 1983). When the samples were completely dry (as determined by no
further decrease in mass), samples were removed from the oven for staining.
2.2.2.4 Staining Methods
Method 1 - Iodine stain
The iodine staining solution was prepared by dissolving 2g of iodine and 4g of KI in
10mL of distilled water (dH20) and diluted up to 100mL with dH20. KI should be
fully dissolved before iodine is added as KI in solution increases the miscibility of
iodine.
A manual pump spray was prepared by thorough rinsing with tap water and flushing
through with a sample of the iodine stain solution. The stain was applied to the
sample slice and reaction was expected upon contact and indicated by the colour
change from the brown of an iodine solution to yellow (Figure 2.2). If the iodine stain
application was excessive, the timber samples were left to stand for 48 hours to allow
the excess stain to evaporate and the yellow reaction product to become visible
(Hoffmann, 1983).

70
Method 2: Cobalt thiocyanate stain
The cobalt thiocyanate method largely followed that of Young & Wainwright (1981).
Dry ammonium thiocyanate (0.2g) is added to 0.2g of cobalt nitrate hexahydrate and
dissolved in 10mL of octanol or decanol. Once dissolved (although some residue is
expected), the solution is then diluted in another 30mL of alcohol. The cobalt
thiocyanate solution was a clear, rich, deep blue colour.
2.2.2.5 Visualising PEG penetration in timber
The oven-dried samples were placed in separate vessels of staining solution, the
containers sealed with clingwrap plastic and kept at 4ºC overnight. Following
incubation, the samples were rinsed in three successive rounds of fresh xylene and
then allowed to dry overnight in a fume hood. Cellulose-bound PEG takes up the
stain colour while untreated timber, even in a partially PEG-treated sample, remain
original colour of the timber.
2.2.3 Results
BA
Figure 2.2 Malaprade staining reactions on filter (Whatman’s ashless no.60) paper. (A) PEG-soaked paper and (B) untreated paper.
The images show a distinct colour difference between treated and untreated paper
with the yellow colouration in 2.2A indicating the presence of PEG. The

71
homogenous brown colour in the negative control sample (2.2B) shows an absence of
PEG.
BA
Figure 2.3 Iodine-stained heartwood samples of E. obliqua. (A) PEG-treated samples after soaking in 30% PEG-400 for 96 hours and (B) negative control.
Sample 2.3A shows longitudinal streaks of iodine stain in a sample of E. obliqua.
The sample had been incubated unsealed and the site of the stain indicated that PEG
penetrated mostly through the late wood. This is indicated by the regularly spaced
vertical yellow stripes. However, these are difficult to discern against the colour of
the timber. There was an absence of the yellow discolouration in the negative control
sample (Figure 2.2B)
B
C D
A
Figure 2.4 Staining of PEG-treated heartwood samples of E. regnans. (A) after soaking in 30% PEG-400 for 216 hours end grain unsealed (B) untreated, post staining (C) soaked in PEG-400 for 96 hours, end grain unsealed (D) soaked in PEG-400 for 96 hours, end grain sealed. General condition of timber is poor, but expected, as a result of oven drying (103°C±2).

72
Figure 2.4 shows the staining results from using cobalt thiocyanate. The sample in
Figure 2.4A was incubated for 216 hours with the endgrain unsealed to allow
complete penetration. The difference in appearance between the PEG-soaked sample
and the negative control (2.4B) is apparent. The control sample was quartersawn
which was an experimental oversight. An unsealed sample soaked in PEG for 96
hours (Figure 2.4C) shows the preference by PEG for latewood. However, a sample
that has been end-sealed with araldite (Figure 2.4D, which allowed penetration only
through the radial and tangential surfaces, caused an even migration of PEG through
each surface. The radial aspect offered more exposure to the latewood grain and thus
penetration was deeper on the radial sides of the board with maximum penetrance
shown on the late-wood lines.
Magnified images of the treated/untreated interface in Tasmanian Oak show a
uniform and even pattern of migration in the timber (Figure 2.5A) while digital image
contrasting show very occasional accelerated migration (Figure 2.5B).
Figure 2.5A Photomicrograph of stained Tasmanian Oak showing extent of PEG penetration on the transverse surface. 40x (bar = 1mm)

73
2.2.4 Discussion
Figure 2.2 (A & B) shows the results of preliminary trials of the Malaprade reaction
conducted on filter paper. This preparatory step was considered necessary in the
event that there was any ambiguity upon staining of PEG-treated samples. The
difference between the staining of PEG and water on filter paper was clearly
discernable, although this was against a white back ground and PEG was present in
sufficient amounts to produce a strongly positive response from the Malaprade
reaction.
When the iodine stain was used on PEG-soaked samples of E. obliqua (Figure 2.3A),
the result was far from convincing. The yellow staining reaction was present, but
weakly coloured and non-uniform. The timber colour is light and straw-like and this
was a confounding factor. This appeared to cause some blending with the reaction
Figure 2.5B Digital image contrasting of PEG-treated (pink) and untreated Tasmanian Oak (blue) on the transverse surface. White circles show isolated locations of stain deposition (possibly artefact). 40x (bar = 1mm)

74
colour. However, the treated sample and the negative control (Figure 2.3B) were
visibly different, with the negative control appearing slightly darker than its original
colour.
The results observed from the utilisation of the cobalt thiocyanate complex were very
positive. Figure 2.4A is a section cut from a sample of E. regnans which had been
steeped in 30% PEG-400 for 96 hours. The end grain was unsealed which allowed
complete penetration of the wood substance. The stain was a deep blue colour and
appeared uniform over the entire section. The staining indicates that thorough
penetration occurred in this time under the incubation conditions (45°C incubation
temperature). The negative control (Figure 2.4B) supported the result in the positive
control by not retaining any of the cobalt thiocyanate complexes after rinsing in
xylene, suggesting that the stain has an exacting degree of specificity for PEG.
The unsealed sample stained in cobalt thiocyanate after 96 hours of immersion
produced the result shown in Figure 2.4C. The striated appearance sees alternating
layers of stained and unstained wood. From the relative sizes of the stained and
unstained regions and their consistency of separation, it is reasonable to suggest that
PEG has preferentially entered the same half of each growth ring in the sample. From
the difference in width of the stained and unstained bands, the narrower, stained
regions are latewood and the wider, unstained regions are earlywood. The difference
in binding affinity could be due to the combination of the size of PEG molecule and
the differences in structure between latewood and early wood. Because of its short
polyether chain, the chemistry of terminal hydroxy (hydrophilic) groups dominates
the chemical behaviour of PEG 400. Consequently, lower molecular weight PEGs
75
have greater affinity to (hydrophilic) cellulose than (hydrophobic) lignin. There is a
greater proportion of cellulose in latewood and thus binding of PEG, initially, could
be more readily received in latewood than early wood. However, as Figure 2.4A
showed, with time, PEG was absorbed throughout the entire wood matrix. Figure
2.4C also showed that in 96 hours, the exterior surface of the sample readily absorbed
PEG resulting in a uniform deposit of the chemical in the outer layers of the sample in
both earlywood and late wood. PEG deposition was not only a surface phenomenon;
splitting a sample showed uniform penetration to the depth indicated at the surface.
When the sample end-grain (transverse aspect) was sealed with araldite before
immersion in the PEG solution, this prevented any PEG entering immediately into the
core. Figure 2.4D shows that in end-sealed samples, PEG enters into the wood
substance via the radial and tangential surfaces only. The image showed that there
was a significant level of uniformity in the PEG migration, although there appeared to
be some discrete areas of enhanced penetration at the site of what appear to be
latewood bands. This was certainly in agreement with what was observed previously,
but it suggested that access to the longitudinal aspect of the fibres was required for the
most rapid PEG penetration.
The interface between stained and unstained timber was examined more closely by
light microscopy and digital image enhancement. Images from this inspection are
shown (Figure 2.5 A & B). The images show a very discrete demarcation between
stained and unstained wood. The colour throughout the stained region is uniform and
the contrast image shows that there is virtually no evidence of PEG leaching beyond

76
the migration zone. Occasional flecks of stained material were found beyond the
stained region, which are of little consequence.
Suitability of the staining method
The consistency of results showed that the adapted method of Young & Wainwright
(1981) is suitable for the measurement of PEG in Tasmanian Oak (the marketing term
for 3 species of Eucalypt; E. delegatensis¸ E. regnans, E. obliqua) up to at least MW
of 1000. The blue colour contrasted very well with the colour of timber and allowed
for easy visualisation of areas of PEG uptake. It would be anticipated that this
method would be suitable for detecting PEG in other species of Eucalypt.
2.2.5 Conclusion
This investigation into staining methods for detecting PEG in Tasmanian Oak has
shown the cobalt thiocyanate method to be most suitable for further studies on
Tasmanian Oak. The lack of uniformity and differentiation when using the iodine
stain to detect the presence (and absence) of PEG suggest that it is unsuitable for
performing work of such nature in this study. The cobalt thiocyanate method
produced very pleasing results in its clarity and specificity. The fact that the dye
colour is not a natural colour in wood is an added advantage.
In a 30% solution, PEG-400 was shown to preferentially enter latewood through the
transverse aspect and, by 216 hours, penetrated all observable aspects of the wood
substance. Sealing the transverse aspect with araldite prevented PEG penetration
from this direction, but penetration through the radial and tangential aspects was
unabated. Sealing off the transverse faces will be of benefit in future experiments as
77
this allows the effects of PEG on the radial and tangential surfaces to be examined in
isolation from the longitudinal aspects.
Photomicrography showed the degree of PEG penetration to be consistent and
uniform, but this level of inspection is cursory at best, and histological investigation
of PEG deposition may provide a greater deal of clarity and localisation of site-
specific interaction between PEG and cellulose. In addition, with the confirmation of
a discreet, uniform and quantifiable method of measuring PEG penetration in
Tasmanian Oak is the ability to measure PEG penetration with respect to time. These
investigations are presented in following chapters.
2.3 Quantifying PEG penetration in Tasmanian Oak
2.3.1 Introduction
PEG has been shown to penetrate Tasmanian Oak in an even, uniform manner from a
30% (v/v) aqueous solution (Chapter 2.1). A method has been determined whereby
depth of penetration can be quantified. This section firstly sought to gain
confirmation that a 30% PEG solution (as recommended for timber drying studies by
Stamm (1956a)) is not an excessive concentration to achieve the intended requirement
of uniform migration through the tangential and radial walls of Tasmanian Oak.
Secondly, physical and experimental variables were investigated to establish their
effect on PEG penetration. The three species in Tasmanian Oak, E. delegatensis, E.
obliqua and E. regnans, have different environmental requirements for growth and
differing physical properties which may affect the amount and pattern of PEG
penetration. Furthermore, the manner and pace at which PEG is absorbed into timber

78
may vary under differing environmental conditions. This study intends to measure
the rate of PEG uptake in the species of Tasmanian Oak under varying
“environmental conditions” to establish some base-line values for absorption over
time.
2.3.2 Method
2.3.2.1 Determining a suitable PEG concentration
Samples of backsawn heartwood E. regnans (25mm x 35mm x 300mm) were
obtained and prepared as described in Section 3.2. However, for this experiment, six
samples of 35mm length were required from each 300mm original length. The six
smaller samples were placed in a container that was then filled with a PEG-400
solution of a given (v/v) concentration (5.5%, 11%, 16.5%) that had been made up in
dH20.
After two days of incubation in a 45°C water bath, a sample was removed. This was
repeated daily with the final sample being removed from the solution seven days after
the incubation had begun.
The manual slicer (Figure 2.1) was used to cut the samples across the transverse face.
The sealed end of each sample was removed first to a longitudinal depth of 3mm
before test slices were taken. All test slices were then placed in an oven at 103°C±2
for 24 hours. The oven dry slices were then stained with ammonium thiocyanate as
per Sections 2.2.2.4.2 and 2.2.2.5. Slices were inspected for homogenous migration
of PEG.
79
2.3.2.2 Effects of temperature, concentration and species
Samples of E. delegatensis, E. obliqua and E. regnans (25mm x 35mm x 300mm)
were obtained and prepared as described in Section 3.2 from a 300mm sample as
described in Section 2.3.2.1. Samples for each species were matched with respect to
cutting orientation (i.e. backsawn), dimension, species, incubation time, temperature
and molecular weight. Each of the seven samples for a given incubation temperature
and molecular weight of PEG were obtained from the original 300mm sample (i.e.
7x[40mmx25mmx35mm samples]. Samples from each species were incubated in 30%
solutions of PEG-400, PEG-600 or PEG-1000 for up to seven days at temperatures of
30°C, 45°C or 60°C. After incubation, samples were treated as described previously
(sections 2.3.2.1, 2.2.2.4.2 and 2.2.2.5).
Depth of penetration was measured using digital vernier callipers from the edge of the
sample to the cessation of the blue colour at four evenly spaced points along the four
sides each sample slice. Therefore, for any one sample, incubated for any one length
of time, temperature and molecular weight, 48 data points (4 measurements x 4 sides
x 3 slices) were taken.
2.3.2.3 Data Analysis
Average values were taken over the 48 data points for each combination of
parameters and the means and standard errors calculated. Confidence intervals (C.I.)
were calculated based on the number of data points using equations 1 and 2 with the
desired C.I. established at 95% (α = 0.05).

80
CI SDnEquation 1 (tα/2,n-1)
Equation 2 %CI xCI
Where:
α = confidence interval (95%)
CI = Confidence Interval
SD = Standard Deviation
n = number of samples
%CI = percentage confidence interval
x-bar = mean
The average values for each set of parameters were plotted, a line of best fit applied
and an R2 value calculated to determine the linearity of the data. The slope of the line
was a measure of the rate of penetration and it was the penetration rate, rather than
distance that was particularly in focus. However, for a fixed time period, distance is a
function of rate. Repeated Measures ANOVA (Stata 8.2, StataCorp, College Station
Texas 77845 USA) was used to determine significant differences between the varying
factors and to calculate interaction terms.

81
2.3.3 Results
2.3.3.1 Determining a suitable PEG concentration
CBA
Figure 2.6 Representative samples of penetration in E. regnans incubated for 96 hours PEG-400
solutions of concentrations (v/v) (A) 5.5%, (B) 11% and C (16.5%).
Figure 2.6 (A-C) show representative slices incubated for 96 hours in PEG 400
concentrations (v/v) of 5.5%, 11% and 16.5% respectively. The sample steeped in the
lowest concentration solution (Figure 2.6A) shows negligible infusion of PEG into the
timber. Although the concentration is low, it is still within the limits of sensitivity of
the staining method (Young & Wainwright, 1981). After treatment with an 11.5%
solution, the infusion of PEG into the timber was more appreciable, but the layer was
not consistent around the entire surface (Figure 2.6B). The 16.5% solution contained
sufficient concentrations of PEG to cause a more consistent coverage of the tangential
and radial outer surfaces (Figure 2.6C), but migration into the timber after 96 hours
was negligible.
2.3.3.2 Effects of time, temperature and PEG molecular weight on PEG
penetration in Tasmanian Oak
A method that looks at several variables across a broad range will produce a large and
possibly unwieldy number of results. The data is presented to allow comparison
between data sets, isolating variables that were measured simultaneously.
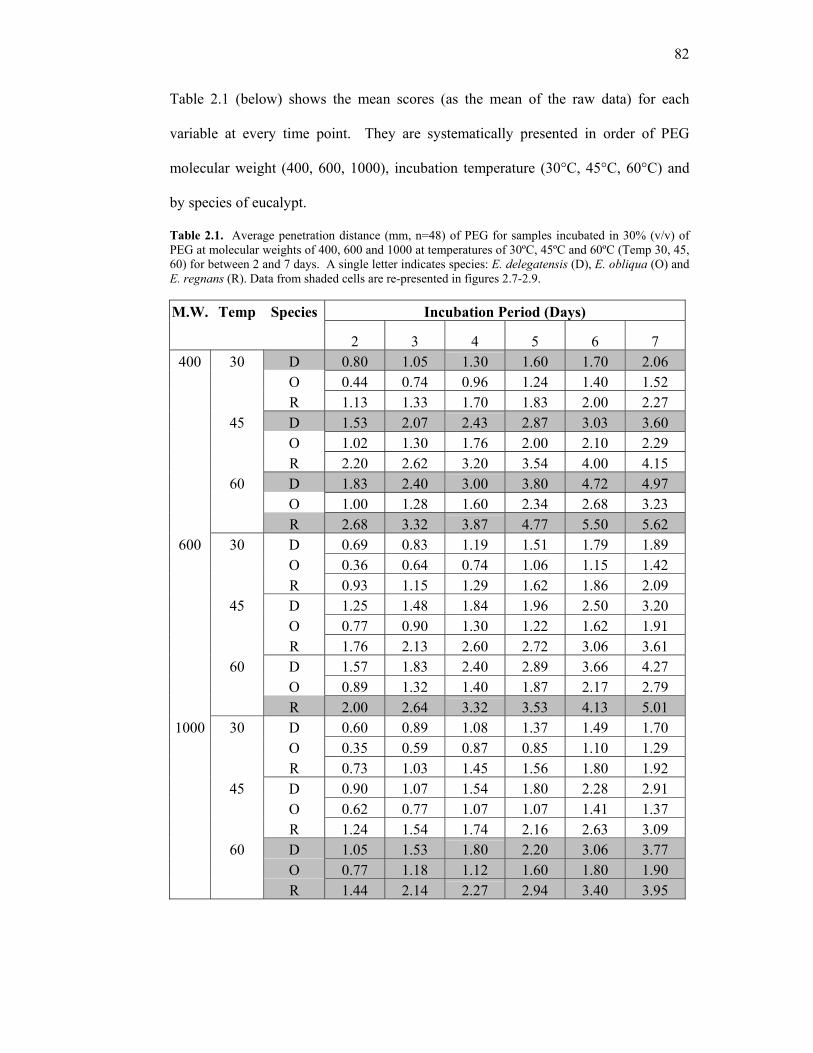
82
Table 2.1 (below) shows the mean scores (as the mean of the raw data) for each
variable at every time point. They are systematically presented in order of PEG
molecular weight (400, 600, 1000), incubation temperature (30°C, 45°C, 60°C) and
by species of eucalypt.
Table 2.1. Average penetration distance (mm, n=48) of PEG for samples incubated in 30% (v/v) of PEG at molecular weights of 400, 600 and 1000 at temperatures of 30ºC, 45ºC and 60ºC (Temp 30, 45, 60) for between 2 and 7 days. A single letter indicates species: E. delegatensis (D), E. obliqua (O) and E. regnans (R). Data from shaded cells are re-presented in figures 2.7-2.9. M.W. Temp Species Incubation Period (Days)
2 3 4 5 6 7 400 30 D 0.80 1.05 1.30 1.60 1.70 2.06
O 0.44 0.74 0.96 1.24 1.40 1.52 R 1.13 1.33 1.70 1.83 2.00 2.27 45 D 1.53 2.07 2.43 2.87 3.03 3.60 O 1.02 1.30 1.76 2.00 2.10 2.29 R 2.20 2.62 3.20 3.54 4.00 4.15 60 D 1.83 2.40 3.00 3.80 4.72 4.97 O 1.00 1.28 1.60 2.34 2.68 3.23 R 2.68 3.32 3.87 4.77 5.50 5.62
600 30 D 0.69 0.83 1.19 1.51 1.79 1.89 O 0.36 0.64 0.74 1.06 1.15 1.42 R 0.93 1.15 1.29 1.62 1.86 2.09 45 D 1.25 1.48 1.84 1.96 2.50 3.20 O 0.77 0.90 1.30 1.22 1.62 1.91 R 1.76 2.13 2.60 2.72 3.06 3.61 60 D 1.57 1.83 2.40 2.89 3.66 4.27 O 0.89 1.32 1.40 1.87 2.17 2.79 R 2.00 2.64 3.32 3.53 4.13 5.01
1000 30 D 0.60 0.89 1.08 1.37 1.49 1.70 O 0.35 0.59 0.87 0.85 1.10 1.29
R 0.73 1.03 1.45 1.56 1.80 1.92 45 D 0.90 1.07 1.54 1.80 2.28 2.91 O 0.62 0.77 1.07 1.07 1.41 1.37 R 1.24 1.54 1.74 2.16 2.63 3.09 60 D 1.05 1.53 1.80 2.20 3.06 3.77 O 0.77 1.18 1.12 1.60 1.80 1.90 R 1.44 2.14 2.27 2.94 3.40 3.95

83
Error analysis presented in Table 2.2 and 2.3 accounted not only for error in raw data,
but also for interaction between the individual variables. Some data sets from Table
2.1 are represented in Figures 2.8-2.10 to provide a clearer indication of the
relationship that has been highlighted in this research.
Across all variables of temperature, molecular weight and species, there is a
consistent demonstration of increase in penetration depth as the incubation time
increases. Examples of each variable set have been represented in Figures 2.8, 2.9,
2.10.
Table 2.2 Representative confidence intervals (C.I.s) for Day 2 and Day 7 for samples incubated in 30% (v/v) of PEG at molecular weights of 400, 600 and 1000 at temperatures of 30ºC, 45ºC and 60ºC (Temp 30, 45, 60). A single letter indicates species: E. delegatensis (D), E. obliqua (O) and E. regnans (R). The target C.I. for the data was 95%. Data sets with C.I.s below the 95% limit are appear in grey.
400 600 1000 Temp Species Day 2 Day 7 Day 2 Day 7 Day 2 Day 7
30 D 92.1 93.4 95.6 97.6 94.6 96.7 O 91.5 96.7 92.6 96.3 96.2 95.4 R 95.3 94.2 94.0 93.1 97.5 95.3
45 D 96.4 96.4 93.8 96.6 94.6 98.0 O 95.3 96.1 94.22 96.3 92.2 94.7 R 94.3 93.3 97.4 96.7 93.7 96.9
60 D 97.3 98.3 97.4 98.1 96.8 98.5 O 96.1 98.1 96.2 98.4 94.0 97.4 R 97.4 96.9 96.8 97.3 95.1 97.8
With the t-score (t0.025, n-1= 47) obtained from a T-table, Equations 2.1 and 2.2 were
used to predict whether the sample size was sufficient to return a desired confidence
interval based on the variability in the data set. Fifty four values for %CI are
presented in Table 1. Of these, thirty eight (70%) are above the 95% C.I. and of the
sixteen values beyond the C.I., seven are out by less than 1 per cent and the greatest
departure from the set C.I. is only by 3.5 per cent. Error analysis showed that the high
number of data points was able to overcome the natural variability found in timber.
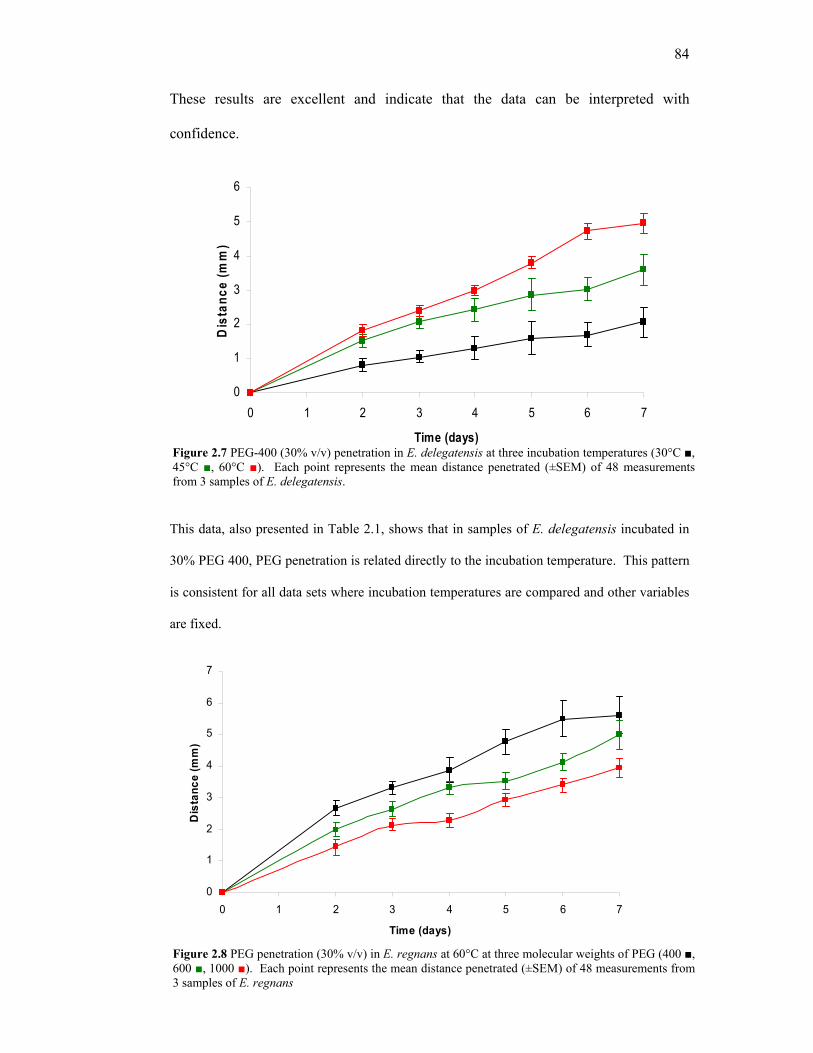
84
These results are excellent and indicate that the data can be interpreted with
confidence.
0
1
2
3
4
5
6
0 1 2 3 4 5 6 7
Time (days)
Dis
tanc
e (m
m)
This data, also presented in Table 2.1, shows that in samples of E. delegatensis incubated in
30% PEG 400, PEG penetration is related directly to the incubation temperature. This pattern
is consistent for all data sets where incubation temperatures are compared and other variables
are fixed.
0
1
2
3
4
5
6
7
0 1 2 3 4 5 6 7
Time (days)
Dis
tanc
e (m
m)
Figure 2.8 PEG penetration (30% v/v) in E. regnans at 60°C at three molecular weights of PEG (400 ■, 600 ■, 1000 ■). Each point represents the mean distance penetrated (±SEM) of 48 measurements from 3 samples of E. regnans
Figure 2.7 PEG-400 (30% v/v) penetration in E. delegatensis at three incubation temperatures (30°C ■, 45°C ■, 60°C ■). Each point represents the mean distance penetrated (±SEM) of 48 measurements from 3 samples of E. delegatensis.
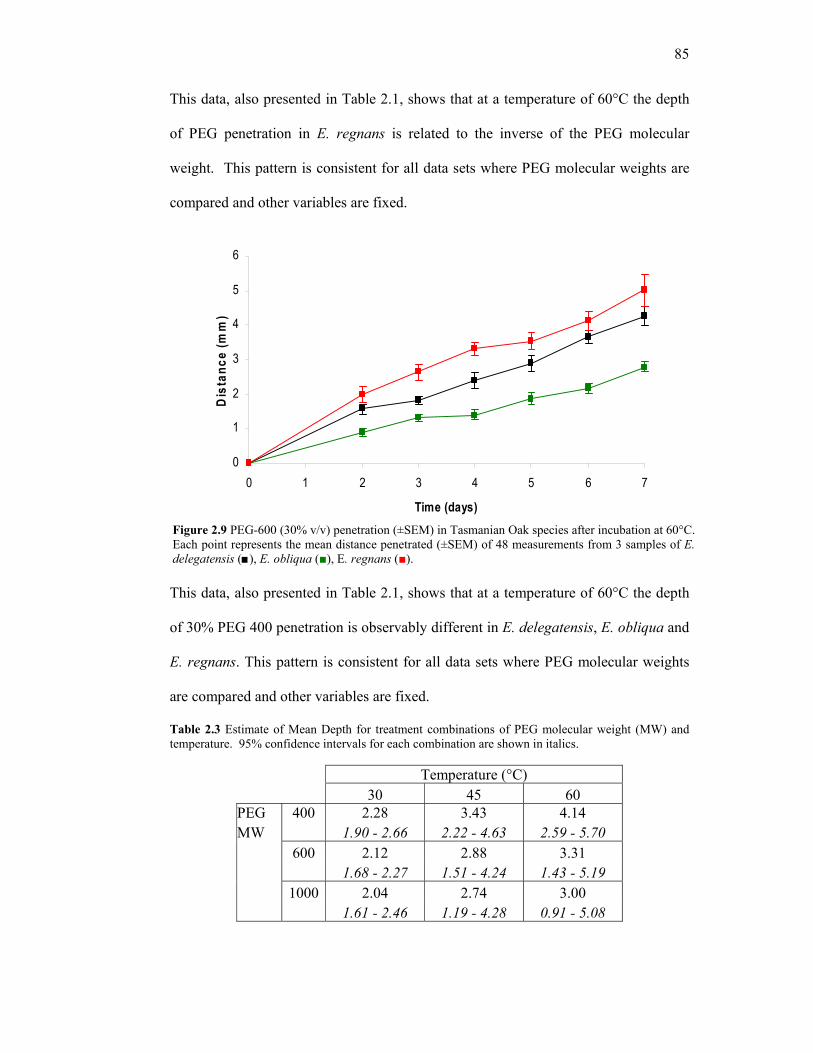
85
This data, also presented in Table 2.1, shows that at a temperature of 60°C the depth
of PEG penetration in E. regnans is related to the inverse of the PEG molecular
weight. This pattern is consistent for all data sets where PEG molecular weights are
compared and other variables are fixed.
0
1
2
3
4
5
6
0 1 2 3 4 5 6 7
Time (days)
Dis
tanc
e (m
m)
This data, also presented in Table 2.1, shows that at a temperature of 60°C the depth
of 30% PEG 400 penetration is observably different in E. delegatensis, E. obliqua and
E. regnans. This pattern is consistent for all data sets where PEG molecular weights
are compared and other variables are fixed.
Table 2.3 Estimate of Mean Depth for treatment combinations of PEG molecular weight (MW) and temperature. 95% confidence intervals for each combination are shown in italics.
Temperature (°C) 30 45 60 PEG 400 2.28 3.43 4.14 MW 1.90 - 2.66 2.22 - 4.63 2.59 - 5.70 600 2.12 2.88 3.31 1.68 - 2.27 1.51 - 4.24 1.43 - 5.19 1000 2.04 2.74 3.00 1.61 - 2.46 1.19 - 4.28 0.91 - 5.08
Figure 2.9 PEG-600 (30% v/v) penetration (±SEM) in Tasmanian Oak species after incubation at 60°C. Each point represents the mean distance penetrated (±SEM) of 48 measurements from 3 samples of E. delegatensis (■), E. obliqua (■), E. regnans (■).

86
Mean depth data is calculated from all of the raw data measurements obtained and
measures for interaction between the given variables (time, temperature, PEG
molecular weight and species). A mean depth existing between the 95% confidence
intervals (shown below each mean value in italics) indicates that the data from that set
is reliable and that the combination and that the interaction of the variables is
significant. That is to say, that penetration measurement being highest for any given
day when E. regnans is incubated in PEG 400 at 60°C is not by chance.
Penetration data showed a distinct difference in migration of PEG during the first two
days of incubation compared to the inwards movement over the final five days of
incubation. Line of best fit for each data set shows that the IRP (Figure 2.10A)
increased with incubation temperature. The slope of the line from Day 0 to Day 2
quantified the penetration rate during this time and was denoted as the Initial Rate of
Penetration (IRP). Over the last 5 days of incubation, denoted as the Final Rate of
Penetration (FRP), the rate of PEG penetration was less, as indicated by the slope of
the line of best fit. (Figure 2.10B).
Figure 2.10 Initial Rate (2.10A) and Final Rate (2.10B) of Penetration (IRP, mm/day) of PEG-1000 (30%v/v) penetration at three temperatures (30°C, 45°C and 60°C). For calculation, the three Tasmanian Oak eucalypt species were represented numerically by their established average species densities (Kg/m3) at 12%MC: E. delegatensis (625), E. obliqua (660) and E. regnans (770) (AS 2082-2000). Linear regression analysis yielded lines of best fit for each of the species of Tasmanian Oak during initial and final phases of penetration with respective values of R2: E. delegatensis (■, R2 = 0.9643, 0.9189), E. obliqua (■, R2 = 0.9735, 0.9356), E. regnans (■, R2 = 0.9767, R2 = 0.9845). Initial Rate data is measured from T = 0d to T = 2d and Final Rate data from T = 2d to T = 7d.
0
0.2
0.4
0.6
0.8
30 45 60Initi
al R
ate
of P
enet
ratio
n (m
m/d
ay)
0
0.2
0.4
0.6
0.8
30 45 60Fina
l Rat
e of
Pen
etra
tion
(mm
/day
)
Temperature (°C) Temperature (°C)
A B

87
This data was also sorted by species on the basis of the physical property of species
density at 12%MC. Clear separation of the data sets according to their species is
shown using this quantitative parameter as a determinant.
2.3.4 Discussion
PEG concentration
From observing the increasing prevalence of the stained, cobalt thiocyanate complex,
the uptake of PEG 400 in Tasmanian Oak from aqueous solutions increases with the
increase in PEG solution concentration. However, after 96 hours, there is no
consistent uptake of PEG by the timber up to a concentration of 11%. At 16.5%, the
uptake is consistent; forming an enveloping layer of PEG on the surface of the timber,
but the depth of penetration is insufficient to accurately measure penetration depth.
However, based on these results it can be suggested that the 30% (v/v) PEG solutions
recommended by Young & Wainright (1981) would provide an adequate depth of
penetration for confident measurement.
Diffusion of PEG into Tasmanian Oak
There were four parameters being considered with respect to diffusion of 30% PEG
solutions into Tasmanian Oak: incubation time, incubation temperature, PEG
molecular weight and differences between the species of (E. delegatensis, E. obliqua,
E. regnans). Error analysis (Table 2.3) showed that the data was statistically reliable.
The effect on the rate of penetration by each of these factors is discussed below.

88
Incubation time
In the majority of cases, the amount of penetration in each sample increased with
time. This effect was independent of the treatment conditions or the species of timber
used. Data from Table 2.1 can be arranged to show the relationship between data sets
for a given temperature, PEG molecular weight or to observe any differences between
species. E. regnans incubated in PEG 400 at 60°C showed the greatest PEG
penetration for any given day, E. obliqua incubated 30°C in PEG 1000 measured the
lowest amount of penetration on any day. Several factors need to be discussed in
isolation and in combination.
Incubation temperature
Incubation temperature (Figure 2.7) had a significant effect on the amount of PEG
penetration as the PEG molecular weight in the solution and the timber species are
constant. This effect was shown to be the case across all variables. Although the
pattern of movement into the timber was similar at each temperature (that is,
increasing with each day of incubation), the total penetration distance was noticeably
different at different temperatures. This is not unexpected. More heat energy is
applied to the system, there is greater kinetic energy emitted by the moving
molecules, and the molecules move faster in the direction dictated by the
concentration gradients, moving PEG into the timber and water in the timber out into
the incubated solution.
PEG Molecular Weight
Penetration rate of PEGs varies of differing molecular weight (Figure 2.8). The depth
of PEG diffusion into the timber for any combination of species, time and temperature
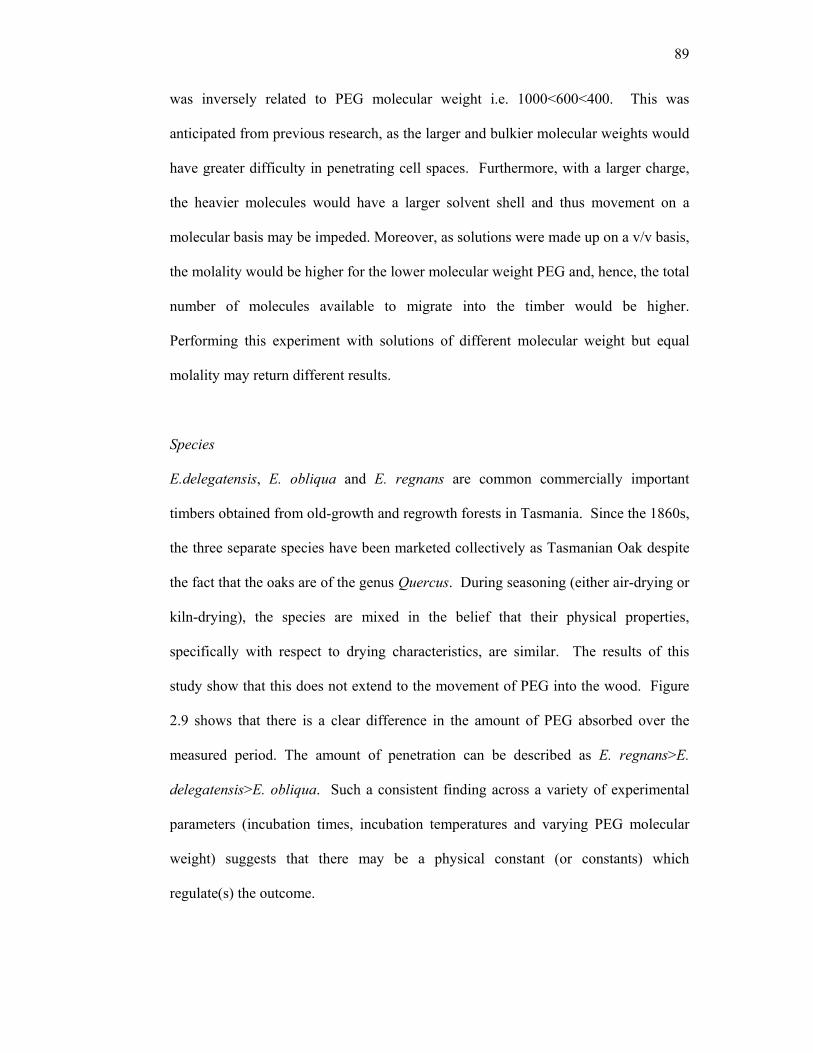
89
was inversely related to PEG molecular weight i.e. 1000<600<400. This was
anticipated from previous research, as the larger and bulkier molecular weights would
have greater difficulty in penetrating cell spaces. Furthermore, with a larger charge,
the heavier molecules would have a larger solvent shell and thus movement on a
molecular basis may be impeded. Moreover, as solutions were made up on a v/v basis,
the molality would be higher for the lower molecular weight PEG and, hence, the total
number of molecules available to migrate into the timber would be higher.
Performing this experiment with solutions of different molecular weight but equal
molality may return different results.
Species
E.delegatensis, E. obliqua and E. regnans are common commercially important
timbers obtained from old-growth and regrowth forests in Tasmania. Since the 1860s,
the three separate species have been marketed collectively as Tasmanian Oak despite
the fact that the oaks are of the genus Quercus. During seasoning (either air-drying or
kiln-drying), the species are mixed in the belief that their physical properties,
specifically with respect to drying characteristics, are similar. The results of this
study show that this does not extend to the movement of PEG into the wood. Figure
2.9 shows that there is a clear difference in the amount of PEG absorbed over the
measured period. The amount of penetration can be described as E. regnans>E.
delegatensis>E. obliqua. Such a consistent finding across a variety of experimental
parameters (incubation times, incubation temperatures and varying PEG molecular
weight) suggests that there may be a physical constant (or constants) which
regulate(s) the outcome.

90
The Australian Standard (AS 2082-2000) lists the physical properties of all
commercially important Australian hardwood timbers. Of note is the average density
of seasoned hardwood species at 12% moisture content (MC). Density is determined
by the ratio between the mass of the timber (at a given %MC) expressed in kg/m3 and
the volume of the timber after drying to 0%MC. E. delegatensis, E. obliqua and E.
regnans have average densities (kg/m3) of 660, 770 and 625 respectively. When
compared to the rate of PEG penetration, there is an inverse relationship between
basic density at 12%MC and PEG penetration: the higher the density, the slower the
infusion.
The density of the timber is an expression of the amount of wood substance present.
Therefore, the higher the average density, the less space available to be occupied by
water. This postulate concurs with the findings of Cech (1968) who found that
soaking times required to achieve a certain degree of PEG retention was a factor of
initial moisture content in the wood. The movement of PEG into timber is dependent
on moisture being available in the timber to participate in a counter-current
mechanism and to facilitate transport of the molecule through hydrophilic regions of
the wood structure by the provision of a solvent shell to the PEG molecule.
Timbers of high density, even when saturated with water, may still have a lower
%MC than a partly dry timber of lower density. This was certainly the case with
these species. E. obliqua with an average density of 770kg/m3, showed an initial MC
(IMC) that did not exceed 80% while samples E. regnans had IMC values around
100% (i.e. 50% of the total wood mass was water). With less water available to enact
the counter-current mechanism, and more wood substance to penetrate, it may explain
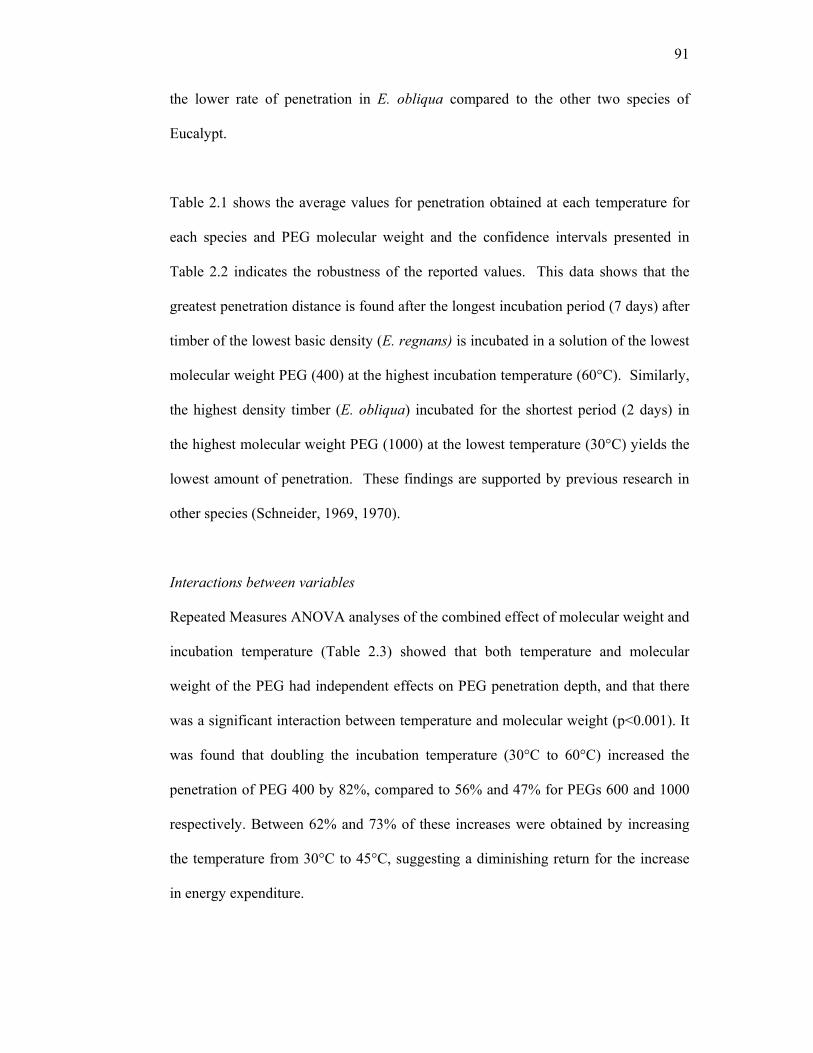
91
the lower rate of penetration in E. obliqua compared to the other two species of
Eucalypt.
Table 2.1 shows the average values for penetration obtained at each temperature for
each species and PEG molecular weight and the confidence intervals presented in
Table 2.2 indicates the robustness of the reported values. This data shows that the
greatest penetration distance is found after the longest incubation period (7 days) after
timber of the lowest basic density (E. regnans) is incubated in a solution of the lowest
molecular weight PEG (400) at the highest incubation temperature (60°C). Similarly,
the highest density timber (E. obliqua) incubated for the shortest period (2 days) in
the highest molecular weight PEG (1000) at the lowest temperature (30°C) yields the
lowest amount of penetration. These findings are supported by previous research in
other species (Schneider, 1969, 1970).
Interactions between variables
Repeated Measures ANOVA analyses of the combined effect of molecular weight and
incubation temperature (Table 2.3) showed that both temperature and molecular
weight of the PEG had independent effects on PEG penetration depth, and that there
was a significant interaction between temperature and molecular weight (p<0.001). It
was found that doubling the incubation temperature (30°C to 60°C) increased the
penetration of PEG 400 by 82%, compared to 56% and 47% for PEGs 600 and 1000
respectively. Between 62% and 73% of these increases were obtained by increasing
the temperature from 30°C to 45°C, suggesting a diminishing return for the increase
in energy expenditure.

92
Penetration Rate
To better compare data sets, the average penetration values were treated to yield the
rate of penetration rather than the total distance penetrated. Penetration rate was
determined by applying a line of best fit to the data with the slope of the line
representing the ratio of penetration distance and incubation time, or penetration rate.
This was performed initially over the entire data range (day 0 to day 7), but a change
in the distance penetrated was noticed after two-days of incubation (Figures 2.10A
and 2.11B). Day 2 of incubation acted as a demarcation point between initial (IRP)
and final (FRP) rates of penetration.
The degree to which the data is explained by the line of best fit is expressed as R2
with all data points fitting the line equating to a value of 1.000. Values for the lines of
best fit for IRP ranged between 0.9643-0.9767 and 0.9189-0.9845 for FRP. Therefore
the final rates show a strong linearity under all conditions. There appeared to be no
consistent or significant deflections in the linear presentation of the data which
suggests that time is not a factor affecting the rate of penetration in Tasmanian Oak
under the conditions described.
2.3.5 Conclusion
This investigation has shown that a 30% (v/v) solution is appropriate for obtaining
total coverage of the radial and tangential surfaces of Tasmanian Oak and also allows
a useful amount of migration into the wood cell matrix in a short time period.
Depth of penetration was shown to be a factor of the amount of time that wood was
steeped in the solution, the temperature of the solution, the molecular weight of PEG
93
chosen and the species of the timber being impregnated. From the results in this
section, there is some suggestion that the basic density of the timber species involved
may be a useful indicator. However, this test has only included three species of
eucalypt, and the basic densities (at 12%MC) for commercially important Eucalypts
range from 625kg/m3 (E. regnans) to 1,120kg/m3 (E. microcarpa). Performing this
test across a broader range of Eucalypt species would be value.
Varying the incubation time, temperature and PEG molecular weight has an impact on
the rate of penetration of PEG in E. delegatensis, E. obliqua and E. regnans. After
two days of incubation, time was not shown to be a factor affecting the rate of PEG
penetration, as the amount of penetration continued to increase linearly with time.
The basic density of the timber appears to be well correlated with the measured rates
of PEG penetration and an explanation has been given to support this association.
This Section has provided a wealth of base-line knowledge on factors, which may
affect the absorption of PEG by wood. However, penetration depth and rate have
been observed in timber while it has been incubated. The counter-current
mechanisms have been discussed (Chapter 1.6) and it seems logical to investigate the
impact on PEG penetration when the strength of the counter currents is reduced. This
is likely to occur in drying timber.
This study was published in Wood & Fiber Science (2004), 36, No.4, 611-619.

94
2.4 PEG penetration in drying timber
2.4.1 Introduction
The rate of PEG penetration in Tasmanian Oak has been investigated and factors
affecting the rates of penetration have been described (Section 2.3). However, these
penetration rates are for timber samples that have been steeped in a PEG solution,
allowing absorption to be driven by a number of external factors such as heat and a
constant counter-current of PEG moving into the timber and water moving out.
It has been shown (Section 2.2 and 2.3) that under the right conditions, PEG can
penetrate throughout the wood matrix, but it has not been established what effect (if
any) drying timber and a finite source of PEG will have on the penetration rate. In
timber steeped in a 30% (v/v) PEG solution, it could be suggested the timber was
exposed to an abundant source of chemical and that the movement of the chemical
into timber was supported by the existence of a counter-current of exiting water and
entering PEG (Loughborough, 1948).
When green wood is placed in an aqueous PEG solution, the PEG molecules will
move from a region of high concentration (the solution) to a region of low
concentration (the wood) in order to establish equilibrium. Similarly, water inside the
wood will move outwards in a counter current to the influx of PEG molecules. If the
sample remains in the liquid for a sufficient time, allowing for loss of water through
evaporation, equilibrium will be attained between the PEG and water concentrations
of the timber and the solution. While factors such as PEG molecular weight,
incubation time and temperature impact on the rate of movement in a given direction,
it is the concentration gradient, which is the most significant factor in determining the

95
direction. The investigation into the effects on PEG penetration in drying timber
investigates the rate of penetration in timber where the source of PEG is very finite
and the counter-current quickly diminishes.
2.4.2 Method
Sample preparation
Fifteen samples of backsawn heartwood E. regnans (25mm x 35mm x 300mm) were
obtained and processed as stated in Section 3.2. The samples were incubated for 96
hours inside a sealed container of 30% (v/v) solution of PEG 400 (Union Carbide
Corp.) in a water bath at 45ºC. The solution concentration was chosen on the
recommendations of Stamm (1956b), Wainright (1981) and the results of PEG
concentration experiments in Section 2.3.
Following incubation, three samples were removed immediately from the charge for
determination of PEG penetration at T=0 and then discarded. The remaining samples
were removed from solution at T=0, padded dry and left to stand in the laboratory in a
charge consisting of 3 laps of five samples (with the addition of 3 untreated boards
(dummy boards) of the same dimension. Each lap was separated with glass rod fillets
and the samples in each lap were in intimate contact (see Figure 3.7). After 30, 60, 90
and 120 days of drying, three boards were removed to measure PEG penetration
before discarding. Each were replaced with untreated dummy boards of the same
dimension so that the original dimension of the charge (3 laps of 5 samples) was
maintained throughout the trial.

96
Cutting sections
When PEG penetration was measured from three samples at 0, 30, 60, 90 and 120
days, the manual slicer was used to remove the sealed end from the sample to a
longitudinal depth of 5mm and then to cut three 2mm thick sections across the
transverse face from each sample. The blade was rinsed and wiped before obtaining
the next sample to avoid cross-contamination. The sections were placed immediately
in an oven at 103ºC±2 oven for 24 hours to allow complete drying and then placed in
a cobalt thiocyanate staining solution (Sections 2.2.2.4.2 and 2.2.2.5).
Measuring penetration
Depth of penetration was measured using digital vernier callipers from the edge of the
sample to the cessation of the blue colour at four evenly spaced points along the four
sides each sample slice. Therefore, for any one sample, incubated for any one length
of time, temperature and molecular weight, 48 data points (4 measurements x 4 sides
x 3 slices) were taken.
2.4.3 Results
0
1
2
3
4
5
6
-10 0 10 20 30 40 50 60 70 80 90 100 110 120
Time (days)
Pen
etra
tion
dist
ance
(mm
)
Figure 2.11 Penetration (mm±SEM) of 30% PEG-400 (v/v) in air-dried E. regnans. Time (days) from –4 to 0 is the incubation period. Each point represents the mean distance penetrated (±SEM) of 48 measurements from 3 samples of E. regnans. Where error bars are not visible, they are inside the symbol. Hatched line is at Time (days) = 0 when samples began to air dry.
97
After 96 hours of incubating E. regnans in 30% (v/v) PEG-400, penetration was
3.14mm±0.36. This agrees with the PEG penetration data found for this species under
the same incubation conditions in previous investigations (Ralph & Edwards, 2004).
The rate of penetration was at a maximum in the first 60 days and maximal
penetration (4.61mm±0.41) was reached by 90 days. The PEG penetration rate
decreased from 0.78mm/day (during incubation) to 0.012mm/day (during drying).
Figure 2.11 also shows that there is no difference between average penetration values
at T = 90d and T = 120d, indicating that after 90 days of drying, PEG penetration into
the timber had all but ceased.
2.4.4 Discussion
The massive decline in absorption of PEG after incubation suggests that previous
penetration was greatly aided by the incubation conditions. The incubation conditions
provided concentration gradients outside and within the wood cell matrix that would
have been adequately supplied with PEG. Furthermore, as the solution was 70%
water, there was little chance that PEG infusion would have ‘out-stripped’ the
outwardly-directed water concentration gradient inside the timber samples.
For PEG inside the wood cell matrix, the concentration gradient would have been
unchanged, but the inward PEG-gradient would have been lessened as the only PEG
available to form the gradient in the drying timber was already in contact with the
wood.
When the samples were removed from the solution and left to dry in harsh conditions
(45-55% R.H.), the rate at which water was being drawn from the timber down its

98
concentration gradient would have accelerated. This not only increased the rate of
movement down the moisture gradient, but did so in an environment where water was
not being replaced by an aqueous solution of PEG. The rapidity of the movement of
water may also have provided a physical barrier that opposed the movement of PEG
into the timber. However, the investigations in this study only permit speculation on
this point.
2.4.5 Conclusion
The net effect of an average post-incubation increase in penetration of 0.74mm is
negligible. However, this lack of post-incubation migration of PEG into the timber
may be considered as a benefit. For the commercial drying of Tasmanian Oak, a
preferred chemical treatment may be one that is present in timber during seasoning
and can be easily removed before the timber is sold. This may occur by planing the
timber or even through a managed re-wetting of the timber surface
Consequently, an ideal situation may be the use of a chemical whose rate of
penetration can be predicted before the timber is immersed in a solution and where the
penetration is essentially limited to the incubation period. This would allow the
preparation of a leaching process for a calculated depth of PEG penetration in the case
of undressed timber or planing to a calculated depth in the case of dressed timber. In
both cases, using PEG to assist in the drying of Tasmanian Oak, then preparing a
chemical-free end product is feasible. Sections 2.2-2.4 have investigated the
movement of PEG into timber and factors that may affect its movement. The next
section uses histological methods to help determine the destination of infused PEG in
the wood cell matrix.

99
‘PEG penetration in drying timber’ was published in Wood & Fiber Science (2005),
37, No.3, 381-385.
2.5 Histological inspection of PEG in Tasmanian Oak
2.5.1 Introduction
The previous study showed that PEG is readily taken up by the wood substance of
Tasmanian Oak and that given sufficient time and PEG concentration, PEG will
penetrate the entire wood substance (see Figure 2.4A). A histological investigation
seeks to gain an insight into any preferred sites of PEG deposition or, alternatively, if
any sites in the wood structure do not take up the chemical.
2.5.2 Method
Samples of milled E. regnans (10mmx3mmx3mm) were prepared such that sample
ends (3mmx3mm) were presented in transverse, radial and tangential orientation.
Samples were incubated in 30% (v/v) solutions of PEG 600 (Sigma) for 3 days and
untreated samples, acting as a negative control, in distilled water. Sections were cut
at 25µm on a base-sledge microtome (Leitz 1400) with blade angles set as per Ilic
(1985) and placed on a glass slide with a fine brush. At no time did water come into
contact with the sample during cutting.
The stain was prepared using Ammonium thiocyanate (Unilab) and Cobalt (II) Nitrate
hexahydrate (AnalaR, BDH) as described previously (Section 2.2.2.4.2). Slides were
stained for 24 hours in coplin jars before being removed and rinsed twice in fresh
xylene (1 minute per rinse; negative controls were rinsed separately in xylene). The
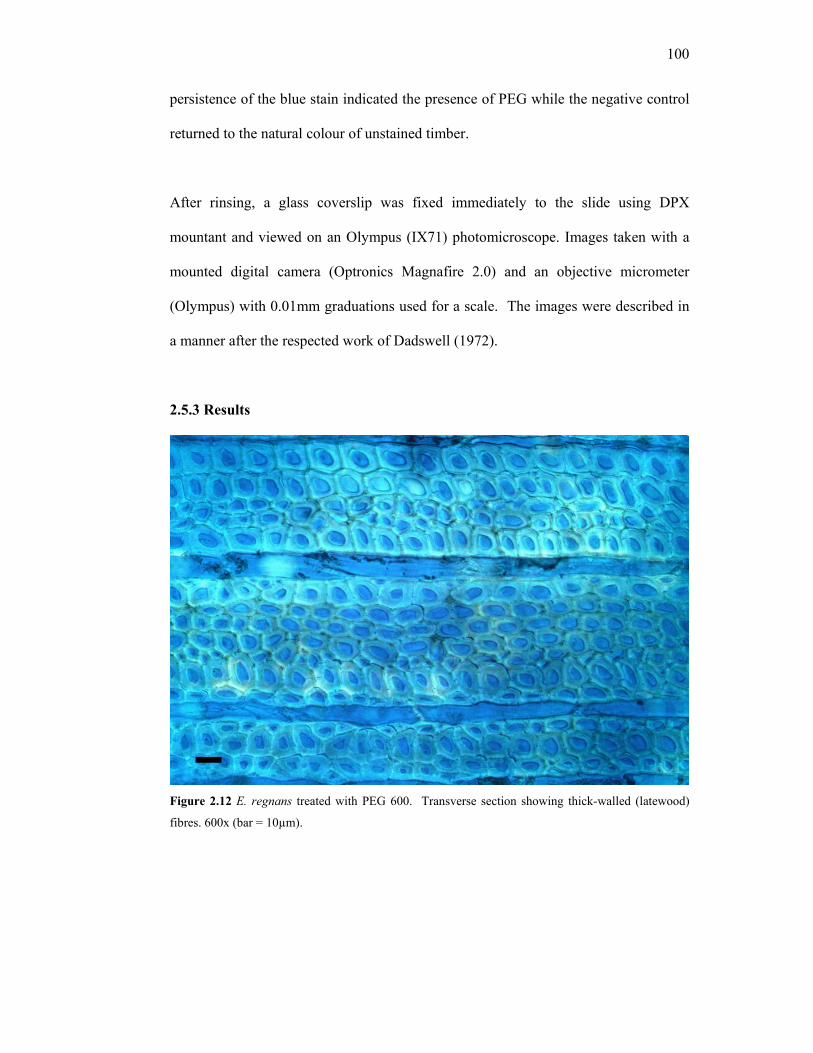
100
persistence of the blue stain indicated the presence of PEG while the negative control
returned to the natural colour of unstained timber.
After rinsing, a glass coverslip was fixed immediately to the slide using DPX
mountant and viewed on an Olympus (IX71) photomicroscope. Images taken with a
mounted digital camera (Optronics Magnafire 2.0) and an objective micrometer
(Olympus) with 0.01mm graduations used for a scale. The images were described in
a manner after the respected work of Dadswell (1972).
2.5.3 Results
Figure 2.12 E. regnans treated with PEG 600. Transverse section showing thick-walled (latewood)
fibres. 600x (bar = 10µm).
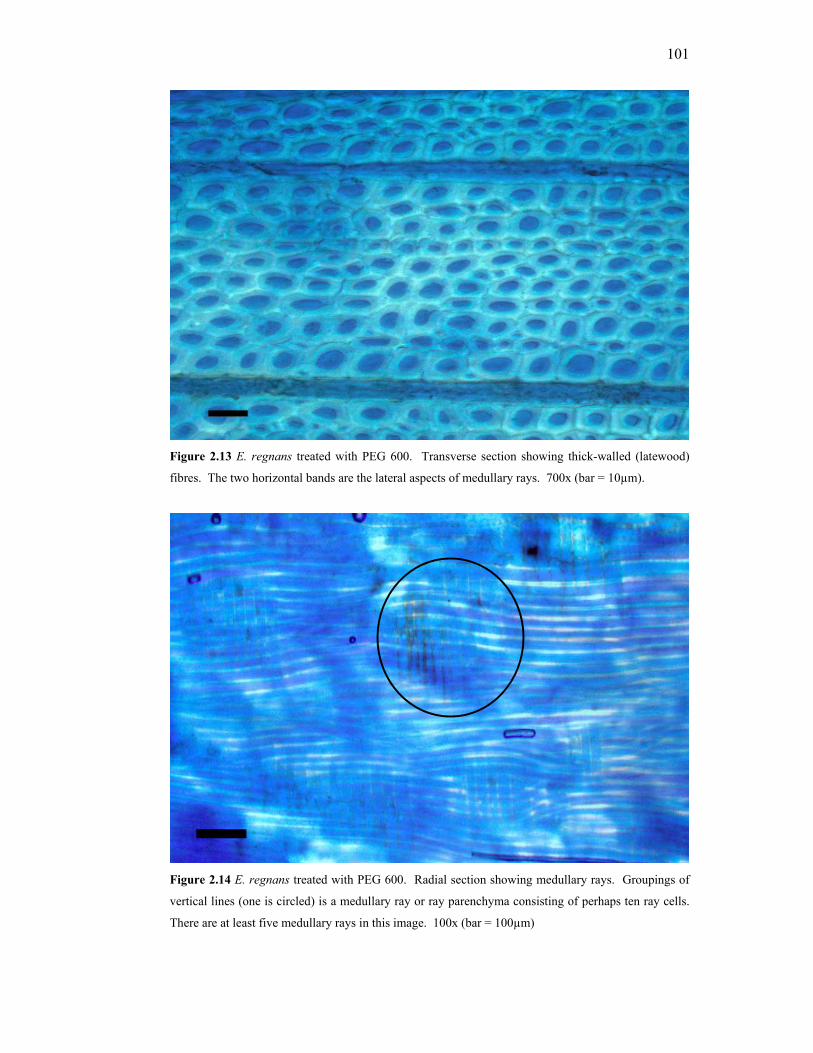
101
Figure 2.13 E. regnans treated with PEG 600. Transverse section showing thick-walled (latewood)
fibres. The two horizontal bands are the lateral aspects of medullary rays. 700x (bar = 10µm).
Figure 2.14 E. regnans treated with PEG 600. Radial section showing medullary rays. Groupings of
vertical lines (one is circled) is a medullary ray or ray parenchyma consisting of perhaps ten ray cells.
There are at least five medullary rays in this image. 100x (bar = 100µm)

102
Figure 2.15 E. regnans treated with PEG 600. Radial section of a medullary ray. In the radial aspect,
the medullary rays appear perpendicular to the wood fibres. 400x (bar = 50µm)
Figure 2.16 E. regnans treated with PEG 600. Tangential section showing uniseriate rays (one is
circled). Each band of ray cells forms a medullary ray. 400x (bar = 50µm).
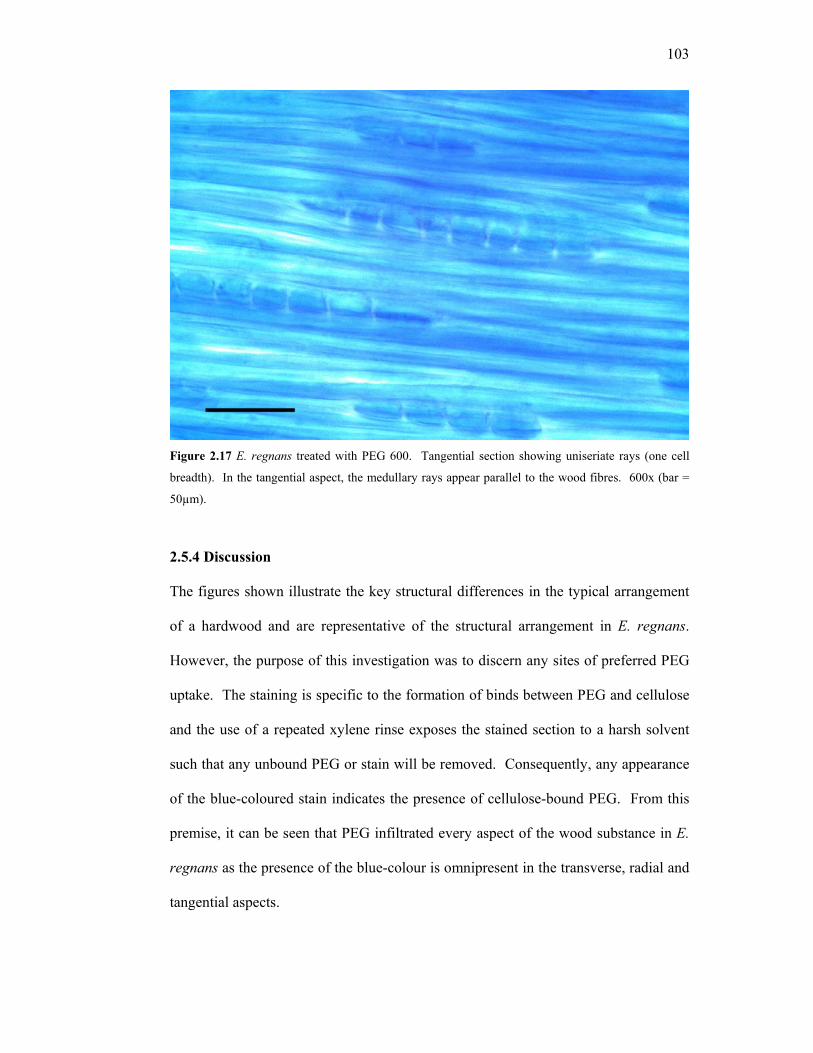
103
Figure 2.17 E. regnans treated with PEG 600. Tangential section showing uniseriate rays (one cell
breadth). In the tangential aspect, the medullary rays appear parallel to the wood fibres. 600x (bar =
50µm).
2.5.4 Discussion
The figures shown illustrate the key structural differences in the typical arrangement
of a hardwood and are representative of the structural arrangement in E. regnans.
However, the purpose of this investigation was to discern any sites of preferred PEG
uptake. The staining is specific to the formation of binds between PEG and cellulose
and the use of a repeated xylene rinse exposes the stained section to a harsh solvent
such that any unbound PEG or stain will be removed. Consequently, any appearance
of the blue-coloured stain indicates the presence of cellulose-bound PEG. From this
premise, it can be seen that PEG infiltrated every aspect of the wood substance in E.
regnans as the presence of the blue-colour is omnipresent in the transverse, radial and
tangential aspects.

104
In Figures 2.12 and 2.13, the cell lumen appears consistently dark relative to the cell
wall, suggesting that there is little impedance to PEG infiltrating the cell. Such
placement of the chemical, and its known capacity to bulk the cell wall suggests that
the treatment of timber to PEG prior to drying could have a positive effect on the
ability of exposed cells to resist shrinking during drying. Resisting this shrinkage,
even in the outer layers of drying timber, could ameliorate the formation of tensile
stresses in the case (see Figure 1.13A) and hence reduce the amount of compressive
stress in the core.
By cutting sections in the radial aspect (Figures 2.14 and 2.15) the lumen of the ray
cells are exposed along their longitudinal aspect. The images of radially-orientated
sections indicate that PEG infiltrated the medullary rays and each ray cell. At 18%,
medullary rays comprise three times the total volume in hardwoods compared to
softwoods (Porter & de Hoedt, 1987) and this major structural difference has been
indicated as a possible cause of some of the refractory nature of drying hardwood
timbers, particularly eucalypts. The complete infiltration of the ray cells with PEG
suggests that these structures will be supported during the course of drying.
Furthermore, shrinkage may also be reduced.
This could be most significant as ray cells have their longitudinal aspect in the radial
orientation and therefore shrinkage is likely to be more pronounced in the tangential
plane. Given the large number of ray cells in hardwood, it is expected that the amount
of tangential shrinkage is greater than the amount of radial shrinkage and this is
indeed the case across most species of timber. The greater number of ray cells in
hardwoods sees this outcome amplified causing the gross departure from the sawn

105
dimension, which occurs during the drying of eucalypts. However, this is, at present,
a theory and does not offer a conclusive explanation of differential shrinkage.
This undesirable state is exacerbated further when timber is milled in a backsawn
fashion as the broadest face of the board is in the tangential aspect (see Figure 1.11).
A backsawn board measuring 100mm x 25mm x 2400mm will have a surface area
which is 73.8% tangential -18.5% radial- and 7.7% transverse . Despite the
disadvantage of a proportionally large tangential surface, the total infiltration of the
wood structure when viewed from a tangential orientation (Figures 2.16 and 2.17)
suggest that any benefit that arises from a PEG treatment prior to drying will be
demonstrated on the tangential aspects of the board.
2.5.5 Conclusion
The results shown indicate that to the levels investigated, PEG is wholly absorbed by
E. regnans. Owing to similarity in species and the absorption data discussed earlier, it
is likely that the histological profile of PEG uptake shown in E. regnans would be
representative of that in E. delegatensis and E. obliqua. However, presumptions are a
fickle business and confirmation through further experimentation would be insightful.
These results have hinted to an expectation that an improved drying outcome is
possible with the incorporation of a PEG pre-treatment into the drying regime. The
results of this preliminary study auger well for positive results in Tasmanian Oak and
perhaps other species currently regarded as unseasonable may become so with the use
of a chemical intervention such as PEG. These are definitely avenues of further study
to consider in the future.

106
The current research also invites investigation beyond the microstructural level to the
subcellular and the use of radiolabelled PEG and techniques such as radio-ligand
binding and autoradiography to locate sites of PEG deposition within the cell wall.
The multiple layers of the cell wall, and their differing structures, have been discussed
(see Figure 1.3). Mackay (1972) showed that in Tasmanian E. obliqua, surface
checks originate along the inside face of the vessel element, along the outer surface of
the vessel or within fibres intimately associated with a vessel. If the use of a PEG
treatment prior to drying was concomitant with a reduction in surface check
formation, it would be a positive outcome from a commercial point of view and may
explain a reduction in the conditions described by Mackay (1972). This is a good
basis for further research at another time.
2.6 General Conclusion
This first experimental chapter was developed on a theme of baseline investigation.
The questions addressed were of a fundamental nature and were intended to provide a
platform from which to develop methods for assessing the effects of PEG treatment of
Tasmanian Oak prior to drying on the final seasoned product.
A suitable staining method was determined for localising PEG in the wood-cell
structure and this was used at macro- and micro- levels which allowed quantification
and rate determination of PEG penetration in soaking Tasmanian Oak, the
determination of negligible PEG migration in Tasmanian Oak during drying and the
histological confirmation of ready uptake of PEG with the wood cell structure.

107
The suite of experimental procedures in this chapter have provided baseline data
regarding the nature of absorption of PEG into the Tasmanian Oak species of eucalypt
and the sites of deposition within the wood cell matrix. With this knowledge, pure
and applied research can be investigated with some confidence.
This will take the form, in the next Chapter, of investigating moisture loss in treated
and untreated timber, differences in dimensional stability, shrinkage and frequency
and severity of drying defects. These results will be underpinned by the findings in
the previous section.

108
Chapter 3 The Physical Effects of PEG treatment on Moisture Content and
Dimensional Stability of Tasmanian Oak during drying.
3.1 General Introduction
The previous chapter examined thoroughly the movement of PEG into Tasmanian
Oak and found that the chemical was absorbed readily into the wood structure. With
these findings in mind, this investigation will now consider what effects a PEG
treatment has on the rate of moisture loss from Tasmanian Oak and effects on the
timber dimensions in a commercial, timber-drying context.
As described in Section 1.4, rapid moisture loss and excessive shrinkage can cause
irreversible damage to drying timber. PEG has been demonstrated to reduce drying
defects in several northern hemispheric (refer Section 1.5). However, after Mackay
(1972) there has been little practical investigation into PEG-like treatments for
Tasmanian Oak, or for using any other chemical after the work of Schaffner (1981).
Increases in dimensional stability can have positive benefits, from reducing the
possibility of surface check and internal check formation to reducing overall
shrinkage in timber. A reduction in total shrinkage can also decrease the amount of
lost timber volume. Decreased drying defect and increased volume equates to an
increased overall yield.
The first investigation in this chapter will examine the effects of soaking Tasmanian
Oak in a PEG solution on dimensional stability during air-drying.

109
3.2 Differences in dimensional change in Tasmanian Oak due to pre-treatment
with PEG.
3.2.1 Introduction
Theoretical aspects of shrinkage in wood are presented in detail elsewhere (Section
1.4). In brief, shrinkage can occur in three dimensions: longitudinally, radially and
tangentially. Longitudinal shrinkage is negligible and not commonly regarded as
important. Tangential shrinkage can be twice radial shrinkage and such difference
gives rise to differential drying stresses , which may result in various drying defects
and departures from the original dimensions of sawn timber. Treatment of wood with
PEG has been shown to improve dimensional stability of timber by binding to
cellulose and bulking the cell wall. This investigation seeks to observe the effects of a
PEG treatment on a species of Tasmanian Oak. E. regnans has the lowest species
density at 12% MC (AS 2082-2000) of the commercially important Eucalypt species
and also has a high amount of tangential shrinkage (14.2%). Arresting this shrinkage
will be of significant benefit for better drying this refractory species of timber.
3.2.2 Method for assessing dimensional change
Fifteen samples of backsawn, heartwood E. delegatensis (25mm x 35mm x 300mm)
were obtained and prepared as described in Section 3.3.2.1. The samples were
visually assessed for any defect prior to being end sealed with araldite and placed in a
solution of 30% (v/v) PEG-400 (Union Carbide) and allowed to soak for 168 hours in
a sealed container at room temperature. Treated samples were removed from their
respective solutions after 168 hours and, with fifteen end-sealed, untreated samples of

110
E. delegatensis as controls, were left to stand in the air-conditioned laboratory that
was maintained at a relative humidity in the order of 45-55% R.H.
Samples were assembled into a charge consisting of three laps each with 5 samples
and individual samples were numbered as shown below.
1 2 3 4 5
6 7 8 9 10
11 12 13 14 15
Figure 3.1 Numbering the positions of individual samples in control and PEG-treated charges of E. delegatensis. The charges were prepared as for air-drying: individual boards were abutted across the lap with fillets places between the laps to allow for air circulation.
The position of each sample in the charge can affect the manner in which timber dries
when airflow in the surrounding environment is uncontrolled (such as air-drying).
Samples at positions 1 and 5 have two surfaces directly exposed to the environment,
whereas a sample at position 8 is most protected from surrounding air humidity.
These are the conditions under which air-dried timber is commonly seasoned.
Whole test samples were weighed prior to chemical treatment and test and control
samples weighed on an electronic balance which was accurate to 1 decimal place at
the following times during drying: T(hours) 0, 18, 36, 54, 168, 264, 384, 528, 720, 960,
1,200. The change in mass of the samples was interpreted as a change in moisture
content of the timber.
Dimensions were measured with digital vernier callipers with pincer extensions.
Measuring points were marked on the tangential and radial surfaces at the middle of

111
each sample. Using these marks ensured that measurements were always taken at the
same point. After recording the weight and dimensions during drying, each whole
sample was repositioned in the same charge location.
After 1,200 hours of drying, samples were inspected for drying defect and any defects
in controlled and treated samples were noted. All samples were then sliced
transversely on a bandsaw into thirds (Figure 3.2) and the transverse ends traced
accurately onto paper and scanned using an Epson Expression 1680 Scanner (St
Catherines, Ontario) using Desk ScanII and analysed using Analytical Image Station
Software.
DISCARD DISCARD
Samples were steam reconditioned in a Mahild reconditioning chamber (1m3
capacity) and the ends of the sample sections retraced and scanned. Deflection
measurements were made manually on the sample tracings pre and post
reconditioning with a protractor and deviations from 90°C for the four corner angles
on the transverse surface were noted.
Figure 3.2 Obtaining middle sections for reconditioning and assessment of deviation from original shape. Each end of the middle section was marked arbitrarily so ends could be matched up after reconditioning and compared with pre-reconditioning traces.
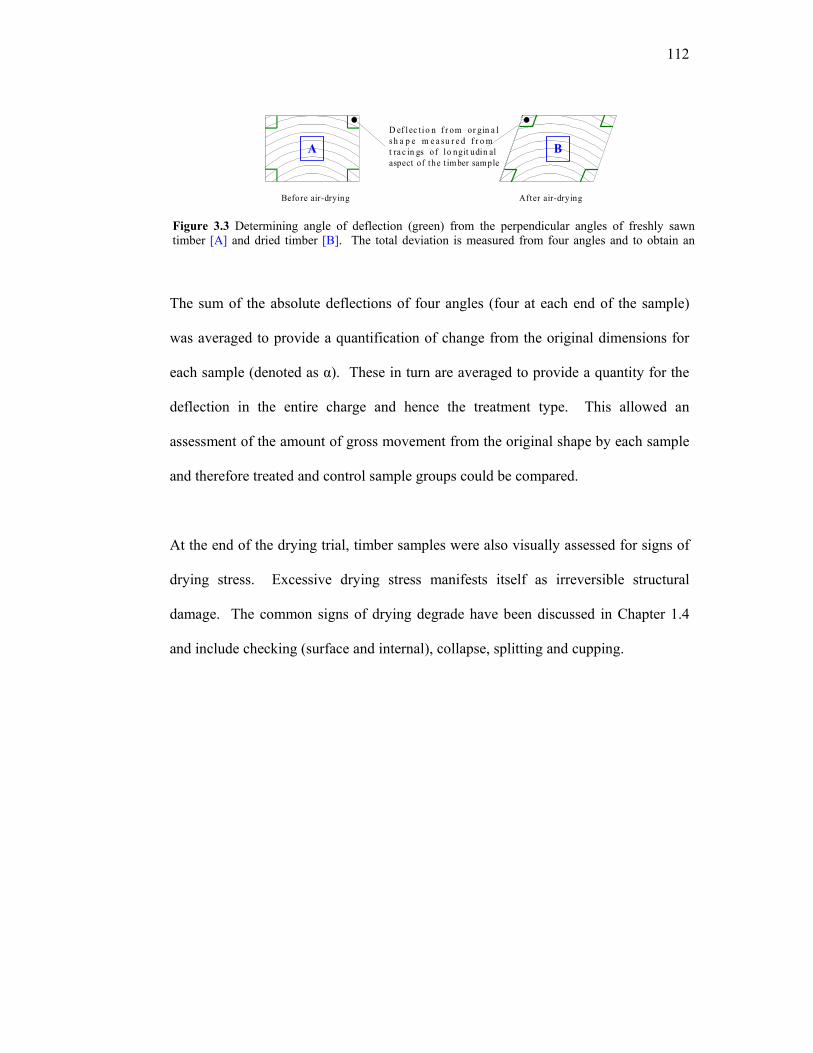
112
BAD ef l ec t i o n f r om or gin a lsh a p e m e a su r e d f r o mt ra c in gs of lo ngit udin alaspect of the t imber sample
Before air-drying After air-drying
The sum of the absolute deflections of four angles (four at each end of the sample)
was averaged to provide a quantification of change from the original dimensions for
each sample (denoted as α). These in turn are averaged to provide a quantity for the
deflection in the entire charge and hence the treatment type. This allowed an
assessment of the amount of gross movement from the original shape by each sample
and therefore treated and control sample groups could be compared.
At the end of the drying trial, timber samples were also visually assessed for signs of
drying stress. Excessive drying stress manifests itself as irreversible structural
damage. The common signs of drying degrade have been discussed in Chapter 1.4
and include checking (surface and internal), collapse, splitting and cupping.
Figure 3.3 Determining angle of deflection (green) from the perpendicular angles of freshly sawn timber [A] and dried timber [B]. The total deviation is measured from four angles and to obtain an

113
3.2.3 Results
3.2.3.1 Shrinkage
Figure 3.4 shows that radial shrinkage is greater in the control samples than in the PEG-
treated sample at all points of data collection during the trial period (Time, (T) =1200h). At T
= 1200h, % radial shrinkage (mm) was 11.21 and 10.28 for control and PEG-treated samples
respectively.
A plot of the log of % radial shrinkage against time resulted in linearity of the data
where slope was equal to the rate of shrinkage. Rate was not significantly different
(P>0.05) over the entire period.
Figure 3.4 Cumulative % radial shrinkage in E. delegatensis for untreated control samples (■) or samples treated with 30% PEG-400 (v/v; ■). Each point represents the mean % radial shrinkage (±SEM) of 15 sample means (each sample being the mean of three measurements) of E. delegatensis. * indicates significantly different (P<0.05) from control (2 sample t-test).
-2
0
2
4
6
8
10
12
14
16
0 200 400 600 800 1000 1200
Time (hours)
% s
hrin
kage
(mm
)
**

114
Figure 3.5 shows that tangential shrinkage is greater in the control samples than in the
PEG-treated sample at all points of data collection during the trial period (1200 hr).
At T= 1200h, % tangential shrinkage (mm) was 15.48 and 12.65 for control and PEG-
treated samples respectively.
A plot of the log of % tangential shrinkage against time resulted in linearity of the
data where slope was equal to the rate of shrinkage. Rate was not significantly
different (P>0.05) over the entire period.
Figure 3.5 Cumulative % tangential shrinkage in E. delegatensis for untreated control samples (■) or samples treated with 30% PEG-400 (v/v; ■). Each point represents the mean % tangential shrinkage (±SEM) of 15 sample means (each sample being the mean of three measurements) of E. delegatensis. * indicates significantly different from control (2 sample t-test).
0
2
4
6
8
10
12
14
16
18
0 200 400 600 800 1000 1200
Time (hours)
% s
hrin
kage
**
** * * *

115
3.2.3.2 Mass lost (as moisture)
Figure 3.6 shows that total % mass lost during drying is greater in the control samples
than in the PEG-treated sample at all points of data collection during the trial period
(1200 hours). At T= 1200h, % mass lost was 55.6 and 46.5 for control and PEG-
treated samples respectively. A plot of the log of % mass lost against time resulted in
linearity of the data where slope was equal to the rate of shrinkage. Rate was not
significantly different (P>0.05) over the entire period.
3.2.3.3 Dimensional change
Table 3.1 Mean deflection° (α) ± SEM for PEG treated and untreated controls before and after reconditioning. Samples were significantly different (P<0.005 and better) within treatments but not between treatments.
Sample Pre-reconditioning Post-reconditioning Control 15.84±1.57 9.24±0.70
PEG-400 15.41±1.86 7.41±1.71
Figure 3.6 Cumulative % mass lost in E. delegatensis for untreated control samples (■) and samples treated with 30% PEG-400 (v/v; ■). Each point represents the mean % mass lost (±SEM) of 15 samples of E. delegatensis. * indicates significantly different from control (2 sample t-test).
-10
0
10
20
30
40
50
60
70
0 200 400 600 800 1000 1200
Time (hours)
% M
ass
lost
* *
** *
** *

116
There was a decrease in the amount of deflection in the timber after steam
reconditioning in both control and PEG-treated samples. PEG-treated timber was
more responsive to the cell-wall plasticising effects of steam reconditioning which is
employed to recover original timber dimensions after drying. However, 2-sample T-
test showed that although the change in α was significant within a given treatment
(pre- and post- conditioning in control (P<0.0005) and PEG-treated samples
(P<0.005)), there was no significant difference between the treatments either pre- or
post reconditioning.
3.2.3.4 Visual assessment of the timber
Table 3.2 Visual assessment of control and PEG-treated E. delegatensis. (C=collapse; Cu=cupping; IC=internal check; K=Knot; ND=No defect; S=split; SC=surface check; SD=saw damage). No defect shaded in grey.
Position Number
Control PEG
1 ND ND 2 IC, C ND 3 Cu C 4 C ND 5 ND C 6 C, K ND 7 S ND 8 C, K IC, C 9 C ND 10 ND C, SC 11 IC, C ND 12 ND ND 13 C ND 14 IC, SC C 15 ND C
Visual assessment showed that control samples were more susceptible to drying
defect than PEG-treated samples. Cells in Table 3.2, which are shaded grey, indicate
a sample board clear of defect. One third of control samples had no defect while
nearly twice the number (60%) of PEG-treated samples were without dry defect.
Cellular collapse was the most common drying defect.
117
3.2.4 Discussion
In line with accepted observations, tangential shrinkage was greater than radial
shrinkage for reasons explained in 1.4. However, the overall magnitude of the
dimensional loss is higher than would be seen in timber dried under favourable
conditions due to the amount and severity of collapse that occurred. This is
illustrative of the harsh drying conditions employed to exact a more rapid result for
this experiment. These conditions exacerbated the susceptibility that eucalypts have
to collapse
In both orientations (Fig.3.4 and 3.5), the PEG-treated samples of E. delegatensis
showed less shrinkage than the untreated control. Perhaps even more encouraging
was the greater reduction in tangential shrinkage of treated timber compared to radial
shrinkage and indicates a greater degree of dimensional stability.
Mean deflection angles (Table 3.1) were recorded to investigate a potential negative
effect of applying a chemical with dimension stabilising characteristics. During steam
reconditioning, it was thought that PEG-treated timber might resist the movement that
occurs during plasticising the timber and thus yielding a poorer end product.
However, the results indicate that in this sample, PEG treated post-reconditioning
deflection values that were not significantly different (t-test, P<0.05) to the control.
Despite this similarity, visual stress grading demonstrated that the PEG-treated timber
was in better condition at the end of drying with very few instances of surface or
internal checking. The method of obtaining a section to assess deviation from original
shape (Figure 3.2) also allowed for an assessment of internal checking away from the
end of each board.

118
This preliminary data suggests that PEG treatment could improve the dimensional
stability of eucalypt timber during drying without having an inhibitory effect on
dimensional recovery during reconditioning. These findings supported the predictions
of Ellwood et al. (1960, p.9) “…in addition to the possibility of influencing the
development of collapse during drying, it may be possible to completely modify the
normal drying stress pattern and thus leading to substantial reduction of ordinary
drying defects.” It is the altering of the normal drying stress pattern, as a function of
moisture content loss, from a timber charge and within individual samples, which was
investigated in the following experiments.
3.3 The effect of PEG treatment on moisture content loss in Tasmanian Oak
3.3.1 Introduction
With the demonstrated ability of PEG to reduce water activity, and dynamically bind
a solvent shell of significant size, a timber with a chemically treated case is expected
to have an altered pattern of moisture loss.
3.3.2 General method for drying trials
The following method was standard for all drying trials and is described below. Any
individual variations will be noted as such.
3.3.2.1 Obtaining samples
Samples were heartwood E. regnans obtained at a green dimension of
25mmx35mmx300mm from a commercial sawmill from green logs that had been kept
under sprinklers until required. The timber was cut in the backsawn orientation (i.e.
with the wide face of the board showing the tangential face). Each piece of milled

119
timber was immediately wrapped in three layers of clear plastic wrap, housed in a box
in shade and delivered promptly to the laboratory. Samples were either used
immediately or stored at 4°C until required. No sample was stored for any longer
than four weeks.
3.3.2.2 Sample preparation
When samples were prepared for steeping in solutions of PEG and other chemicals,
samples were unwrapped and each sample end was docked at a longitudinal depth of
20mm from each end using a 100mm bandsaw (Ryobi HBS 100). The sawn end was
immediately glued with freshly prepared 5-minute Araldite and allowed to stand until
the araldite was set. The broad face of each sample was individually numbered at one
end and all required samples were taken from the other end. Sample number
corresponded to a position in the charge that did not alter for the sample throughout
the drying time.
3.3.2.3 Chemical treatment
Glass rods (5mm diameter) were used to separate laps in the charge to allow equal
exposure of the timber to the chemical (either PEG 400 or Sodium dodecyl sulphate).
Chemical solutions were made up with deionised water. Samples were placed in
prepared solutions as a single charge per solution consisting of three laps of five
samples. The containers were sealed and left at room temperature until required.
After incubation, samples were removed and placed on Tasmanian Oak bearers
(25mmx25mmx200mm) with the glass rods remaining in situ. At this point, 15
untreated control samples were prepared as described above and a charge consisting
of three laps of five samples was assembled. The charges were allowed to stand in the

120
air-conditioned laboratory that was maintained at a relative humidity in the order of
45-55% with no measurable airflow. Environmental conditions were not constantly
monitored as the focus was on observing differences between treated and untreated
samples exposed to the same environmental conditions. An air-conditioned
laboratory was ideal as the low relative humidity established a steep moisture gradient
and allowed for rapid drying.
3.3.2.4 Obtaining sample slices
When slices were required from the samples in a charge, the charge was dismantled,
slices taken and the charge immediately reassembled with all samples in their original
position. Each sample had the sealed transverse face of the non-numbered end
removed with a bandsaw to a longitudinal depth of 15mm. The sample slice was then
cut at a thickness of 2mm and immediately wrapped in clear plastic wrap. The cut
sample ends were immediately resealed with araldite and returned to their position in
the charge. Processing of sample slices began immediately.
3.3.2.5 Obtaining slice sections and moisture content determination
As each slice was unwrapped, any sawdust was removed with a brush and then
dissected according to the relevant cutting pattern with a mallet and chisel. The
individual sections of each slice were weighed on an electronic balance that was
accurate to four decimal places. After weighing, each section was carefully placed on
a drying plate. When a charge of slices had been processed in this manner, the drying
plate was placed in an oven at 103°C±2 for 24 hours. The oven temperature was set
by thermostat and confirmed with a thermometer. The drying plate was then removed
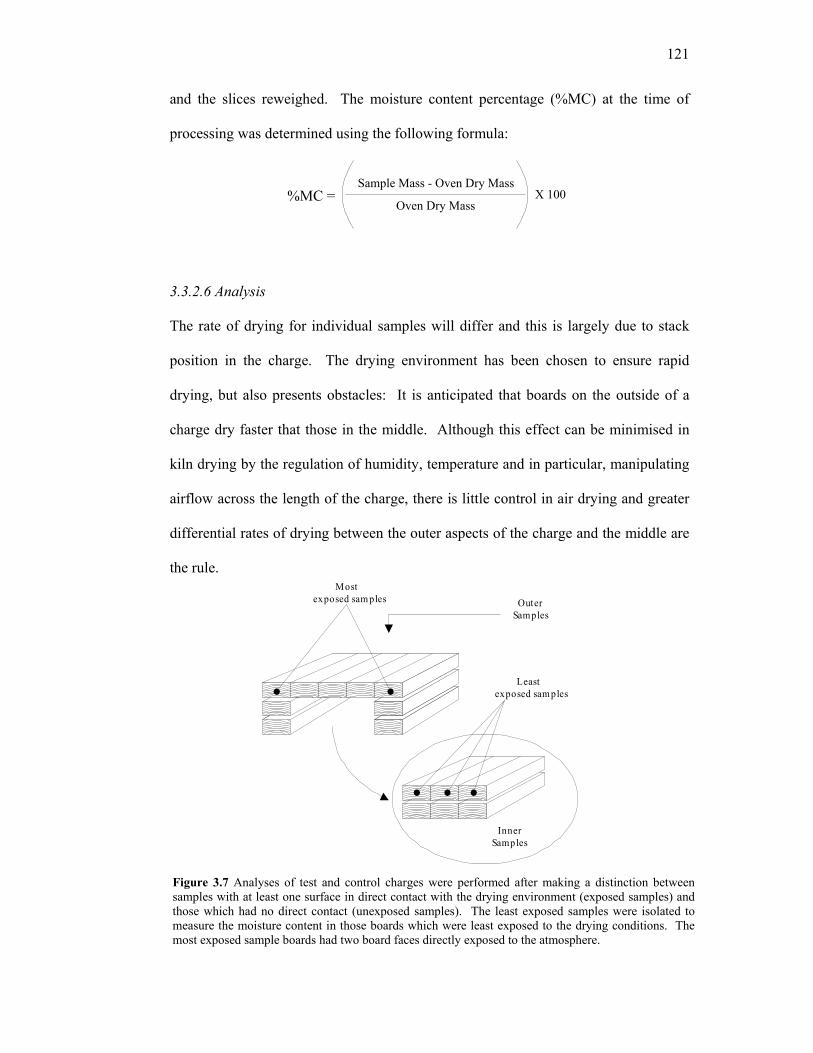
121
and the slices reweighed. The moisture content percentage (%MC) at the time of
processing was determined using the following formula:
%MC = X 100Sample Mass - Oven Dry Mass
Oven Dry Mass
3.3.2.6 Analysis
The rate of drying for individual samples will differ and this is largely due to stack
position in the charge. The drying environment has been chosen to ensure rapid
drying, but also presents obstacles: It is anticipated that boards on the outside of a
charge dry faster that those in the middle. Although this effect can be minimised in
kiln drying by the regulation of humidity, temperature and in particular, manipulating
airflow across the length of the charge, there is little control in air drying and greater
differential rates of drying between the outer aspects of the charge and the middle are
the rule.
Figure 3.7 Analyses of test and control charges were performed after making a distinction between samples with at least one surface in direct contact with the drying environment (exposed samples) and those which had no direct contact (unexposed samples). The least exposed samples were isolated to measure the moisture content in those boards which were least exposed to the drying conditions. The most exposed sample boards had two board faces directly exposed to the atmosphere.
InnerSamples
OuterSamples
Leastexposed sam ples
Mostexposed sam ples
122
Owing to the very harsh drying conditions, any effect that PEG may have on altering
loss of moisture may be ‘swamped’ as it is probable that the moisture gradient
between timber and atmosphere exceeds the bond strength between PEG and water.
Consequently, for this experiment, the MC data was assessed with the following
division in place: samples that had at least one face exposed to directly to the
atmosphere and not including the inferior surface of the board, were considered as
‘exposed’. Samples which did not have a surface directly exposed to the surface were
regarded as ‘unexposed’ (Figure 3.7). In a stack organised into three laps of five
samples, there are nine exposed and six unexposed samples.
3.3.3 Method for timber treated with PEG and SDS
This experiment examined PEG as a potential retardant of moisture loss from timber.
Sodium dodecyl sulphate (SDS) was also used as a comparison with PEG’s known
dual action on timber of regulating moisture loss and dimensional stability (PEG has
been described in detail in Chapter 1.6). Being hydrophobic, SDS can retard the loss
of moisture, but is unable to bind to cellulose and thus cannot impart any dimensional
stability to the timber.
SDS (CH3-(CH2)11-O-SO3-Na+) is an anionic surfactant which, owing to a long
aliphatic chain, is significantly hydrophobic. SDS has a solubility of 10g/100g water
owing to the ionised terminal group (Figure 3.8). Although SDS has a low affinity for
water, this compound was chosen because it might also retard the loss of water from
wood by establishing a predominantly hydrophobic barrier at the wood/air interface.

123
SO
OONa
Fifteen samples of backsawn, heartwood E. regnans (25mm x 35mm x 300mm) were
obtained and prepared as described in Section 3.3.2.1. Each board was marked along
the top and left hand side to orientate sample slices when cut. The sample boards
were then end-sealed with araldite and placed in a solution of 30% (v/v) PEG-400
(Union Carbide) or saturated SDS (Sigma) and allowed to soak for 96 hours in a
sealed container at room temperature. Treated samples were removed from their
respective solutions after 96 hours and, in addition to fifteen end-sealed, untreated
samples of E. regnans as controls, were left to stand in the air-conditioned laboratory
that was maintained at a relative humidity in the order of 45-55% R.H.
Test samples were weighed prior to chemical treatment and test and control samples
at the following times during drying: T(hours) 0, 18, 36, 54, 168, 264, 384, 528, 720,
1200. Whole samples were weighed and then repositioned in the same charge
location.
Sample slices were obtained and handled as per Section 3.2.5. The cutting pattern
removed the case of the sample including all of the chemically treated wood and the
remaining core was sliced radially into five equal sections (Figure 3.9) and weighed in
accordance with Section 3.2.5
Figure 3.8 Chemical structure of sodium dodecyl sulphate.

124
Method of Analysis
MC values were obtained as described above. Mean outer and inner values were
calculated using the mean MC value for each sample, giving rise to a group mean and
Standard Error of that mean. %MC was plotted against time giving rise to drying
curves. Regression analysis was performed using MiniTab analysis software to
investigate points of significant difference in %MC between treatments.
Differences in moisture loss within the core was measured using the cutting process
outlined in Figure 3.9 and this data has been included as Appendix 1 (on CD).
Selected data sets from this attached data are included in the results section.
Figure 3.9 Cutting pattern to obtain a radial cross section of the core of treated and untreated samples. Each section was cut, weighed, dried, re-weighed and compared to obtain a moisture content profile for each sample in the charge. Each slice from the cutting pattern was numbered from left to right as the slice was cut.
DISCARD
DISCARD
DISCARD
1 2 3 4 5
DISCARD

125
3.3.4 Results
Outer Samples:
The drying pattern in the control and SDS-treated samples followed a sigmoidal path,
whereas in the PEG-treated charge, the drying pattern had a greater degree of
linearity. Although by T= 1200h, the moisture content in each sample was
comparable, the chemically treated samples exhibited a more controlled loss of
moisture particularly from T = 168h to T= 720h.
0
20
40
60
80
100
120
0 200 400 600 800 1000 1200Time (hours)
% M
C
Figure 3.10 Average Moisture Content (% MC) from outer-stacked untreated E. regnans controls (■) or treated with PEG 400 (30% v/v, ■) or saturated SDS solution (■). Each point represents the mean % MC loss (±SEM) of 15 sample means (a mean of three results for each of 15 samples) of E. regnans.

126
0
20
40
60
80
100
120
0 200 400 600 800 1000 1200Time (hours)
% M
C
Inner Samples:
The drying pattern in the control and SDS-treated samples followed a sigmoidal path,
whereas in the PEG-treated charge, the drying pattern had a greater degree of
linearity. Although by T = 1,200h, the moisture content in each sample was
comparable, the chemically treated samples exhibited a more controlled loss of
moisture. The inner-stacked samples (Figure 3.11) demonstrated a slower rate of
drying compared to the outer-stacked samples (Figure 3.10), owing to the protection
provided by samples on the outer stack.
Figure 3.11 Average Moisture Content (% MC) from inner-stacked untreated E. regnans controls (■) or treated with PEG 400 (30% v/v, ■) or saturated SDS solution (■). Each point represents the mean % MC loss (±SEM) of 15 sample means (a mean of three results for each of 15 samples) of E. regnans.

127
Core moisture content profiles
Core MC was uniform in all samples and treatment regimes at the beginning of the
trial. Treated samples were compared before soaking in either SDS or PEG with the
control samples at T = 0h.
% M
OIS
TUR
E C
ON
TEN
T
0
20
40
60
80
100
120
1 2 3 4 50
20
40
60
80
100
120
1 2 3 4 50
20
40
60
80
100
120
1 2 3 4 5
0
20
40
60
80
100
120
1 2 3 4 50
20
40
60
80
100
120
1 2 3 4 5
A B C
E F
0
20
40
60
80
100
120
1 2 3 4 5
D
% MC in the least exposed samples at T = 0h (Figure 3.12 A-C) was the same for all
treatment types with a uniform distribution of moisture across the board core with low
variation. By T = 384h (Figure 3.12 D-F), the control samples have a lower % MC
than the treated samples, but the %MC in the treated samples is comparable.
At T = 18h, all charges of timber indicated an increased loss of moisture form slices 1
and 5 (See Figure 3.9) compared to those from the centre of the core. However, this
was not marked. From T = 54h, the trend of moisture loss from the core tended more
towards uniformity, although the overall decrease in %MC was greater in the treated
charges (as shown in Figures 3.10 and 3.11).
Figure 3.12 Core moisture content profiles at T = 0h (A, B, C) and T = 384h (D, E, F) for least exposed samples (see Figure 3.7) in charges of untreated E. regnans (■) and samples treated with saturated SDS (■) or 30% PEG 400 (v/v, ■). Data are the mean (±SEM) of three %MC sample slices.

128
Sample 8 at T=528 hours
0
25
50
75
100
125
1 2 3 4 5
% M
C
CSample 23 at T=528 hours
0
25
50
75
100
125
1 2 3 4 5
% M
C
BSample 38 at T=528 hours
0
25
50
75
100
125
1 2 3 4 5
% M
C
A
Figure 3.13 shows that at T = 528h, the moisture content of the control sample in the
most protected board in the charge was demonstrably lower than either of the treated
samples. At the higher moisture content, the treated samples exhibit greater MC loss
from the outer parts of the core (samples 1 and 5).
Sample 23 at T=1200
0
25
50
75
100
125
1 2 3 4 5
% M
C
BSample 38 at T=1200
0
25
50
75
100
125
1 2 3 4 5
% M
C
ASample 8 at T=1200
0
25
50
75
100
125
1 2 3 4 5
% M
CC
At T = 1200h, average MC for all inner samples was less than 15% and had achieved
a uniform loss of moisture across the core of the board that was in equilibrium with
the atmosphere.
Figure 3.13 Representative core moisture content profiles at T = 528h for most central samples from charges of untreated control (A) and treated with SDS (B) or PEG 400 (30% v/v; C). %MC is % moisture content.
Figure 3.14 Representative core moisture content profiles at T = 1200h for most central samples from charges treated with 30% (v/v) PEG (A), saturated SDS (B) and untreated control (C). %MC is % moisture content.

129
3.3.5 Discussion
Overall drying trends indicate that there was an arrest in the rate of moisture loss in
the chemically treated timber. The severity of the drying conditions (45% RH)
appeared to have an impact on the rate of moisture loss as the difference in drying
rates between the different treatments and the control was more pronounced in the
inner samples (Figure 3.11). However the moisture loss trends were comparable for
inner and outer placed samples that had had the same pre-treatment: PEG-treated
samples showed a more linear decrease in %MC than those pre-treated with SDS,
although both treatments resulted in a slower rate of %MC loss than the untreated
control regardless of stack position. Repeated Measures ANOVA showed there was a
significant difference (P<0.05) in the loss of moisture from E. regnans between
treated and untreated samples from T = 168h in the inner and outer stack until the
completion of the drying trial. Although there was a statistically significant
difference in MC% at T = 1200h, this was principally due to a low standard deviation
and may be of little practical significance.
Difference between treatments
The structure of the chemicals used should be considered to provide part of the
explanation of the difference in the observed values for each treatment type compared
to the untreated control. PEG penetrated the timber surface and stabilised at a layer
depth that was consistent with previous findings. It was apparent visually that SDS
was not readily taken up into the timber and showed very little (estimated less than
1mm) penetration beyond the surface.

130
Due to the milling process, the outermost surfaces of the timber board consist of
greatly disrupted structures and compromised cell walls. Consequently, it is not
unexpected that a chemical structure of substantial hydrophobicity could penetrate
these compromised cell layers. However, deeper into the timber, the cell structure is
whole and its integrity in tact. It could be suggested that only (hydrophilic)
chemicals, which are not obstructed at the cell wall, would be transported easily into
the vessels. Consequently, it is only chemical structures with hydrophilic properties
that will migrate further into the wood structure. . In addition, SDS migration and
binding to cellulose would be greatly impeded by its own structure: the aliphatic chain
and low strength of attachment between either the terminal sodium or net negative
charge on the terminal oxygen. For the same reasons, it is also unlikely that SDS was
able to yield any benefit with respect to structural support.
An observation was that most samples incubated in a saturated SDS solution warped
markedly. In some cases, the geometric condition of the SDS-treated samples was
poorer than those of the untreated control. SDS-treated samples frequently showed
evidence of surface check, splitting and warping. Furthermore, the SDS-treated
samples had a thick, smooth film on the outer surface, which made suds when
exposed to water.
The PEG-treated samples showed the greatest retardation of moisture loss. Figures
3.10 and 3.11 show that over the latter part of the drying period, and as the timber
approached FSP (about 25%MC) the moisture loss from the core of PEG-treated
samples was almost linear and occurred at a lower rate. Although the core %MC (at
T = 1,200h) for all sample groups was significantly different (P<0.05) the degree of
131
variability between the sample group average %MC values was within the industry
standard (AS2082-2000). This indicates that the chemical treatments did not prevent
the sample boards from equilibrating with the atmosphere. PEG-treated samples also
demonstrated less drying defect and less departure from original dimension.
However, this is a cursory observation at this juncture and will be the focus of later
scrutiny
Figure 3.10 and 3.11 illustrated that the rate of moisture loss from treated samples was
less than from the control samples during the period where there is a decrease from
about 100% MC down to FSP. It is during this phase that timber is susceptible to
cellular collapse and change in shape owing to moisture loss. However, the greater
control of moisture loss was not necessarily coupled with an improved visual quality
of the timber.
Core moisture content profiles
The purpose of removing the outer sections of each sample slice was to assess any
change in moisture content that could be attributed to a chemical treatment, but did
not directly involve the chemical. The core sections, which were cut into five even
slices to provide the MC profile were wholly devoid of any added chemical. The full
set of profile data from this investigation is included as Appendix 1 (on CD).
PEG-treated samples showed a net loss of moisture at T = 0 (Mean = 97.61±1.68)
when compared to pre-treatment MC (T = -96h; Mean = 106.1±1.14SEM)) whereas
SDS-treated samples show no net MC loss before and after soaking (108.0±1.14 and

132
108.1±2.01). Increasing the PEG solution concentration beyond 30% may result in
further decreases in core MC during incubation.
Figure 3.12B and 3.12C provide a representative comparison of the %MC difference
between the two chemically treated batches and the control at T = 0h and T=384h.
The chemically treated samples have a higher %MC and lower variability (shown by
smaller error bars) compared with the control. This indicates that during the early
stages of drying, the chemical treatments used were able to exhibit control of moisture
loss on the core of the samples boards (where no chemical was present) by retarding
moisture loss from the case of the board. This is result of interest as the establishment
of a moisture content gradient between the case and core of the board can result in
opposing compressive and tensile stresses which given rise to surface check.
Figure 3.13 compares the moisture content profiles at the time point when %MC
difference was measured at its greatest between chemically pre-treated samples and
untreated controls (T = 528h). The treated examples (one each of PEG and SDS) are
not significantly different in %MC, but the untreated control means from the most
protected boards in the charge are below FSP. Despite this large difference in %MC
between treated and untreated samples, each example displays a degree of uniformity
of %MC across each respective moisture profile. However, the standard error
indicates that there is a much greater fluctuation in the moisture content of the control
samples. This becomes important when considering the issue of shrinkage and
moisture content loss. This uniformity was expressed more markedly in the profiles
taken at T = 1200h (Figure 3.14 A-C). Although chemical pre-treatment may have
altered the drying behaviour of a particular charge, after 50 days of drying at 45-55%
133
RH, each timber charge equilibrated with the atmosphere with %MC being unerringly
uniform across each profile.
3.3.6 Conclusion
This experiment has shown that two chemical preparations, (PEG 400 (30% v/v) and
saturated SDS) decreased the rate of moisture loss from E. regnans under severe
drying conditions, yet allowed the core of the timber to equilibrate with the
atmosphere. However, there were vastly different effects on dimensional stability
with PEG-treated samples retaining a greater proportion of their original dimension at
the end of the drying trial. PEG penetrated into the timber to a depth consistent with
previous trials whereas SDS did not show any appreciable penetration to any depth.
The findings of this investigation suggest that the ability to control the rate of MC loss
from timber is not necessarily concomitant with dimensional stability.
It could be suggested that the presence of PEG in the timber could have had some
stabilising effect on the timber, which was partly independent of the effect that PEG
has on moisture loss. Greater attention and quantitative assessment will be given to
these aspects in later investigations.
The moisture content profile allows a large amount of data to be recorded about the
condition of moisture loss across a drying board at any given time. However, the
longitudinally cut sample slice has only illustrated moisture content profiles a) in the
core of the sample and in the radial aspect (i.e. through the growth rings and not
across them) of each sample. For a more complete picture, assessment of moisture

134
movement in the case of sample and moisture movement with respect to the tangential
aspect of the timber should also be considered.
Ralph, J.F. (2006), PEG Penetration and the Effects of PEG Pretreatment in Air-
Dried Eucalyptus, Wood.Fib.Sci., 38(1):139-143.
3.4 Tangential moisture content profiles
3.4.1 Introduction
Given the novelty of drying Tasmanian Oak with the assistance of a PEG pre-
treatment, it is necessary to analyse many facets of drying behaviour to understand its
likely effects, and to inspect those facets in greater detail than would be considered
necessary during the normal course drying of timber on an industrial scale. The
following investigation is a natural progression from the previous findings.
Previously, slices were cut from sample boards and the core of each slice cut radially
into five evenly-sized pieces. The average of these pieces was regarded as the %MC
of the sample and the moisture content of the five pieces was plotted and presented as
a column graph (Figures 3.12-3.14) and presented as a collection of the 15 sample
boards in their fixed stack position for each %MC sample time point (Appendix 1).
The following study highlights the pattern of moisture content loss with tangentially
cut pieces and also includes inspection of change in the case %MC.

135
3.4.2 Methods
Preparation of timber samples was as per Section 3.3.2 (General method for drying
trials). The chemical used for pre-treatment was PEG 400 (30% v/v). The radial
cutting pattern depicted in Figure 3.9 was replaced with a cutting pattern consistent
with the aims of this investigation (Figure 3.14): to view moisture losses with a
tangential focus and observe moisture loss in the tangential aspects of the core and
case.
Data Analysis
MC values were obtained as described above. Mean Outer and Inner values were
calculated using the mean MC value for each sample, giving rise to a group mean and
Standard Error of that mean. MC% was plotted against time giving rise to drying
curves. Regression analysis was performed using MiniTab analysis software to
investigate points of significant difference in MC% between treatments.
Differences in moisture loss within the sample and between core and case was
measured using the cutting process outlined in Figure 3.15 and this data has been
included as Appendix 2 (on CD). Selected data sets from this attached data are
included in the results section.

136
7
6
5
4
1
3
2DISCARD
DISCARD
3.4.3 Results
The raw data has been treated to provide meaningful comparisons between data sets.
For each time point, a sample slice was cut into seven pieces to allow for the moisture
content profile across the sample board to be measured. With 60 individual sample
boards and seven individual %MC readings per sample every time moisture content
was measured, a significant amount of data was produced. The individual profiles are
contained in Appendix 2 (on CD).
The average of the seven pieces was regarded as the %MC value for the sample. The
core %MC was determined from the average of pieces 2-5 (i.e. excluding the case).
These two data sets were compared also with respect to location of sample boards in
the charge.
Figure 3.15 Cutting pattern to obtain a tangential cross section of the core of treated and untreated samples. Each section was cut, weighed, dried, re-weighed and compared to obtain a moisture content profile for each sample in the charge.

137
Samples which had either a tangential or radial face exposed directly to the
atmosphere were regarded as Outer sample boards. Samples completely enclosed by
other sample boards were denoted as Inner sample boards.
0
35
70
105
140
0 300 600 900 1200
Time (hours)
% M
C
A
0
35
70
105
140
0 300 600 900 1200
Time (hours)
% M
C
B
0
35
70
105
140
0 300 600 900 1200
Time (hours)
% M
C
C
0
35
70
105
140
0 300 600 900 1200
Time (hours)
% M
C
D
** * *
**
**** * *
**
* * *
* * * *
The consistent trend shown is that sample boards located on the inside of the charge
dry more slowly than those on the outside of the charge. This difference in drying
rate due to position in the charge is more pronounced in untreated controls (3.16B)
than in PEG-treated samples (3.16A). Outer PEG-treated samples have a pattern of
moisture content loss which is comparable with Outer control samples (3.16C) while
Figure 3.16 Comparison of whole %MC in inner and outer samples. Data sets are paired for the following sample groups: A – PEG-treated samples Outer position ( ) and Inner position ( ); B – Untreated control samples Outer position ( )and Inner position ( ); C – PEG-treated samples Outer position ( ) and untreated Control samples Outer position ( ); D PEG-treated samples Inner position ( ) and control samples Inner position ( ). Data points are the mean ± SEM of six (inner) or nine (outer) samples which were determined from the average of the pieces cut as per the cutting pattern (Figure 3.15). Data points which are significantly different (T-test; P<0.05) are noted with an asterisk (*).

138
there is a considerable difference in the patterns of moisture loss for PEG-treated and
control samples positioned in the middle of the charge (3.16D).
0
35
70
105
140
0 300 600 900 1200
Time (hours)
% M
C
A
0
35
70
105
140
0 300 600 900 1200
Time (hours)
% M
C
B
0
35
70
105
140
0 300 600 900 1200
Time (hours)
% M
C
C
0
35
70
105
140
0 300 600 900 1200
Time (hours)
% M
C
D
* * * **
** * * *
*
***
* ** *
*
The consistent trend shown is that sample boards located on the inside of the charge
dry more slowly than those on the outside of the charge. This difference in drying
rate due to position in the charge is more pronounced in untreated controls (3.17B)
than in PEG-treated samples (3.17A). Outer PEG-treated samples have a pattern of
moisture content loss which is comparable with Outer control samples (3.17C) while
there is a considerable difference in the patterns of moisture loss for PEG-treated and
Figure 3.17 Comparison of core %MC values in inner and outer samples. Data sets are paired for the following samples: A – PEG-treated samples Outer position ( ) and Inner position ( ); B – Untreated control samples Outer position ( )and Inner position ( ); C – PEG-treated samples Outer position ( ) and untreated Control samples Outer position ( ); D PEG-treated samples Inner position ( ) and control samples Inner position ( ). Data points are the mean ± SEM of six (inner) or nine (outer) samples which were determined from the average of the pieces cut as per the cutting pattern (Figure 3.15). Data points which are significantly different (T-test; P<0.05) are noted with an asterisk (*)
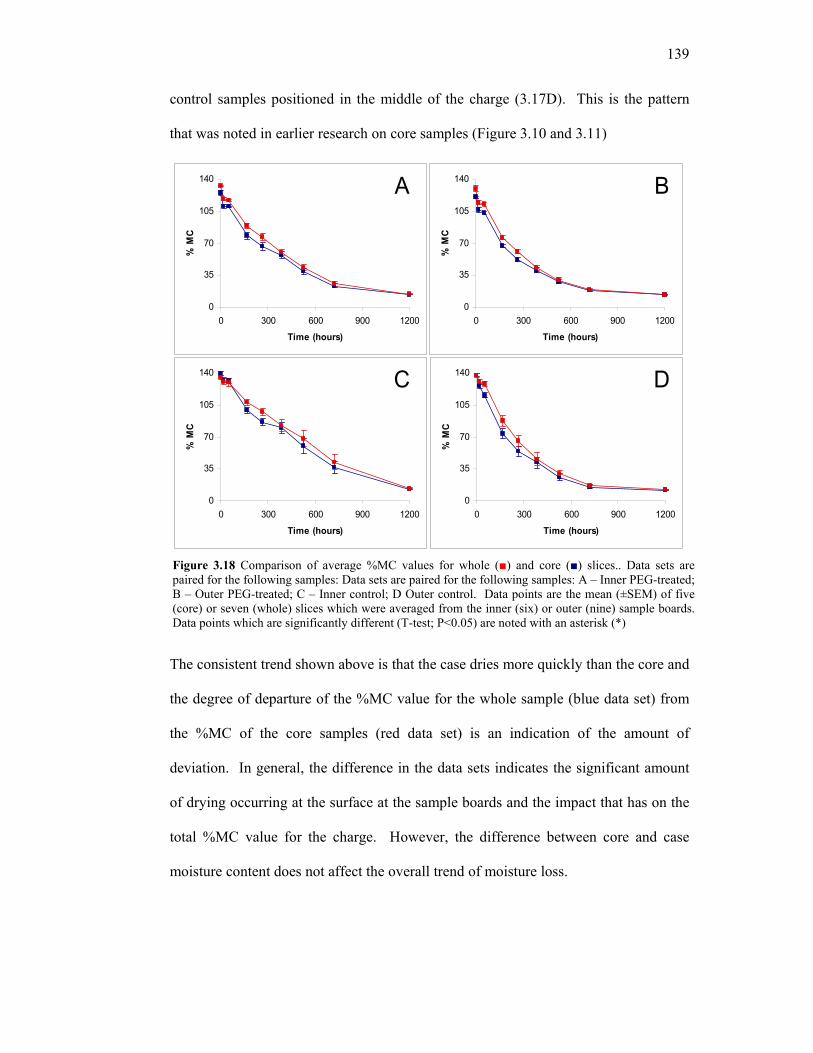
139
control samples positioned in the middle of the charge (3.17D). This is the pattern
that was noted in earlier research on core samples (Figure 3.10 and 3.11)
0
35
70
105
140
0 300 600 900 1200
Time (hours)
% M
CA
0
35
70
105
140
0 300 600 900 1200
Time (hours)
% M
C
B
0
35
70
105
140
0 300 600 900 1200
Time (hours)
% M
C
C
0
35
70
105
140
0 300 600 900 1200
Time (hours)
% M
C
D
The consistent trend shown above is that the case dries more quickly than the core and
the degree of departure of the %MC value for the whole sample (blue data set) from
the %MC of the core samples (red data set) is an indication of the amount of
deviation. In general, the difference in the data sets indicates the significant amount
of drying occurring at the surface at the sample boards and the impact that has on the
total %MC value for the charge. However, the difference between core and case
moisture content does not affect the overall trend of moisture loss.
Figure 3.18 Comparison of average %MC values for whole (■) and core (■) slices.. Data sets are paired for the following samples: Data sets are paired for the following samples: A – Inner PEG-treated; B – Outer PEG-treated; C – Inner control; D Outer control. Data points are the mean (±SEM) of five (core) or seven (whole) slices which were averaged from the inner (six) or outer (nine) sample boards. Data points which are significantly different (T-test; P<0.05) are noted with an asterisk (*)

140
0 25 50 75 100 125 150
7654321
% MC
0 25 50 75 100 125 150
7654321
% MC
0 25 50 75 100 125 150
7654321
% MC
0 25 50 75 100 125 150
7
5
3
1
% MC
A B
C D
Each of the above sample boards was positioned in the centre of the upper lap in the
charge and is included with the other profiles from this investigation in Appendix 2
(on CD). Figure 3.19A shows that at T = 168h, the MC distribution was significantly
skewed through the untreated control sample. The upper case is below FSP while the
core of the sample is still near green %MC. At the same time point, the PEG-treated
sample (3.19B) shows a greater degree of MC uniformity across the sample and
moisture loss has begun to occur throughout the whole sample. This differentiation
between treated and untreated samples continued until T = 528h.
At T = 720h, it can be seen in Appendix 2 (on CD) that although there is greater
uniformity across each sample board in the control charge, the collective %MC
difference between inner and outer samples in the control charge is evident. Despite
these differences in profile at T = 168h (and other time points), equilibrium the drying
environment is reached by the treated and untreated samples at T = 1200h (3.18C-D).
Figure 3.19 Representative tangential %MC profiles for untreated (■) and PEG-treated (■) E. regnans. Sample data collected from the same samples at Time (Hours)=168 (3.18A-B) and Time (Hours)=1200 (3.19C-D).
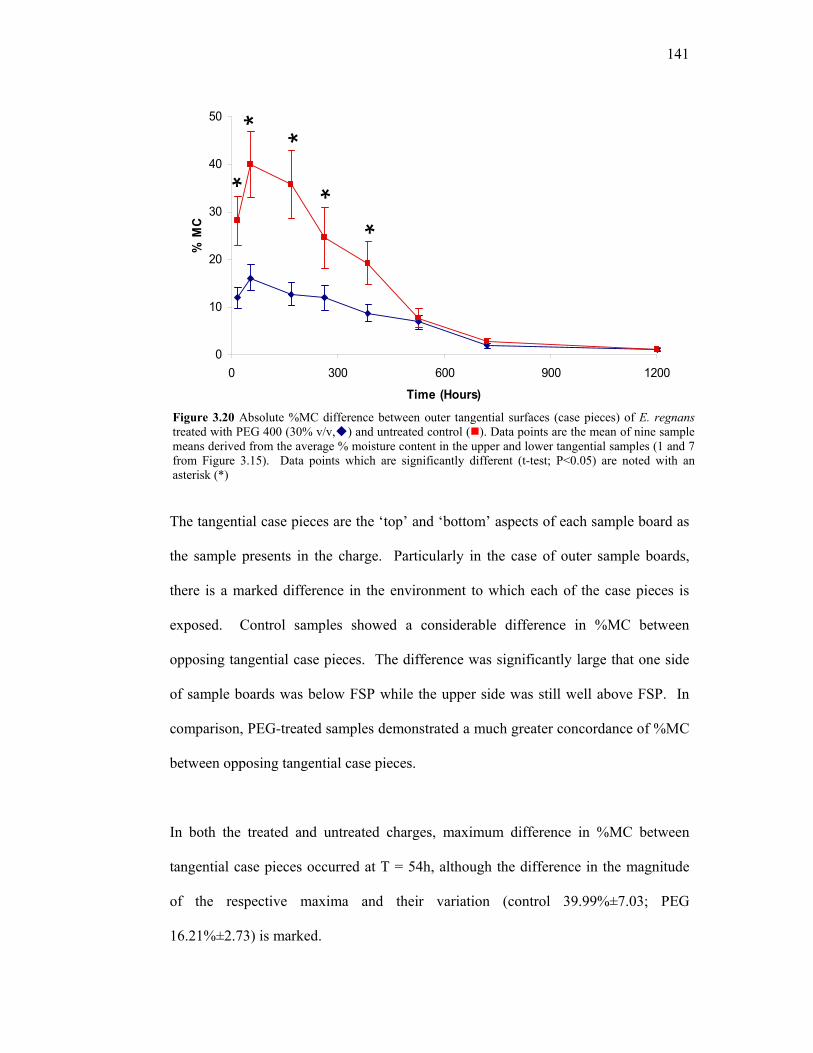
141
0
10
20
30
40
50
0 300 600 900 1200
Time (Hours)
% M
C
*
* *
**
The tangential case pieces are the ‘top’ and ‘bottom’ aspects of each sample board as
the sample presents in the charge. Particularly in the case of outer sample boards,
there is a marked difference in the environment to which each of the case pieces is
exposed. Control samples showed a considerable difference in %MC between
opposing tangential case pieces. The difference was significantly large that one side
of sample boards was below FSP while the upper side was still well above FSP. In
comparison, PEG-treated samples demonstrated a much greater concordance of %MC
between opposing tangential case pieces.
In both the treated and untreated charges, maximum difference in %MC between
tangential case pieces occurred at T = 54h, although the difference in the magnitude
of the respective maxima and their variation (control 39.99%±7.03; PEG
16.21%±2.73) is marked.
Figure 3.20 Absolute %MC difference between outer tangential surfaces (case pieces) of E. regnans treated with PEG 400 (30% v/v, ) and untreated control ( ). Data points are the mean of nine sample means derived from the average % moisture content in the upper and lower tangential samples (1 and 7 from Figure 3.15). Data points which are significantly different (t-test; P<0.05) are noted with an asterisk (*)

142
3.4.4 Discussion
The bulk of results from this experiment can be considered confirmatory and support
the observations of Chapter 3.3: the loss of moisture content occurred at greater rate
in Outer samples than Inner samples and under similar drying conditions (45-55%RH
and no appreciable airflow), this is to be expected. The panels of data in Figures 3.16
and 3.18 indicate this consistently. .
The separate assessment of core moisture content values and then with the case
moisture content was an exercise in thoroughness that produced a largely predictable
result: the most exposed aspects of each sample board had lower %MC values than
the protected core. When the core and whole results were compared (Figure 3.18), it
was shown that while the overall %MC was less when the case pieces were included,
the trend of moisture loss was not significantly changed.
A comparison of the %MC at T = 0h shows a lower average %MC in the treated
samples compared with the untreated controls. This is more pronounced in the
assessment of the whole compared to the measuring the core only, suggesting that the
greater amount of moisture loss from the timber occurring during incubation occurred
at the surface. This is due to the deposition of PEG in the wood fibres and although
the total %MC has decreased, it is not accompanied by any shrinkage at this point as
the water has effectively been replaced.
The greatest moisture differential exists at the interface between the wet wood and the
dry air and it follows that the impetus to equilibrate the atmosphere of the wood and
air is greatest at this point. It is this fundamental principal which is at the centre of

143
many common problems associated with timber drying – a drying board exterior
attempting to shrink on a wet, non-shrinking core gives rise to opposing stresses
which can result in permanent defect in the timber.
The result of greatest difference compared with observations in Chapter 3.3 was that
the Inner PEG-treated samples dried more quickly that the untreated controls (Figure
3.17D) and the Outer PEG-treated samples dried at essentially the same rate as the
Outer controls (Figure 3.17C). This is in contrast to Section 3.3 where a 30% PEG
solution and a saturated solution of SDS retarded the rate of moisture loss in E.
regnans in all parts of the charge. In the current situation, the effect has been
reversed.
Applying Ockam’s razor, a reasonable observation is that at T = 0h, the average
%MC for the treated samples was lower because there had been a net loss of moisture
from the timber during incubation as the PEG exchanged with water in the wood.
Consequently with the PEG-treated samples beginning the drying trial at a lower
%MC, it would be expected that the overall %MC would be lower at any given time.
Another plausible explanation is that the temperature of the drying room was higher
in the current drying trial than that of Chapter 3.2 and added a greater drive for the
loss of moisture from the all sample boards. Consequently, the rate of moisture loss
in Outer PEG and control samples (Figure 3.17C) is not significantly different as it
was in the previous experiment (Figure 3.10) as the ability for PEG to bind water has
been over run by the harsh climatic conditions. This may serve as a reminder that if
144
PEG is found to ultimately be of benefit in the drying of timber, that there are limits
under which it can function successfully.
The increased moisture loss of the outer PEG samples relative to the PEG inner
samples is more intriguing, but a probable answer comes from the same source: the
harsh environmental conditions. Figure 3.19A shows a massive loss of moisture from
the surface of the control sample board while the centre of the board remains closer to
the green condition. The upper section of the board is at or below fibre saturation
point, considerable shrinkage is occurring in the case while the wet core is opposing
the shrinkage. The opposing forces rise and the case enters a period of tensile stress
and the core is in compression. If the tensile forces are high enough, the case can lose
its elastic properties and is unable to assist further moisture loss unless surface checks
occur (thus reducing the market worth of the timber product). Therefore, despite the
large moisture gradient that exists between the case and the core, moisture loss is
impeded.
In contrast, moisture loss from the PEG-treated samples is maintained owing to the
dimensionally stabilising effects that the bound PEG imparts to the timber. By
bulking the cellulose fibres, PEG reduces the rise of tensile stresses. This is in
addition to the hydrophilic nature of the chemical, which also can assist on drawing
moisture from the timber. Therefore in extreme conditions but within the limits of the
chemical’s ability to do so, PEG may impart a greater control over moisture loss.
Intuitively, moisture will be lost from a more exposed surface (as Figure 3.19A
illustrates). However, a PEG-treated sample board in the same position in the charge
145
(top lap and centre) showed a greater degree of uniformity across the sample and
particularly between the case pieces (Figure 3.19B). As distinct as this is, a more
striking (and scientifically robust) demonstration is shown in Figure 3.20.
The figure shows the absolute difference between the opposing tangential case pieces
for all PEG-treated and all untreated control samples. In both treated and control
samples, the differences in %MC is at its maximum during the early stage of the
drying trial: %MC in the timber is high and the moisture gradient between wood and
atmosphere is at its maximum. However, the peak values are the feature: at the first
five time points, the control samples have an average absolute difference in %MC
which is greater than the overall maximum average absolute difference in the PEG-
treated samples at any stage. Furthermore, at T = 264h, when the average %MC for
the control charge was 60.06%, there was an average absolute difference in case
%MC of 24.60% (±6.39). At the same time, the PEG-treated charge had an average
%MC of 56.26% and an average absolute difference in case %MC of 11.95% (±2.52).
The PEG-treated samples produced a lower difference in average case %MC and with
a lower variance.
3.4.5 Conclusion
This investigation has shown that under non-ideal conditions, PEG pre-treatment can
impose a positive benefit on the drying timber and allow for a more controlled,
uniform loss of moisture compared to an untreated control. The fact that the tangential
aspect was more in focus, and that it is this face which is of particular interest in the
drying of backsawn timber, adds to the value of the outcome.
146
With the tangential cutting pattern in a backsawn board, the tangential face has a
larger area of case wood compared to the radial pattern. Therefore, it could be
anticipated that core %MC would be more greatly influenced by this more exposed
surface area. It may be that in measuring the core only, that %MC would be the same
regardless of cutting pattern. A future study should involve obtaining radial and
tangential slices from each sample board so that a thorough comparison can be made
on each sample in both orientations of cut.
This study has shown that pre-treatment with a 30% (v/v) PEG 400 solution has
positive benefits in equilibrating the loss of moisture from timber. Previous studies
have attested to benefits in limiting dimensional loss and change from original sawn
profile. A question that remains is – would an increased concentration of PEG further
enhance these desirable outcomes?
3.5 The effect of increasing PEG concentration on moisture loss, shrinkage and
dimensional stability in Tasmanian Oak.
3.5.1 Introduction
Experimental data to date shows that pre-treatment of green timber with 30% (v/v)
PEG affects the rate and trend of moisture loss from green E. regnans. This was also
shown to occur in timber treated with the anionic surfactant SDS, although SDS was
found to have little supportive effect on timber dimensional stability. There is yet to
be investigations into effects on moisture content and dimensional stability in
Tasmanian Oak when treated with PEG solutions that span the concentration
spectrum.

147
Moisture content profiles, obtained from radial and tangential cutting patterns, have
shown that PEG can impact on the distribution of moisture and manner of moisture
loss from within boards. However, moisture loss in the tangential and radial aspects
has yet to be assessed simultaneously.
Samples pre-treated with 30% PEG 400 showed lower levels of drying defect and
greater resistance to shrinkage and deviation from the sawing profile and the results to
date impel further investigations as to whether PEG concentration in the incubating
solution is a factor. The following experiment examines the impact of pre-treating a
species of Tasmanian Oak with a range of concentrations of PEG 400. Methods used
to date are combined for the assessment of moisture loss, moisture content profiles
and dimensional change (shrinkage and distortion) to produce a broad, yet detailed,
assessment of the MC and structural changes to the timber during drying
3.5.2 Methods
Fifteen samples of backsawn, heartwood E. regnans (25mm x 35mm x 300mm) were
obtained and prepared as described in Section 3.2. A longitudinal aspect of each
sample was traced before both ends were end sealed with araldite and placed in a
solution of PEG-400 (Union Carbide) at concentrations (v/v) of 20%, 50% or 80%
and allowed to soak for 96 hours in a sealed container at room temperature. Treated
samples were removed from their respective solutions after 96 hours and, together
with fifteen end sealed, untreated samples of E. regnans as controls, were left to stand
in the air-conditioned laboratory that was maintained at a relative humidity in the
order of 45-55% R.H.

148
Sample slices were obtained and handled as per Section 3.2.5 and Figure 3.21 at the
following times during drying: T(hours) 0, 18, 54, 168, 264, 384, 528, 720, 1200.
Discard
Radial cut
Tangential cut
Reseal w ith araldite
Marked linealw ays to the top
M arkers for m easuringdimensions during drying.T hree m arks a lso on lowertangential surface
Two slices were taken from each sample and dissected using the following cutting
pattern (Figure 3.22) to obtain a radial and tangential moisture profile for each sample
board at each time point.
DISCARD
DISCARD
1
2
3
4
5
6
7DISCARD
DISCARD
1 2 3 4 5 6 7
Core results considered the average moisture content of pieces 2-5 in both
orientations, thus negating the effects of excessive drying or the presence of the
Figure 3.21 Reproducible method of obtaining comparable moisture content and dimensional data.
Figure 3.22 Cutting pattern to obtain a radial and tangential cross section of slices from treated and untreated sample boards. The seven pieces were cut, weighed, dried, re-weighed and compared to obtain a moisture content profile for each sample in the charge.

149
chemical (all PEG was contained within either the discarded pieces or pieces 1 and 7).
Whole results for each sample were the average of pieces 1-7.
3.5.2.1 Assessment of shrinkage
During the drying trial, measurements were taken with digital vernier callipers at
previously determined points (marked with a permanent pen). During each testing
period, when moisture content was measured, tangential and radial measurements
were taken at three points. The average of the three measures in each orientation was
given to represent dimension of the sample board.
3.5.2.2 Assessment of Distortion
Measurements were taken as per Section 3.3.3 with the following modification: the
longitudinal end-section of the timber samples was traced before being exposed to any
chemical treatment and also at the end of the drying trial. Deflection angles were
measured as described previously (Section 3.2.2) from tracings taken at t = 0h and at
the end of the trial (T = 1392h).
3.5.3 Data analysis
The climatic conditions under which the timber was air-dried has been discussed
previously and results indicated considerable differences in the drying rate of inner
and outer control sample boards. With that difference duly noted (and it was certainly
the case here also), for the purposes of examining moisture loss over multiple time
points, each charge will be considered individually. The data generated (with regards
to moisture loss and dimensional change) will be considered with respect to each
entire charge. However, where of value in presenting a new analysis or summary,

150
distinction is made between Inner and Outer samples. Data was analysed for
significant difference (P<0.05) by way of student T-test for the data within a
treatment variable and ANOVA for the differences between treatments using
Microsoft Excel data analysis pack.
Due to the large quantity of data generated from this investigation, the moisture
content profiles are included as Appendices (on CD) to this manuscript and key
examples are reproduced within this results section. Furthermore, the Results section
is subdivided into four areas of presentation: change in moisture content (3.5.4.1),
shrinkage (3.5.4.2), comparison of moisture loss and shrinkage (3.5.4.3) and
distortion (3.5.4.4).
3.5.4 Results
3.5.4.1 Change in Moisture Content
Figure 3.23 Moisture Content (% MC) over 1200 hours of drying time in PEG-treated and untreated E. Regnans (untreated control ■, 20% (v/v) PEG 400 ■, 50% (v/v) PEG 400 ■, 80% (v/v) PEG 400 ■). Data points are the mean (± SEM) of fifteen sample means. Each sample mean is the mean of the moisture content slices (n=14) obtained from the radial and tangential cutting patterns T = -96h is the time when chemical treatment began. T = 0h (dashed line) is the time point at which the treated samples were taken out of solution and untreated samples were unwrapped.
0
20
40
60
80
100
0 300 600 900 1200
Time (Hours)
% M
C
-96
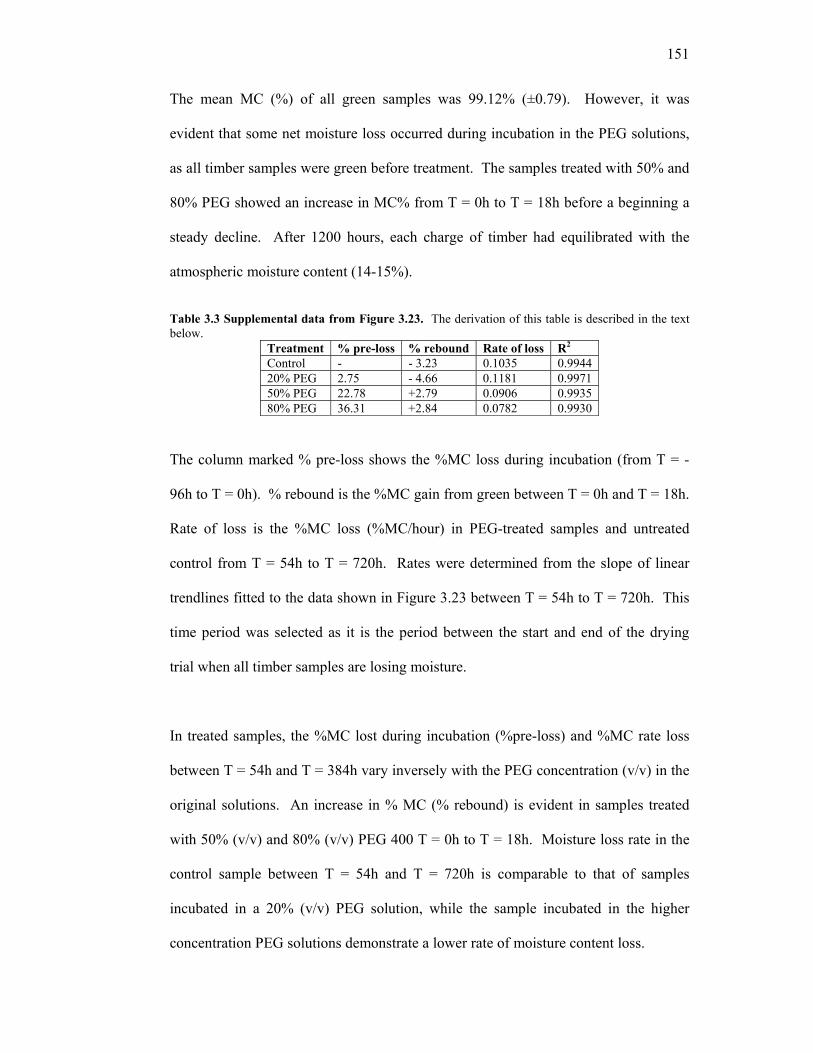
151
The mean MC (%) of all green samples was 99.12% (±0.79). However, it was
evident that some net moisture loss occurred during incubation in the PEG solutions,
as all timber samples were green before treatment. The samples treated with 50% and
80% PEG showed an increase in MC% from T = 0h to T = 18h before a beginning a
steady decline. After 1200 hours, each charge of timber had equilibrated with the
atmospheric moisture content (14-15%).
Table 3.3 Supplemental data from Figure 3.23. The derivation of this table is described in the text below.
Treatment % pre-loss % rebound Rate of loss R2 Control - - 3.23 0.1035 0.9944 20% PEG 2.75 - 4.66 0.1181 0.9971 50% PEG 22.78 +2.79 0.0906 0.9935 80% PEG 36.31 +2.84 0.0782 0.9930
The column marked % pre-loss shows the %MC loss during incubation (from T = -
96h to T = 0h). % rebound is the %MC gain from green between T = 0h and T = 18h.
Rate of loss is the %MC loss (%MC/hour) in PEG-treated samples and untreated
control from T = 54h to T = 720h. Rates were determined from the slope of linear
trendlines fitted to the data shown in Figure 3.23 between T = 54h to T = 720h. This
time period was selected as it is the period between the start and end of the drying
trial when all timber samples are losing moisture.
In treated samples, the %MC lost during incubation (%pre-loss) and %MC rate loss
between T = 54h and T = 384h vary inversely with the PEG concentration (v/v) in the
original solutions. An increase in % MC (% rebound) is evident in samples treated
with 50% (v/v) and 80% (v/v) PEG 400 T = 0h to T = 18h. Moisture loss rate in the
control sample between T = 54h and T = 720h is comparable to that of samples
incubated in a 20% (v/v) PEG solution, while the sample incubated in the higher
concentration PEG solutions demonstrate a lower rate of moisture content loss.

152
-12.00
-10.00
-8.00
-6.00
-4.00
-2.00
0.00
2.00
4.00
6.00
8.00
Chan
ge in
% M
C
1 and 7 (case)2 and 63 and 54 (middle)
Control 20% PEG 400 50% PEG 400 80% PEG 400
The change in moisture content between T = 0h and T = 18h was examined in detail
due to samples treated with a higher concentration PEG solution showing an initial
gain in moisture content. The profile cutting pattern allowed the examination of
moisture distribution within the samples of each charge. Samples from the 20% (v/v)
PEG 400 and control charge demonstrated a similar pattern of moisture loss with the
most exposed areas of the sample boards losing the greatest amount of moisture, and
the core of the board showing the least amount of loss. Samples treated with 50%
(v/v) and 80% (v/v) PEG 400 solutions showed an increase in average moisture
content across the sample boards. However, the 50% (v/v) PEG 400 solution showed
a discernable difference in the % increase between the case of the sample and the
adjacent sections. The samples treated with 80% (v/v) PEG 400 showed a uniform
%MC increases across the board profile.
Figure 3.24 Change in %MC between Time (hours) = 0 and Time (hours) = 18. Numbers in the key (1&7 ■, 2&6 ■, 3&5 ■ and 4 ■) are the piece numbers from the radial and tangential cutting patterns in Figure 3.22. Data points are average differences (±SEM) of fifteen samples. The sample averages were obtained from the four slices in the number 1 and 7 (n=4), 2 and 6 (n=4), 3 and 5 (n=4) and 4 (n=2) positions of the tangential and radial cutting patterns. A negative value indicates moisture loss.

153
Table 3.4 Significant Difference (P<0.05) for all treatment combinations as assessed by T-test. The table shows paired combinations as significantly different (SD, backlit in grey) or having no significant difference (NSD).
Time Control v 20% PEG
Control v 50% PEG
Control v 80% PEG
20% PEG v 50% PEG
20% PEG v 80% PEG
50% PEG v 80% PEG
0 SD SD SD SD SD SD 18 SD SD SD SD SD SD 54 NSD SD SD SD SD SD
168 NSD SD SD SD SD SD 264 NSD SD SD SD SD SD 384 SD SD SD NSD SD SD 528 NSD SD SD NSD NSD SD 720 NSD NSD NSD NSD NSD NSD
1200 NSD NSD NSD SD SD NSD
A paired T-test, assuming unequal variance, was performed on each combination of
treatments for each sampling time. These results indicate a convergence of results
between the untreated controls and samples treated with a 20% PEG solution and a
completely opposite result between the control and samples treated with higher
concentrations of PEG.
0
4
8
12
16
20
24
0 200 400 600 800 1000 1200
Time (hours)
% M
C
A
A A
B B
B
Figure 3.25 ∆ MC % between Inner and Outer sample boards (Control ■, 20%(v/v) PEG 400 ■, 50%(v/v) PEG 400 ■, 80%(v/v) PEG 400 ■). Data points are the mean difference (±SEM) between the average %MC of outer samples (n=9) and inner samples (n=6) (see Figure 3.7) and each sample average was obtained from the average of %MC slices (n=14) cut from horizontal and radial cutting patterns. A = values where ∆%MC was significantly higher (P<0.05) in untreated samples compared with PEG-treated samples of all concentrations. B = values where ∆%MC was significantly lower than controls (T-test; P<0.05) in samples treated with 80% (v/v) PEG 400.

154
Under the described drying conditions, average %MC was higher in inner samples for
time points up to T = 720h. At T = 1200h, all samples had equilibrated with the
atmosphere. Peak difference between inner and outer samples decreased as the
concentration of PEG incubation solution increased.
0
1
2
3
4
5
Contro l 20% PEG 400 50% PEG 400 80% PEG 400
Treatment
Mea
n T
an. v
Rad
. % M
C *
The absolute difference was taken from the average %MC of each sample board
(Tangential and Radial) for each time period. The resultant average of the means
presented in Figure 3.26 was an expression of the difference between moisture loss in
a radial and tangential context across the entire drying trial (±SEM). Student’s T-test
Differences in %MC between tangential and radial pattern cuts were less than 5% for
each charge.
Figure 3.26 Mean ∆ %MC between radial and tangential cutting patterns in whole (■) and core (■) samples. Whole sample data are the mean of differences (±SEM) of tangential and radial moisture content profiles of 15 sample means for each orientation. The sample means were calculated from the 7 pieces from each orientation obtained from the tangential and radial cutting patterns. Core sample data were differences between the mean (±SEM) of 15 samples means for each orientation The sample means were calculated from the 5 pieces from each orientation (excluding slices 1 and 7; see Figure 3.22) obtained from the tangential and radial cutting patterns. The asterisk (*) indicates significant difference (T-test; P<0.05) between whole and core moisture loss cutting patterns within a given treatment.

155
The panel of graphs in Figure 3.27 allows comparison of moisture loss in the tangential and radial profile at one time point with additional benefit that each
figure has samples orientated as they were cut. Each column or bar shows the %MC of an individual sample taken from each slice from the radial and
tangential cutting pattern respectively. The sample from each charge was at Position 6 (see Figure 3.1) with piece No.1 from 3.27A-D the most exposed.
This sample was in the middle lap of the charge and the upper and lower tangential surfaces (Positions 1 and 7 in 3.27E-H) were equally protected from
exposure to the drying environment. With increasing concentration of PEG, there is greater uniformity of %MC across the profiles in both orientations and
less difference between the core and case %MC. All profile data from this investigation is included as Appendix 3 (on CD).
Figure 3.27 Representative core moisture content profiles at T = 384h (Control ■, 20% PEG ■, 50% PEG ■, 80% PEG ■). Profiles are from radial (A, B, C, D) and tangential (E, F, G, H) cutting patterns with radial and tangential moisture content profiles obtained from the same sample for each treatment type. Numbers 1 – 7 are cutting pattern sample numbers (Figure 3.22).
0
20
40
60
80
100
120
1 2 3 4 5 6 7
% M
C
0
20
40
60
80
100
120
1 2 3 4 5 6 70
20
40
60
80
100
120
1 2 3 4 5 6 7
% M
C
0 20 40 60 80 100 120
7654321
% MC0 20 40 60 80 100 120
7654321
% MC0 20 40 60 80 100 120
7654321
% MC0 20 40 60 80 100 120
7654321
% MC
0
20
40
60
80
100
120
1 2 3 4 5 6 7
% M
C
Radi
alTa
ngen
tial
A B C D
E F G H
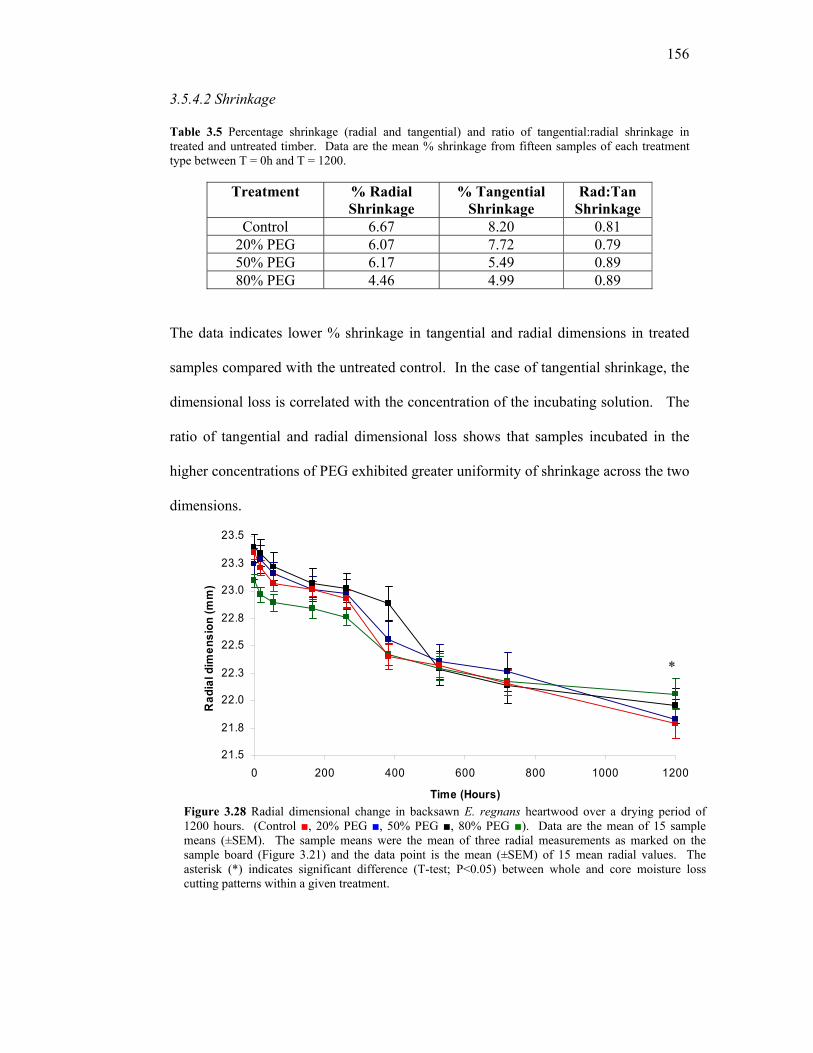
156
3.5.4.2 Shrinkage
Table 3.5 Percentage shrinkage (radial and tangential) and ratio of tangential:radial shrinkage in treated and untreated timber. Data are the mean % shrinkage from fifteen samples of each treatment type between T = 0h and T = 1200.
Treatment % Radial Shrinkage
% Tangential Shrinkage
Rad:Tan Shrinkage
Control 6.67 8.20 0.81 20% PEG 6.07 7.72 0.79 50% PEG 6.17 5.49 0.89 80% PEG 4.46 4.99 0.89
The data indicates lower % shrinkage in tangential and radial dimensions in treated
samples compared with the untreated control. In the case of tangential shrinkage, the
dimensional loss is correlated with the concentration of the incubating solution. The
ratio of tangential and radial dimensional loss shows that samples incubated in the
higher concentrations of PEG exhibited greater uniformity of shrinkage across the two
dimensions.
21.5
21.8
22.0
22.3
22.5
22.8
23.0
23.3
23.5
0 200 400 600 800 1000 1200
Time (Hours)
Rad
ial d
imen
sion
(mm
)
Figure 3.28 Radial dimensional change in backsawn E. regnans heartwood over a drying period of 1200 hours. (Control ■, 20% PEG ■, 50% PEG ■, 80% PEG ■). Data are the mean of 15 sample means (±SEM). The sample means were the mean of three radial measurements as marked on the sample board (Figure 3.21) and the data point is the mean (±SEM) of 15 mean radial values. The asterisk (*) indicates significant difference (T-test; P<0.05) between whole and core moisture loss cutting patterns within a given treatment.
*

157
Paired t-tests indicated a significant difference (P<0.05) in radial dimension at T =
1200h (*) between samples treated with 80% (v/v) PEG 400 and the untreated control
but no significant difference (P>0.05) between the untreated control and other treated
samples.
Paired t-tests indicated a significant difference (P<0.05) in tangential dimension at T
= 1200h (*) between samples treated with either 50% or 80% (v/v) PEG 400 and the
untreated control or 20% (v/v) PEG 400 but no significant difference (P>0.05)
between the 50% and 80% treatments or the 20% treatment and untreated control.
Figure 3.29 Tangential dimensional change in E. regnans over a drying period of 1200 hours (Control ■, 20% PEG ■, 50% PEG ■, 80% PEG ■). Data are the mean of 15 sample means (±SEM). Data are the mean of 15 sample means (±SEM). The sample means were the mean of three radial measurements as marked on the sample board (Figure 3.21) and the data point is the mean (±SEM) of 15 mean radial values. The asterisk (*) indicates significant difference (T-test; P<0.05) between whole and core moisture loss cutting patterns within a given treatment.
33.0
34.0
35.0
36.0
37.0
0 200 400 600 800 1000 1200
Time (Hours)
Tang
entia
l dim
ensi
on (m
m)
*
158
3.5.4.3 Comparison of Moisture Loss and Shrinkage
Figures 3.30 and 3.31 show the %MC and shrinkage data. As the data is presented
independent of time, the scatter plot is the best presentation. Each data point
represents one of the nine sample times and in most cases (but not always), this data is
sequential through time from left to right and the X-axis has been reversed to assist
this interpretation. However, for the best representation of the following data with
respect to time, see Figures 3.23, 3.28 and 3.29. Treatment type is expressed as a
categorical function and is represented by different coloured data sets.
Each data set has a regression line (same colour as data set) and linear equations and
R2 values for these regression lines are presented in a table immediately below the
Figure. The value of R2 indicates, as a fraction (-1 to +1), how much of the variation
in one variable may be explained by the other variable. The higher the value of R2,
the stronger the association between the data presented for the two variables. An
assumption of linear regression is that data on the X-axis has no error. However,
timber has such inherent variability that no error is an event beyond all probability.
The vertical displacement of the regression line is the total amount of shrinkage (mm)
which occurred during drying while the length of the regression line is the decrease in
%MC from T = 0h. As the data is a plot of the means of two co-variables, error bars
are included for shrinkage (Y axis) and moisture content (X axis) data.

159
21.2
21.6
22.0
22.4
22.8
23.2
23.6
24.0
0255075100% MC
Rad
ial d
imen
sion
(mm
)
Regression analysis of the above data estimated the following linear equations and R2
values:
The data presented above indicates that there is very good correlation between
moisture content loss and radial shrinkage. Between 92.2% and 96.3% of the
observed data is explained by the linear equations that generated the regression lines.
As with the radial shrinkage data v time data presented in Figure 3.27, there is an
overlap of the data when plotted against moisture content loss and less indication of
an effect engendered by the pre-treatment process.
Figure 3.30 Radial dimension (±SEM) vs average %MC loss in E. regnans (Control ■, 20% PEG ■, 50% PEG ■, 80% PEG ■). Data are the mean of 15 sample means. The radial dimension sample means were the mean (±SEM) of three radial measurements as marked on the sample board (see Figure 3.20). The %MC sample means were the mean of 14 sample slices (±SEM) obtained as per the radial and tangential cutting patterns.
Treatment Linear Equation R2 Control Y = 0.018x + 21.58 0.963 20 % PEG Y = 0.017x + 21.74 0.946 50% PEG Y = 0.023x + 21.59 0.922 80% PEG Y = 0.020x + 21.68 0.937
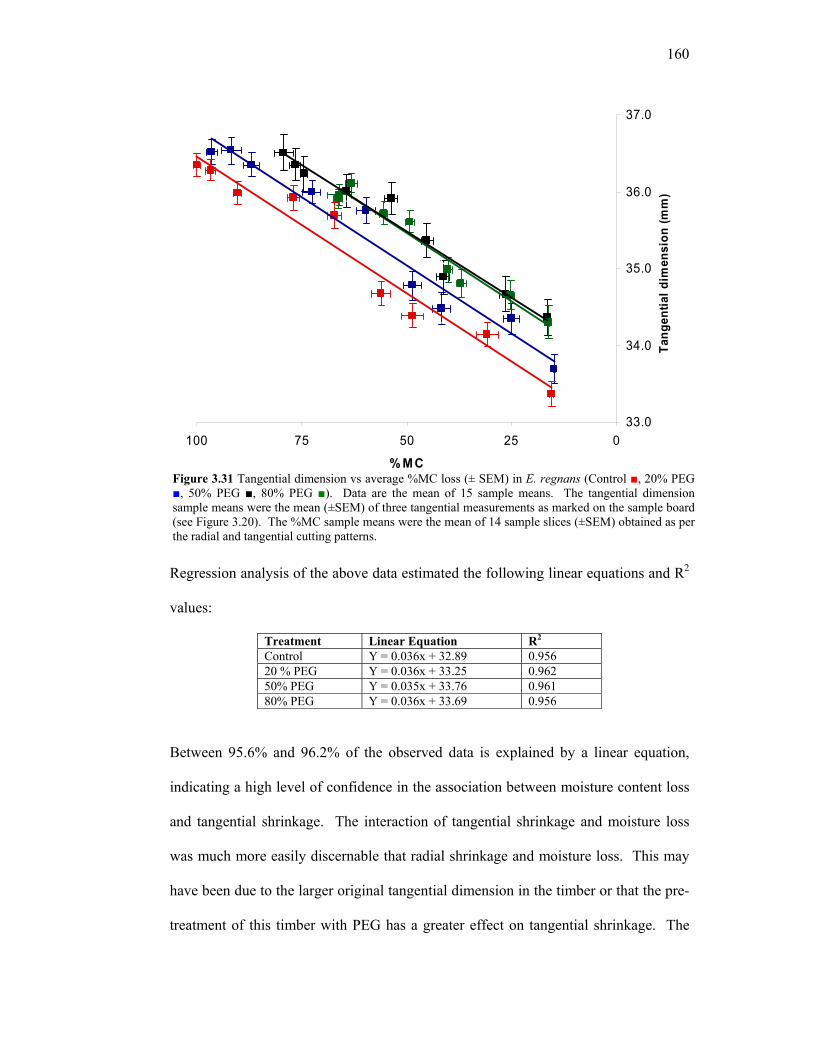
160
33.0
34.0
35.0
36.0
37.0
0255075100
% MC
Tang
entia
l dim
ensi
on (m
m)
Regression analysis of the above data estimated the following linear equations and R2
values:
Treatment Linear Equation R2 Control Y = 0.036x + 32.89 0.956 20 % PEG Y = 0.036x + 33.25 0.962 50% PEG Y = 0.035x + 33.76 0.961 80% PEG Y = 0.036x + 33.69 0.956
Between 95.6% and 96.2% of the observed data is explained by a linear equation,
indicating a high level of confidence in the association between moisture content loss
and tangential shrinkage. The interaction of tangential shrinkage and moisture loss
was much more easily discernable that radial shrinkage and moisture loss. This may
have been due to the larger original tangential dimension in the timber or that the pre-
treatment of this timber with PEG has a greater effect on tangential shrinkage. The
Figure 3.31 Tangential dimension vs average %MC loss (± SEM) in E. regnans (Control ■, 20% PEG ■, 50% PEG ■, 80% PEG ■). Data are the mean of 15 sample means. The tangential dimension sample means were the mean (±SEM) of three tangential measurements as marked on the sample board (see Figure 3.20). The %MC sample means were the mean of 14 sample slices (±SEM) obtained as per the radial and tangential cutting patterns.

161
regression lines of the control, 20% PEG and higher concentration PEGs are clearly
separated with, but there is virtually no difference in the moisture content/shrinkage
relationship in the samples treated with either 50% PEG or 80% PEG.
-6
0
6
12
18
0 200 400 600 800 1000 1200
Time (hours)
% s
hrin
kage
-6
-3
0
3
6
9
12
15
18
% M
C lo
st
-6
0
6
12
18
0 200 400 600 800 1000 1200
Time (hours)
% s
hrin
kage
-6
-3
0
3
6
9
12
15
18
% M
C lo
st-6
0
6
12
18
0 200 400 600 800 1000 1200
Time (hours)
% s
hrin
kage
-6
-3
0
3
6
9
12
15
18
% M
C lo
st
-6
0
6
12
18
0 200 400 600 800 1000 1200
Time (hours)
% s
hrin
kage
-6
-3
0
3
6
9
12
15
18
% M
C lo
st
BA
C D
The individual data sets have been presented in detail in earlier figures. This set of
figures shows overall trends and the effects of each treatment on E. regnans with
respect to moisture loss and dimensional shrinkage. % Shrinkage was calculated from
a mean score for original dimension of all (green) timber samples in the tangential
Figure 3.32 Comparison of incremental %shrinkage (Radial (■) and Tangential (■), primary Y-axis) with %MC loss [x10] (■, Secondary Y-axis) for individual treatments: A - Control; B - 20% PEG; C - 50% PEG; D – 80% PEG. Data points are the mean change in fifteen samples after each time point (i.e. not cumulative). The panels show how the amount of moisture content loss relates to dimensional loss and how amount of radial and tangential loss changes at sequential time points.

162
(36.44±0.084 SEM) and radial (24.27±0.067) directions. Regardless of treatment,
incremental tangential shrinkage for each treatment is at maximum at T = 384h.
Calculation of % loss in %MC was determined using the average %MC at T = 0h as
the %MC reference for each sample group. Thus %MC loss at each time point are
relative to the %MC for each treatment at T = 0h. With increasing concentration of
PEG solution, the initial loss, in terms of rate and amount decreased.
3.5.4.4 Distortion
In this investigation, distortion is the expression for the amount of change in the
geometric shape of the timber from the original sawn dimension.
0
2
4
6
8
10
Control 20% PEG 400 50% PEG 400 80% PEG 400
Treatment
Mea
n de
flect
ion
angl
e (α
)
*^+
Figure 3.33 Mean deflection angles (±SEM) in PEG-treated and untreated E. regnans before (time (hours) = 0, ■) and after air drying (time (hours) = 1392, ■). Data points were the mean deflection angles of 15 sample means. Each sample mean is the average measurement of four corner angles. T-tests indicated a significant difference (T-test; P<0.05) between the mean deflection angle of the untreated control and the means of treated samples at time (hours) = 0 (*), but no significant difference between the means of treated samples (>). A comparison of change in mean deflection angle from time (hours) = 0 and time (hours) = 1392 found a significant difference (T-test; P<0.005) for untreated controls but no significant difference in treated samples (+). A significant difference (T-test; P<0.05) was found between the deflection angle of the untreated control and the treated sample at time (hours) = 1392, but no significant difference between any treated sample sets.

163
Figure 3.33 shows that there was greater distortion in the control samples than the
treated samples. The amount of distortion in the control samples more than doubled
during the drying period. Timber soaked in a 20% PEG solution showed some
movement by the end of the drying trial, while there was no discernable movement in
the samples soaked in 50% or 80% PEG solutions.
3.5.5 Discussion
3.5.5.1 Moisture Loss
Prior to incubation, treated samples had a %MC the same as the untreated controls.
However, after 96 hours of incubation in the various concentrations of PEG-400, the
sample charges each had a lower %MC. Moisture loss reflected the concentration of
the PEG solution suggesting that there was a rate of PEG/moisture exchange that was
a function of PEG concentration. This is expected, as the higher concentration
gradients inside and outside the timber would provide greater energy to allow a more
rapid counter current exchange. Samples incubated in 20% solution reduced on
average by 2.7% from green %MC, whereas the samples treated with a 50% PEG-400
solution showed a reduction of 22.8%MC and the 80% PEG solution reduced by
36.3%. The pattern of moisture loss was similar for all treatment types with a
parabolic loss of moisture, with a notable exception.
At T = 0h PEG-treated samples showed an increase in %MC in samples treated in a
solution at or above 50% (v/v) before a steady decline. The moisture content
‘rebound’ is of a degree that is consistent with % MC of the incubating solution
(Table 3.3). This rebound is due, at least in part, to the hygroscopic nature of PEG
where water is drawn not only from the core of the sample board, but also from the

164
atmosphere to form a solvent shell around the PEG molecules bound to the cellulose
chains of the wood fibres.
A less conventional (and currently, less provable) supposition is that water evacuated
from the timber during incubation causes the development of a partial vacuum within
the interstices of the board’s core. This may be a void space (or non-equilibrated
pocket) partially filled water vapour. When the sample boards are first removed from
solution there is a period of time where the air pressure inside the board is less than
the atmospheric pressure. Therefore, there is a brief period when water from the
atmosphere has been drawn into the timber case by the bound hygroscopic PEG, is
drawn further into the timber by a temporary, albeit partial, vacuum. Upon
equilibration, moisture begins to exit the timber in a manner consistent with the
prevailing atmospheric conditions. The strength of the vacuum, like the amount of
water drawn into the timber, would be dependent, ultimately, on the amount of PEG
absorbed by the timber (being a function of solution concentration and
aforementioned physical properties and incubation conditions). The more PEG that is
bound in the timber, the greater the concentrations gradients, the more water (overall
and per unit time) is removed from the timber during incubation (as shown in Table
3.3) and the greater the strength of the temporary partial vacuum. Consequently, there
is a drawing in of moisture into the board, which is a function these combined effects,
resulting in a temporary reversal, or rebound, of the moisture content in the 50% and
80% PEG-treated samples.
Table 3.3 shows the % rebound to be 2.79% and 2.84% of IMC in samples of E.
regnans incubated in 50% and 80% PEG respectively. Obtaining moisture content
165
profiles for each sample board allowed investigation of moisture content across the
radial and tangential aspects of each sample. After 18 hours of drying, moisture
content decreased in samples which had been treated with 20% PEG and the untreated
control. This further supports previous evidence that treatment solutions below 30%
(v/v) supply inadequate coverage or penetration of the timber to effect a positive
change in moisture content. The higher concentration pre-treatments resulted in an
inward migration of moisture into the timber. The samples treated with the 50%
solution showed a small increase in moisture content in the case and the greatest
increase in %MC immediately below the case. Further into the boards, the increase in
%MC was less and it could be suggested that the PEG absorbed from the 50%
solution and the concomitant production of a partial vacuum, provided sufficient force
to draw moisture below the case, but not uniformly into the core.
In comparison, samples treated with an 80% PEG solution showed a uniformity of
%MC from the case to the core. If the postulate has any merit, then perhaps an 80%
PEG solution provides sufficient hygroscopic pull and generates a sufficient partial
vacuum, that atmospheric moisture can be drawn into the core of the board.
However, at an atmospheric RH of 45-55%, PEG is unable to draw moisture from the
atmosphere (Union Carbide, 1999), which suggests that the moisture is being derived
from surface moisture on the sample board. In the hours immediately after
incubation, the RH at the surface of the timber may be greater than 45-55%. This is
only a temporary condition as, after T = 18h, moisture migrates from the core of the
heavily treated boards as in the lesser treated samples and untreated controls.
166
Moisture loss rates presented in Table 3.3 show a decreasing rate of moisture loss
with increasing concentration of PEG solution. This might be expected as the total
moisture content from T = 0h for each treatment type was different. However,
interpolation of moisture loss rates for the data sets show that when moisture content
was the same (e.g. 80%PEGT =54-720h and controlT =264-720h), the rate of loss from that
point was significantly different (80% PEG = -0.0507; control = -0.0773) suggesting
that the actual moisture content of the timber samples at any given time was not the
singular determinant of the rate of moisture loss.
The differences in moisture content loss between inner and outer stack positions (see
Figure 3.7) have been demonstrated earlier (Chapter 3.4) and have not been in
particular focus in the current experiments. However, the difference in moisture
content between outer and inner samples also had a bearing that was concentration-
related. It was clearly demonstrated that the control samples on the inner part of the
charge were drying in a considerably different environment to the outer samples and
this is reflected in the high difference in the peak moisture content values and the
consistently high values through the trial. Samples treated with the 20% PEG
solution, although similar in %MC to the controls throughout the drying trial, showed
a greater degree of uniformity of drying throughout the charge, with a maximal
average difference of between inner and outer samples of 9.96% (compared with
18.16% in the control). With an increase in solution PEG concentration, the
maximum peak difference between inner and outer samples decreased and occurred
later in the drying trial (when total %MC are lower and %MC difference would be a
greater percentage of the remaining moisture). Figure 3.25 is a testament to the
ability of PEG to become the dominant factor affecting the drying conditions and,
167
with PEG confined to the timber, directly imposes greater control from within the
timber on the loss of moisture. These results are underpinned by the T-test results
summarised in Table 3.4: the higher concentration treatments are generally effective
on producing more favourable properties in drying timber than untreated controls or
samples treated with a 20% (v/v) PEG 400 solution.
The final observation of moisture loss in this trial was a comparison between the
moisture loss in the tangential and radial patterns and this difference was compared
between core and whole slices (Figure 3.26). Data was analysed by way of student T-
test for the data within a treatment variable and ANOVA for the differences between
treatments. There was a significant difference (P<0.05) between the average moisture
loss difference in the cutting patterns in the control samples only. This supports
earlier findings and is explained by the difference in the amount of the case of each
sample board that is present in each cutting pattern (Figure 3.22). Once again, PEG
treatments show an ability that increases with solution concentration to confer a
uniformity of %MC to the timber samples.
This uniformity is presented in the moisture profiles depicted in Figure 3.27 and are
illustrative of the uniformity of moisture content distribution that accompanies an
increase in PEG solution concentration. The lowering of sample %MC in solution
means that the moisture content loss to the atmosphere was less and, owing to the
presence of PEG in the case of the timber, the effective moisture content difference
between case and core can not be as great as it was in the untreated control.
Consequently, there was a greater effective difference in the moisture content of the
case of the control sample to the core. A similar effect occurred regardless of cutting

168
pattern and these trends were consistent throughout the drying trial (see Appendix 2
for all moisture content profiles form this investigation). However, there were no
differences between the two cutting patterns that cannot be accounted for by the
respective exposure to the drying atmosphere: the most exposed surface shows the
greatest amount of drying.
3.5.5.2 Shrinkage
Overall shrinkage in the radial and tangential directions (Table 3.5) showed the ability
of PEG to stabilise E. regnans. Compared to the control, samples treated with 80%
PEG shrunk less radially (33%) and tangentially (39%) and the overall
radial:tangential shrinkage ratio improved by over 9%. The use of the considerably
more dilute 20% (v/v) PEG solution also yielded an improvement on radial and
tangential shrinkage, suggesting that in small quantities, PEG 400 can have an
observable bracing effect within the timber structure. This could have immediate
benefit, as, in the commercial field, the aim would be to achieve the optimum effect
with the minimum amount of chemical. This is certainly an area for greater
investigation.
Chapter 1.5 described the theories of the differential shrinkage rates in the timber
dimensions and that it is this anisotropy, rather than overall shrinkage, that gives rise
to permanent damage to drying timber. Also discussed were the postulates as to why
timber shrinks more in the tangential aspect. It has been shown in this investigation
that PEG treatments over the recommended concentration of 30% reduced the amount
of radial and tangential shrinkage, but lowered the amount of tangential shrinkage to a

169
greater extent, thus evening out the shrinkage in the two dimensions and lowering the
anisotropic effect.
The pattern of radial and tangential dimensional loss is shown across the entire drying
time in Figures 3.28 and 3.29 respectively. Of particular note is a comparison of the
average board width and thickness at each time point and the corresponding % MC
(Figure 3.23). At T = 0h, the samples treated with 80% (v/v) PEG 400 had an average
%MC of nearly 50% (a decrease of about half of green %MC) and had a radial
dimension of 23.09mm (±0.05mm). At T = 384h, when the control samples averaged
approximately 50%MC (as 80% (v/v) PEG treated sampled did at T = 0h), the radial
dimension in the control charge was 22.56mm (±0.15mm). This indicates that
considerable moisture loss is occurring in solution without the loss of dimension that
would be seen in untreated E. regnans. A similar pattern was exhibited when
tangential loss was measured (Figure 3.29) with samples treated with the higher
concentration PEGs (50% and 80% v/v) not significantly different (P<0.05) in the
measure of anti-shrink efficiency. However, the % MC shrinkage relationships for
each of the treatments was demonstrated best in Figures 3.30 and 3.31.
3.5.5.3 Moisture loss and shrinkage
In this experiment up to Figure 3.30, time defines one half of the placement of a data
point on a graph. The presentation in 3.30 and 3.31 show whether the relationships
still exists when two variables, one explanatory and one dependent, are inspected
without the confidence which can be imparted by fixed time points. The results
confirm the trend suggested in 3.28 and 3.29 – that both radial shrinkage and
tangential shrinkage are ameliorated with tangential dimension the greater beneficiary
170
of PEG treatment. Retardation of tangential shrinkage is clearly responsive to the
solution PEG concentration with a confidant degree of linearity (>0.95).
Figure 3.32 compares the amount of tangential and radial shrinkage with the amount
of moisture loss after each data collection period. Similarities can be seen between all
four treatments suggesting that the use of PEG pre-treatment acts on an existing
pattern of behaviour rather than creating a new trend. In each case, not withstanding
T = 1200h (where 280 hours had transpired since the last sampling), peak % moisture
loss occurs at the 168 hour mark, with the height of the peak and rate at which the
peak was reached declining as the concentration of the PEG solution increased. This
may suggest that PEG can arrest the initial loss of moisture when the difference
between the moisture content in the wood and the air is at its highest. It can also be
suggested that these different effects are in part due to the moisture loss which
occurred during incubation, and this is in part supported by the overall lack of change
in either moisture or dimensional loss in the samples incubated in 20% PEG (compare
Figures 3.32A and 3.32B). However, previous research (Chapter 2.3 and Stamm
(1956)) indicates that a treatment concentration below 30% (v/v) is insufficient and
this is again supported here. The comparative data sets in Figure 3.32 also show that
tangential and radial shrinkage largely peak at T = 384h except for samples treated
with 50% (v/v) PEG 400. Furthermore, with the exception of samples treated with
50% (v/v) PEG, after average peak tangential and radial shrinkage data points (T =
384h), the next date point shows a decline in drop in both %MC and shrinkage. In the
case of the samples treated with 50% (v/v) PEG 400, %MC loss fell as radial
shrinkage peaked and tangential shrinkage remained elevated (T = 528h). This is an
unexpected result and worthy of further investigation, for although it may support the
171
notion that PEG modifies an existing operation, it is also possible that it is due to an
artefactual effect (such as change in the environmental conditions).
3.5.5.4 Assessment of distortion
Due to anisotropic shrinkage, timber warps, twists and cups during drying. The
method described to give an assessment of distortion is new and has attempted to
provide a method of quantifying the departure from the original sawn shape by
measuring deflection on the longitudinal face. Figure 3.33 shows a marked departure
in the control sample from the original sawn dimension. Mean deflection doubled
from a perfect quadrilateral shape; while there was no statistical difference in the
change in shape for the treated samples, the samples treated with higher concentration
PEG solutions departed less than the samples treated in the 20% solution. This is
clearly another method of confirming the ability of PEG to stabilise timber
dimensions during drying.
3.5.6 Conclusion
This investigation has thoroughly observed and recorded most of the key aspects of
moisture loss and dimensional change in drying E. regnans. The results present a
consistent trend: when air-dried, PEG pre-treatment of timber modifies the manner of
moisture loss, increases dimensional stability, and decreases shrinkage in a manner
that is concentration dependent. While these observations provide the confidence to
consider drying trials of a larger nature (and greater expense), many fundamental
questions are left as yet unanswered and more have come to light because of this
investigation:

172
• Why can samples in solution lose 50% of the moisture content in 96 hours and
not shrink to the same degree that untreated samples would if they lost the
same amount of moisture in the same period of time?
• What, chemically, is occurring to cause the change in the pattern of moisture
loss?
• What is the rate of ingress of higher PEG at higher concentration?
• What is the nature of the interaction between PEG and the cell wall of wood
fibres?
• What other factors may govern the rate of water loss?
With respect to the effect on water loss, it could be that the notion of water activity
may hold some answers. It is the area of effect of PEG on water activity that will be
the area of next investigation.
3.6 An investigation into effects on water activity on drying of Tasmanian Oak
3.6.1 Introduction
The theory of water activity has been described previously (Section 1.8.3). In pure
water, water molecules can break and form hydrogen bonds at a maximum rate of
activity for any given temperature and pressure. The addition of a solute can affect
the rate at which the self-association of water occurs and thus the rate of activity
between water molecules. In pure water, this activity, water activity (aw), is given the
nominal value of 1.000. The dissolving of a solute will have an effect on aw which is
dependent on solute concentration and molecular size and structure. A coefficient can
be determined for any solute whereby the larger the coefficient, the greater effect a
solute can have at a given molar amount.

173
The previous experiment investigated the trend of moisture loss from timber that had
been exposed to varying concentrations (20%, 50%, 80% v/v) of the same chemical
(PEG 400). In terms of water activity (aw) these solutions covered the spectrum of
effects that an increasing concentration can have. This next investigation seeks to
investigate the effects of three chemical treatments where water activity of the
solutions is constant. The chemicals selected for comparison are PEG 400, sucrose
and sodium chloride.
Sucrose (Powell, 1904) and NaCl (Stockhardt, 1848) have a history of use in treating
green timber, the latter used on Tasmanian eucalypt species with poor to moderate
results (Redman, 2000). NaCl and sucrose were chosen for comparison with PEG for
this study due to a) demonstrated history of use in drying green timber, b) lack of
toxicity, c) known water activity K values, d) varying K values, e) and dissimilarity of
compound structure.
If a change in aw is a strong determinant of drying behaviour in Tasmanian Oak, and
the aw of each solution is the same, it might be anticipated that the moisture isotherms
generated from the data during drying would not be significantly different, regardless
of the chemical used. If the isotherms were significantly different, then aw could not
be considered in isolation, or at best only partially considered, as a determinant of
drying behaviour.
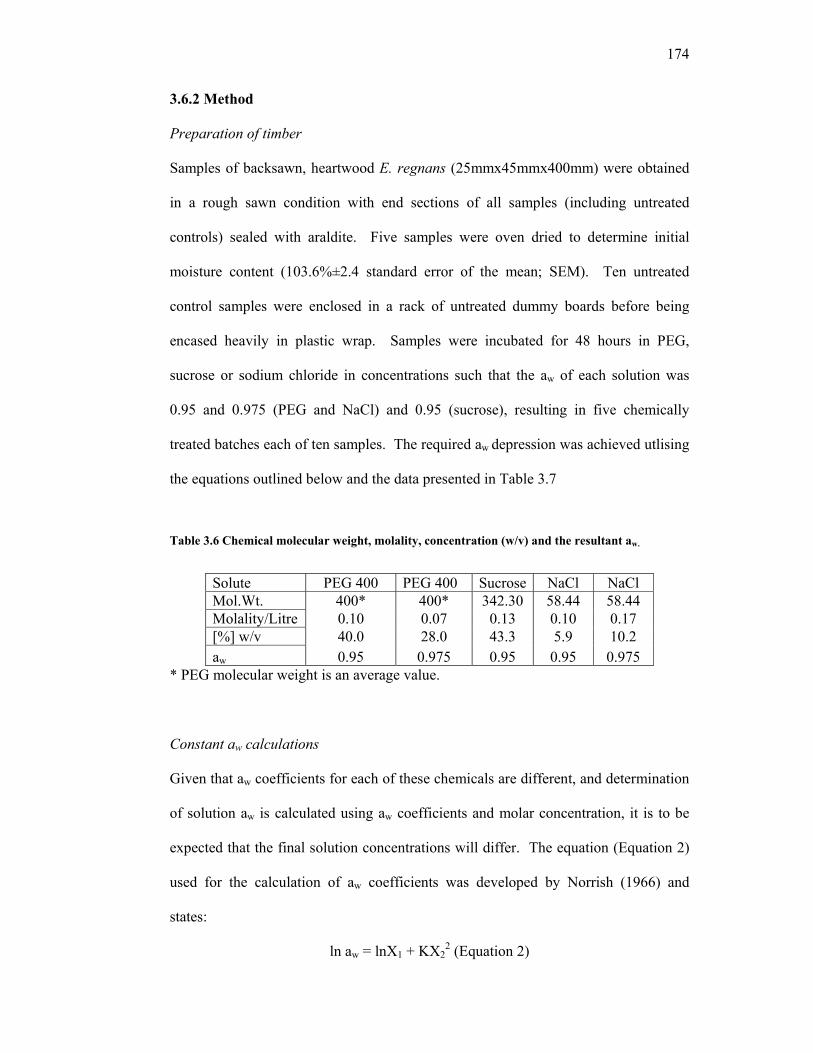
174
3.6.2 Method
Preparation of timber
Samples of backsawn, heartwood E. regnans (25mmx45mmx400mm) were obtained
in a rough sawn condition with end sections of all samples (including untreated
controls) sealed with araldite. Five samples were oven dried to determine initial
moisture content (103.6%±2.4 standard error of the mean; SEM). Ten untreated
control samples were enclosed in a rack of untreated dummy boards before being
encased heavily in plastic wrap. Samples were incubated for 48 hours in PEG,
sucrose or sodium chloride in concentrations such that the aw of each solution was
0.95 and 0.975 (PEG and NaCl) and 0.95 (sucrose), resulting in five chemically
treated batches each of ten samples. The required aw depression was achieved utlising
the equations outlined below and the data presented in Table 3.7
Table 3.6 Chemical molecular weight, molality, concentration (w/v) and the resultant aw.
Solute PEG 400 PEG 400 Sucrose NaCl NaCl Mol.Wt. 400* 400* 342.30 58.44 58.44 Molality/Litre 0.10 0.07 0.13 0.10 0.17 [%] w/v 40.0 28.0 43.3 5.9 10.2 aw 0.95 0.975 0.95 0.95 0.975
* PEG molecular weight is an average value.
Constant aw calculations
Given that aw coefficients for each of these chemicals are different, and determination
of solution aw is calculated using aw coefficients and molar concentration, it is to be
expected that the final solution concentrations will differ. The equation (Equation 2)
used for the calculation of aw coefficients was developed by Norrish (1966) and
states:
ln aw = lnX1 + KX22 (Equation 2)
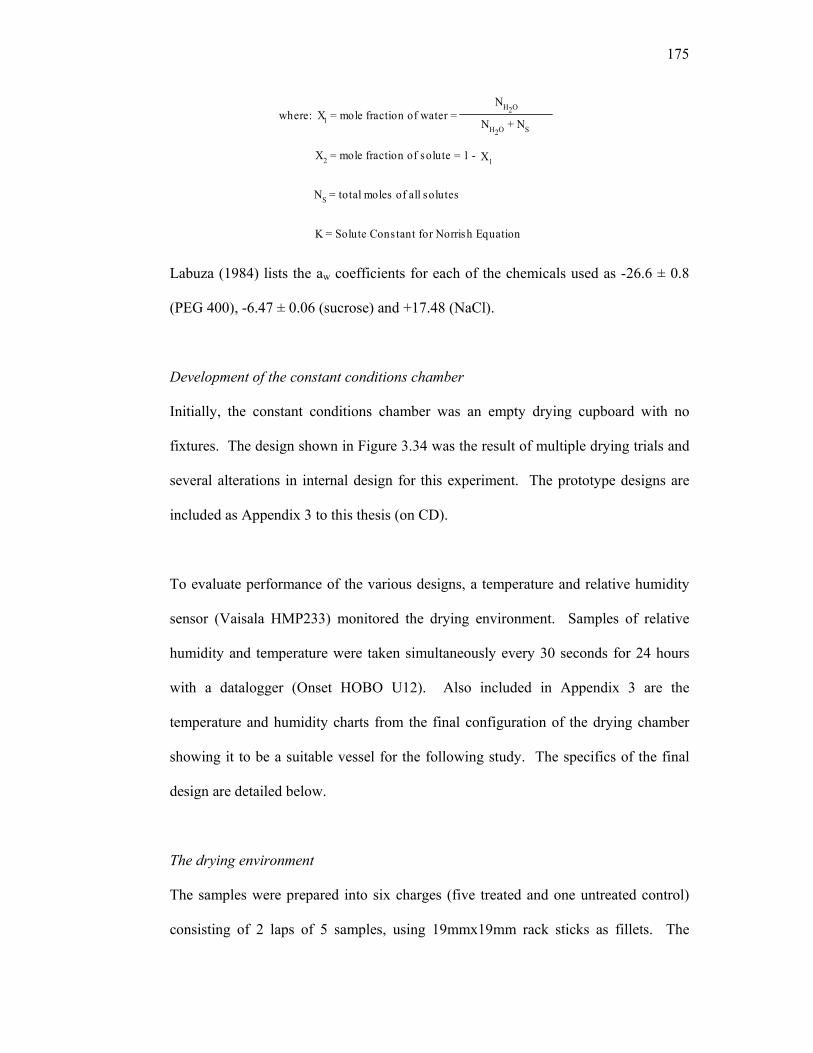
175
where: X1 = mole fraction of water =NH2O2
NH2O2+ NS
NS = total moles of all solutes
X1X2 = mole fraction of solute = 1 -
K = Solute Cons tant for Norrish Equation
Labuza (1984) lists the aw coefficients for each of the chemicals used as -26.6 ± 0.8
(PEG 400), -6.47 ± 0.06 (sucrose) and +17.48 (NaCl).
Development of the constant conditions chamber
Initially, the constant conditions chamber was an empty drying cupboard with no
fixtures. The design shown in Figure 3.34 was the result of multiple drying trials and
several alterations in internal design for this experiment. The prototype designs are
included as Appendix 3 to this thesis (on CD).
To evaluate performance of the various designs, a temperature and relative humidity
sensor (Vaisala HMP233) monitored the drying environment. Samples of relative
humidity and temperature were taken simultaneously every 30 seconds for 24 hours
with a datalogger (Onset HOBO U12). Also included in Appendix 3 are the
temperature and humidity charts from the final configuration of the drying chamber
showing it to be a suitable vessel for the following study. The specifics of the final
design are detailed below.
The drying environment
The samples were prepared into six charges (five treated and one untreated control)
consisting of 2 laps of 5 samples, using 19mmx19mm rack sticks as fillets. The

176
samples were dried in a purpose-built constant conditions chamber of internal
dimension (51cm x 56cm x 116cm) with a light bulb (200W, Thorn Lighting) as a
heat source. The bulb was connected to a thermostat (IP55, Luca) that maintained
temperature at 30°C. An 11.5cm diameter rotary fan (Y8500, Dick Smith) generated
airflow of 4.5ms-1. Timber charges were arranged in vertical alignment on six separate
chrome-plated metal shelves (Figure 3.34).
At 30°C, equilibrium relative humidity (RH) was maintained at 75.09% ± 0.11 with a
saturated solution of NaCl (Greenspan, 1977). Chamber conditions were monitored
with wet and dry bulb thermometers. Conditions were periodically inspected using a
hand-held electronic humidity and temperature probe (HM 34, Vaisala) and
anemometer (PWM, Dwyer Instruments). To ensure equal exposure in the drying
conditions, timber charges were rotated one shelf position on a 12 hourly basis for the
first 10 days, then daily for the next 10 days and at extended periods up to four days
beyond that time.
Data Collection
All samples were weighed at T = -48h (pre-soak), 0 (commence drying), 24, 66, 141,
470, 563 and 634 hours. At each data collection period, samples were weighed on
digital scales (BL3100, Sartorius) with a tolerance to two decimal places of a gram.
To confirm %MC of samples were oven dried (103°C±2°C) at the end of the drying
trial, until no further weight loss occurred.

177
Data Analysis
Moisture loss profiles were prepared from the mean (±SEM) of each sample batch
with each mean the average of 10 sample %MC values. Data was analysed for
significant difference by Student’s t-test (P<0.05) using MS Excel (2002) Data
Analysis Toolpack. Linear regression analysis and values of R2 were determined for
each of the moisture content isotherms to determine a rate of moisture loss.
WD
Saturated NaCl
False Floor
H HWD
B
Baffles
Saturated NaCl
FalseCeiling
ABaffle
HFan Air flow
Heatsource
Control PEG 0.95D WDryBulb
WetBulb PEG 0.975NaCl 0.95
Sucrose 0.95
NaCl 0.975
Figure 3.34. Schematic layout of constant conditions chamber with front view (A) and side view (B).

178
3.6.3 Results
0
25
50
75
100
125
-50 100 250 400 550 700 850
Time (hours)
% M
C
The x-axis intersects with the y-axis at T = -48h which is the beginning of the 48 hour
incubation period. At T = 0h, treated samples were drained and placed into the kiln
with untreated controls. After 634 hours, the drying trial was suspended with average
%MC for each treatment type and untreated control ranging from 11.01%±0.19 SEM
to 14.94%±0.29 SEM. All treated samples showed a higher moisture content after
incubation which resulted in a significantly different %MC at T = 0h than the
untreated control (denoted by *). The similarity of results of treated sample charges is
reflected in the concordance of %MC data throughout the trial.
Figure 3.35 Average moisture content (±SEM) in E. regnans treated with respective aqueous solutions and aw: PEG 0.95 , PEG 0.975 , Sucrose 0.95 , NaCl 0.95 ▲, NaCl 0.975▲, control . * indicates a significant difference (T-test; P<0.05) between data points. Each data point is the mean ±SEM of 10 sample %MC. Hatched line is at Time (Hours) = 0 when sample drying began.
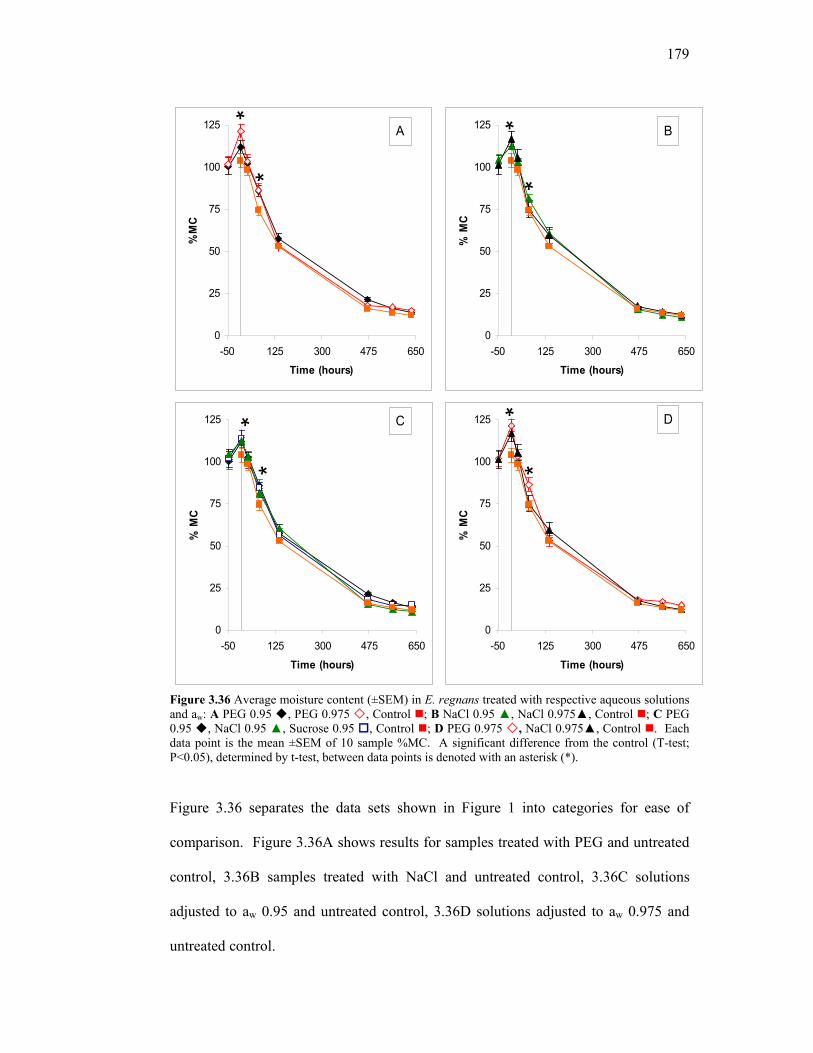
179
0
25
50
75
100
125
-50 125 300 475 650
Time (hours)
%M
C
0
25
50
75
100
125
-50 125 300 475 650
Time (hours)
% M
C
0
25
50
75
100
125
-50 125 300 475 650
Time (hours)
% M
C
0
25
50
75
100
125
-50 125 300 475 650
Time (hours)
% M
C
*
*
*
*
*
**
*
A B
DC
Figure 3.36 Average moisture content (±SEM) in E. regnans treated with respective aqueous solutions and aw: A PEG 0.95 , PEG 0.975 , Control ; B NaCl 0.95 ▲, NaCl 0.975▲, Control ; C PEG 0.95 , NaCl 0.95 ▲, Sucrose 0.95 , Control ; D PEG 0.975 , NaCl 0.975▲, Control . Each data point is the mean ±SEM of 10 sample %MC. A significant difference from the control (T-test; P<0.05), determined by t-test, between data points is denoted with an asterisk (*).
Figure 3.36 separates the data sets shown in Figure 1 into categories for ease of
comparison. Figure 3.36A shows results for samples treated with PEG and untreated
control, 3.36B samples treated with NaCl and untreated control, 3.36C solutions
adjusted to aw 0.95 and untreated control, 3.36D solutions adjusted to aw 0.975 and
untreated control.

180
Table 3.7. Rate of moisture loss (%MC/hour) for each treatment type and untreated control between T = 0h and T = 141h. Rates were determined from linear regression analysis comparing &MC loss against ∆T. R2 describes the observed data that can be explained by respective lines of best fit. Relative %MC is the percentage change in moisture loss rate in the treated samples from the untreated control samples.
Treatment Type
Rate of moisture loss (%MC/hour) R2
Relative %MC
PEG 0.975 0.47 0.989 125.46 NaCl 0.975 0.41 0.926 110.77
Sucrose 0.95 0.39 0.992 106.43 PEG 0.95 0.38 1.000 103.43 Control 0.37 0.976 100.00
NaCl 0.95 0.37 0.981 99.49
3.6.4 Discussion
There was a constant significant difference between the control and treated samples at
T = 0h (Figure 3.35) but this was due to a net inward migration of water from the
solution into the timber. However, the moisture gained during incubation in chemical
solution was essentially lost 24 hours after the commencement of drying and there
was a concordance of %MC between treated samples and untreated control atT = 24h.
It could be suggested that this effect was due to the presence of the treatment
chemical in the samples, but this rate of loss was not maintained after T = 24h, which
implies that the excess moisture may have only been free water and only in the
superficial aspects of the timber samples. More and better assessment of moisture
loss is accomplished when each available category of results is compared separately
against the untreated control samples (Figure 3.36).
What is also apparent in Figure 3.35, and worthy of comment, is the lack of rebound
that was discussed in the previous section (see Figure 3.24). Furthermore, moisture
content increased in the PEG-treated timber samples during soaking whereas sample
moisture content previously decreased. This is quite possibly due to the time of
harvesting (high summer). Although the timber had an IMC of 100%, it could be
181
possible that green %MC was higher and thus a net inward migration of water from
the solution occurred. It is possible that very fresh timber is required to observe the
rebound in moisture content observed in the previous investigation.
Treatment type
Figures 3.36A and 3.36B show the loss of %MC in samples treated with two
concentrations of PEG and NaCl respectively. T-test analysis showed data points
where values where there was significant difference (P<0.05) between treated and
untreated sample means, but only at T = 141h was there a significant difference in
%MC between samples pre-soaked in two concentrations of the same chemical prior
to drying. Two factors may explain the overall lack of difference: a change in water
activity in the incubating aqueous solution from 0.95 to 0.975 was insufficient to
warrant a significant change in moisture content or that the drying conditions were
sufficient to overwhelm any subtle effects that may have been imparted on drying
timber by an adjustment in the aw of the incubating solution. The latter point is not
insignificant when considering that this research is performed with the view of
ultimately providing outcomes in the large-scale kiln drying of flatsawn eucalypt
timber. The conditions used in this drying trial are representative to the conditions
used to dry timber on a commercial scale.
Constant aw
Figures 3.36C and 3.36D show the data sorted by aw of the incubation medium (0.95
and 0.975 respectively). There is a general concordance of results between samples
incubated in solutions where aw= 0.95 which supports the theory that moisture loss is
governed by water activity of the solution and it is for this reason that PEG is used in

182
foodstuffs to prolong shelf life by retarding drying (Cherife & Ferro Fontán, 1980).
The application of that theory into the loss of moisture in timber is more difficult to
prove and hindered by results presented in Figure 3.36D where at one time point (T =
66h), there is a significant difference in %MC between samples incubated in solutions
of same aw (0.975), but different chemical solutions. With these mixed results, it is
perhaps more beneficial to look more at the general trends of moisture loss by
comparing rates of moisture loss between treatment regimes.
Rates of moisture loss
Linear regression analysis provided the information presented in Table 3.7. Most
notable is that samples treated in the solutions designed to have a greater reduction in
aw had lower rates of moisture loss over the first 141 hours of drying. The values for
R2 range from high to very high which supports the efficacy of the values shown.
Water activity decreases with an increase in solute concentration, and thus it is
expected that a greater depression of aw will result in a lower rate of moisture loss
(which has occurred here). However, in most cases, the rate of moisture loss is
increased in the treated samples, which suggests that the effects on aw in solution were
not transferred wholly to the rate of moisture loss in samples incubated in respective
solutions. Despite this, there is moderate to good support of water activity as a
precursor to drying rate as the samples pre-soaked in a solution adjusted to aw=0.975
dried the quickest. As a further contrast, treatment with PEG, which is known and has
been used for the purpose of drying timber (Stamm, 1959a), partially through osmotic
effects, caused the most rapid drying under the current conditions.

183
Chemical structure and concentration
The final factor to consider in these results is the different structures of the chemicals
used: Sucrose is a disaccharide with hydrogen bonding available mainly through eight
hydroxide groups and two oxygen atoms with lone pairs of electrons available; PEG
400 is a polyether diol with the general chemical formula (HO-[CH2CH2O]n-H). The
repeating unit in the chain is an ethoxy group (-CH2CH2O-) and this unit is repeated
on average 8-9 times and bonding with water occurs through the ether oxygen and the
terminal hydroxy groups in an open chain; NaCl is a salt consisting of two charged
species that form ionic bonds with water. Ionic bonds are much more strongly formed
in water than hydrogen bonds which may explain why relatively small concentrations
of NaCl (102g/L) can have a similar impact on aw as a larger amount of PEG
(400g/L). However, it should be noted that molality is a consideration in the Norrish
equation (Norrish, 1966) and that NaCl has a high molality and large K value with
respect to compound molecular weight.
3.6.5 Conclusion
That water activity is reduced in aqueous preparations is not in question, but whether
that effect is transferred into water in wood, more specifically on water exiting the
wood substance through a ‘mesh’ of solute, and thus causing an impact on the rate of
moisture loss has not been supported under the current drying conditions. However,
under more gentle drying conditions, these factors may come into greater prominence.
Considering the different systems operating simultaneously, it could be suggested that
a mixed result is the most ‘expected’ outcome until the question is approached in a
manner such that these factors can be considered in greater isolation.

184
Chapter 4 General Discussion, Recommendations and General Conclusion
4.1 General Discussion & Recommendations
This fundamental aim of this study was to investigate the use of polyethylene glycol
(PEG) in the drying of backsawn Tasmanian Oak. In doing so, the result has been a
tableau of outcomes of both a general (commercial) and esoteric (pure research)
nature. As this project has been a joint project between a learning institution and
private timber research company, that the results exhibit this duality, is consistent
with the aims. From the outset, the research aims have been the servant of two
masters and this is highlighted by the use of the term Tasmanian Oak – a commercial
title for the troika of Tasmanian eucalypt species E. delegatensis, E. obliqua and E.
regnans.
An inclination towards research of a commercial nature can result in outcomes of a
prosaic and generally uninspiring kind, but this is not the case here. The overall
research product has been from the coherent union of pure and applied research with
meaningful outcomes for both fields. Moreover, the recommendations from this
research have varying degrees of academic, methodological and commercial flavour
and this is also reflected in the range of the subject matter covered in published works
generated from this research. Owing to the paucity of recent research into PEG
treatment of timber for commercial use, and the complete absence of any research
with respect to Tasmanian Oak, the research conducted in this thesis had to begin at a
fundamental level. Overview of the key findings is presented in Figure 4.1 and
recommendations for future research in Figure 4.2.

185
Conclusionsfrom this
study
Absorpt ion of P EG by T asmanian Oak isdependent on solut ion concent rat ion,incubat ion t ime and temperat ure, P EGM.W ., densit y of t he t imber.
Migrat ion of P EG int o t imberduring air-drying is negligible.
W ater is lost from t im ber duringincubat ion in PEG in a mannerwhich is concent rat iondependent
Increase in P EG concent rat ionresult s in a lower drying ratein air drying.
T angent ial and radial shrinkage isreduced in sam ples t reat ed withP EG in a dose-relat ed manner
T angent ial shrinkage is reduced to agreat er degree than radial shrinkage.
T he incidence of drying defect isreduced in P EG-t reated t imbercompared to an unt reat ed cont rol
T he use of radial and t angent ial cut t ingpat t erns provides a det ailed assessmentof moist ure loss from t imber charges.
Reduct ion in moist ure loss does notequat e to an increase in dimensionalst abilit y . T he two mechanisms canbe separat e.
T he findings in th is study warrantfurther study for commercial andscient ific outcom es.
Owing t o t he light colour of T asmanianOak, cobalt t h iocyanat e is a superiorst ain to Malaprade-based methods.
Figure 4.1 Overview of key research, methodological and commercial findings in the current body of research.
The staining methods in this research were known reliable methods for the detection
of PEG and had been used to detect PEG in timber. However, due to the light colour
of the timber, the Malaprade-based methods, which relied on the chemistry of iodine
to indicate the presence of PEG in timber, while successful, failed to provide a
definitive picture of PEG deposition. The cobalt thiocyanate method yielded
satisfactory results producing a striking demarcation between timber, which had
absorbed PEG, and that that had not. It is a recommendation of this study that the
cobalt thiocyanate is the staining method of choice for gross and histological
examination for identifying PEG deposition in Tasmanian Oak.
186
With an ability to confidently determine the site of PEG deposition, a method was
developed to observe the rate of PEG penetration in Tasmanian Oak under varying
incubation conditions. Each of the three Tasmanian Oak species showed significantly
different rates of PEG penetration under each of the experimental conditions and the
constant factor involved was the physical property of basic density. Basic density
varies considerably between species and within species and is based on many factors
as diverse as tree age, region of growth, soil type, rainfall and terrain. To draw a far-
sighted conclusion from this early work would be premature. However, it
demonstrates a need for further research in this area to establish norms and guidelines
for predicting the rate of uptake of PEG by Tasmanian Oak. It could be the case that
ultimately it is timber density, and not timber species, which determines the rate of
PEG uptake and thus may affect the manner in which timber species are sorted for
processing.
Historically, Tasmanian Oak has been sold as a mixed species, but it is a more recent
phenomenon that the three species have been mixed during processing. Speciation
can only occur accurately and rapidly while the tree is still standing. Logs were
identified by species and remained separate until the sawn product had been seasoned
and was ready for sale. However, a greater demand for the timber product and a need
to streamline production has given rise to the mixing of Tasmanian Oak prior to
processing. Perhaps a by-product of this study is a reminder that the three species of
Eucalypt are physically different timbers with differing drying characteristics. It is
therefore suggested that trees be speciated faithfully before harvesting, identified and
kept separate throughout processing until ready for sale until a more suitable method
of separation (perhaps based on timber density or some yet to be determined physical

187
property with even greater correlation) is developed. Perhaps sawmills will one day
be fitted with a Coulter-style analyser that sorts logs by density and distributes them
accordingly for downstream processing!
Table 4.1 Future research directions from the current body of research.
Scientific Research Commercial Research
Thorough histological and SEM study of
PEG binding in the cell wall
Small-scale trials with timber of
commercial dimension
Radioligand binding and autoradiography
to elaborate PEG site deposition
Treatment of non-seasoning
species
Continued exploration of the role of
water activity reduction in the action of
PEG in affecting water loss
Investigations of cost-effective
PEG analogues
X-ray diffraction and crystallography to
determine precise orientation of PEG
molecules in wood cell matrix
Co-operation of PEG treatment
with existing chemical timber
treatments
Effects of surface tension reduction by
PEG in preventing collapse
With a measure of PEG penetration in Tasmanian Oak measured accurately, focus
shifted to the manner of PEG migration during air drying after a period of incubation
in a PEG solution. The need for a counter-current mechanism has been indicated in

188
the literature (Loughborough, 1948), which suggested that migration of PEG in drying
timber, would be negligible. The results in the current study have shown this to be the
case. This is significant particularly if norms can be established on the basis of a
given physical property. Ultimately, a simple table could be produced whereby mill
workers could be confidant that ‘timber of species/density X incubated in a PEG
solution of Y concentration at Z temperature for a fixed period of time will result in
penetration of a given distance which will not migrate any further after incubation has
ceased’. Alternatively, ‘to achieve a penetration of X in timber of this
species/density, the following incubation environment and medium is required’. If
this is achieved, significant and easily digestible information will have been derived
from sound scientific observation. The task is then to determine how to achieve these
outcomes with optimum production benefit. However, this painstaking research
would be for nought if there were no indication of an improvement in the quality of
the finished product and/or an increase in the overall log yield. Fortunately, there has
been some evidence indicating that this has occurred.
The investigations into the physical changes in drying timber showed that the
mechanism by which moisture loss is retarded is operating at the same that a different
mechanism is acting on maintaining a sawn dimension. Moisture loss from samples
of E. regnans incubated in a saturated SDS solution showed no significant difference
in moisture loss retardation compared to samples incubated in a PEG solution, yet the
appearance of the timber treated with PEG 400 was much more desirable. Moisture
loss was documented to a high degree through the development of a method of
moisture content analysis through a repeated cutting pattern. Although the samples
dried at the same rate, the resulting dried timber product was dramatically different.
PEG-treated timber remained true to its sawn dimension while the SDS-treated timber
189
was significantly warped and distorted and was similar to the untreated control. This
indicated that the mechanism by which PEG maintained dimensional stability was
associated with the migration of PEG into the wood substance. This conclusion was
drawn from the inability of the largely hydrophobic SDS to penetrate the timber
samples and effect moisture loss retardation by the establishment of a hydrophobic
covering on the timber surface. Previous research had intimated PEG’s mechanism of
action as a replacer of water in the wood cell structure. This is the basis of the use of
PEG in archaeological work where, over time, there is complete penetration of brittle
timbers by PEG, which maintains an artefact’s dimension. However, complete
penetration and replacement of water is not the ultimate goal in seasoning green
timber, yet original sawn dimension was well maintained. An obvious difference
between archaeological and commercial timber is the age and general condition of the
timber, but clearly a mechanism of action is at work in PEG-treated Tasmanian Oak.
The formation of surface checks and other forms of permanent drying defect are
described at length in Chapter 1. The outer regions of a board are more exposed to
the drying environment and dry more quickly than the core. Consequently, the
exterior of the board shrinks before the core can and this generates opposing forces
between the case and core of the board and, if extreme, can produce splitting in the
timber. By coating the surface of the board with PEG, it was shown that the loss of
moisture from the case is reduced and that the moisture loss from each surface of the
board, regardless of position in the timber charge, is more uniform. More concordant
moisture content between the case and core should result in amelioration of opposing
stresses - and hence the dynamic - which yields surface check, is less likely to be
established. By intervening in the initial phase before permanent timber damage

190
(excessive drying of the timber exterior by replacing structural water in the case with
PEG) greatly reduces the severity of drying defect . Greater clarity can be added to
this knowledge by detailed histological, radio ligand and autoradiographic studies and
scanning electron microscopy to better characterise the binding of PEG in the wood
cell structure.
A similar line of investigation would assist in furthering the findings with respect to
maintenance of dimensional stability. PEG-treated samples maintained their original
dimension to a greater degree than SDS and further trials showed that this effect was
increased with increasing PEG concentration in the incubating medium. Due to the
orientation of the longitudinal component of the ray cells being in the radial direction,
wood shrinks more in the tangential direction than the radial direction. This
differential rate of shrinkage in each dimension is the fundamental cause of warping
and cupping of timber during drying. The results from the current study demonstrate
that the presence of PEG in the wood cell matrix causes a greater inhibition of
tangential shrinkage. This could be due to the total number and availability of
binding sites available in the wood cell matrix or the degree of ‘fit’ of the PEG
molecular chain in the tangential dimension. In addition to the aforementioned
cellular and sub-cellular studies, x-ray diffraction and crystallography may assist in
understanding this phenomenon.
A third observation highlighting the difference between treated and untreated timber
was the reduction in collapse. Although usually a temporary phenomenon, severe
collapse can result in permanent degrade. The underlying mechanism of collapse is
not wholly agreed upon, but centres on the effects of surface tension at the pits,
inducing tension in the liquid within the fibres. PEG is a non-ionic surfactant that
191
lowers surface tension. Lovell & Hibbert, (1940) pioneered research into the surface
tension effects of PEG and found that the lowering effect PEG had on surface tension
at higher molecular weights was a function of the logarithm of PEG concentration.
The mechanism which causes a reduction in surface tension by PEG is still a matter of
continuing research Noskov, 1996; Noskov et al., 1998). Investigations into this
subject within the framework of the findings of the current research would not only
add to the current research but perhaps to the theory of cellular collapse in general.
Further research in this area is strongly recommended.
The phenomenon of water activity was investigated as a means to test a potential
mechanism for the effect of PEG on the rate of moisture loss. Water activity (aw) is
the theory at the core of understanding moisture loss in foods and, indeed, there are
food-grade PEG variants in common use. The concluding experimental chapters
yielded moisture isotherms from samples treated with a spectrum of PEG
concentrations (20%, 50% and 80% v/v) and a selection of structurally variant
chemicals (PEG, sucrose, NaCl) prepared in aqueous solutions of comparable aw. The
results (with respect to aw), although not definitive, were tantalisingly suggestive that
there was an association between the rate of moisture loss in timber and the impact of
a solute on the aw coefficient of pure water. This promising preliminary study
certainly warrants further research to understand better the underlying mechanisms
involved.
This research has provided a respectable introduction into many aspects of the nature
of PEG interaction with Tasmanian Oak and provides a series of potential options of
pure and applied scientific endeavour. A deeper understanding of the underlying
mechanisms of action await as does the challenge of continuing to produce
commercially significant results on a larger scale. However, that is the exciting

192
nature of research: to achieve, and in doing so, open the door on what can be
achieved.
4.2 General Conclusion
The timber industry in Tasmania, and the resource available to it, is changing rapidly.
Standard methods and the rules by which generations of timber seasoners had worked
successfully with this natural resource may become outdated as the nature of the
resource changes from old growth timber to younger plantation regrowth. Over the
last 15 years, there have been repeated, large-scale attempts to address this issue by
manipulating the factors, which underpin the methods currently in commercial use for
drying Tasmanian timber. The task has proven difficult to say the least to the point
where quartersawn material can prove highly refractory during drying. An inability to
dry timber cut in this orientation greatly reduces the possibility of drying backsawn
timber. From a commercial standpoint, the research conducted as part of this thesis,
which investigated a technique that had been developed over 60 years ago and largely
discarded for commercial timber purposes, is well timed and necessary.
To complete a significant body of scientific work requires overcoming many
challenges. Perhaps one of the greatest victories of this work is the synergy that has
occurred between highly refined scientific principles and its potential application to
an industrial process that is rudimentary in its execution. Although radical in its
approach, the added cost of a chemical pre-treatment can be absorbed by the industry,
but without initiating best practise in other parts of production, the full potential of
this application may not be realised.
193
Perhaps it is too utopian to foresee ‘harvested logs, covered and shaded at the log
landing before being transported on covered vehicles to a mill where logs are stored
under cover and irrigated until processed along a shaded green chain and protected
until PEG-treated and dried in a kiln’. However, in order to maximise the yield from
this precious resource, it will take more than a revolution of ideas at the kiln door.
For long-term sustainability, each link in the supply chain must be examined with
equal scrutiny.
A man's reach should exceed his grasp, Or what's a heaven for? – Robert Browning

194
References Affifi-Effat, A.M. & Hay, J.N. (1971), End group association in polyethylene oxide, Polym.Lett., 9, 651-655. Aggebrandt, L.G. & Samuelson, O. (1964), Penetration of water soluble polymers into cellulose fibres, J.App.Polym.Sci., 8, 2801-2812. Alma, M.H., Hafizoglu, H. & Maldas, D. (1996), Dimensional stability of several wood species treated with vinyl monomers and polyethylene glycol-1000, Intern.J.Polymeric Mater., 32, 93-99. Atkinson, J. (1826), An account of the state of agriculture and grazing in New South Wales, J.Cross, London. Australian Standard™ (2000), Timber-Hardwood-Visually stress-graded for visual purposes, AS 2082-2000, Standards Australia International Ltd, Strathfield, NSW Australia. Babbitt, J.D. (1942), On the adsorption of water vapour by cellulose, Can.J.Res., 20, Sec.A, No.9, 143-172. Babinski, L. & Poskrobko, J. (2000), Application of HPLC in assessment of two-step impregnation with polyethylene glycols of wooden objects retrieved from archaeological excavations, Conservator-Restorers’ Bulletin, No.4, 99-103. Baechler, R.H. (1959), Improving wood’s durability through chemical modification, For.Prod.J., 9, No.5, 166-171. Baker, R.T. (1913), Cabinet Timbers of Australia, Technical Education Series No.18, Technological Museum of Sydney, Sydney, Australia Baker, R.T. & Smith, H.G. (1912), A research on the eucalypts of Tasmanian and their essential oils, Roy.Soc.Tas: Pap.Proc., 139-206. Bilz, M., Dean, L., Grattan, D.W., McCawley, J.C., McMillen, L. & Cook, C. (1993), A study of the thermal breakdown of polyethylene glycol, Proceedings of the 5th ICOM Group on Wet Organic Archaeological Materials Conference, Portland/Maine, USA Breeden, S. & Breeden, K. (1972), Australia’s South East: A natural history of Australia 2, Collins, Sydney. Brown, W.H. (1989), The conversion and seasoning of wood, Linden Publishing, Fresno, USA. 191 Brownstein, A. (1981), The chemistry of polyethylene glycol, Proceedings of the ICOM Waterlogged Wood Working Group, Ottawa, Canada.

195
Chafe, S.S. (1986), Collapse, volumetric shrinkage, specific gravity and extractives in Eucalyptus and other species Part 1: The shrinkage/specific gravity ratio, Wood Sci. Tech., 20, No.4, 293-307. Chafe, S.S. & Ilic, J. (1990), Shrinkage and collapse in thin sections and blocks of Tasmanian mountain ash regrowth Part I: Shrinkage, specific gravity and the fibre saturation point, Wood Sci. Tech., 26, No.2, 115-129. Chirife, J. & Ferro Fontán, C. (1980), A study of the water activity lowering behaviour of polyethylene glycols in the intermediate moisture range, J.Fd.Sci., 45, 1717-1719. Cooper, P.A., Ung, Y.T., Ma, F.M.S. & Zirk, W.E. (1995), Performance of a new polyethylene glycol (PEG) additive for CCA treated red pine poles, Proceedings of the16th Annual Meeting of the Canadian Wood Preservation Association, Vancouver, B.C. Cross, F.C., Bevan, E.J. & Beadle, C. (1918), Cellulose: An outline of the chemistry of the structural elements of plants, Longmans, Green and Co., London, U.K. Cunningham, P.M. (1827), Two years in New South Wales 2nd Edition, Vol 1., Henry Colburn, London. Curtis, W.M. & Morris, D.I. (1975), The student’s flora of Tasmania 2nd Edition Part I, T.J. Hughes, Tasmania. Dadswell, H.E. (1972), The anatomy of eucalypt woods, C.S.I.R.O., Div.App.Chem.Tech.Paper, No.66, 1-28. Dawson, R.E., Usher, E.G. & Mitchell, H.L. (1962), Stabilized wood gunstocks in Marine Corps marksmanship competition, For.Prod.Lab.Rep., No.2245. Demers, P.A., Boffetta, P., Kogevinas, M., Blair, A., Miller, B.A., Robinson, C.F., Roscoe, R.J., Winter, P.D., Colin, D., Matos, E. &. Vainio, H. (1995), Pooled reanalysis of cancer mortality among five cohorts of workers in wood-related industries. Scand. J. Work Environ. Health, 21, 179-190. Eames, A. J. & MacDaniels, L.H. (1925). An Introduction to Plant Anatomy. McGraw-Hill Book Co. Inc. N.Y. Eaton, R.A. & Hale, M.D.C. (1993), Wood: decay, pests & protection, Chapman & Hall, Melbourne. Elliot, C.S. (1933), A guide to the seasoning of Australian Timbers pt 1, CSIR Pamphlet No. 40. Ellwood, E.L., Ecklund, B.A. & Zavarin, E. (1960), Collapse in wood...exploratory experiments in its prevention, For.Prod.J., 10, No.1, 8-21.

196
Enderby, J.A. (1955), Water absorption by polymers, Trans.Far.Soc., 51, 106-116. Ericks, W.P. (1949), Method for treating cellulose and product thereof, U.S. Patent 2,629,674, U.S. Patent Office. Fardin, P. (2002), Paper and surface chemistry I, Fibre surface and wet end chemistry, TAPPI, 1, 208-213. Fengel, D. & Wegener, G. (1989), Wood: chemistry, ultrastructure, reactions, Walter de Gruyter, New York. Fordyce, R., Lovell, E.L. & Hibbert, H. (1939), Studies relating to Carbohydrates and Polysaccharides. LVI. The synthesis of the higher polyoxyethylene glycols, J.Am.Chem.Soc., 61, 1905-1909. Frey-Wyssling, A. (1943), Weitere untersuchungen über die schwindungsanisotrpic des holzes, Holz als roh- und werkstoff, 7, 197-198 Gilbert, R., Besner, A. & Octeau, P. (1997), Effect of aging and temperature on the resistance to spur penetration in red pine poles treated with CCA-PEG 1000, For.Prod.J., 47, 3, 81-88. Gnamm, H. (1943), Die lösungsmittel und weichhaltungsmittel, Wissenschaftliche Verlagsgesellschaft m.b.H., Stuttgart, Germany. Goltra, W.F. (1913), History of wood preservation, Proceedings of the Ninth Annual Meeting of the A.W.P.A., Chicago, Illinois, January 21-23, 1913, 178-203. Greenhill, W.L. (1936b), The shrinkage of Australian Timbers Part 1 – A new method of determining shrinkage figures for a number of Australian species, C.S.I.R. Div. of For.Prod. Tech. Paper, No. 21, Pamphlet 67. Greenhill, W.L. (1940), The shrinkage of Australian timbers, C.S.I.R. Div. of For.Prod. Tech. Paper, No. 35, Pamphlet 97. Greenspan, L. (1977), Humidity Fixed Points of Binary Saturated Aqueous Solutions, J.Res.Nat. Bureau Stand. A (Physics and Chemistry), 81A, No.1, 89-96. Håfors, B. (1990), The role of the Wasa in the development of the polyethylene glycol preservation method, Adv.Chem.Ser., 225, 195-216. Hermans, P.H. (1949), Physics and chemistry of cellulose fibres, Elsevier Publishing Company, New York. Hill, R.S. & Orchard, A.E. (1999), Composition of endemism of vascular plants, In: J.B. Reid, R.S. Hill, M.J. Brown & M.J. Hovenden (Eds.), Vegetation of Tasmania, Chapter 5, Australian Biological Resources Study, Hobart.

197
Hoadly, R.B. (1990), Identifying Wood: accurate results with simple tools, The Taunton Press, Conneticut, USA. Hoffmann, P. (1983) A rapid detection method for polyethylene glycols (PEG) in wood, Studies in Conservation, 28, 189-193. Hoffmann, P. (1988), On the stabilization of waterlogged oakwood with PEG III: Testing the oligomers, Holzforschung., 42, 289-294. Hon, D.N.-S. & Shiraishi, N. (2001), Wood and Cellulosic Chemistry 2nd Edition, Marcel Dekker, Inc., New York. Hooker, J.D. (1860), Botany of the Antarctic Voyage (Flora Tasmaniae), Vol. I, Part III, Lovell Reeve & Co., London. Ihnat, M. & Goring, D.A.I. (1967a), Shape of the cellodextrins in aqueous solution at 25°C, Can.J.Chem., 45, 2353-2362. Ihnat, M. & Goring, D.A.I. (1967b), Temperature dependence of the shape of the cellodextrins in aqueous solution, Can.J.Chem., 45, 2363-2367. Ilic, J. (1985), A microtome knife sharpening technique for cutting woodsections, C.S.I.R.O, Div.Chem.Wood Tech.Tech.Paper No.4, 1-17. Innes, TC (1996), Pre-drying of collapse prone wood free of surface and internal checking. Holz als Roh- und Werkstoff, 54, No.3, 195-199. Ishimaru, Y. (1976), Adsorption of polyethylene glycol on swollen wood I: molecular weight dependence, J.Jap. Wood Res.Soc., 22, No.1, 22-28. Jahn, E.C. (1959), Report of dimensional stabilisation seminar, U.S. For.Serv.For.Prod.Lab.Rep., 2145. Kauman, W.G. (1966), Cell collapse in wood, CSIRO DFP reprint No.566. King, G. (1960), Theories of multi-layer adsorption, In: J.W.S. Hearle, & R.H. Peters (Eds.), Moisture in Textiles, Butterworths Scientific Publications, London. Kirkpatrick, J.B. & Backhouse, S. (1985), Native Trees of Tasmania, Pandani Press, Hobart. Kjellander, R. & Florin, E. (1981), Water structure and changes in thermal stability of the system poly(ethylene oxide)-water, J.Chem.Soc., Faraday Trans. 1, 77, 2053-2077. Kreicuma, V. & Svalbe, K. (1972), Mechanical characteristics of wood which contains polyethylene glycol, Latv.Lauksaimn.Akad.Raksti., No.65, 63-65.

198
Labuza, T.P. (1984), Moisture sorption: practical aspects of isotherm measurement and use, American Association of Cereal Chemists, USA. Lange, R.T. (1981) Australian Tertiary Vegetation, In: J.M.B. Smith (Ed.), A History of the Australian Vegetation, McGraw-Hill Book Company, Auckland. Lehninger, A.L., Nelson, D.L. & Cox, M.M. (1993), Principles of Biochemistry 2nd Edition, Worth Publishers, New York. Lewin, D.W. (1906), The Eucalypti hardwood timbers of Tasmania, Gray Brothers, Hobart, Tasmania. Loughborough, W.K. (1948), Chemical Seasoning: its effectiveness and present status, U.S. For.Serv.For.Prod.Lab.Rep., D1721. Lourenco, M.A.-V, (1859), Éther intermédiaire du glycol, Compt.rend., 49, 619-620. Lovell, E.L. & Hibbert, H. (1940), Studies on reactions relating to carbohydrates and polysaccharides. LXIII. The surface tensions of aqueous solutions of polyoxyethylene glycols, J.Am.Chem.Soc., 62, 2144-2148. Mackay, J.F.G. (1972), The occurrence, development and control of checking in Tasmanian Eucalyptus obliqua, Holzforschung, 26, No.4, 121-124. Malaprade, L. (1928), Action des polyalcools sur l’acide periodique: Application analytique, Bull.Soc.Chim., (4) 43, 683-696. McMillin, C.W. (1963), Dimensional stabilization with polymerizable vapor of ethylene oxide, For.Prod.J., 13, No.2, 56-61. Mitchell, H.L. (1966), Notes on the treatment of wood with polyethylene glycol, U.S. For.Serv.Res.Note, FPL-06. Mitchell, H.L. & Wahlgren, H.E. (1959), New chemical treatment curbs shrink and swell of Walnut gunstocks, For.Prod.J., 9, 12, 437-441. Mo och Domsjö Aktiebolag (1952), Sätt att konservera trä, Swedish Patent 157,302 (October 10th, 1952), Patent och Registereringsverket. Mo och Domsjö Aktiebolag (1956), Improvements in or relating to the preservation of wood, U.K. Patent 756,685 (September 5th, 1956), British Patents Office. Morén, R.E. (1964), Some practical applications of polyethylene glycol for the stabilisation and preservation of wood, Technical Information, mo och Domsjö Aktie Bolag, Örnsköldsvik, No.82. Morgan, D. (1981), Biological Science: the web of life 3rd Edition, Australian Academy of Science, Canberra.

199
Noack, D. (1961), Physik, Holzals Roh –und Werkstoff, 16, 35. Norrish, R.S. (1966), An equation for the activity coefficients and equilibrium relative humidities of water in confectionary syrups, J.Fd.Technol., 1, 25-39. Northington, D.K. & Goodin, J.R. (1984), The Botanical World, Times Mirror/Mosby, Toronto. Northway, R. (2001), Controlled drying of eucalypt timber, Proceedings of the 27th Forest Products Research Conference, 2001, Victoria, Australia. Noskov, B.A. (1996), Fast adsorption at the liquid-gas interface, Adv. Colloid Interface Sci., 69, 63-129. Noskov, B.A., Akentiev, A.V., Alexandrov, D.A., Loglio, G. & Miller, R. (1998), Dynamic surface elasticity of aqueous solutions of polyethylene glycol, Medeleev Communications, Electronic Version, Issue 5, 169-205. Page, I.H. (1927), Ethylene glycol - a pharmacological study, J.Pharm.Exp.Ther., 30, No.3, 313-320. Page, I.H. & Cryllos, P. (1926), Isoamyl ethyl barbituric acid (amytal) its use as an intravenous anesthetic, J.Pharm.Exp.Ther., 27, No.3, 189-200. Pang, J.T.T. (1981), The treatment of waterlogged oak timbers from a 17th century Dutch East Indiaman, Batavia, using polyethylene glycol, ICOM Committee for Conservation 6th triennial meeting, Ottawa. Pankevicius, E.R. (1960), Recent studies on collapse, CSIRO Forest Products Newsletter, No.260, 7-8. Parrent, J.M. (1985), The conservation of waterlogged wood using sucrose, Studies in Con., 30, 63-72. Perry, L. & Hibbert, C. (1936), Can.J.Research, B14, 77-83. Porter, R.D. & de Hoedt, S.J. (1987), Training Manual 22-1, Timber Technology: Wood Properties, National Timber Industry Training Committee, Australian Government Publishing Service, Canberra. Powell, W. (1904), Volcanized wood and process of vulcanizing same, U.S. Patent 755,240 (March 22nd, 1904), Official Gaz. U.S. Pat. Office., 109, 917. Prager, S. & Long, F.A. (1951), Diffusion of hydrocarbons in polyisobutylene, J.Am.Chem.Soc., 73, 4072-4075. Ralph, J.F. (2006), PEG penetration and the effects of PEG pretreatment in air-dried Eucalyptus, Wood.Fib.Sci. 38, No.1, 139-143.

200
Ralph, J.F. & Edwards, S.J. (2004), PEG penetration in three commercially important Tasmanian Eucalypts, Wood Fib.Sci., 36, No.4, 611-619 Redman, A.L. (2000), Improving quality of seasoned Tasmanian eucalypt timbers, Masters Thesis (Eng.Sci.), University of Tasmania. Rees, D.A. & Skerrett, R.J. (1968), Conformational analysis of cellobiose, cellulose and xylan, Carbohyd.Res., 7, 334-348. Richardson, B.A. (1993), Wood Preservation 2nd Edition, E & F.N. Spon, Melbourne. 53, 145. Rietz, R.C. (1969), Dip treatment in polyethylene glycol not effective in preventing surface checking, U.S.D.A. For.Ser. Res. Note FPL-0204, February 1969, 1-6. Ritter, G.J. & Kurth, E.F. (1933), Holocellulose, Total Carbohydrate Fraction of Extractive-Free Maple Wood, Ind.Eng.Chem., 25, No.11, 1250-1253. Rowell, R.M. (1999), Wood as an engineering material, For.Prod.Lab.Gen.Tech.Rep., No.113, 19:1-19:15. Rozsa, A. (2000), Drying of native hardwoods Australian research since 1980, FWPRDC/Hardwood Sector tammDrying Workshop, September 2000 Salvage, T. (1970), The identification of polyethylene glycols and propylene glycols by thin-layer chromatography, Analyst, 95, 363-365. Sauer, B.B. & Yu, H. (1989), Adsorption Kinetics of Poly(ethylene oxide) at the Air/Water Interface, Macromolecules, 22, 786-791. Schaffner, R.D. (1981), Fundamental aspects of timber seasoning, Masters Thesis (Eng.Sci.), University of Tasmania. Schneider, A. (1969), Dimensional stabilisation of wood with polyethylene glycol I: basic investigations, Holz. Roh- Werkst, 27, No.6, 209-224. Schneider, A. (1970), Dimensional stabilisation of wood with polyethylene glycol I: basic investigations, Holz. Roh- Werkst, 28, No.1, 20-34. Schniewind, A.P. (1963), Mechanism of check formation, For.Prod.J., 13, No.11, 475-480. Sheppard, S.E. & Newsome, P.T. (1934), The sorption of water by cellulose, Ind.Eng.Chem., 26, No.3, 285-290. Sjöström, E. (1993), Wood chemistry: fundamentals and applications 2nd Edition, Academic Press Inc., Sydney.

201
Spielman, P. (1980), Working green wood with PEG, Sterling Publishing Co., New York. 21, 22 Stamm, A.J. (1934), Effect of inorganic salts upon the swelling and shrinkage of wood, J.Am.Chem.Soc., 56, 1195-1204. Stamm, A.J. (1935), Shrinking and swelling of wood, Ind.Eng.Chem., 27, No.3, 401-406. Stamm, A.J. (1937), Treatment with Sucrose and Invert Sugar, Ind.Eng.Chem., 29, 7 833-835. Stamm, A.J. (1946), Modified Woods, Am.Wood Pres.Assoc.Proc., 42, 150-167. Stamm, A.J. (1956a), Thermal degradation of wood and cellulose, Ind.Eng.Chem., 48, 413-417. Stamm, A.J. (1956b), Dimensional stabilization of wood with Carbowaxes, For.Prod.J., 6, No.5, 201-204. Stamm, A.J. (1959a), Bound-water diffusion into wood in the fiber direction, For.Prod.J., 9, No.1, 27-32. Stamm, A.J. (1959b), Effect of polyethylene glycol on the dimensional stability of wood, For.Prod.J., 9, No.10, 375-381. Stamm, A.J. (1959c), Toward a new and better means of dimensionally stabilising wood, For.Prod.J., 9, No.3, 107-110. Stamm, A.J. (1964a), Wood and cellulose science, Ronald Press Company, New York. Stamm, A.J. (1974), Dimensional stabilisation of wood with water soluble fire-retardant bulking chemicals compared with polyethylene glycol-1000, Wood Sci.Tech., 8, 300-306. Stamm, A.J. & Hansen L.A. (1937), Minimizing wood shrinkage and swelling: effect of heating in various gases, Ind.Eng.Chem., 29, 831-833. Stamm, A.J. & Harris, D.M.(1953), Chemical processing of wood, Chemical Publishing Co., Inc., N.Y. Stamm, A.J. & Loughborough, W.K. (1942), Variation in shrinking and swelling of wood, Trans.Am.Soc.Mech.Eng., 64, No.4, 379-386. Stockhardt, M.J.A. (1848), On the preservation of wood, Artizan, Vol.2, 3rd Series, 73-74. Sugiyama, M., Obataya, E. & Norimoto, M. (1995), Viscoelastic relaxation of chemically treated woods, Wood Res., 82, 31-33.

202
Tarkow, H. (1959), General summary of the FPL wood stabilization seminar, For.Prod.J., 9, No.3, 110-112. Tarkow, H., Feist, W.C. & Southerland, C.F. (1966), Interaction of wood with polymeric materials: penetration versus molecular size, For.Prod.J., 16, No.10, 61-65. Tarkow, H. & Southerland, C. (1964), Interaction of wood with polymeric materials I: nature of the adsorbing surface, For.Prod.J., 14, No.4, 184-186. Tiemann, H.D. (1906), Effect of moisture upon the strength and stiffness of wood, USDA Forest Bulletin, No.70. Tiemann, H.D. (1915), The effect of different methods of drying on the strength of wood, Lumber World Rev., 28, No.7, 10-11. Timell, T.E. (1964), Wood hemicelluloses: Part I, Adv.Carbohydr.Chem., 19, 247-302. Trumble, W.P. & Messina, E.E. (1985), CCA-PEG pole preservative research, Proc. Am. Wood Pres.Assoc., 81, 203-217. Turnbull, R.F., Thomas, A.J. & Hutchison, F.E. (1938), Gading studies in “Ash” Eucalypts, C.S.I.R. Div. of For.Prod. Tech. Paper, No. 26, Pamphlet 76. Union Carbide (1999), Carbowax® Polyethylene Glycols and Methoxypolyethylene Glycols 9th Edition, Union Carbide Corporation, Conneticut, USA. 2 Urquhart, A.R. (1929), The mechanism of the absorption of water by cotton, J.Textile Ind., 20, T125-T132. Vandenbeld, J. (1988), Nature of Australia: a portrait of the island continent, William Collins and ABC Enterprises, Sydney. Van der Hoeve, J.A. (1948), Analysis of textile auxiliary products, Rev.Trav.Chim.Pays-Bas., 67, 649-665. Venkateswaran, A. (1970), Sorption of aqueous and nonaqueous media by wood and cellulose, Chem.Rev., 70, No.6, 619-637. Walker, J.C.F., Butterfield, B.G., Langrish, T.A.G., Harris, J.M. & Uprichard, J.M. (1993). Primary Wood Processing. Chapman and Hall, London. Waterson, G.C. (Ed.) (1997), Australian Timber Seasoning Manual 3rd Edition, Australian Furnishing Research Development Institute, Launceston. White, Esq., J. (1790), Journal of a Voyage to New South Wales, London.
203
Wiggins, P.M. (1990), Role of water in some biological processes, Microbiol.Rev., 54, 432-449. Wurtz, C.A. (1859), Mémoire sur les glycools ou alcools diatomiques, Ann.Chim., 1v, 400-418. Young, G.S. & Wainwright, I.N.M. (1981), Polyethylene glycol treatments for waterlogged wood at the cell level, Proceedings of the ICOM waterlogged wood working group conference, Ottawa, Canada, 107-114. Zacharin, R.F. (1978), Emigrant Eucalypts: gum trees as exotics, Melbourne University Press, Melbourne.