CHEMICAL REACTION HAZARDS & THERMALLY UNSTABLE...
24
CHEMICAL REACTION HAZARDS & THERMALLY UNSTABLE SUBSTANCES A Strategic Guide to Reaction Hazard Assessment
Transcript of CHEMICAL REACTION HAZARDS & THERMALLY UNSTABLE...
CHEMICAL REACTION HAZARDS & THERMALLY UNSTABLE SUBSTANCESA Strategic Guide to Reaction Hazard Assessment
12 1
©2016 DEKRA Insight. All rights reserved.
DEKRA Insight 113 Campus Drive, Princeton, NJ 08540, USATel: 609 799 4449 Email: [email protected]
Website: www.chilworth.comWebsite: www.dekra-insight.com
Acknowledgements: Dr Stephen Rowe, Dr Andy Starkie
ContentIntroduction 5 What is the Hazard? 6 What is the impact of Scale-Up and why is it so Important? 6
The Process Lifecycle Approach to Reaction Hazards Testing 8 Process Lifecycle Activities 8 Chemical route selection 8 Process development and optimization 8 Pilot (small) scale production 9 Large scale production 9
Chemical Route Selection 11 Background 11 What do we need to know? 11 How can we do it? 11 What decisions can be made? 14
Process Development and Optimization 15 Background 15 What do we need to know? 15 How can we do it? 15 Assessment of explosive properties 15 Assessment of thermal stability 16 Characterizing the Normal Reaction 18 Conclusions – Route Selection, Process Development and Optimization 20
Pilot or Small Scale Production 21 Background 21 What do we need to know? 21 How can we do it? 22 Hazardous Scenario Identification 22 Identifying the Consequences of Hazardous Scenarios 23 Experimental Simulation - the use of Adiabatic Calorimetry in the assessment of potential process deviations 23 Specify and Implement Safety Measures 25 What decisions can be made? 25
Large Scale Production 26
Summary 27
Appendix – Test Descriptions 28 A.1 Differential Scanning Calorimetry 28 A.2 Carius (10 g) Tube Screening Test 29 A.3 Accelerating Rate Calorimetry (ARC) 30 A.4 Heat Flow Calorimetry (Mettler Toledo RC1 Reaction Calorimeter) 31 A.5 Adiabatic Pressure Dewar Calorimetry 32 A.6 Micro-reaction Calorimetry 35 A.7 Vent Size Package 2 36
32 3
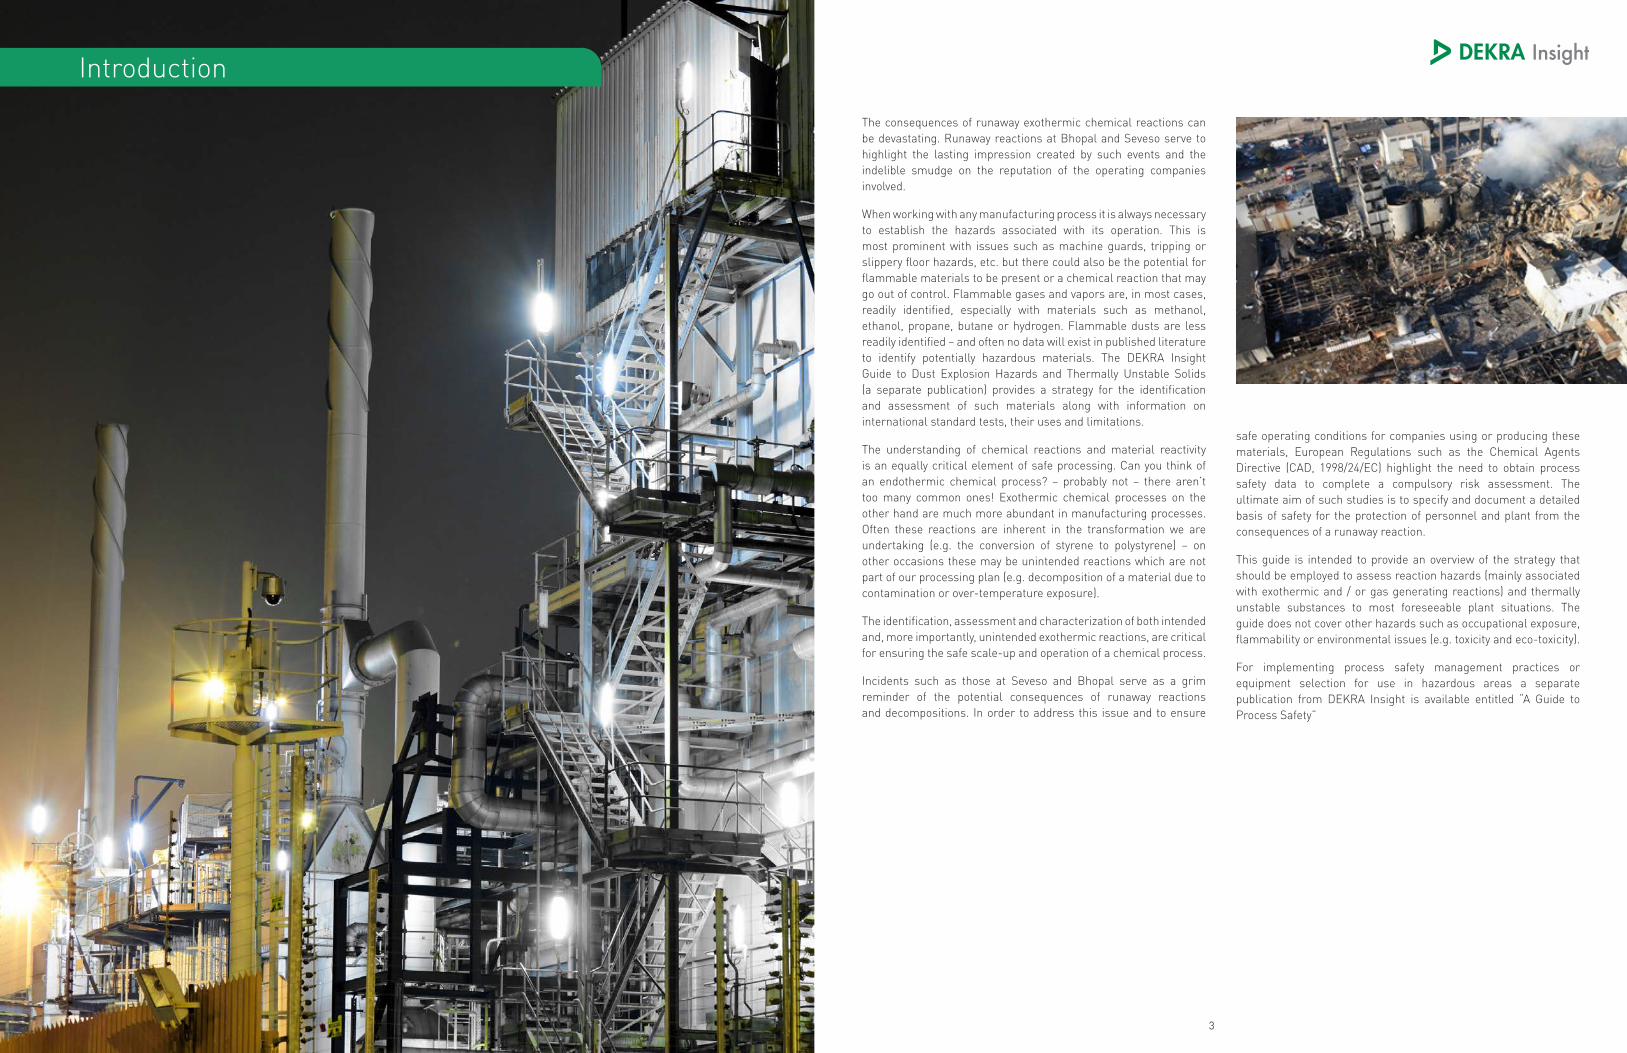
The consequences of runaway exothermic chemical reactions can be devastating. Runaway reactions at Bhopal and Seveso serve to highlight the lasting impression created by such events and the indelible smudge on the reputation of the operating companies involved.
When working with any manufacturing process it is always necessary to establish the hazards associated with its operation. This is most prominent with issues such as machine guards, tripping or slippery floor hazards, etc. but there could also be the potential for flammable materials to be present or a chemical reaction that may go out of control. Flammable gases and vapors are, in most cases, readily identified, especially with materials such as methanol, ethanol, propane, butane or hydrogen. Flammable dusts are less readily identified – and often no data will exist in published literature to identify potentially hazardous materials. The DEKRA Insight Guide to Dust Explosion Hazards and Thermally Unstable Solids (a separate publication) provides a strategy for the identification and assessment of such materials along with information on international standard tests, their uses and limitations.
The understanding of chemical reactions and material reactivity is an equally critical element of safe processing. Can you think of an endothermic chemical process? – probably not – there aren’t too many common ones! Exothermic chemical processes on the other hand are much more abundant in manufacturing processes. Often these reactions are inherent in the transformation we are undertaking (e.g. the conversion of styrene to polystyrene) – on other occasions these may be unintended reactions which are not part of our processing plan (e.g. decomposition of a material due to contamination or over-temperature exposure).
The identification, assessment and characterization of both intended and, more importantly, unintended exothermic reactions, are critical for ensuring the safe scale-up and operation of a chemical process.
Incidents such as those at Seveso and Bhopal serve as a grim reminder of the potential consequences of runaway reactions and decompositions. In order to address this issue and to ensure
safe operating conditions for companies using or producing these materials, European Regulations such as the Chemical Agents Directive (CAD, 1998/24/EC) highlight the need to obtain process safety data to complete a compulsory risk assessment. The ultimate aim of such studies is to specify and document a detailed basis of safety for the protection of personnel and plant from the consequences of a runaway reaction.
This guide is intended to provide an overview of the strategy that should be employed to assess reaction hazards (mainly associated with exothermic and / or gas generating reactions) and thermally unstable substances to most foreseeable plant situations. The guide does not cover other hazards such as occupational exposure, flammability or environmental issues (e.g. toxicity and eco-toxicity).
For implementing process safety management practices or equipment selection for use in hazardous areas a separate publication from DEKRA Insight is available entitled “A Guide to Process Safety”
Introduction
54
Box 1: A Simple Example of the Impact of Scale
The impact of scale on thermal inertia (phi factor) and heat loss can be demonstrated by comparing two cylindrical metal vessels containing an aqueous mixture at 80°C both in an environment with an ambient temperature of 20°C. The heat loss of the metal is assumed to be 10 W.m-2.K-1, the vessel walls are 5 mm thick on each and the density of the metal is 7800 kg.m-3 (heat capacity = 0.5 kJ.kg-1.K-1)
Laboratory scale vessel (1 liter capacity)
• surface area is calculated to be 0.058 m2 (V/SA ratio = 0.017)• heat loss is calculated to be 34.8 W.kg-1• the mass of the vessel is estimated to be 1.92 kg compared with a batch mass of 1kg• the phi factor is calculated to be 1.23 (i.e. 19% of the heat is consumed in heating the reactor)
Pilot scale vessel (1000 liter capacity)
• surface area is calculated to be 5.8 m2 (V/SA ratio = 0.17)• heat loss is calculated to be 3.48 W.kg-1• the mass of the vessel is estimated to be 178 kg compared with a batch mass of 1000 kg• the phi factor is calculated to be 1.021 (i.e. 2.1% of the heat is consumed in heating the reactor)
Summary
• Heat losses are 10 times higher in the lab scale vessel• Only 2% heat loss to the large scale vessel compared with 19% heat loss to the small scale vessel• The effects of scale are real – and very significant!
So why introduce the effects of scale in a guide to testing? Well, if laboratory studies are to provide directly scalable results, tests must be conducted in a manner which reflects the heat losses of the large scale vessel.
Classical laboratory reactor systems are inadequate in providing this data as they typically have high heat losses and a high phi factor. As a consequence specialist equipment is required to simulate large scale conditions. Some tests outlined in this guide are preliminary screening tests which do not adequately simulate
the large scale conditions. In these cases, the results must be interpreted with adequate safety margins. Other tests, specifically adiabatic test techniques, are designed to directly simulate large scale heat loss conditions and will require minimal safety margins when the experimental data is analyzed.
In interpreting any thermal hazards data, the nature of the test must be known. This guide indicates which tests can be used directly and for those that cannot, safety margins are proposed for safe application.
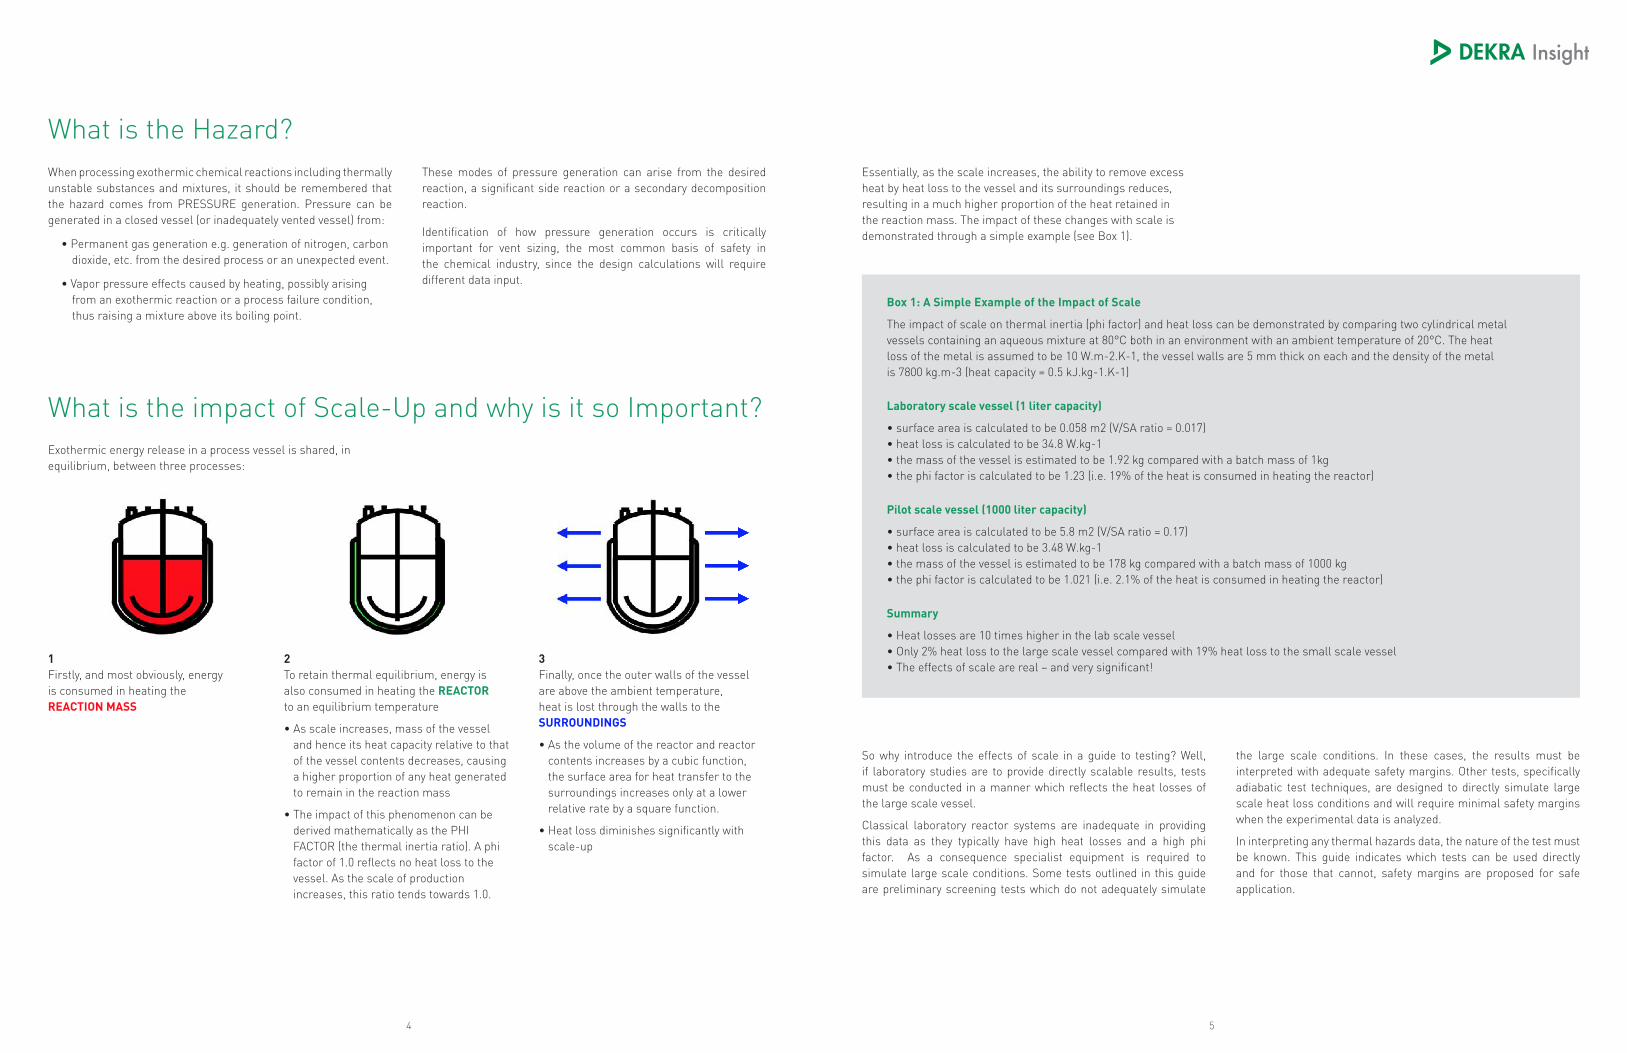
Exothermic energy release in a process vessel is shared, in equilibrium, between three processes:
What is the impact of Scale-Up and why is it so Important?
Essentially, as the scale increases, the ability to remove excess heat by heat loss to the vessel and its surroundings reduces, resulting in a much higher proportion of the heat retained in the reaction mass. The impact of these changes with scale is demonstrated through a simple example (see Box 1).
1 Firstly, and most obviously, energy is consumed in heating the REACTION MASS
2 To retain thermal equilibrium, energy is also consumed in heating the REACTOR to an equilibrium temperature
• As scale increases, mass of the vessel and hence its heat capacity relative to that of the vessel contents decreases, causing a higher proportion of any heat generated to remain in the reaction mass
• The impact of this phenomenon can be derived mathematically as the PHI FACTOR (the thermal inertia ratio). A phi factor of 1.0 reflects no heat loss to the vessel. As the scale of production increases, this ratio tends towards 1.0.
3 Finally, once the outer walls of the vessel are above the ambient temperature, heat is lost through the walls to the SURROUNDINGS
• As the volume of the reactor and reactor contents increases by a cubic function, the surface area for heat transfer to the surroundings increases only at a lower relative rate by a square function.
• Heat loss diminishes significantly with scale-up
When processing exothermic chemical reactions including thermally unstable substances and mixtures, it should be remembered that the hazard comes from PRESSURE generation. Pressure can be generated in a closed vessel (or inadequately vented vessel) from:
• Permanent gas generation e.g. generation of nitrogen, carbon dioxide, etc. from the desired process or an unexpected event.
• Vapor pressure effects caused by heating, possibly arising from an exothermic reaction or a process failure condition, thus raising a mixture above its boiling point.
What is the Hazard?These modes of pressure generation can arise from the desired reaction, a significant side reaction or a secondary decomposition reaction.
Identification of how pressure generation occurs is critically important for vent sizing, the most common basis of safety in the chemical industry, since the design calculations will require different data input.
76
Reaction hazards assessment comprises of a number of experimental and other assessment procedures and tools which ultimately fit together to provide a basis of safety for any chemical process. This “basis of safety” is the implemented and documented system that is in place to either prevent a process running out of control under normal and foreseeable conditions or provide engineering solutions to control the consequences of run-away process. It is clear that a lack of a strategic methodology in the study of a process can yield an incomplete assessment which compromises the safety of the operation. This guide provides a strategic methodology for assessment which is linked to the process development lifecycle, whether you are at the point of chemical route or pilot scale production stage, it possible to dip into the guide and identify which aspects should be addressed.
The guide will provide information on:
• What type of safety studies should be conducted and at what stage of the process lifecycle.
• Provide a perspective on the type of decisions that can be made, based on the data obtained.
The process lifecycle can be considered to comprise of a number of discrete activities. These are:
Chemical route selection• Having identified a target molecule, research chemists are tasked with responsibility for identifying potential chemical routes which could be employed to synthesis the target. Factors classically considered are:
o the synthetic specialty of the company (i.e. existing chemistries already employed)
o the cost of raw materials
o the complexity of the synthetic route
• At this stage, the selected route will have inherent hazards. The safety of various route options can readily be screened and this should be used as one of the criteria in final route selection. The target should be to make the selected route as inherently safe as possible.
Process development and optimization• R&D chemists will be tasked with responsibility for developing and optimizing the selected chemical routes. Typically, routes are optimized to:
o Maximize yield
o Maximize quality
o Maximize throughput
o Minimize the hazard
• Critical decisions which affect the safety of the process are made at this stage. For example, the inclusion of a catalyst could reduce a process temperature from 150°C to 50°C thus providing an element of inherent safety.
The Process Lifecycle Approach to Reaction Hazards Testing
Process Lifecycle Activities
98
• Safety data should be collected at this stage so that safety becomes an integral factor in the development process (rather than an inconvenient “add-on” at the end). The collection of good quality safety data can often indicate areas where quality, yield or throughput can be improved.
• It is critical that R&D chemists have a strong knowledge of reaction and instability hazards so that they can contribute to the development of safe processes – safety should not be considered the chemical engineers domain alone!
• Sufficient safety data must exist at the end of this stage so that a basis of safety for pilot (or other small) scale production can
be defined and specified.
Pilot (small) scale production• At this scale, confirmation is sought that the chemical process is robust and functions as required to provide adequate quality, yield and throughput. Minor adjustments are often made at this stage to ensure optimum process performance.
• It should be confirmed that the safety requirements as previously specified, are operating effectively and efficiently.
• An examination of the large scale production facility is required prior to final scale-up. Classically, this may entail a HAZOP study or similar hazard identification exercise. For all foreseeable and credible process deviations, a basis of safety must exist.
Large scale production• Assuming previous stages have been completed thoroughly, large scale production should proceed smoothly. However, for products which are maintained in the company’s portfolio for many years, it is unlikely that the process, or plant, will remain unchanged (hence the need for adequate change control procedures).
• Any minor changes to either the plant or process should be systematically reviewed with regard to their impact on the safety of the process. Documentary evidence in support of these reviews should be retained.
• Throughout the whole process lifecycle, information retention and accessibility is critical. Documented evidence should exist to show that development and safety processes have been followed. This will also allow easy collation of information to assess the impact of any changes.
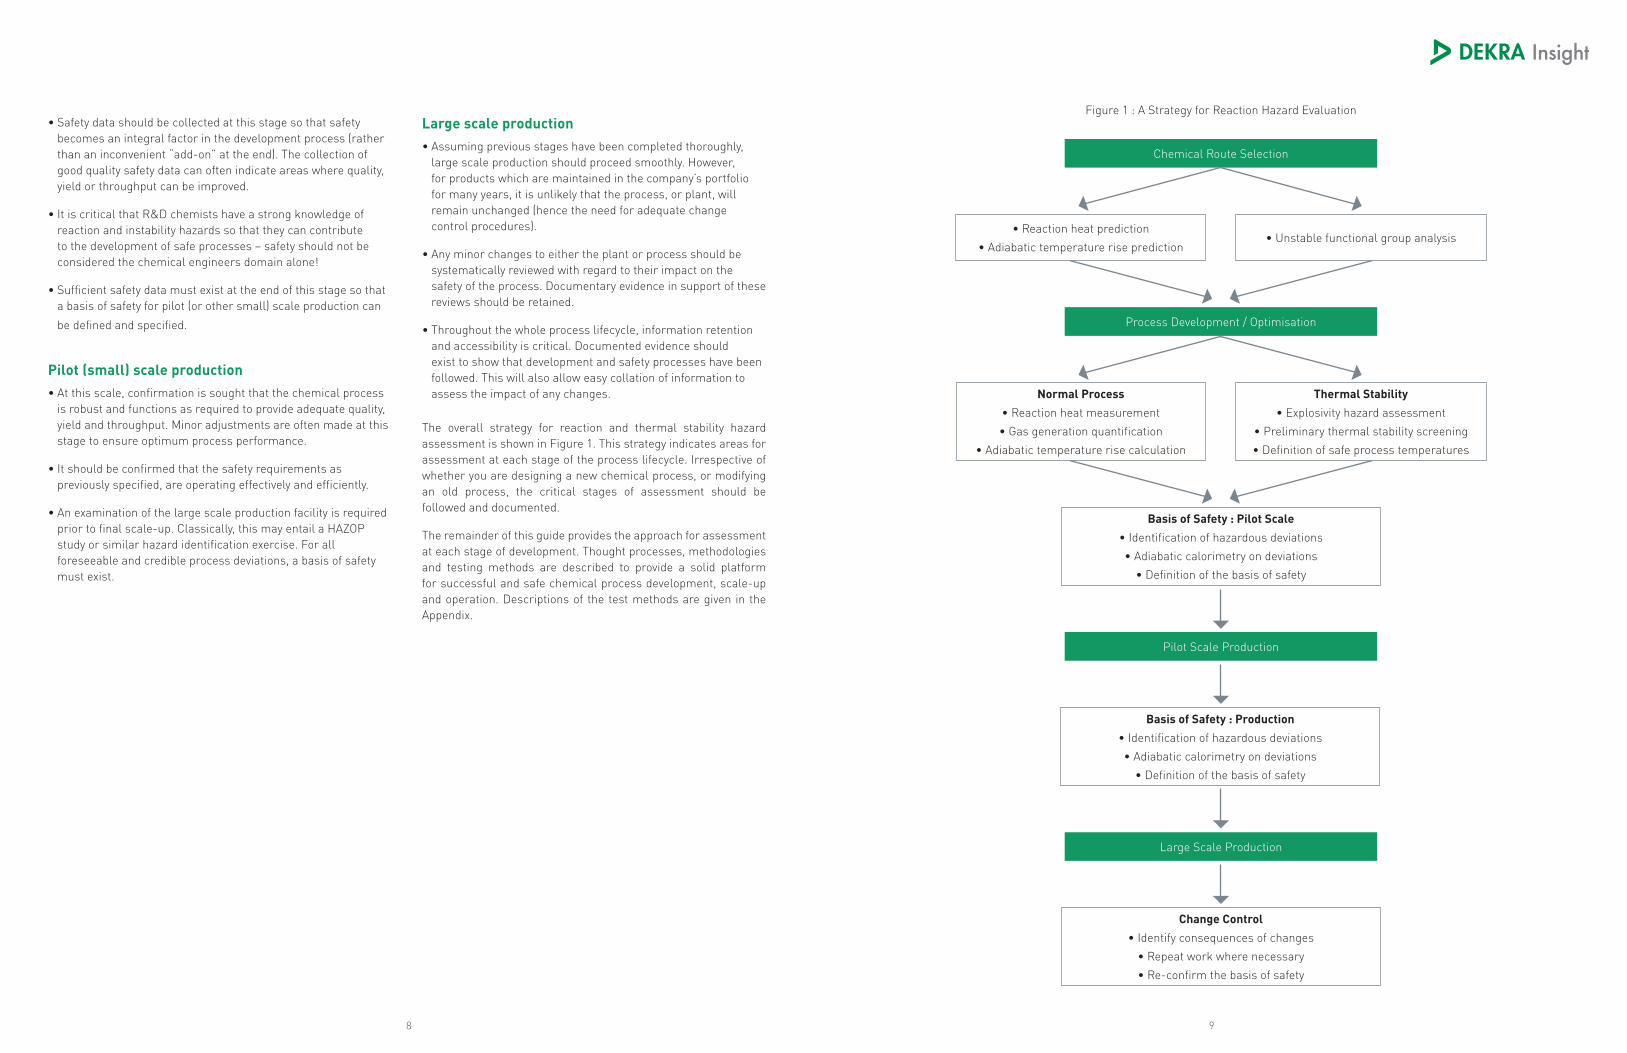
The overall strategy for reaction and thermal stability hazard assessment is shown in Figure 1. This strategy indicates areas for assessment at each stage of the process lifecycle. Irrespective of whether you are designing a new chemical process, or modifying an old process, the critical stages of assessment should be followed and documented.
The remainder of this guide provides the approach for assessment at each stage of development. Thought processes, methodologies and testing methods are described to provide a solid platform for successful and safe chemical process development, scale-up and operation. Descriptions of the test methods are given in the Appendix.
Figure 1 : A Strategy for Reaction Hazard Evaluation
Chemical Route Selection
Process Development / Optimisation
Pilot Scale Production
Large Scale Production
• Reaction heat prediction
• Adiabatic temperature rise prediction
Normal Process• Reaction heat measurement
• Gas generation quantification
• Adiabatic temperature rise calculation
Basis of Safety : Pilot Scale• Identification of hazardous deviations
• Adiabatic calorimetry on deviations
• Definition of the basis of safety
Basis of Safety : Production• Identification of hazardous deviations
• Adiabatic calorimetry on deviations
• Definition of the basis of safety
Change Control• Identify consequences of changes
• Repeat work where necessary
• Re-confirm the basis of safety
Thermal Stability• Explosivity hazard assessment
• Preliminary thermal stability screening
• Definition of safe process temperatures
• Unstable functional group analysis
1110
At this stage in the lifecycle a clean slate exists. A target molecule has been identified and the aim is to identify the best synthetic route (based on a complex balance of costs, safety, productivity, yield and capability). While the primary focus will be on economics, safety
decisions can also be incorporated at this time. Any decisions made here have consequences that become multiplied as the scale of production increases. If hazards are inherent in the selected route, these will remain a burden throughout the lifecycle of the process.
The following information should be extracted to help compare a number of synthetic routes
• Predicted thermodynamics of the desired reactions
• Predicted potential for permanent gas generation
• Identification of any energetic (potentially explosive) functional groups
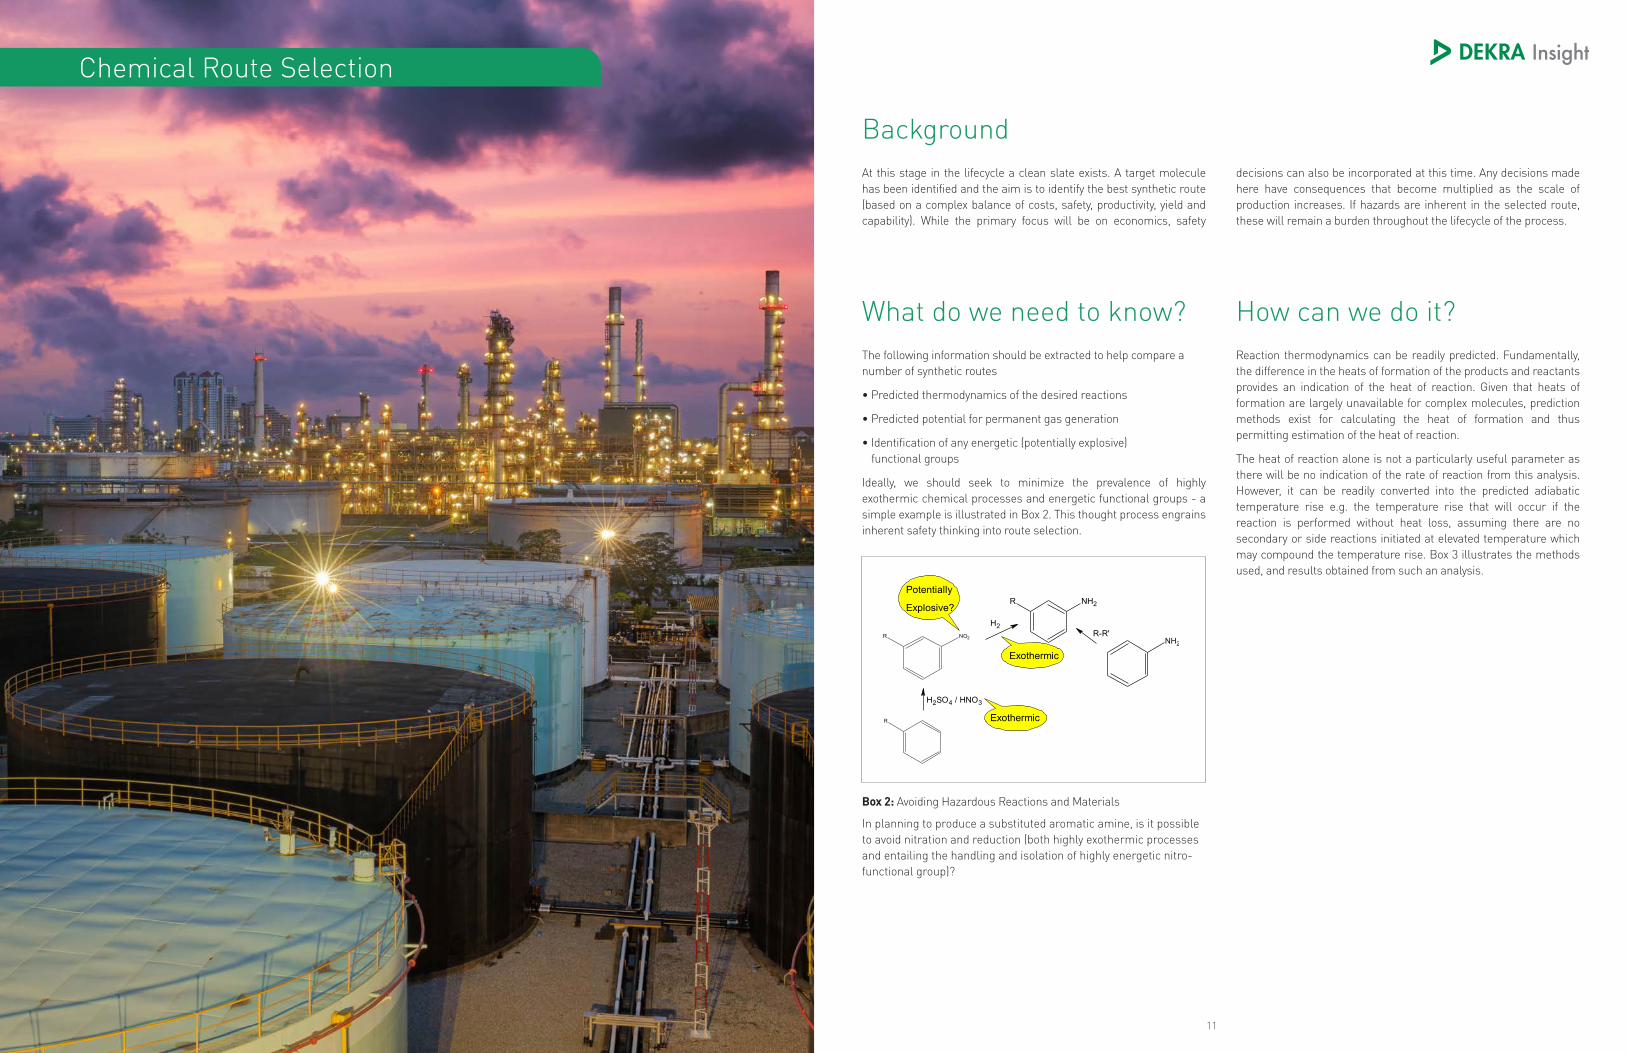
Ideally, we should seek to minimize the prevalence of highly exothermic chemical processes and energetic functional groups - a simple example is illustrated in Box 2. This thought process engrains inherent safety thinking into route selection.
Chemical Route Selection
Background
What do we need to know?
Box 2: Avoiding Hazardous Reactions and Materials
In planning to produce a substituted aromatic amine, is it possible to avoid nitration and reduction (both highly exothermic processes and entailing the handling and isolation of highly energetic nitro-functional group)?
R NO2
R NH2
R
H2SO4 / HNO3
NH2
Exothermic
H2R-R'
Potentially
Explosive?
Exothermic
Reaction thermodynamics can be readily predicted. Fundamentally, the difference in the heats of formation of the products and reactants provides an indication of the heat of reaction. Given that heats of formation are largely unavailable for complex molecules, prediction methods exist for calculating the heat of formation and thus permitting estimation of the heat of reaction.
The heat of reaction alone is not a particularly useful parameter as there will be no indication of the rate of reaction from this analysis. However, it can be readily converted into the predicted adiabatic temperature rise e.g. the temperature rise that will occur if the reaction is performed without heat loss, assuming there are no secondary or side reactions initiated at elevated temperature which may compound the temperature rise. Box 3 illustrates the methods used, and results obtained from such an analysis.
How can we do it?
1312
In addition to the hazards that may be posed by the desired chemical reaction and potential side-reactions, the possibility exists that one or more of the process materials may contain an inherently unstable functional group. Such functional groups will impart an instability hazard to the process and will require maximum permissible temperatures to be identified to avoid initiation of undesirable events. In extreme cases, explosive properties can be associated with such groups. This can have major implications for handling, processing, storage and transport.
Early identification of these substances is important for several reasons:
• If identified early enough, consideration can be given to changing the route or materials to exclude highly energetic functional groups.
• If they cannot be excluded, small scale hazard studies must be undertaken at an early stage to indicate the magnitude of the hazard. This may entail formal explosives testing. In any case, precautions can be specified for small scale – and large scale – synthesis which are designed to address any such issues.
Potentially energetic functional groups can usually be readily identified. Box 4 illustrates a selection of common energetic functional groups.
Box 3: How to… Predict Reaction Heat and Adiabatic Temperature Rise
In any chemical transformation, intended or unintended, chemical bonds are broken and made. The amount of overall energy change in the transformation is called the heat of reaction (ΔHr). Where heat is evolved from the system (i.e. heat up), the reaction is defined as exothermic (and the ΔHr is –ve). For systems that take in heat (i.e. cool down), the reaction is defined as endothermic (and the ΔHr is +ve). In its simplest form, the heat of reaction is the difference in heats of formation of the products minus the heats of formation of the starting materials. So, for a reaction where A + B → 2C + D, the heat of reaction is:
ΔHr = (2.ΔHfC + ΔHfD) – (ΔHfA + ΔHfB)
Gaining heats of formation information for novel compounds is likely to be difficult. Data will not exist in the literature – except for common materials – and experimental evaluation may not be practical or desirable. For this reason, computational programs are available to enable estimation of these values. One such program is the CHETAH computer program developed by the ASTM. This program enables users to enter the structure of compounds and then uses Benson’s method of group contributions to evaluate the heat of formation. The program will go one step further and, if you specify which materials are reactants and products in a balanced reaction, it will use the equation above to evaluate the heat of reaction.
There are a number of drawbacks with the CHETAH program including:
• the inability to predict heats of formation accurately for salts (in solution or as solids)
• the inability to code certain functional groups
• the use of gas phase data only in heat of formation prediction (i.e. ignoring the effect of heats of vaporization, etc.)
For these reasons, CHETAH cannot always be used and when it can be, it requires appreciable safety margins for further use (typically + 30% has been found, by DEKRA Insight, to be reasonable).
Despite these potential drawbacks, CHETAH provides a useful – and rapid - tool for prediction of reaction heats based solely on chemical structures.
Typical heats of reaction can range from -70 kJ/mol for an acid / base process to -500 kJ/mol for a nitro-group reduction. On its own, this heat of reaction data is meaningless for scale-up – it lacks a kinetic perspective (ie. how quickly does the reaction occur) and it also lacks an appropriate context. The heat of reaction can be made more meaningful by converting it into a potential adiabatic temperature rise (ΔTAd in K). Ignoring side reactions, mechanistic changes and decomposition reactions which may occur at elevated temperature, the ΔTAd indicates the temperature rise that may occur due to the desired reaction.
ΔTAd can be determined from the heat of reaction via the following equation:
Where n = number of moles of limiting reactant (mol)
m = total mass of the reaction mixture including solvents, etc. (kg)
Cp = heat capacity of the reaction mixture (J.kg-1.K-1)
Cp.mn.HrTAd =
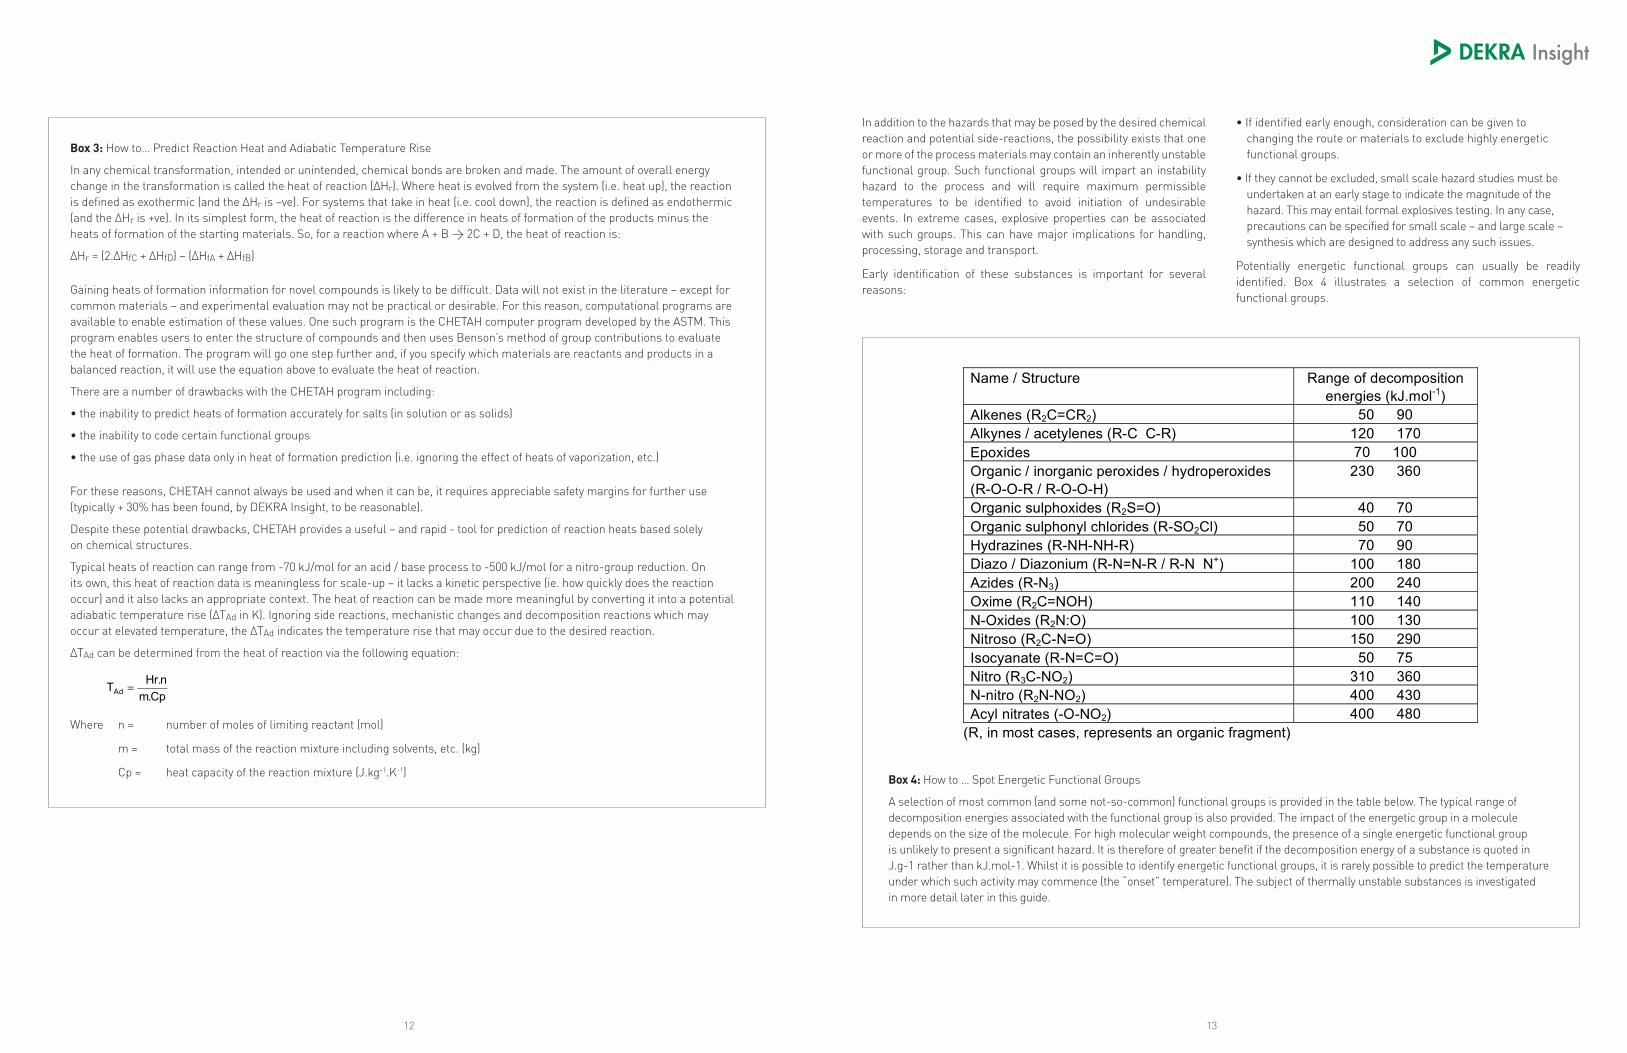
Box 4: How to … Spot Energetic Functional Groups
A selection of most common (and some not-so-common) functional groups is provided in the table below. The typical range of decomposition energies associated with the functional group is also provided. The impact of the energetic group in a molecule depends on the size of the molecule. For high molecular weight compounds, the presence of a single energetic functional group is unlikely to present a significant hazard. It is therefore of greater benefit if the decomposition energy of a substance is quoted in J.g-1 rather than kJ.mol-1. Whilst it is possible to identify energetic functional groups, it is rarely possible to predict the temperature under which such activity may commence (the “onset” temperature). The subject of thermally unstable substances is investigated in more detail later in this guide.
Name / Structure Range of decompositionenergies (kJ.mol-1)
Alkenes (R2C=CR2) 50 90Alkynes / acetylenes (R-C C-R) 120 170Epoxides 70 100Organic / inorganic peroxides / hydroperoxides(R-O-O-R / R-O-O-H)
230 360
Organic sulphoxides (R2S=O) 40 70Organic sulphonyl chlorides (R-SO2Cl) 50 70Hydrazines (R-NH-NH-R) 70 90Diazo / Diazonium (R-N=N-R / R-N N+) 100 180Azides (R-N3) 200 240Oxime (R2C=NOH) 110 140N-Oxides (R2N:O) 100 130Nitroso (R2C-N=O) 150 290Isocyanate (R-N=C=O) 50 75Nitro (R3C-NO2) 310 360N-nitro (R2N-NO2) 400 430Acyl nitrates (-O-NO2) 400 480
(R, in most cases, represents an organic fragment)
1514
At the chemical route selection stage, the emphasis is placed on preliminary identification of hazardous reactions or materials. In selecting the most suitable route to manufacture, each route can be assessed against a matrix of criteria (economic and safety).
For safety criteria, the following decisions are important:
• Potentially highly energetic materials must be identified – eradicate if possible (if not, earmarked for early testing and classification).
• Where energetic functional groups are present, examine methods for non-isolation of such materials (e.g. processing as a solvent solution rather than a dry, isolated product).
• Identify any reactions that could cause over-pressurization of a vessel. This may result from :
o desired reactions that generate permanent gas (e.g. nitrogen, carbon dioxide, etc.)
o side-reactions that generate permanent gas
o desired reactions that may be sufficiently exothermic to cause vapor pressure effects e.g. self-heating a material above its boiling point under sealed conditions may generate a positive pressure.
o desired reactions that are sufficiently exothermic to cause an increase in temperature which initiates an undesirable reaction (e.g. decomposition).
• For potentially hazardous reactions, identified through heat of reaction and adiabatic temperature rise prediction, consider elements of inherent safety (i.e. decisions regarding process design which can eradicate or mitigate hazardous scenarios). Examples may include:
o Selecting a semi-batch instead of a batch process method
o Using catalysts to permit more benign process conditions
o Selecting the solvent concentration and boiling characteristics which are designed to improve overall process safety
o High dilution can be employed for highly exothermic reactions to reduce the corresponding adiabatic temperature rise
o Low boiling solvents can be selected to “protect” hazardous decomposition reactions from being initiated by overheating. Conversely, high boiling solvents can be employed to reduce vapor pressure effects from highly exothermic reactions.
• A range of alternative routes can be assessed against these criteria so that hazards are identified at an early stage and mitigated, if possible, by the choice of the most benign processing route and raw materials.
What decisions can be made?
1716
Process Development and Optimization
Background Once the chemical route has been selected, the process of optimizing the route commences. This typically focuses on purity, yield and productivity. At this stage the process conditions remain flexible and safety decisions should be an integral part of the development process. From our experience, it is possible to identify and solve safety problems and have a positive contribution to the overall optimization of the process if this phase of assessment is
What do we need to know?There are three safety-specific areas where data may be required for this stage of development:
• Assessment of any explosivity potential in process materials (raw materials, intermediates or products). If any energetic functional groups are present we will need to assess whether the material is potentially explosive and, if so, how sensitive to ignition it is.
• Assessment of thermal stability limits of process materials, including raw materials, intermediates, reaction mixtures, final
How can we do it?Assessment of explosive propertiesHaving identified the presence of potentially explosive functional groups in a molecule, the first stage of physical testing should be to understand whether a material is truly explosive.
• Could it be explosive? The first test for explosive properties should be Differential Scanning Calorimetry (DSC, see appendix A.1). This is a contained, ramped temperature test on a small sample of material (normally 2 – 10 mg) which provides an indication of the onset temperature and, more importantly, magnitude of any heat release. For materials that exhibit detonating behavior the heat of decomposition would need to be greater than 800 J.g-1. If the energy of decomposition is less than this, detonating behavior is unlikely although the material may explode when heated under confinement with energies of around 600 J.g-1. At energies less than this, dangerous self- heating potential may still exist. The shape of the DSC exothermic peak is also indicative of explosive behavior. Sharp peaks are more typically associated with explosive behavior rather than broader peaks. Larger molecules with a “low density” of energetic functional groups are less likely to exhibit explosive properties than small molecules.
performed well. To achieve this, integration of safety, quality and productivity is the key to success. Looking at each parameter in isolation will rarely be as successful as a more holistic approach.
At the end of the development stage, the process will become fixed and the safety data collected must be adequate to clearly indicate the hazard potential of the process and the process materials.
products and waste streams. To remain safe, all materials must not be exposed to temperatures at which undesirable reactions can commence. At the end of this stage of testing, maximum safe working temperatures should be clearly identified.
• Characterization of the normal process in terms of heat release magnitude and kinetics, and potential for permanent gas generation.
1918
• the magnitude of any reactions expressed either quantitatively (e.g. in J.g-1) or qualitatively (e.g. small, medium or large event),
• the onset temperature of any gas (or volatile) generation
• the quantity of any gas generated,
• the relative rate of reaction in qualitative terms (fast, moderate or slow).
Because these are high heat loss tests, conservative safety margins are applied to the onset temperature determined in the screening method to enable it to be interpreted in relation to the industrial scale. If the corrected onset temperature is close to a normal process temperature, further, more detailed testing may be warranted to understand the instability with a greater degree of accuracy. If the preliminary test indicates relative freedom from instability, testing can cease.
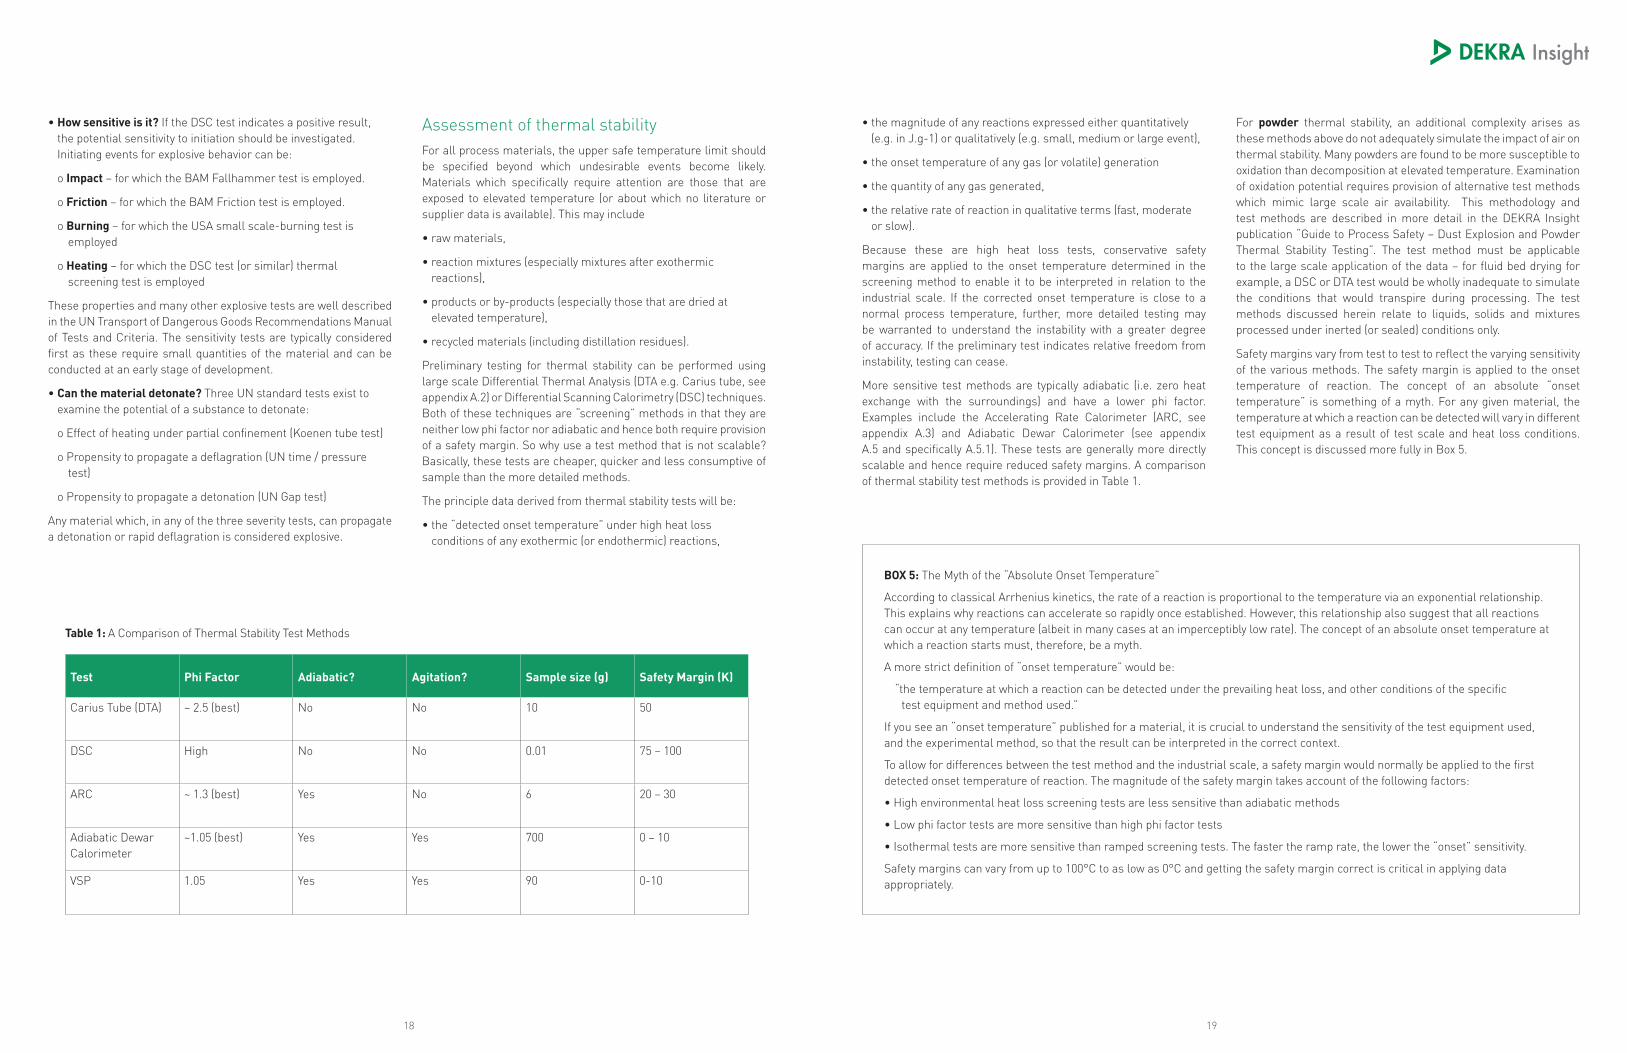
More sensitive test methods are typically adiabatic (i.e. zero heat exchange with the surroundings) and have a lower phi factor. Examples include the Accelerating Rate Calorimeter (ARC, see appendix A.3) and Adiabatic Dewar Calorimeter (see appendix A.5 and specifically A.5.1). These tests are generally more directly scalable and hence require reduced safety margins. A comparison of thermal stability test methods is provided in Table 1.
• How sensitive is it? If the DSC test indicates a positive result, the potential sensitivity to initiation should be investigated. Initiating events for explosive behavior can be:
o Impact – for which the BAM Fallhammer test is employed.
o Friction – for which the BAM Friction test is employed.
o Burning – for which the USA small scale-burning test is employed
o Heating – for which the DSC test (or similar) thermal screening test is employed
These properties and many other explosive tests are well described in the UN Transport of Dangerous Goods Recommendations Manual of Tests and Criteria. The sensitivity tests are typically considered first as these require small quantities of the material and can be conducted at an early stage of development.
• Can the material detonate? Three UN standard tests exist to examine the potential of a substance to detonate:
o Effect of heating under partial confinement (Koenen tube test)
o Propensity to propagate a deflagration (UN time / pressure test)
o Propensity to propagate a detonation (UN Gap test)
Any material which, in any of the three severity tests, can propagate a detonation or rapid deflagration is considered explosive.
For powder thermal stability, an additional complexity arises as these methods above do not adequately simulate the impact of air on thermal stability. Many powders are found to be more susceptible to oxidation than decomposition at elevated temperature. Examination of oxidation potential requires provision of alternative test methods which mimic large scale air availability. This methodology and test methods are described in more detail in the DEKRA Insight publication “Guide to Process Safety – Dust Explosion and Powder Thermal Stability Testing”. The test method must be applicable to the large scale application of the data – for fluid bed drying for example, a DSC or DTA test would be wholly inadequate to simulate the conditions that would transpire during processing. The test methods discussed herein relate to liquids, solids and mixtures processed under inerted (or sealed) conditions only.
Safety margins vary from test to test to reflect the varying sensitivity of the various methods. The safety margin is applied to the onset temperature of reaction. The concept of an absolute “onset temperature” is something of a myth. For any given material, the temperature at which a reaction can be detected will vary in different test equipment as a result of test scale and heat loss conditions. This concept is discussed more fully in Box 5.
Assessment of thermal stabilityFor all process materials, the upper safe temperature limit should be specified beyond which undesirable events become likely. Materials which specifically require attention are those that are exposed to elevated temperature (or about which no literature or supplier data is available). This may include
• raw materials,
• reaction mixtures (especially mixtures after exothermic reactions),
• products or by-products (especially those that are dried at elevated temperature),
• recycled materials (including distillation residues).
Preliminary testing for thermal stability can be performed using large scale Differential Thermal Analysis (DTA e.g. Carius tube, see appendix A.2) or Differential Scanning Calorimetry (DSC) techniques. Both of these techniques are “screening” methods in that they are neither low phi factor nor adiabatic and hence both require provision of a safety margin. So why use a test method that is not scalable? Basically, these tests are cheaper, quicker and less consumptive of sample than the more detailed methods.
The principle data derived from thermal stability tests will be:
• the “detected onset temperature” under high heat loss conditions of any exothermic (or endothermic) reactions,
Table 1: A Comparison of Thermal Stability Test Methods
Test Phi Factor Adiabatic? Agitation? Sample size (g) Safety Margin (K)
Carius Tube (DTA) ~ 2.5 (best) No No 10 50
DSC High No No 0.01 75 – 100
ARC ~ 1.3 (best) Yes No 6 20 – 30
Adiabatic Dewar Calorimeter
~1.05 (best) Yes Yes 700 0 – 10
VSP 1.05 Yes Yes 90 0-10
BOX 5: The Myth of the “Absolute Onset Temperature”
According to classical Arrhenius kinetics, the rate of a reaction is proportional to the temperature via an exponential relationship. This explains why reactions can accelerate so rapidly once established. However, this relationship also suggest that all reactions can occur at any temperature (albeit in many cases at an imperceptibly low rate). The concept of an absolute onset temperature at which a reaction starts must, therefore, be a myth.
A more strict definition of “onset temperature” would be:
“the temperature at which a reaction can be detected under the prevailing heat loss, and other conditions of the specific test equipment and method used.”
If you see an “onset temperature” published for a material, it is crucial to understand the sensitivity of the test equipment used, and the experimental method, so that the result can be interpreted in the correct context.
To allow for differences between the test method and the industrial scale, a safety margin would normally be applied to the first detected onset temperature of reaction. The magnitude of the safety margin takes account of the following factors:
• High environmental heat loss screening tests are less sensitive than adiabatic methods
• Low phi factor tests are more sensitive than high phi factor tests
• Isothermal tests are more sensitive than ramped screening tests. The faster the ramp rate, the lower the “onset” sensitivity.
Safety margins can vary from up to 100°C to as low as 0°C and getting the safety margin correct is critical in applying data appropriately.
2120
Once the heat of reaction is known, a range of decisions and consequences can be evaluated for deviation scenarios. Questions such as “what happens if incorrect quantities of materials are added e.g. undercharge of solvent, overcharge of reactants, etc.?” can be answered quantitatively without the need for further testing.
…and Don’t Forget Gas!Getting so wrapped up in thermal inertia, phi factor, heat flows, calorimetry, etc., it is easy to overlook the importance of gas generation. Permanent gas presents an immediate mechanism for vessel over pressurization and requires full understanding and quantification. Ancillary equipment such as thermal mass flow meters or gas burette systems when used in conjunction with reaction calorimetry can readily quantify the rate and total quantity of gas generation from the normal process. This data is particularly important for the adequate sizing of normal process vents.
Characterizing the Normal Reaction
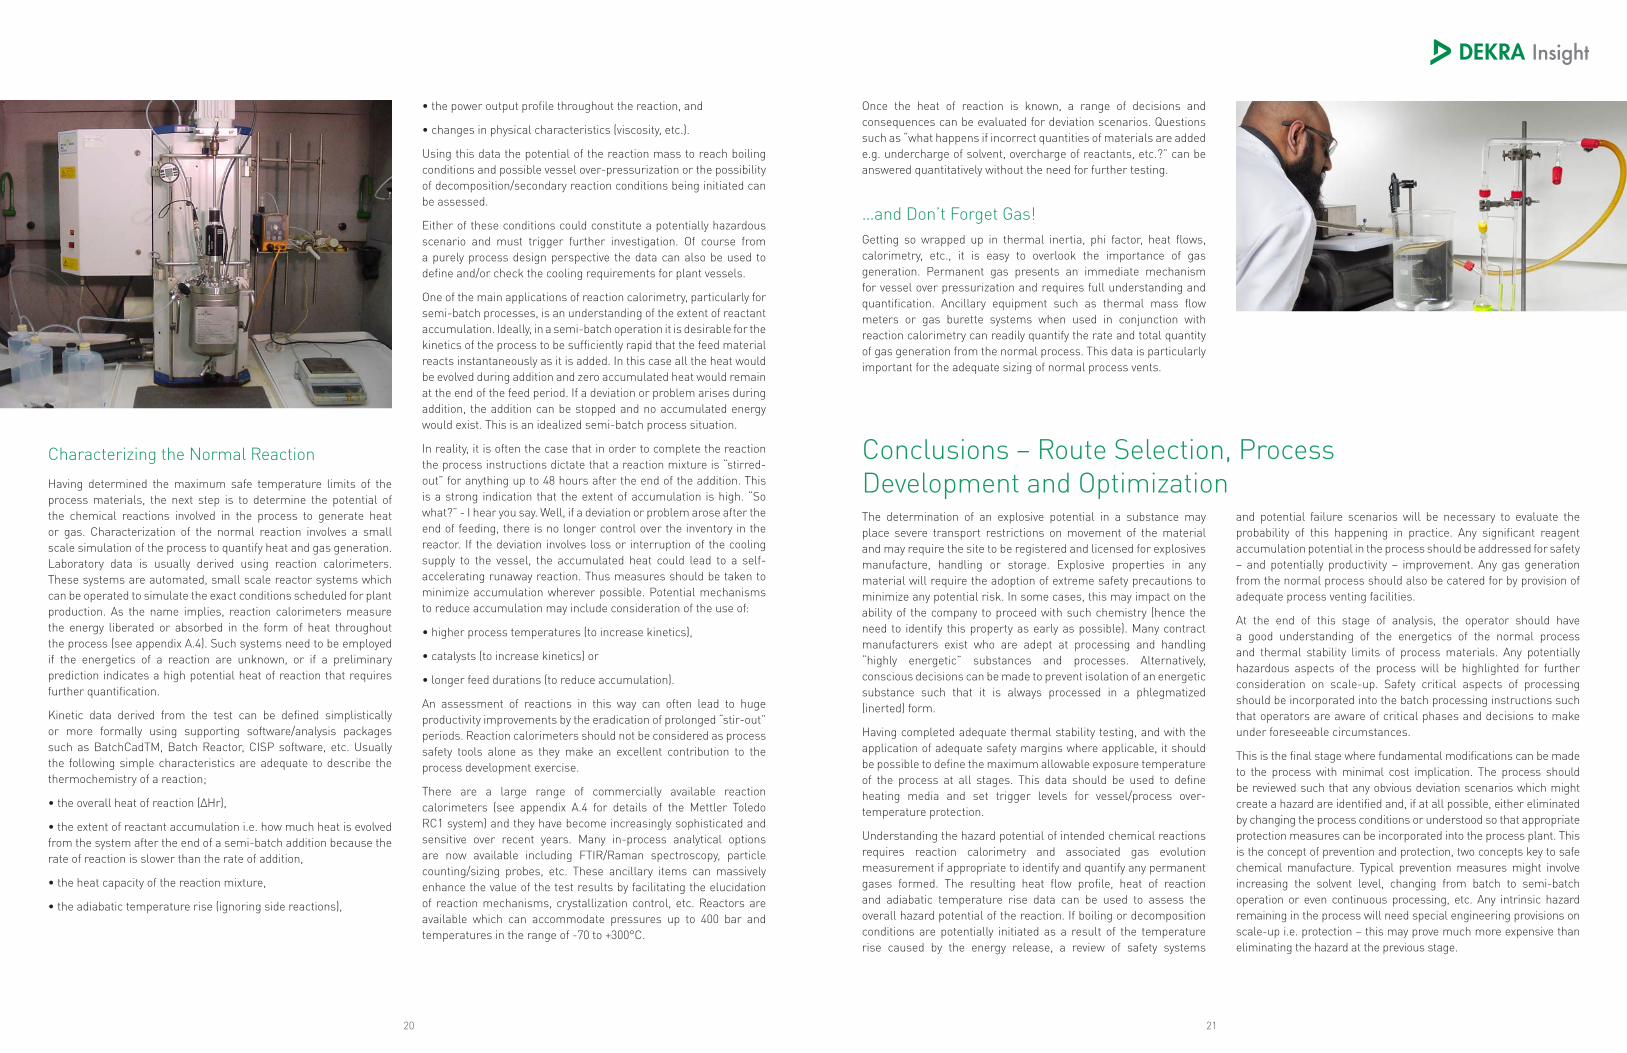
Having determined the maximum safe temperature limits of the process materials, the next step is to determine the potential of the chemical reactions involved in the process to generate heat or gas. Characterization of the normal reaction involves a small scale simulation of the process to quantify heat and gas generation. Laboratory data is usually derived using reaction calorimeters. These systems are automated, small scale reactor systems which can be operated to simulate the exact conditions scheduled for plant production. As the name implies, reaction calorimeters measure the energy liberated or absorbed in the form of heat throughout the process (see appendix A.4). Such systems need to be employed if the energetics of a reaction are unknown, or if a preliminary prediction indicates a high potential heat of reaction that requires further quantification.
Kinetic data derived from the test can be defined simplistically or more formally using supporting software/analysis packages such as BatchCadTM, Batch Reactor, CISP software, etc. Usually the following simple characteristics are adequate to describe the thermochemistry of a reaction;
• the overall heat of reaction (ΔHr),
• the extent of reactant accumulation i.e. how much heat is evolved from the system after the end of a semi-batch addition because the rate of reaction is slower than the rate of addition,
• the heat capacity of the reaction mixture,
• the adiabatic temperature rise (ignoring side reactions),
Conclusions – Route Selection, Process Development and Optimization
• the power output profile throughout the reaction, and
• changes in physical characteristics (viscosity, etc.).
Using this data the potential of the reaction mass to reach boiling conditions and possible vessel over-pressurization or the possibility of decomposition/secondary reaction conditions being initiated can be assessed.
Either of these conditions could constitute a potentially hazardous scenario and must trigger further investigation. Of course from a purely process design perspective the data can also be used to define and/or check the cooling requirements for plant vessels.
One of the main applications of reaction calorimetry, particularly for semi-batch processes, is an understanding of the extent of reactant accumulation. Ideally, in a semi-batch operation it is desirable for the kinetics of the process to be sufficiently rapid that the feed material reacts instantaneously as it is added. In this case all the heat would be evolved during addition and zero accumulated heat would remain at the end of the feed period. If a deviation or problem arises during addition, the addition can be stopped and no accumulated energy would exist. This is an idealized semi-batch process situation.
In reality, it is often the case that in order to complete the reaction the process instructions dictate that a reaction mixture is “stirred-out” for anything up to 48 hours after the end of the addition. This is a strong indication that the extent of accumulation is high. “So what?” - I hear you say. Well, if a deviation or problem arose after the end of feeding, there is no longer control over the inventory in the reactor. If the deviation involves loss or interruption of the cooling supply to the vessel, the accumulated heat could lead to a self-accelerating runaway reaction. Thus measures should be taken to minimize accumulation wherever possible. Potential mechanisms to reduce accumulation may include consideration of the use of:
• higher process temperatures (to increase kinetics),
• catalysts (to increase kinetics) or
• longer feed durations (to reduce accumulation).
An assessment of reactions in this way can often lead to huge productivity improvements by the eradication of prolonged “stir-out” periods. Reaction calorimeters should not be considered as process safety tools alone as they make an excellent contribution to the process development exercise.
There are a large range of commercially available reaction calorimeters (see appendix A.4 for details of the Mettler Toledo RC1 system) and they have become increasingly sophisticated and sensitive over recent years. Many in-process analytical options are now available including FTIR/Raman spectroscopy, particle counting/sizing probes, etc. These ancillary items can massively enhance the value of the test results by facilitating the elucidation of reaction mechanisms, crystallization control, etc. Reactors are available which can accommodate pressures up to 400 bar and temperatures in the range of -70 to +300°C.
The determination of an explosive potential in a substance may place severe transport restrictions on movement of the material and may require the site to be registered and licensed for explosives manufacture, handling or storage. Explosive properties in any material will require the adoption of extreme safety precautions to minimize any potential risk. In some cases, this may impact on the ability of the company to proceed with such chemistry (hence the need to identify this property as early as possible). Many contract manufacturers exist who are adept at processing and handling “highly energetic” substances and processes. Alternatively, conscious decisions can be made to prevent isolation of an energetic substance such that it is always processed in a phlegmatized (inerted) form.
Having completed adequate thermal stability testing, and with the application of adequate safety margins where applicable, it should be possible to define the maximum allowable exposure temperature of the process at all stages. This data should be used to define heating media and set trigger levels for vessel/process over-temperature protection.
Understanding the hazard potential of intended chemical reactions requires reaction calorimetry and associated gas evolution measurement if appropriate to identify and quantify any permanent gases formed. The resulting heat flow profile, heat of reaction and adiabatic temperature rise data can be used to assess the overall hazard potential of the reaction. If boiling or decomposition conditions are potentially initiated as a result of the temperature rise caused by the energy release, a review of safety systems
and potential failure scenarios will be necessary to evaluate the probability of this happening in practice. Any significant reagent accumulation potential in the process should be addressed for safety – and potentially productivity – improvement. Any gas generation from the normal process should also be catered for by provision of adequate process venting facilities.
At the end of this stage of analysis, the operator should have a good understanding of the energetics of the normal process and thermal stability limits of process materials. Any potentially hazardous aspects of the process will be highlighted for further consideration on scale-up. Safety critical aspects of processing should be incorporated into the batch processing instructions such that operators are aware of critical phases and decisions to make under foreseeable circumstances.
This is the final stage where fundamental modifications can be made to the process with minimal cost implication. The process should be reviewed such that any obvious deviation scenarios which might create a hazard are identified and, if at all possible, either eliminated by changing the process conditions or understood so that appropriate protection measures can be incorporated into the process plant. This is the concept of prevention and protection, two concepts key to safe chemical manufacture. Typical prevention measures might involve increasing the solvent level, changing from batch to semi-batch operation or even continuous processing, etc. Any intrinsic hazard remaining in the process will need special engineering provisions on scale-up i.e. protection – this may prove much more expensive than eliminating the hazard at the previous stage.
2322
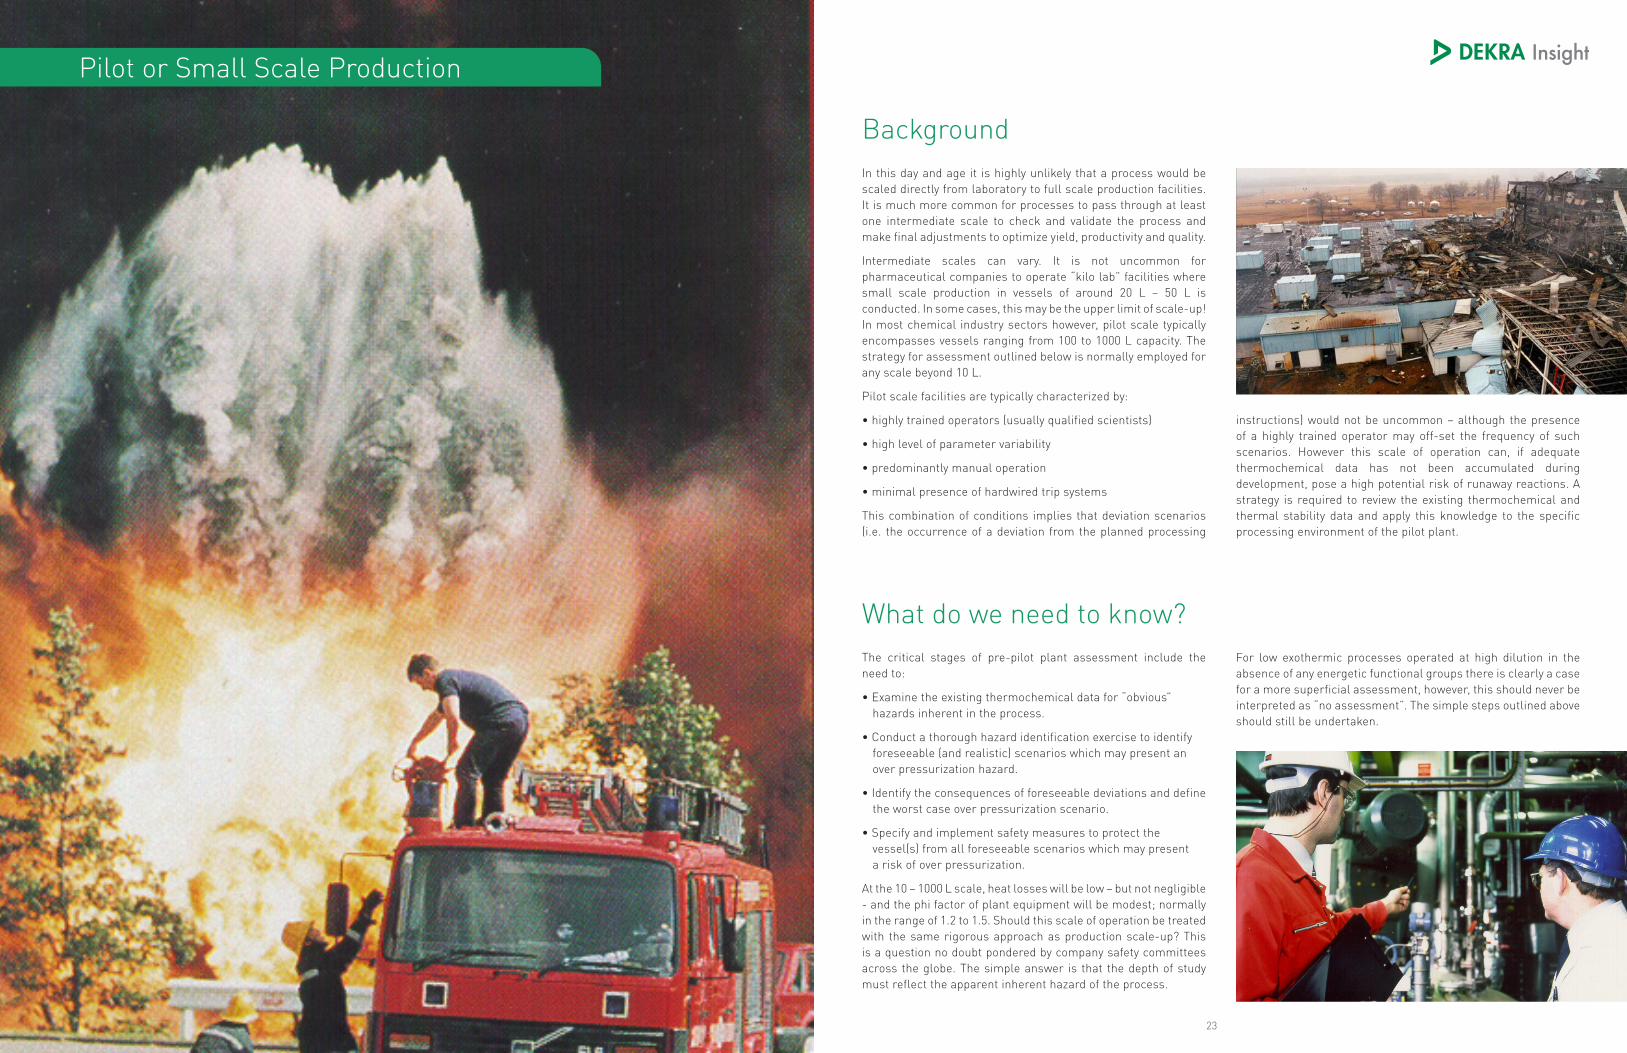
In this day and age it is highly unlikely that a process would be scaled directly from laboratory to full scale production facilities. It is much more common for processes to pass through at least one intermediate scale to check and validate the process and make final adjustments to optimize yield, productivity and quality.
Intermediate scales can vary. It is not uncommon for pharmaceutical companies to operate “kilo lab” facilities where small scale production in vessels of around 20 L – 50 L is conducted. In some cases, this may be the upper limit of scale-up! In most chemical industry sectors however, pilot scale typically encompasses vessels ranging from 100 to 1000 L capacity. The strategy for assessment outlined below is normally employed for any scale beyond 10 L.
Pilot scale facilities are typically characterized by:
• highly trained operators (usually qualified scientists)
• high level of parameter variability
• predominantly manual operation
• minimal presence of hardwired trip systems
This combination of conditions implies that deviation scenarios (i.e. the occurrence of a deviation from the planned processing
instructions) would not be uncommon – although the presence of a highly trained operator may off-set the frequency of such scenarios. However this scale of operation can, if adequate thermochemical data has not been accumulated during development, pose a high potential risk of runaway reactions. A strategy is required to review the existing thermochemical and thermal stability data and apply this knowledge to the specific processing environment of the pilot plant.
The critical stages of pre-pilot plant assessment include the need to:
• Examine the existing thermochemical data for “obvious” hazards inherent in the process.
• Conduct a thorough hazard identification exercise to identify foreseeable (and realistic) scenarios which may present an over pressurization hazard.
• Identify the consequences of foreseeable deviations and define the worst case over pressurization scenario.
• Specify and implement safety measures to protect the vessel(s) from all foreseeable scenarios which may present a risk of over pressurization.
At the 10 – 1000 L scale, heat losses will be low – but not negligible - and the phi factor of plant equipment will be modest; normally in the range of 1.2 to 1.5. Should this scale of operation be treated with the same rigorous approach as production scale-up? This is a question no doubt pondered by company safety committees across the globe. The simple answer is that the depth of study must reflect the apparent inherent hazard of the process.
Background
What do we need to know?
Pilot or Small Scale Production
For low exothermic processes operated at high dilution in the absence of any energetic functional groups there is clearly a case for a more superficial assessment, however, this should never be interpreted as “no assessment”. The simple steps outlined above should still be undertaken.
2524
Estimation of scenario consequences may be possible using existing data. Heat of reaction and heat capacity data can be manipulated to consider the consequences of certain deviations (e.g. change in quantities of solvents or reactants). As a screening exercise, this may be sufficient to rank deviations in terms of their likely severity. Combined with adequate thermal stability data, the potential of scenarios to initiate undesirable secondary reactions can also be assessed.
Any such calculations are likely to yield thermodynamic information regarding the overall magnitude of thermal change and the probability of initiating other events. This approach is thus likely to have merit for qualitative assessment but is unlikely to provide
enough kinetic data for safety system design. Thus, it is an option for highlighting a scenario which “is likely to have significant consequences” but is unlikely to adequately quantify the kinetics of the event. Typically, this approach would be reserved for ranking deviation potential.
In some cases, this approach may not be appropriate. For example, in the case of loss of agitation, a decision is required regarding the potential of a reaction system to stratify. Simple thermodynamic evaluation will not answer this question. In this case, and to evaluate the kinetics of scenarios, the worst case candidates are typically examined under experimental conditions to generate full scenario quantification.
Hazardous Scenario IdentificationWhilst it is not the intention of this Guide to discuss techniques for hazard identification or safety management systems, it is necessary to introduce the general principles of hazard identification. Armed with thermochemical and thermal stability data on the process, it is necessary to combine this information with an intimate knowledge of how the pilot vessel is operated to derive a list of potentially hazardous scenarios. That is, what can we foresee that can realistically go wrong with the operation of the vessel which may cause a potentially hazardous event?
Methods for hazard identification include:
• Hazard and Operability (HAZOP) Studies
This is a structured analysis of all parts of the plant vessel and peripheral systems. Deviation in parameters for all components are considered. The procedure is applied to every element of the system. The result is a list of failure deviations which are considered potentially hazardous and for which no definitive safeguard exists.
• Check List Assessments
This is a less formal approach than HAZOP and relies on the application of a check list of common failure conditions which can result in a hazardous scenario. The quality of this approach is very much dependent on the adequacy of the check list and the experience of participants who compose the assessment team.
• Informal “what if?” Assessments
This is an unstructured brainstorming which probes the process and plant looking for scenarios which may have potentially hazardous consequences. Again, the adequacy of this approach is very much proportional to the quality and composition of team participants and the rigor with which they probe the process.
• Failure Modes and Effects Analysis (FMEA)
This more formal approach seeks to identify possible failure modes of each component of the system and assess, qualitatively, the consequences of such a failure.
• Fault Tree Analysis
This approach starts with identification of a “top event”, for example explosion of the reactor, and seeks to determine the combination of failures required to cause this.
The method to apply may be dictated by the apparent hazard of the process – and the magnitude of scale-up. For processes which appear to contain a high inherent hazard (e.g. nitration or polymerization) much more rigorous hazard identification would be appropriate. For a benign, dilute system with minimal exothermicity, a less rigorous assessment would be necessary. It is important, however, to make sure that all processes are assessed – irrespective of their apparent hazard – since even a benign process can give rise to major problems under failure scenarios.
The outcome of the study should be a short list of potential scenarios which are feasible, yet credible, and which may give rise to a hazardous consequence.
Identifying the Consequences of Hazardous ScenariosOnce a short-list of hazardous scenarios is available, it is necessary to conclusively ascertain whether the consequences of the scenarios are hazardous or benign. The methods through which this can be done include:
• Computational simulation
• Estimation based on existing process safety data
• Experimental simulation
Computational simulation is feasible, but requires a lot of physico-chemical and kinetic properties information. A fundamental understanding of the mechanism of the reaction – and all conceivable side/secondary reactions – along with kinetic parameters, e.g. activation energy, order of reaction, etc. for each reaction would be required. For a small volume product the complexity of collecting the necessary data in most cases proves prohibitive. In some cases (e.g. for scale-up to continuous reactors) this rigorous approach may be warranted.
How can we do it?
2726
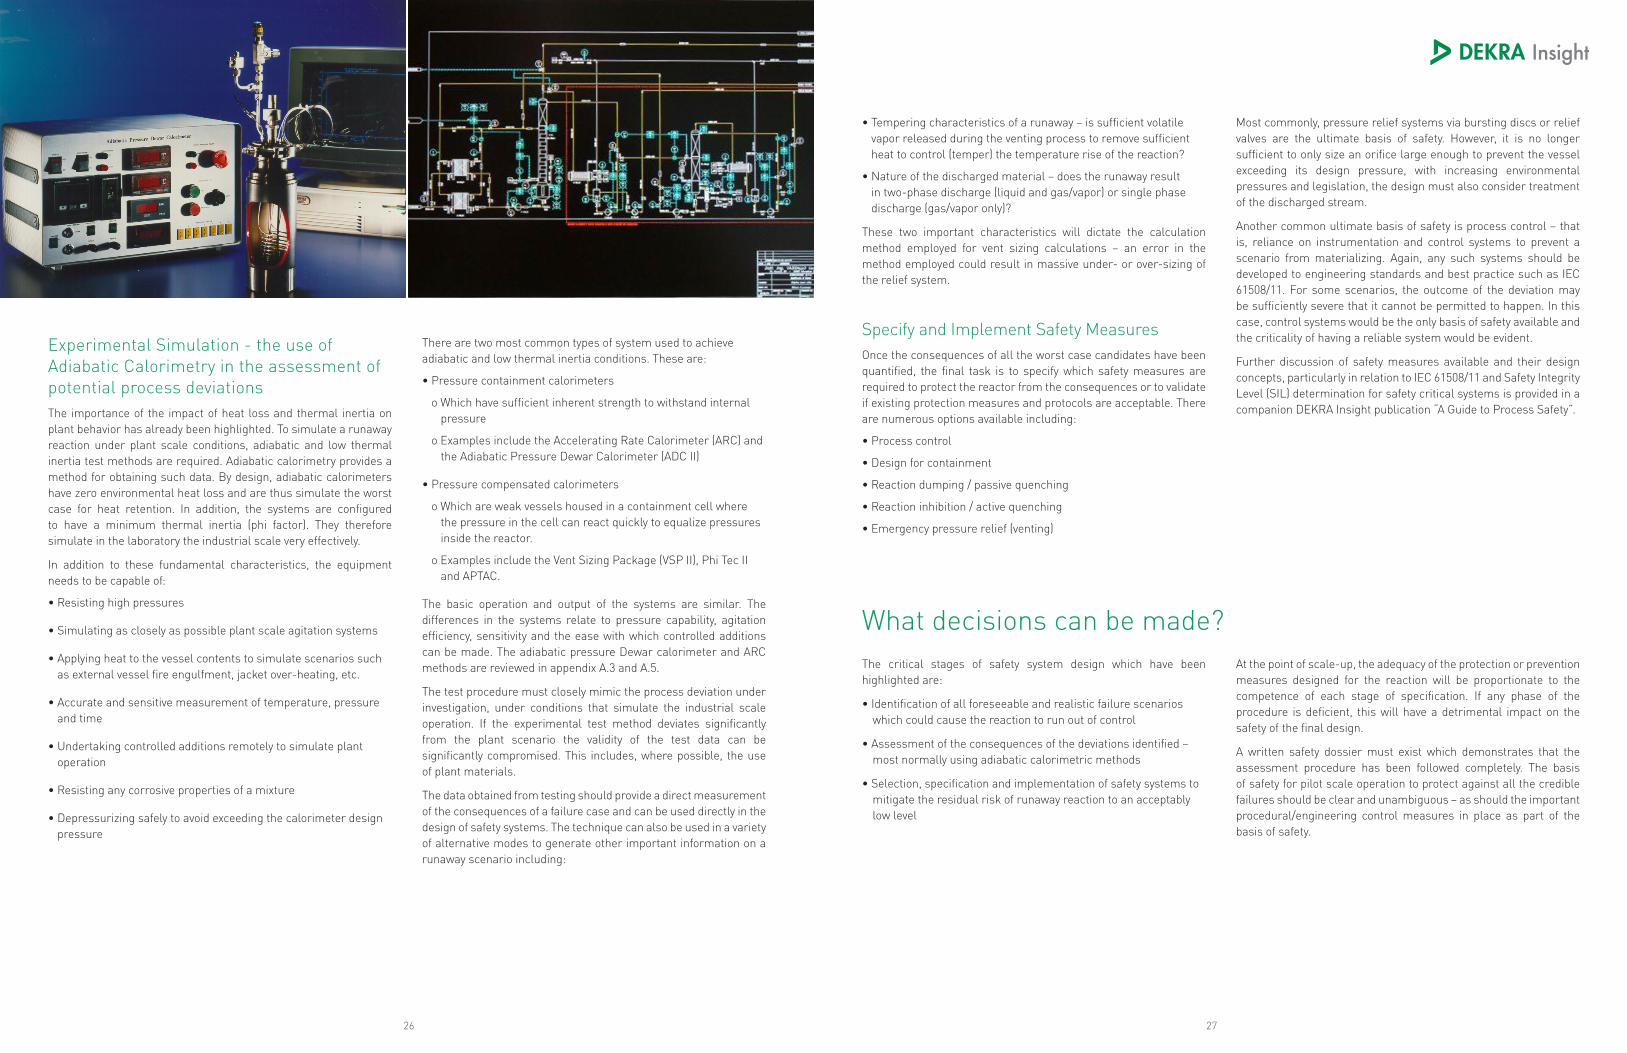
Experimental Simulation - the use of Adiabatic Calorimetry in the assessment of potential process deviationsThe importance of the impact of heat loss and thermal inertia on plant behavior has already been highlighted. To simulate a runaway reaction under plant scale conditions, adiabatic and low thermal inertia test methods are required. Adiabatic calorimetry provides a method for obtaining such data. By design, adiabatic calorimeters have zero environmental heat loss and are thus simulate the worst case for heat retention. In addition, the systems are configured to have a minimum thermal inertia (phi factor). They therefore simulate in the laboratory the industrial scale very effectively.
In addition to these fundamental characteristics, the equipment needs to be capable of:
• Resisting high pressures
• Simulating as closely as possible plant scale agitation systems
• Applying heat to the vessel contents to simulate scenarios such as external vessel fire engulfment, jacket over-heating, etc.
• Accurate and sensitive measurement of temperature, pressure and time
• Undertaking controlled additions remotely to simulate plant operation
• Resisting any corrosive properties of a mixture
• Depressurizing safely to avoid exceeding the calorimeter design pressure
There are two most common types of system used to achieve adiabatic and low thermal inertia conditions. These are:
• Pressure containment calorimeters
o Which have sufficient inherent strength to withstand internal pressure
o Examples include the Accelerating Rate Calorimeter (ARC) and the Adiabatic Pressure Dewar Calorimeter (ADC II)
• Pressure compensated calorimeters
o Which are weak vessels housed in a containment cell where the pressure in the cell can react quickly to equalize pressures inside the reactor.
o Examples include the Vent Sizing Package (VSP II), Phi Tec II and APTAC.
The basic operation and output of the systems are similar. The differences in the systems relate to pressure capability, agitation efficiency, sensitivity and the ease with which controlled additions can be made. The adiabatic pressure Dewar calorimeter and ARC methods are reviewed in appendix A.3 and A.5.
The test procedure must closely mimic the process deviation under investigation, under conditions that simulate the industrial scale operation. If the experimental test method deviates significantly from the plant scenario the validity of the test data can be significantly compromised. This includes, where possible, the use of plant materials.
The data obtained from testing should provide a direct measurement of the consequences of a failure case and can be used directly in the design of safety systems. The technique can also be used in a variety of alternative modes to generate other important information on a runaway scenario including:
• Tempering characteristics of a runaway – is sufficient volatile vapor released during the venting process to remove sufficient heat to control (temper) the temperature rise of the reaction?
• Nature of the discharged material – does the runaway result in two-phase discharge (liquid and gas/vapor) or single phase discharge (gas/vapor only)?
These two important characteristics will dictate the calculation method employed for vent sizing calculations – an error in the method employed could result in massive under- or over-sizing of the relief system.
Specify and Implement Safety MeasuresOnce the consequences of all the worst case candidates have been quantified, the final task is to specify which safety measures are required to protect the reactor from the consequences or to validate if existing protection measures and protocols are acceptable. There are numerous options available including:
• Process control
• Design for containment
• Reaction dumping / passive quenching
• Reaction inhibition / active quenching
• Emergency pressure relief (venting)
Most commonly, pressure relief systems via bursting discs or relief valves are the ultimate basis of safety. However, it is no longer sufficient to only size an orifice large enough to prevent the vessel exceeding its design pressure, with increasing environmental pressures and legislation, the design must also consider treatment of the discharged stream.
Another common ultimate basis of safety is process control – that is, reliance on instrumentation and control systems to prevent a scenario from materializing. Again, any such systems should be developed to engineering standards and best practice such as IEC 61508/11. For some scenarios, the outcome of the deviation may be sufficiently severe that it cannot be permitted to happen. In this case, control systems would be the only basis of safety available and the criticality of having a reliable system would be evident.
Further discussion of safety measures available and their design concepts, particularly in relation to IEC 61508/11 and Safety Integrity Level (SIL) determination for safety critical systems is provided in a companion DEKRA Insight publication “A Guide to Process Safety”.
The critical stages of safety system design which have been highlighted are:
• Identification of all foreseeable and realistic failure scenarios which could cause the reaction to run out of control
• Assessment of the consequences of the deviations identified – most normally using adiabatic calorimetric methods
• Selection, specification and implementation of safety systems to mitigate the residual risk of runaway reaction to an acceptably low level
At the point of scale-up, the adequacy of the protection or prevention measures designed for the reaction will be proportionate to the competence of each stage of specification. If any phase of the procedure is deficient, this will have a detrimental impact on the safety of the final design.
A written safety dossier must exist which demonstrates that the assessment procedure has been followed completely. The basis of safety for pilot scale operation to protect against all the credible failures should be clear and unambiguous – as should the important procedural/engineering control measures in place as part of the basis of safety.
What decisions can be made?
2928
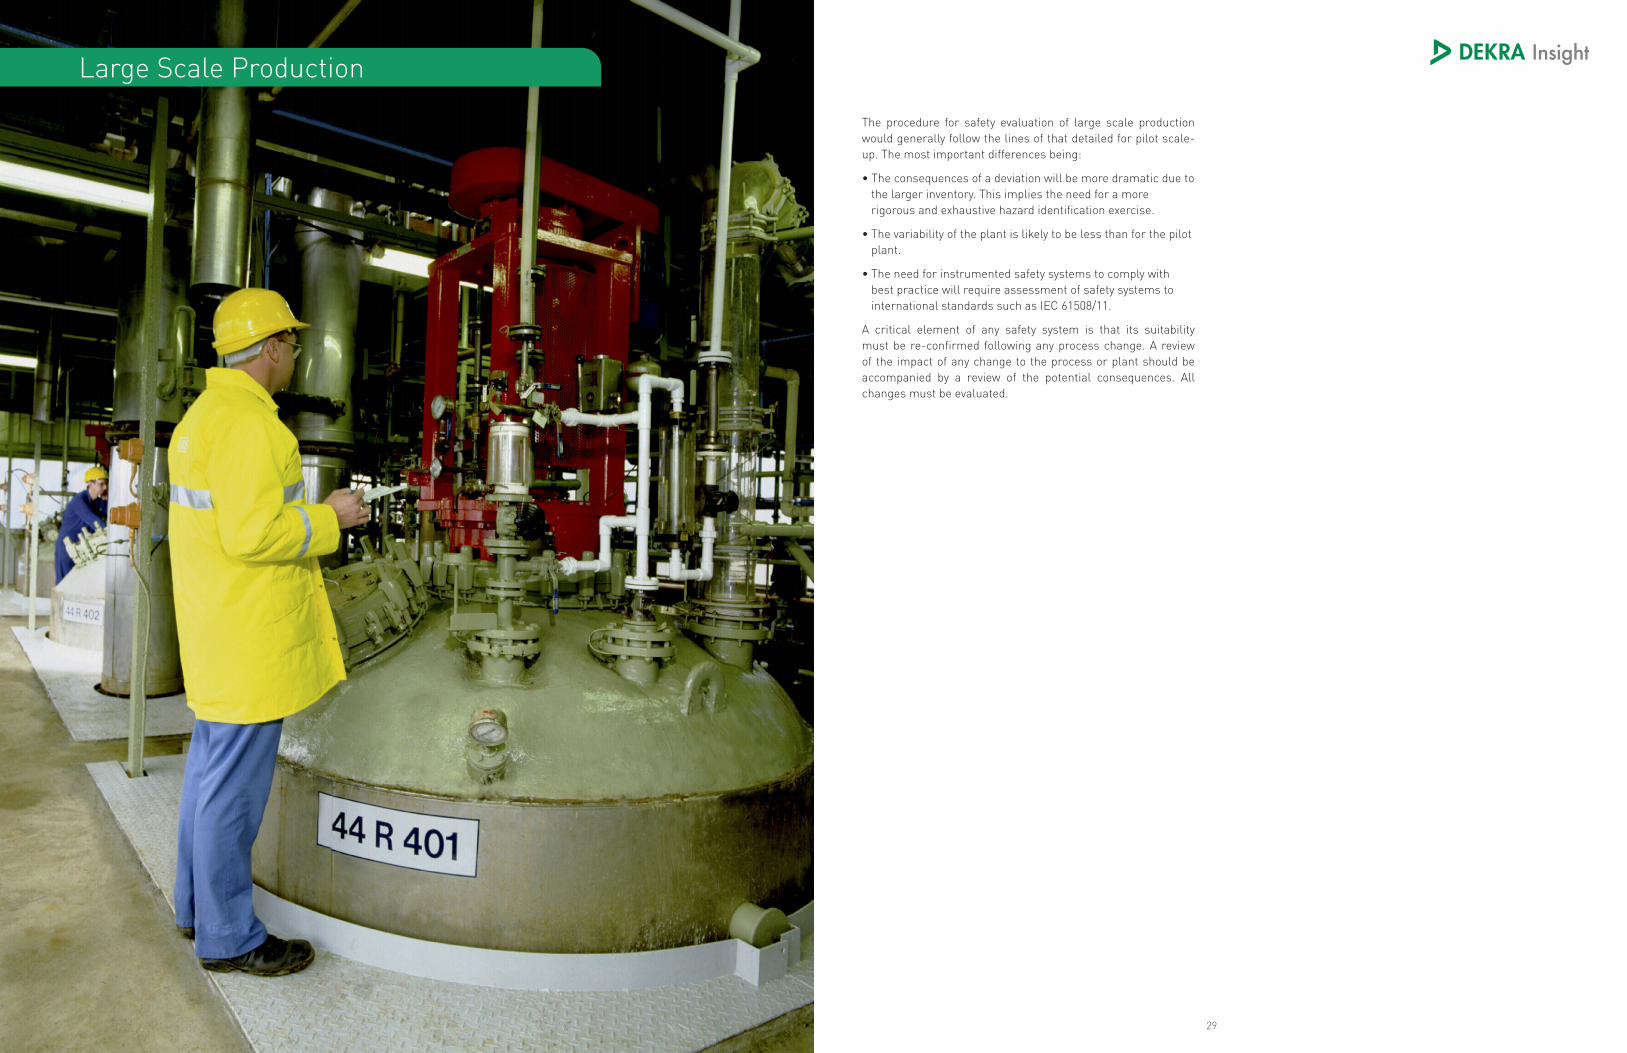
The procedure for safety evaluation of large scale production would generally follow the lines of that detailed for pilot scale-up. The most important differences being:
• The consequences of a deviation will be more dramatic due to the larger inventory. This implies the need for a more rigorous and exhaustive hazard identification exercise.
• The variability of the plant is likely to be less than for the pilot plant.
• The need for instrumented safety systems to comply with best practice will require assessment of safety systems to international standards such as IEC 61508/11.
A critical element of any safety system is that its suitability must be re-confirmed following any process change. A review of the impact of any change to the process or plant should be accompanied by a review of the potential consequences. All changes must be evaluated.
Large Scale Production
3130
The inherent exothermic reaction and/or uncontrolled gas evolution potential of all chemical processes require a thorough and rigorous assessment procedure in order to ensure that large scale manufacture can proceed with an acceptable level of residual risk.
Most decisions which impact on the inherent hazard of the process are made at the very early stages of process development – as early as the route selection stage – and this is the area where Chemists play a fundamental part in developing safer processes. It is critical that reaction hazard evaluation is integrated seamlessly into the process development lifecycle. Chemists should be trained not just to look at quality, yield and productivity issues but also to understanding the criticality of their decisions on the safety of the process. This more holistic approach to reaction hazard evaluation will take at least some of the onus from engineers who are normally left to design and implement safety systems for scenarios which could possibly have been eradicated with forethought.
A strategic methodology must be employed in which the collection of safety data is intertwined with the development and scale-up of the process – rather than being an inconvenient add-on once the process is fully develop and optimized (and the hazards already inherently included).
The procedure outlined in this guide is encompassed in the PreVent methodology developed by DEKRA Insight. This is designed to be a cost-effective mechanism for assessing all processes. With this technique the degree of process safety investigation depends on the inherent hazards of the process – thus focusing resource, time and money on the more important processes whilst providing an acceptable level of detail for all processes. For more information on PreVent and other reaction hazard services offered by DEKRA Insight, please visit our website at www.chilworth.com.
Summary
Left: Facilities – Princeton, NJ
3332
A.1 Differential Scanning Calorimetry
Appendix - Test Descriptions
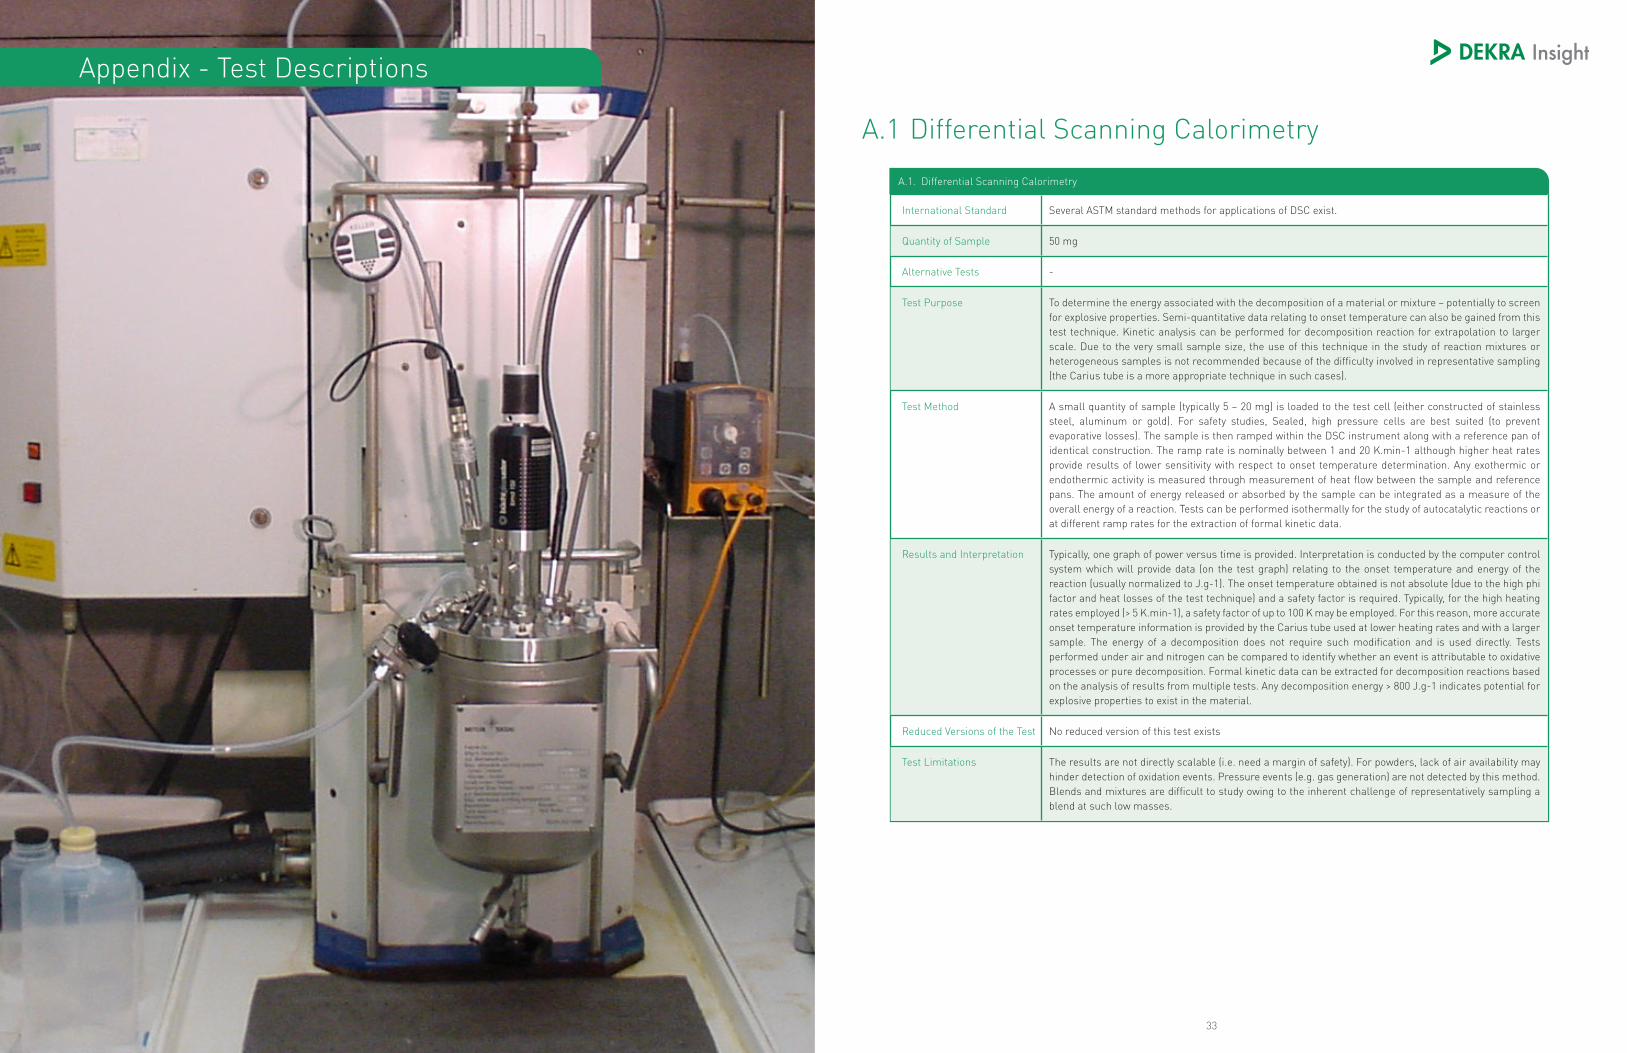
A.1. Differential Scanning Calorimetry
International Standard Several ASTM standard methods for applications of DSC exist.
Quantity of Sample 50 mg
Alternative Tests -
Test Purpose To determine the energy associated with the decomposition of a material or mixture – potentially to screen for explosive properties. Semi-quantitative data relating to onset temperature can also be gained from this test technique. Kinetic analysis can be performed for decomposition reaction for extrapolation to larger scale. Due to the very small sample size, the use of this technique in the study of reaction mixtures or heterogeneous samples is not recommended because of the difficulty involved in representative sampling (the Carius tube is a more appropriate technique in such cases).
Test Method A small quantity of sample (typically 5 – 20 mg) is loaded to the test cell (either constructed of stainless steel, aluminum or gold). For safety studies, Sealed, high pressure cells are best suited (to prevent evaporative losses). The sample is then ramped within the DSC instrument along with a reference pan of identical construction. The ramp rate is nominally between 1 and 20 K.min-1 although higher heat rates provide results of lower sensitivity with respect to onset temperature determination. Any exothermic or endothermic activity is measured through measurement of heat flow between the sample and reference pans. The amount of energy released or absorbed by the sample can be integrated as a measure of the overall energy of a reaction. Tests can be performed isothermally for the study of autocatalytic reactions or at different ramp rates for the extraction of formal kinetic data.
Results and Interpretation Typically, one graph of power versus time is provided. Interpretation is conducted by the computer control system which will provide data (on the test graph) relating to the onset temperature and energy of the reaction (usually normalized to J.g-1). The onset temperature obtained is not absolute (due to the high phi factor and heat losses of the test technique) and a safety factor is required. Typically, for the high heating rates employed (> 5 K.min-1), a safety factor of up to 100 K may be employed. For this reason, more accurate onset temperature information is provided by the Carius tube used at lower heating rates and with a larger sample. The energy of a decomposition does not require such modification and is used directly. Tests performed under air and nitrogen can be compared to identify whether an event is attributable to oxidative processes or pure decomposition. Formal kinetic data can be extracted for decomposition reactions based on the analysis of results from multiple tests. Any decomposition energy > 800 J.g-1 indicates potential for explosive properties to exist in the material.
Reduced Versions of the Test No reduced version of this test exists
Test Limitations The results are not directly scalable (i.e. need a margin of safety). For powders, lack of air availability may hinder detection of oxidation events. Pressure events (e.g. gas generation) are not detected by this method. Blends and mixtures are difficult to study owing to the inherent challenge of representatively sampling a blend at such low masses.
3534
A.3 Accelerating Rate Calorimetry (Arc)A.2 Carius (10 G) Tube Screening Test
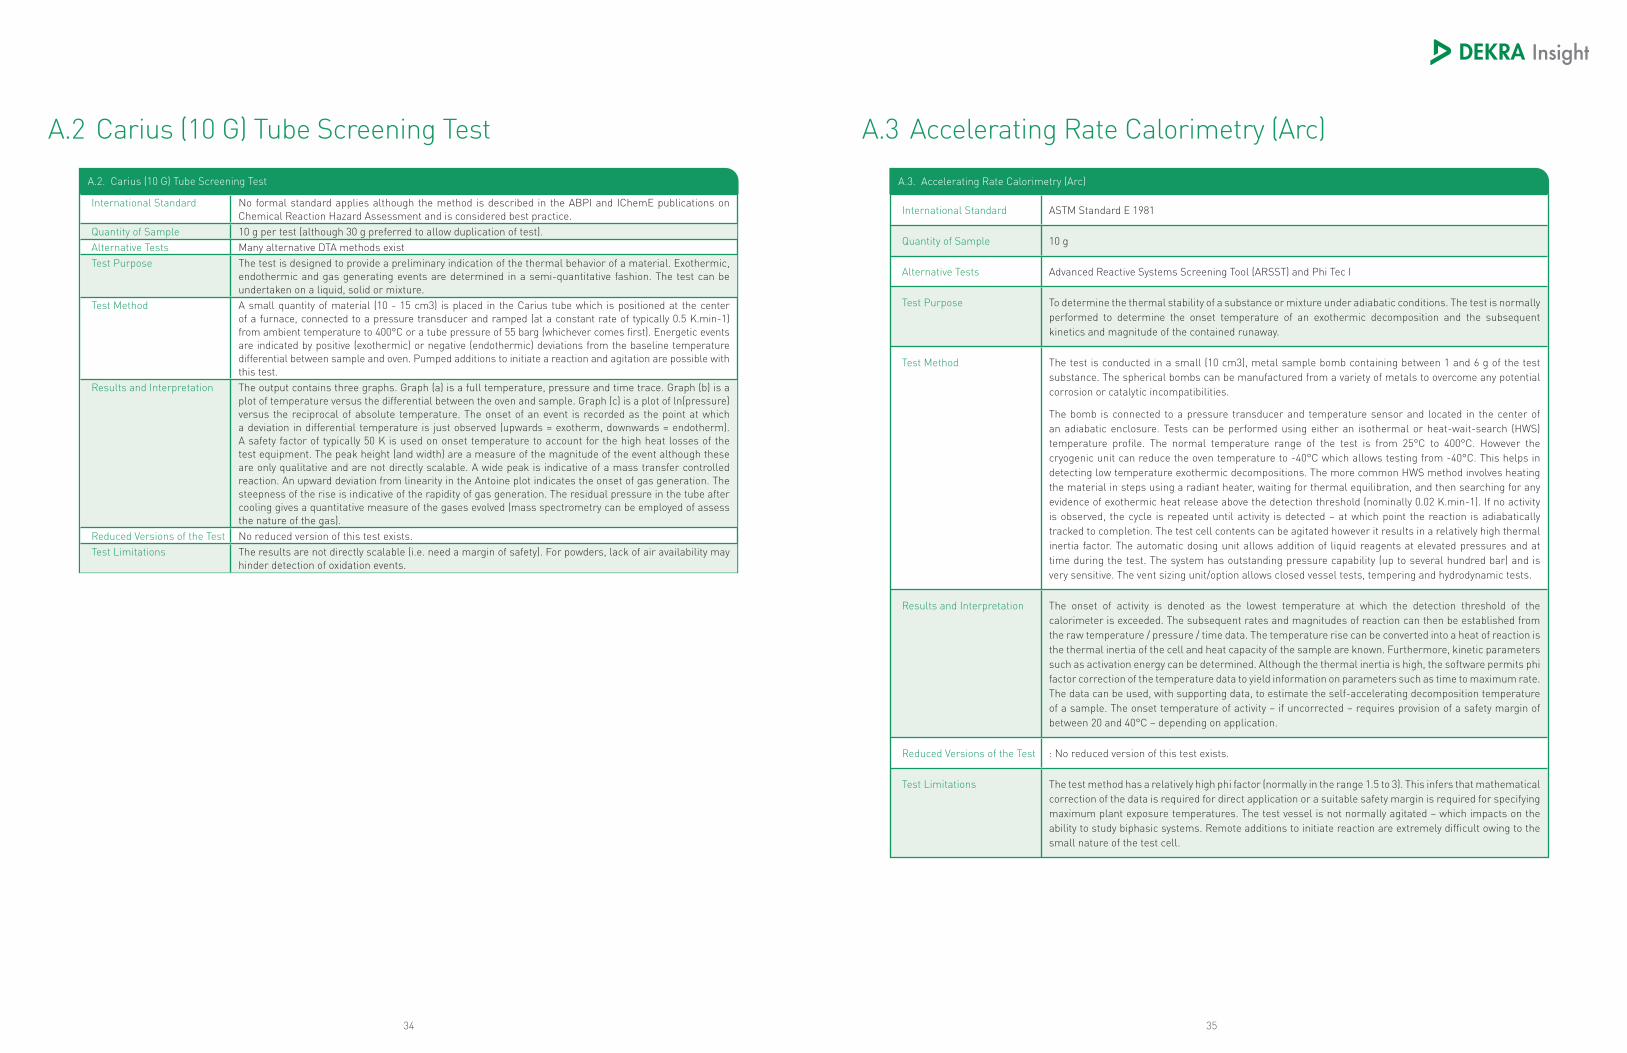
A.3. Accelerating Rate Calorimetry (Arc)
International Standard ASTM Standard E 1981
Quantity of Sample 10 g
Alternative Tests Advanced Reactive Systems Screening Tool (ARSST) and Phi Tec I
Test Purpose To determine the thermal stability of a substance or mixture under adiabatic conditions. The test is normally performed to determine the onset temperature of an exothermic decomposition and the subsequent kinetics and magnitude of the contained runaway.
Test Method The test is conducted in a small (10 cm3), metal sample bomb containing between 1 and 6 g of the test substance. The spherical bombs can be manufactured from a variety of metals to overcome any potential corrosion or catalytic incompatibilities.
The bomb is connected to a pressure transducer and temperature sensor and located in the center of an adiabatic enclosure. Tests can be performed using either an isothermal or heat-wait-search (HWS) temperature profile. The normal temperature range of the test is from 25°C to 400°C. However the cryogenic unit can reduce the oven temperature to -40°C which allows testing from -40°C. This helps in detecting low temperature exothermic decompositions. The more common HWS method involves heating the material in steps using a radiant heater, waiting for thermal equilibration, and then searching for any evidence of exothermic heat release above the detection threshold (nominally 0.02 K.min-1). If no activity is observed, the cycle is repeated until activity is detected – at which point the reaction is adiabatically tracked to completion. The test cell contents can be agitated however it results in a relatively high thermal inertia factor. The automatic dosing unit allows addition of liquid reagents at elevated pressures and at time during the test. The system has outstanding pressure capability (up to several hundred bar) and is very sensitive. The vent sizing unit/option allows closed vessel tests, tempering and hydrodynamic tests.
Results and Interpretation The onset of activity is denoted as the lowest temperature at which the detection threshold of the calorimeter is exceeded. The subsequent rates and magnitudes of reaction can then be established from the raw temperature / pressure / time data. The temperature rise can be converted into a heat of reaction is the thermal inertia of the cell and heat capacity of the sample are known. Furthermore, kinetic parameters such as activation energy can be determined. Although the thermal inertia is high, the software permits phi factor correction of the temperature data to yield information on parameters such as time to maximum rate. The data can be used, with supporting data, to estimate the self-accelerating decomposition temperature of a sample. The onset temperature of activity – if uncorrected – requires provision of a safety margin of between 20 and 40°C – depending on application.
Reduced Versions of the Test : No reduced version of this test exists.
Test Limitations The test method has a relatively high phi factor (normally in the range 1.5 to 3). This infers that mathematical correction of the data is required for direct application or a suitable safety margin is required for specifying maximum plant exposure temperatures. The test vessel is not normally agitated – which impacts on the ability to study biphasic systems. Remote additions to initiate reaction are extremely difficult owing to the small nature of the test cell.
A.2. Carius (10 G) Tube Screening Test
International Standard No formal standard applies although the method is described in the ABPI and IChemE publications on Chemical Reaction Hazard Assessment and is considered best practice.
Quantity of Sample 10 g per test (although 30 g preferred to allow duplication of test).Alternative Tests Many alternative DTA methods existTest Purpose The test is designed to provide a preliminary indication of the thermal behavior of a material. Exothermic,
endothermic and gas generating events are determined in a semi-quantitative fashion. The test can be undertaken on a liquid, solid or mixture.
Test Method A small quantity of material (10 - 15 cm3) is placed in the Carius tube which is positioned at the center of a furnace, connected to a pressure transducer and ramped (at a constant rate of typically 0.5 K.min-1) from ambient temperature to 400°C or a tube pressure of 55 barg (whichever comes first). Energetic events are indicated by positive (exothermic) or negative (endothermic) deviations from the baseline temperature differential between sample and oven. Pumped additions to initiate a reaction and agitation are possible with this test.
Results and Interpretation The output contains three graphs. Graph (a) is a full temperature, pressure and time trace. Graph (b) is a plot of temperature versus the differential between the oven and sample. Graph (c) is a plot of ln(pressure) versus the reciprocal of absolute temperature. The onset of an event is recorded as the point at which a deviation in differential temperature is just observed (upwards = exotherm, downwards = endotherm). A safety factor of typically 50 K is used on onset temperature to account for the high heat losses of the test equipment. The peak height (and width) are a measure of the magnitude of the event although these are only qualitative and are not directly scalable. A wide peak is indicative of a mass transfer controlled reaction. An upward deviation from linearity in the Antoine plot indicates the onset of gas generation. The steepness of the rise is indicative of the rapidity of gas generation. The residual pressure in the tube after cooling gives a quantitative measure of the gases evolved (mass spectrometry can be employed of assess the nature of the gas).
Reduced Versions of the Test No reduced version of this test exists.Test Limitations The results are not directly scalable (i.e. need a margin of safety). For powders, lack of air availability may
hinder detection of oxidation events.
3736
A.5 Adiabatic Pressure Dewar CalorimetryA.4 Heat Flow Calorimetry (Mettler Toledo Rc1 Reaction Calorimeter)
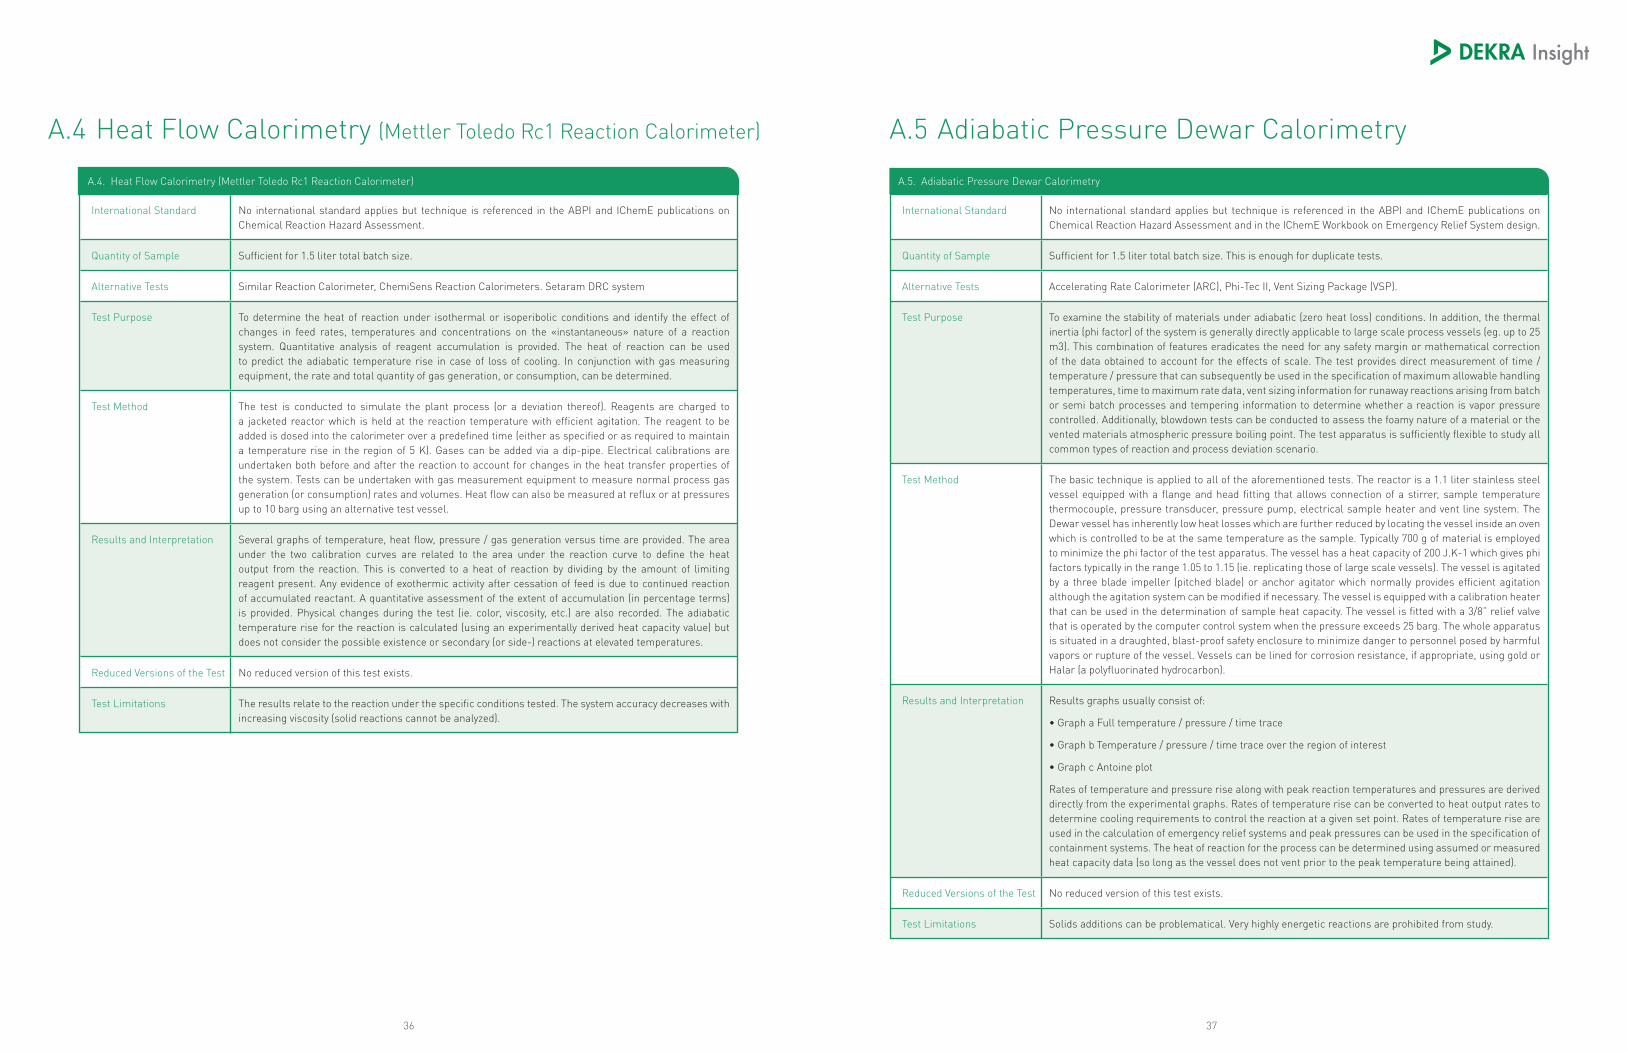
A.4. Heat Flow Calorimetry (Mettler Toledo Rc1 Reaction Calorimeter)
International Standard No international standard applies but technique is referenced in the ABPI and IChemE publications on Chemical Reaction Hazard Assessment.
Quantity of Sample Sufficient for 1.5 liter total batch size.
Alternative Tests Similar Reaction Calorimeter, ChemiSens Reaction Calorimeters. Setaram DRC system
Test Purpose To determine the heat of reaction under isothermal or isoperibolic conditions and identify the effect of changes in feed rates, temperatures and concentrations on the «instantaneous» nature of a reaction system. Quantitative analysis of reagent accumulation is provided. The heat of reaction can be used to predict the adiabatic temperature rise in case of loss of cooling. In conjunction with gas measuring equipment, the rate and total quantity of gas generation, or consumption, can be determined.
Test Method The test is conducted to simulate the plant process (or a deviation thereof). Reagents are charged to a jacketed reactor which is held at the reaction temperature with efficient agitation. The reagent to be added is dosed into the calorimeter over a predefined time (either as specified or as required to maintain a temperature rise in the region of 5 K). Gases can be added via a dip-pipe. Electrical calibrations are undertaken both before and after the reaction to account for changes in the heat transfer properties of the system. Tests can be undertaken with gas measurement equipment to measure normal process gas generation (or consumption) rates and volumes. Heat flow can also be measured at reflux or at pressures up to 10 barg using an alternative test vessel.
Results and Interpretation Several graphs of temperature, heat flow, pressure / gas generation versus time are provided. The area under the two calibration curves are related to the area under the reaction curve to define the heat output from the reaction. This is converted to a heat of reaction by dividing by the amount of limiting reagent present. Any evidence of exothermic activity after cessation of feed is due to continued reaction of accumulated reactant. A quantitative assessment of the extent of accumulation (in percentage terms) is provided. Physical changes during the test (ie. color, viscosity, etc.) are also recorded. The adiabatic temperature rise for the reaction is calculated (using an experimentally derived heat capacity value) but does not consider the possible existence or secondary (or side-) reactions at elevated temperatures.
Reduced Versions of the Test No reduced version of this test exists.
Test Limitations The results relate to the reaction under the specific conditions tested. The system accuracy decreases with increasing viscosity (solid reactions cannot be analyzed).
A.5. Adiabatic Pressure Dewar Calorimetry
International Standard No international standard applies but technique is referenced in the ABPI and IChemE publications on Chemical Reaction Hazard Assessment and in the IChemE Workbook on Emergency Relief System design.
Quantity of Sample Sufficient for 1.5 liter total batch size. This is enough for duplicate tests.
Alternative Tests Accelerating Rate Calorimeter (ARC), Phi-Tec II, Vent Sizing Package (VSP).
Test Purpose To examine the stability of materials under adiabatic (zero heat loss) conditions. In addition, the thermal inertia (phi factor) of the system is generally directly applicable to large scale process vessels (eg. up to 25 m3). This combination of features eradicates the need for any safety margin or mathematical correction of the data obtained to account for the effects of scale. The test provides direct measurement of time / temperature / pressure that can subsequently be used in the specification of maximum allowable handling temperatures, time to maximum rate data, vent sizing information for runaway reactions arising from batch or semi batch processes and tempering information to determine whether a reaction is vapor pressure controlled. Additionally, blowdown tests can be conducted to assess the foamy nature of a material or the vented materials atmospheric pressure boiling point. The test apparatus is sufficiently flexible to study all common types of reaction and process deviation scenario.
Test Method The basic technique is applied to all of the aforementioned tests. The reactor is a 1.1 liter stainless steel vessel equipped with a flange and head fitting that allows connection of a stirrer, sample temperature thermocouple, pressure transducer, pressure pump, electrical sample heater and vent line system. The Dewar vessel has inherently low heat losses which are further reduced by locating the vessel inside an oven which is controlled to be at the same temperature as the sample. Typically 700 g of material is employed to minimize the phi factor of the test apparatus. The vessel has a heat capacity of 200 J.K-1 which gives phi factors typically in the range 1.05 to 1.15 (ie. replicating those of large scale vessels). The vessel is agitated by a three blade impeller (pitched blade) or anchor agitator which normally provides efficient agitation although the agitation system can be modified if necessary. The vessel is equipped with a calibration heater that can be used in the determination of sample heat capacity. The vessel is fitted with a 3/8” relief valve that is operated by the computer control system when the pressure exceeds 25 barg. The whole apparatus is situated in a draughted, blast-proof safety enclosure to minimize danger to personnel posed by harmful vapors or rupture of the vessel. Vessels can be lined for corrosion resistance, if appropriate, using gold or Halar (a polyfluorinated hydrocarbon).
Results and Interpretation Results graphs usually consist of:
• Graph a Full temperature / pressure / time trace
• Graph b Temperature / pressure / time trace over the region of interest
• Graph c Antoine plot
Rates of temperature and pressure rise along with peak reaction temperatures and pressures are derived directly from the experimental graphs. Rates of temperature rise can be converted to heat output rates to determine cooling requirements to control the reaction at a given set point. Rates of temperature rise are used in the calculation of emergency relief systems and peak pressures can be used in the specification of containment systems. The heat of reaction for the process can be determined using assumed or measured heat capacity data (so long as the vessel does not vent prior to the peak temperature being attained).
Reduced Versions of the Test No reduced version of this test exists.
Test Limitations Solids additions can be problematical. Very highly energetic reactions are prohibited from study.
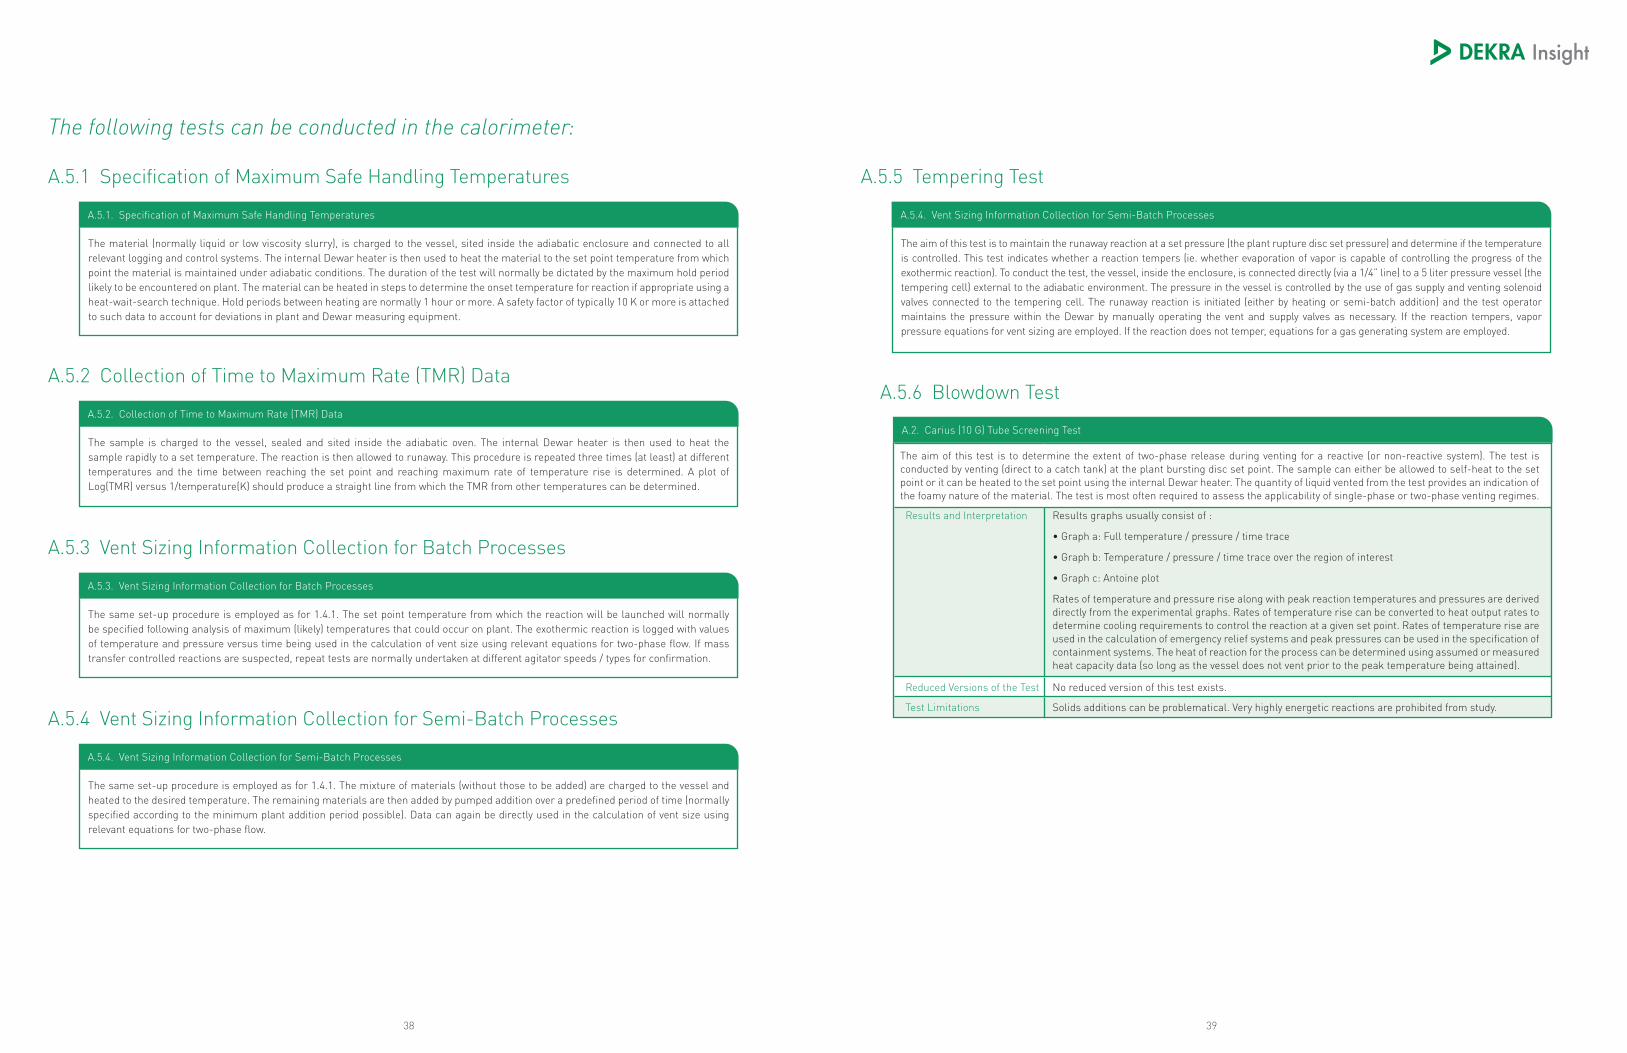
3938
The following tests can be conducted in the calorimeter:
A.5.1 Specification of Maximum Safe Handling Temperatures
A.5.2 Collection of Time to Maximum Rate (TMR) DataA.5.6 Blowdown Test
A.5.3 Vent Sizing Information Collection for Batch Processes
A.5.4 Vent Sizing Information Collection for Semi-Batch Processes
A.5.5 Tempering Test
A.5.1. Specification of Maximum Safe Handling Temperatures
A.5.2. Collection of Time to Maximum Rate (TMR) Data
A.5.3. Vent Sizing Information Collection for Batch Processes
A.5.4. Vent Sizing Information Collection for Semi-Batch Processes
A.5.4. Vent Sizing Information Collection for Semi-Batch Processes
The material (normally liquid or low viscosity slurry), is charged to the vessel, sited inside the adiabatic enclosure and connected to all relevant logging and control systems. The internal Dewar heater is then used to heat the material to the set point temperature from which point the material is maintained under adiabatic conditions. The duration of the test will normally be dictated by the maximum hold period likely to be encountered on plant. The material can be heated in steps to determine the onset temperature for reaction if appropriate using a heat-wait-search technique. Hold periods between heating are normally 1 hour or more. A safety factor of typically 10 K or more is attached to such data to account for deviations in plant and Dewar measuring equipment.
The sample is charged to the vessel, sealed and sited inside the adiabatic oven. The internal Dewar heater is then used to heat the sample rapidly to a set temperature. The reaction is then allowed to runaway. This procedure is repeated three times (at least) at different temperatures and the time between reaching the set point and reaching maximum rate of temperature rise is determined. A plot of Log(TMR) versus 1/temperature(K) should produce a straight line from which the TMR from other temperatures can be determined.
The same set-up procedure is employed as for 1.4.1. The set point temperature from which the reaction will be launched will normally be specified following analysis of maximum (likely) temperatures that could occur on plant. The exothermic reaction is logged with values of temperature and pressure versus time being used in the calculation of vent size using relevant equations for two-phase flow. If mass transfer controlled reactions are suspected, repeat tests are normally undertaken at different agitator speeds / types for confirmation.
The same set-up procedure is employed as for 1.4.1. The mixture of materials (without those to be added) are charged to the vessel and heated to the desired temperature. The remaining materials are then added by pumped addition over a predefined period of time (normally specified according to the minimum plant addition period possible). Data can again be directly used in the calculation of vent size using relevant equations for two-phase flow.
The aim of this test is to maintain the runaway reaction at a set pressure (the plant rupture disc set pressure) and determine if the temperature is controlled. This test indicates whether a reaction tempers (ie. whether evaporation of vapor is capable of controlling the progress of the exothermic reaction). To conduct the test, the vessel, inside the enclosure, is connected directly (via a 1/4” line) to a 5 liter pressure vessel (the tempering cell) external to the adiabatic environment. The pressure in the vessel is controlled by the use of gas supply and venting solenoid valves connected to the tempering cell. The runaway reaction is initiated (either by heating or semi-batch addition) and the test operator maintains the pressure within the Dewar by manually operating the vent and supply valves as necessary. If the reaction tempers, vapor pressure equations for vent sizing are employed. If the reaction does not temper, equations for a gas generating system are employed.
A.2. Carius (10 G) Tube Screening Test
The aim of this test is to determine the extent of two-phase release during venting for a reactive (or non-reactive system). The test is conducted by venting (direct to a catch tank) at the plant bursting disc set point. The sample can either be allowed to self-heat to the set point or it can be heated to the set point using the internal Dewar heater. The quantity of liquid vented from the test provides an indication of the foamy nature of the material. The test is most often required to assess the applicability of single-phase or two-phase venting regimes.
Results and Interpretation Results graphs usually consist of :
• Graph a: Full temperature / pressure / time trace
• Graph b: Temperature / pressure / time trace over the region of interest
• Graph c: Antoine plot
Rates of temperature and pressure rise along with peak reaction temperatures and pressures are derived directly from the experimental graphs. Rates of temperature rise can be converted to heat output rates to determine cooling requirements to control the reaction at a given set point. Rates of temperature rise are used in the calculation of emergency relief systems and peak pressures can be used in the specification of containment systems. The heat of reaction for the process can be determined using assumed or measured heat capacity data (so long as the vessel does not vent prior to the peak temperature being attained).
Reduced Versions of the Test No reduced version of this test exists.
Test Limitations Solids additions can be problematical. Very highly energetic reactions are prohibited from study.
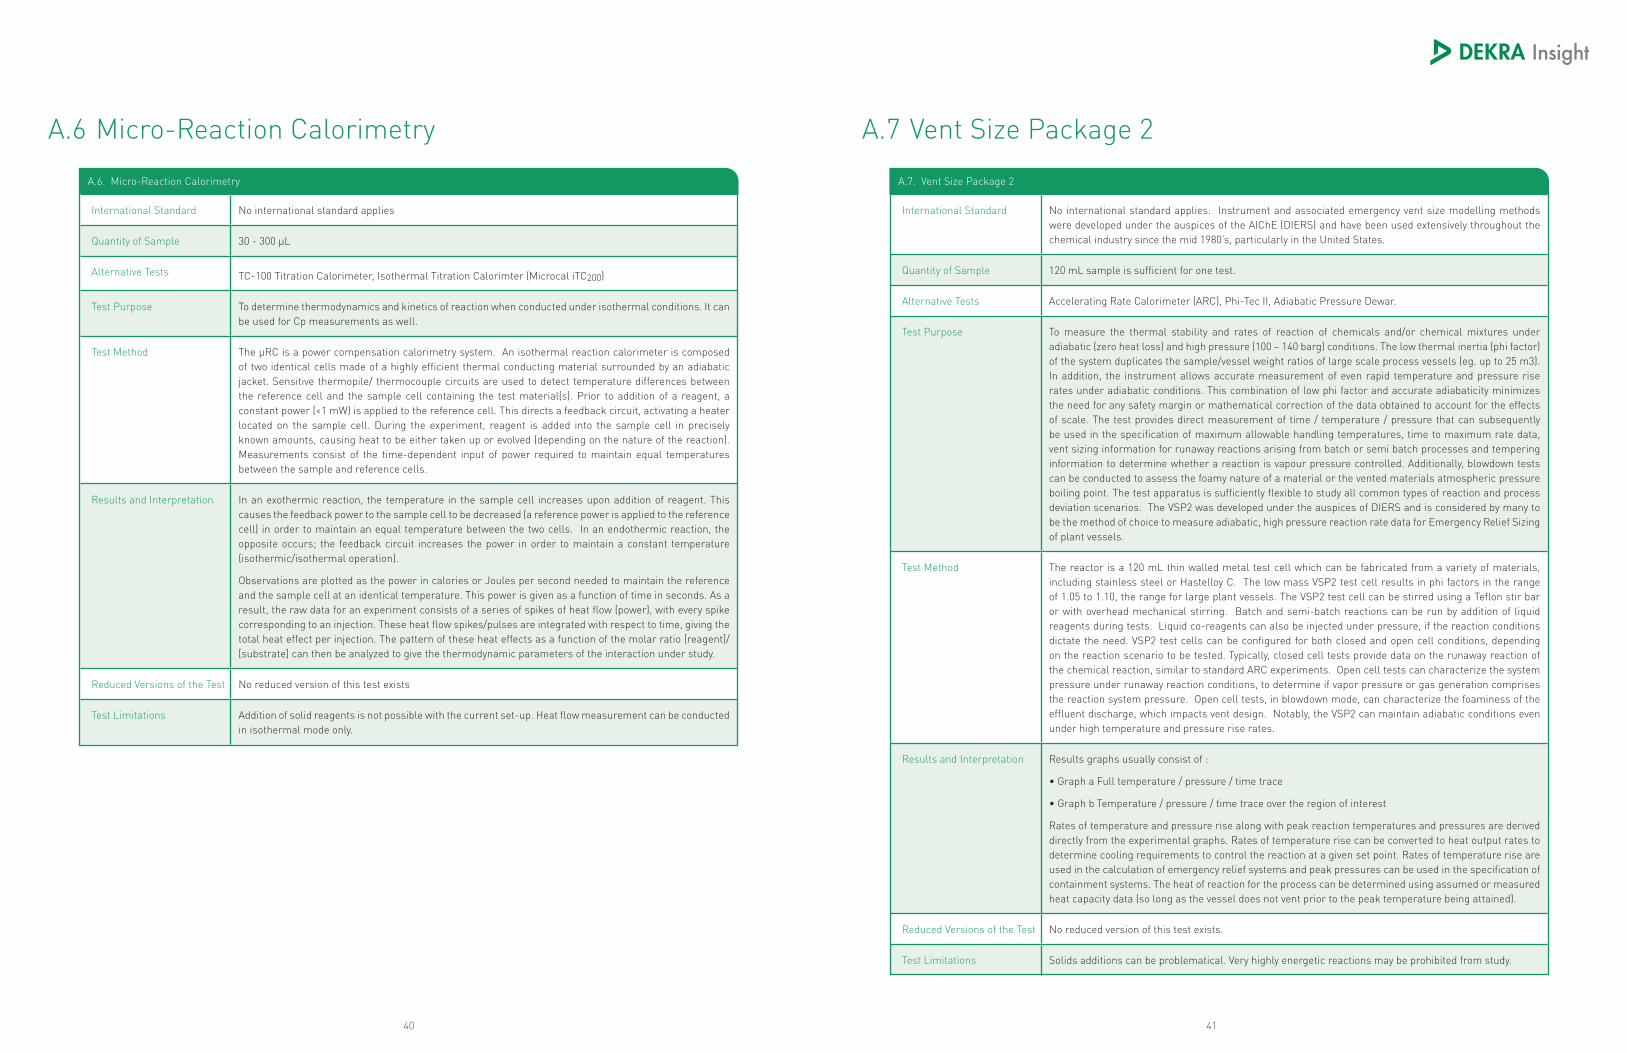
4140
A.6 Micro-Reaction Calorimetry A.7 Vent Size Package 2
A.6. Micro-Reaction Calorimetry
International Standard No international standard applies
Quantity of Sample 30 - 300 µL
Alternative Tests TC-100 Titration Calorimeter, Isothermal Titration Calorimter (Microcal iTC200)
Test Purpose To determine thermodynamics and kinetics of reaction when conducted under isothermal conditions. It can be used for Cp measurements as well.
Test Method The µRC is a power compensation calorimetry system. An isothermal reaction calorimeter is composed of two identical cells made of a highly efficient thermal conducting material surrounded by an adiabatic jacket. Sensitive thermopile/ thermocouple circuits are used to detect temperature differences between the reference cell and the sample cell containing the test material(s). Prior to addition of a reagent, a constant power (<1 mW) is applied to the reference cell. This directs a feedback circuit, activating a heater located on the sample cell. During the experiment, reagent is added into the sample cell in precisely known amounts, causing heat to be either taken up or evolved (depending on the nature of the reaction). Measurements consist of the time-dependent input of power required to maintain equal temperatures between the sample and reference cells.
Results and Interpretation In an exothermic reaction, the temperature in the sample cell increases upon addition of reagent. This causes the feedback power to the sample cell to be decreased (a reference power is applied to the reference cell) in order to maintain an equal temperature between the two cells. In an endothermic reaction, the opposite occurs; the feedback circuit increases the power in order to maintain a constant temperature (isothermic/isothermal operation).
Observations are plotted as the power in calories or Joules per second needed to maintain the reference and the sample cell at an identical temperature. This power is given as a function of time in seconds. As a result, the raw data for an experiment consists of a series of spikes of heat flow (power), with every spike corresponding to an injection. These heat flow spikes/pulses are integrated with respect to time, giving the total heat effect per injection. The pattern of these heat effects as a function of the molar ratio [reagent]/ [substrate] can then be analyzed to give the thermodynamic parameters of the interaction under study.
Reduced Versions of the Test No reduced version of this test exists
Test Limitations Addition of solid reagents is not possible with the current set-up. Heat flow measurement can be conducted in isothermal mode only.
A.7. Vent Size Package 2
International Standard No international standard applies. Instrument and associated emergency vent size modelling methods were developed under the auspices of the AIChE (DIERS) and have been used extensively throughout the chemical industry since the mid 1980’s, particularly in the United States.
Quantity of Sample 120 mL sample is sufficient for one test.
Alternative Tests Accelerating Rate Calorimeter (ARC), Phi-Tec II, Adiabatic Pressure Dewar.
Test Purpose To measure the thermal stability and rates of reaction of chemicals and/or chemical mixtures under adiabatic (zero heat loss) and high pressure (100 – 140 barg) conditions. The low thermal inertia (phi factor) of the system duplicates the sample/vessel weight ratios of large scale process vessels (eg. up to 25 m3). In addition, the instrument allows accurate measurement of even rapid temperature and pressure rise rates under adiabatic conditions. This combination of low phi factor and accurate adiabaticity minimizes the need for any safety margin or mathematical correction of the data obtained to account for the effects of scale. The test provides direct measurement of time / temperature / pressure that can subsequently be used in the specification of maximum allowable handling temperatures, time to maximum rate data, vent sizing information for runaway reactions arising from batch or semi batch processes and tempering information to determine whether a reaction is vapour pressure controlled. Additionally, blowdown tests can be conducted to assess the foamy nature of a material or the vented materials atmospheric pressure boiling point. The test apparatus is sufficiently flexible to study all common types of reaction and process deviation scenarios. The VSP2 was developed under the auspices of DIERS and is considered by many to be the method of choice to measure adiabatic, high pressure reaction rate data for Emergency Relief Sizing of plant vessels.
Test Method The reactor is a 120 mL thin walled metal test cell which can be fabricated from a variety of materials, including stainless steel or Hastelloy C. The low mass VSP2 test cell results in phi factors in the range of 1.05 to 1.10, the range for large plant vessels. The VSP2 test cell can be stirred using a Teflon stir bar or with overhead mechanical stirring. Batch and semi-batch reactions can be run by addition of liquid reagents during tests. Liquid co-reagents can also be injected under pressure, if the reaction conditions dictate the need. VSP2 test cells can be configured for both closed and open cell conditions, depending on the reaction scenario to be tested. Typically, closed cell tests provide data on the runaway reaction of the chemical reaction, similar to standard ARC experiments. Open cell tests can characterize the system pressure under runaway reaction conditions, to determine if vapor pressure or gas generation comprises the reaction system pressure. Open cell tests, in blowdown mode, can characterize the foaminess of the effluent discharge, which impacts vent design. Notably, the VSP2 can maintain adiabatic conditions even under high temperature and pressure rise rates.
Results and Interpretation Results graphs usually consist of :
• Graph a Full temperature / pressure / time trace
• Graph b Temperature / pressure / time trace over the region of interest
Rates of temperature and pressure rise along with peak reaction temperatures and pressures are derived directly from the experimental graphs. Rates of temperature rise can be converted to heat output rates to determine cooling requirements to control the reaction at a given set point. Rates of temperature rise are used in the calculation of emergency relief systems and peak pressures can be used in the specification of containment systems. The heat of reaction for the process can be determined using assumed or measured heat capacity data (so long as the vessel does not vent prior to the peak temperature being attained).
Reduced Versions of the Test No reduced version of this test exists.
Test Limitations Solids additions can be problematical. Very highly energetic reactions may be prohibited from study.
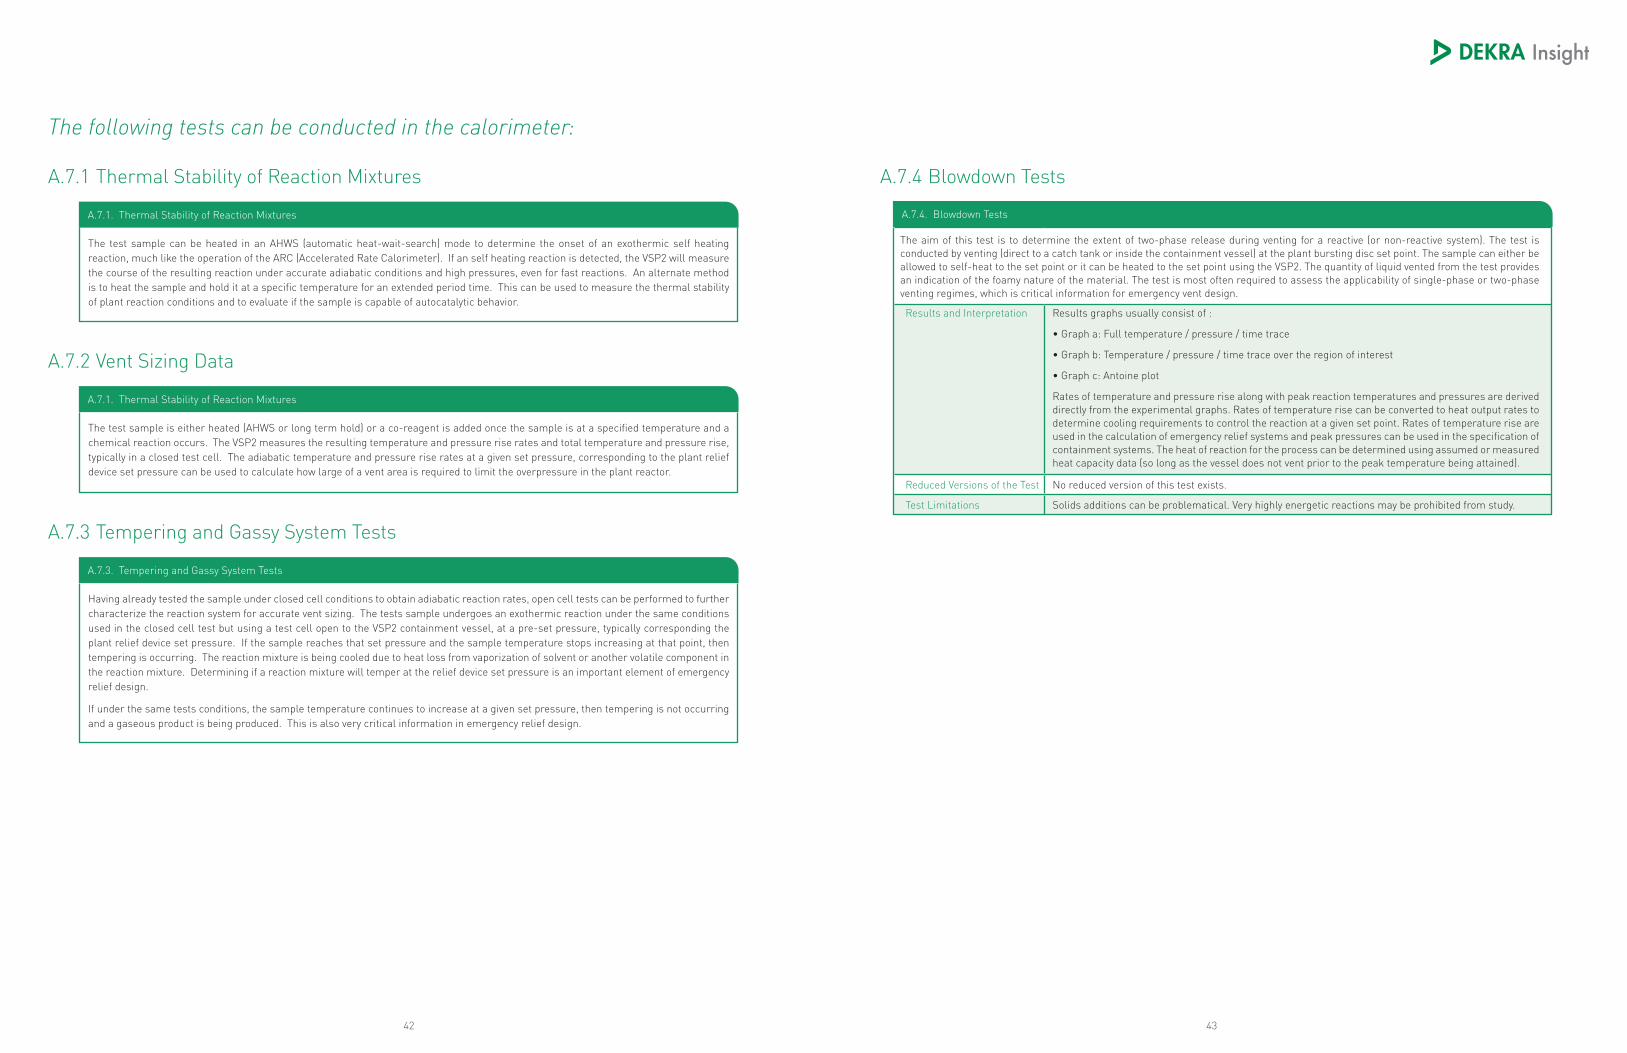
4342
The following tests can be conducted in the calorimeter:
A.7.1 Thermal Stability of Reaction Mixtures
A.7.2 Vent Sizing Data
A.7.4 Blowdown Tests
A.7.3 Tempering and Gassy System Tests
A.7.1. Thermal Stability of Reaction Mixtures
A.7.1. Thermal Stability of Reaction Mixtures
A.7.3. Tempering and Gassy System Tests
The test sample can be heated in an AHWS (automatic heat-wait-search) mode to determine the onset of an exothermic self heating reaction, much like the operation of the ARC (Accelerated Rate Calorimeter). If an self heating reaction is detected, the VSP2 will measure the course of the resulting reaction under accurate adiabatic conditions and high pressures, even for fast reactions. An alternate method is to heat the sample and hold it at a specific temperature for an extended period time. This can be used to measure the thermal stability of plant reaction conditions and to evaluate if the sample is capable of autocatalytic behavior.
The test sample is either heated (AHWS or long term hold) or a co-reagent is added once the sample is at a specified temperature and a chemical reaction occurs. The VSP2 measures the resulting temperature and pressure rise rates and total temperature and pressure rise, typically in a closed test cell. The adiabatic temperature and pressure rise rates at a given set pressure, corresponding to the plant relief device set pressure can be used to calculate how large of a vent area is required to limit the overpressure in the plant reactor.
Having already tested the sample under closed cell conditions to obtain adiabatic reaction rates, open cell tests can be performed to further characterize the reaction system for accurate vent sizing. The tests sample undergoes an exothermic reaction under the same conditions used in the closed cell test but using a test cell open to the VSP2 containment vessel, at a pre-set pressure, typically corresponding the plant relief device set pressure. If the sample reaches that set pressure and the sample temperature stops increasing at that point, then tempering is occurring. The reaction mixture is being cooled due to heat loss from vaporization of solvent or another volatile component in the reaction mixture. Determining if a reaction mixture will temper at the relief device set pressure is an important element of emergency relief design.
If under the same tests conditions, the sample temperature continues to increase at a given set pressure, then tempering is not occurring and a gaseous product is being produced. This is also very critical information in emergency relief design.
A.7.4. Blowdown Tests
The aim of this test is to determine the extent of two-phase release during venting for a reactive (or non-reactive system). The test is conducted by venting (direct to a catch tank or inside the containment vessel) at the plant bursting disc set point. The sample can either be allowed to self-heat to the set point or it can be heated to the set point using the VSP2. The quantity of liquid vented from the test provides an indication of the foamy nature of the material. The test is most often required to assess the applicability of single-phase or two-phase venting regimes, which is critical information for emergency vent design.
Results and Interpretation Results graphs usually consist of :
• Graph a: Full temperature / pressure / time trace
• Graph b: Temperature / pressure / time trace over the region of interest
• Graph c: Antoine plot
Rates of temperature and pressure rise along with peak reaction temperatures and pressures are derived directly from the experimental graphs. Rates of temperature rise can be converted to heat output rates to determine cooling requirements to control the reaction at a given set point. Rates of temperature rise are used in the calculation of emergency relief systems and peak pressures can be used in the specification of containment systems. The heat of reaction for the process can be determined using assumed or measured heat capacity data (so long as the vessel does not vent prior to the peak temperature being attained).
Reduced Versions of the Test No reduced version of this test exists.
Test Limitations Solids additions can be problematical. Very highly energetic reactions may be prohibited from study.

4444
DEKRA Insight Process Safety
> China DEKRA China www.chilworth.cn> France Chilworth France SAS www.chilworth.fr> India Chilworth Technology Private Ltd. www.chilworth.co.in> Italy Chilworth Vassallo S.r.l. www.chilworth.it> Netherlands Chilworth The Netherlands www.chilworth.nl> Spain Chilworth Amalthea S.L. www.chilworth.es> Sweden DEKRA Insight AB www.chilworth.se> UK Chilworth Technology Ltd. www.chilworth.co.uk> USA Chilworth Technology Inc. www.chilworth.com> USA Safety Consulting Engineers, Inc. www.sceinc.com