Chemical Looping Technology · Chemical Looping Technology L. S. Fan Department of Chemical and...
27
Chemical Looping Technology L. S. Fan Department of Chemical and Biomolecular Engineering The Ohio State University Columbus, Ohio 43210 U.S.A. by ICEST June 2, 2014
Transcript of Chemical Looping Technology · Chemical Looping Technology L. S. Fan Department of Chemical and...

Chemical Looping Technology
L. S. FanDepartment of Chemical and Biomolecular
Engineering The Ohio State University
Columbus, Ohio 43210U.S.A.
by
ICESTJune 2, 2014

Number of Publications with “Chemical Looping” in the Titles on Google Scholars
0
200
400
600
800
1000
1200
1986 1989 1992 1995 1998 2001 2004 2007 2010 2013
Nu
mb
er
of
Pu
blic
atio
ns
Year

Combustion System

Gasification System
Sulfur
By-Product
Fly Ash
By-Product
Slag
By-Product
Steigel and Ramezan, 2006
IGCC Efficiency: 33% with CO2 control

5
Chemical Looping Systems with CO2 Generation or Separation
Two typical types of looping reaction systems
Oxygen Carrier (Type I)
Me/MeO, MeS/MeSO4
CO2 Carrier (Type II)
MeO/MeCO3
“1st Meeting of High Temperature Solids Looping Cycle
Network”, Oviedo, Spain, September 15-17 (2009).
“1st International Conference on Chemical
Looping”, Lyon, France, March 17-19 (2010).

Chemical Looping Systems with Non-CO2
Generation
CH4 or other Carbonaceous Fuels
CH4 or other Carbonaceous Fuels
Syngas CO + H2 Chemicals
Solar Energy/Nuclear Energy
H2O H2 + O2
chemical looping chemical loopingchemical looping

CO2 Capture from Fossil Energy – Technological Solutions
Source: José D. Figueroa, National Energy Technology Laboratory (NETL), USDOE

0
10
20
30
40
50
60
70
80
90
0 20 40 60 80 100
% Electricity
Ov
era
ll P
roc
es
s E
ffic
ien
cy
0
10
20
30
40
50
60
70
80
90
SCL
Gasfication-WGS
IGCC-SELEXOL
Subcritical MEA
Ultra-supercritical MEA
Ultra-Supercritical Chilled Ammonia
Syngas CLC
H2 Membrane WGS
CO2 Membrane WGS
CDCL
Comparison of OSU SYNGAS and Coal Direct Chemical Looping (CDCL) Processes with Traditional Coal to Hydrogen/Electricity
Processes
Assumptions used are similar to those adopted by the USDOE baseline studies.

9
ε ≈ 1
Partial oxidation
/Gasification
ε = 0.88
H2 + CO
407.7 kJ
358.9 kJ
0 Heat Loss
48.8 kJ Exergy Loss
Water Gas Shift
H2 +CO2
393.4 kJ
322.9 kJ
ε = 0.82
ε = 0.89
Fe
514.8 kJ
456.4 kJFe3O4 @1023K
(0.395 mol)
107.1 kJ
71.9 kJ
ε = 0.669
14.3 kJ Heat Loss
36 kJ Exergy Loss
H2 + Fe3O4
485.5 + 107.1 kJ
396.9 +71.9 kJ
ε = 0.82
Carbon
407.7 kJ/mol
407.7 kJ/mol
23.2 kJ Exergy Loss77.8 kJ thermal
energy @ 380 K
12.41kJ Exergy
ε = 0.16
Partial oxidation
I
II
Substance
Enthalpy of degradation
Exergy
Exergy Rate (ε)
Energy/Exery Loss
Additional Energy Input
Final Product
I. Contional Process
Exergetic Efficiency
322.9/407.7 = 79.2%
II. Chemcial Looping Process
Exergetic Efficiency
396.9/(407.7 + 12.41)=94.5%
Exergy Analysis on Hydrogen Production

Economics of Chemical Looping Process
Thomas, T., L.-S. Fan, P. Gupta, and L. G. Velazquez-Vargas, “Combustion Looping Using Composite Oxygen Carriers” U.S. Patent No. 7,767,191 (2010, priority date 2003)
The CDCL process can be also used for high efficient hydrogen production
Reducer
Combustor
Pump
Coal Prep.Coal
CO2
compressor
Particulate Removal
FGD Stack
CO2
Sequestration
LPIPHP
Air
Fe2O3
Cooling Tower
ID Fan
Water
ID Fan
H2O
CO2+H2O
Enhancer Gas Recycle Fan
Electricity
Carrier Particle Makeup (Fe2O3)
Fly Ash and Carrier Particle Fines
FGD
Spent Air
Steam
WaterSteam Cycle
FeO/Fe
Existing equipment for repowering case
Existing equipment for repowering case
Existing equipment for repowering case
BasePlant
MEAPlant
CDCLPlant
First-Year Capital ($/MWh) 31.7 59.6 44.2
Fixed O&M ($/MWh) 8.0 13.0 9.6
Coal ($/MWh) 14.2 19.6 15.9
Variable O&M ($/MWh) 5.0 8.7 8.7
TOTAL FIRST-YEAR COE ($/MWh)
58.9 100.9 78.4
∆ = +71%
∆ = +33%
• Retrofit to conventional coal combustion process• CDCL replaces existing PC boiler
– Additional equipment for CO2 compression and transportation required
• Techno-Economic analysis performed comparing CDCL to Base Plant with no CO2capture and 90% CO2 capture via post-combustion MEA process

Ellingham Diagram: Selection of Primary Metal
Oxygen Carrier Particle Development
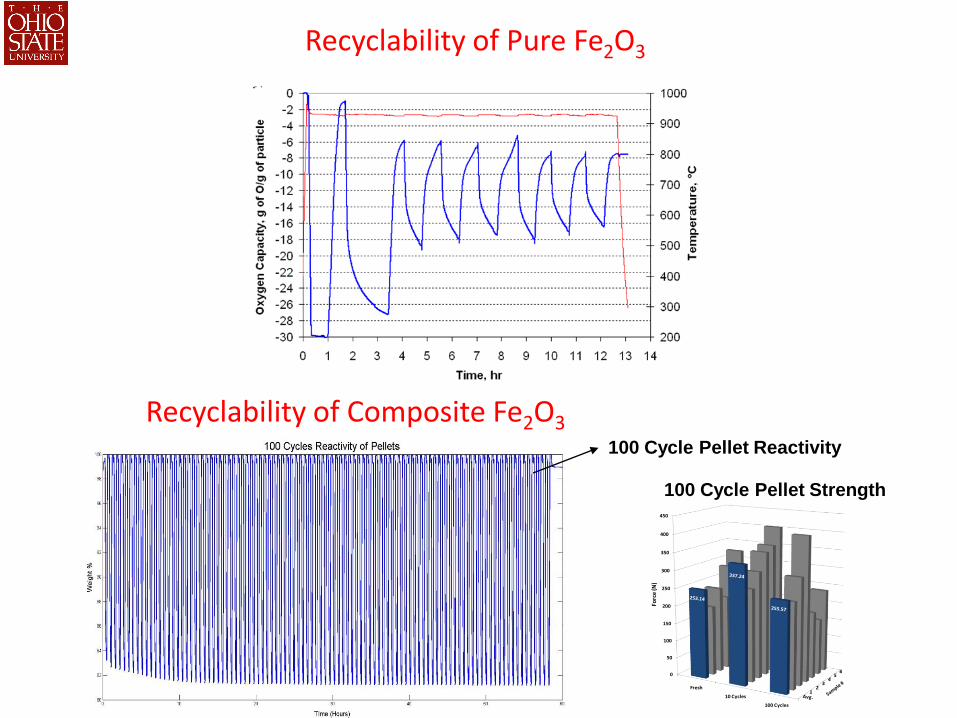
Recyclability of Composite Fe2O3
0
50
100
150
200
250
300
350
400
450
Fresh
10 Cycles
100 Cycles
Forc
e (N
)
100 Cycle Pellet Reactivity
100 Cycle Pellet Strength
Recyclability of Pure Fe2O3

Structures of Iron Oxide
NaCl Type
oxygen close-packed
cubic pattern
iron occupy all
octahedral interstices
inverse Spinel Type
FeO Fe3O4
octahedral interstices
1/2 occupation rate
tetrahedral interstices
1/8 occupation rate

Core-Shell Particle Formation through Cyclic Gas-Solid Reactions
4Fe (s) + 3O2 (g) 2Fe2O3 (s) (1)
Fe2O3 (s) + 3H2 (g) 2Fe (s) + 3H2O (g) (2)
If the cyclic reactions proceed through
Fe cation diffusion, core-shell structure
forms, e.g. Fe2O3 + Al2O3.
If the cyclic reactions proceed through
O anion diffusion, core-shell structure
does not forms, e.g. Fe2O3 + TiO2.
*Al2O3 is only a physical support, while TiO2 alters the solid-phase ionic diffusion mechanism

Fe2O3+Al2O3 VS Fe2O3+TiO2
after 50 redox
cycles
after 50 redox
cycles

Original cross section Oxidation: cross sectionOxidation: surface with platelets and whiskers
EDS mapping of oxidized FeTi
Evolution in Cyclic Binary Metal/Metal Oxide Systems: I. FeTi

Role of Support – Oxidation of Fe and Fe/TiO2DFT Calculation
Energy barrier for O2- can be reduced after support addition
Oxygen anion transfer in Wüstite and Ilemnite
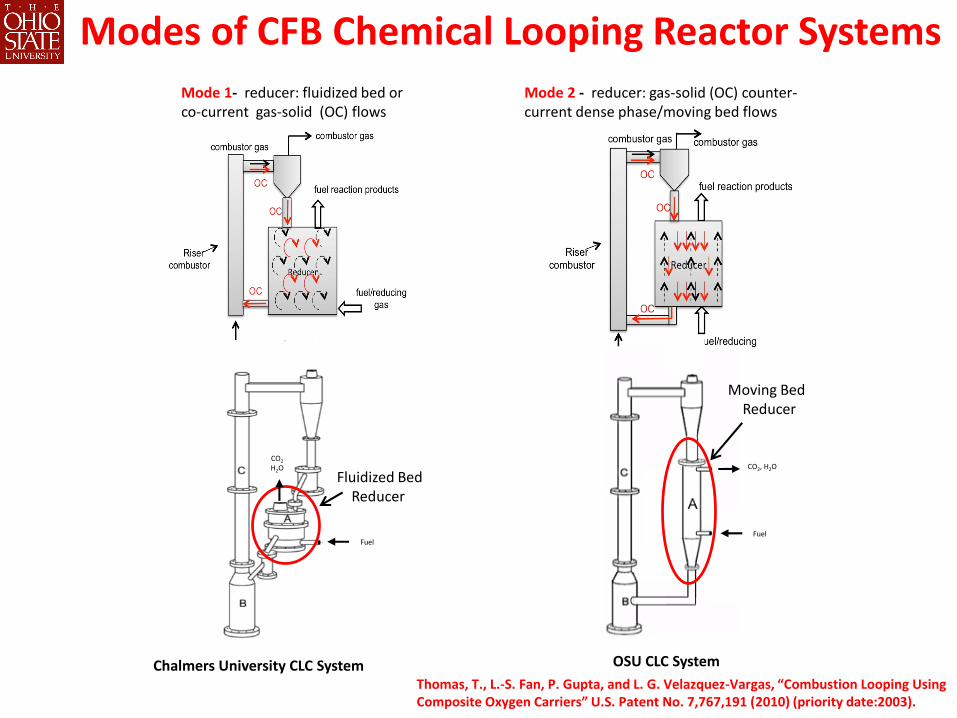
Modes of CFB Chemical Looping Reactor SystemsMode 1- reducer: fluidized bed or co-current gas-solid (OC) flows
Mode 2 - reducer: gas-solid (OC) counter-current dense phase/moving bed flows
Thomas, T., L.-S. Fan, P. Gupta, and L. G. Velazquez-Vargas, “Combustion Looping Using Composite Oxygen Carriers” U.S. Patent No. 7,767,191 (2010) (priority date:2003).
OSU CLC SystemChalmers University CLC System
Fuel
CO2
H2O CO2, H2O
Moving Bed Reducer
Fuel
Fluidized Bed Reducer
19
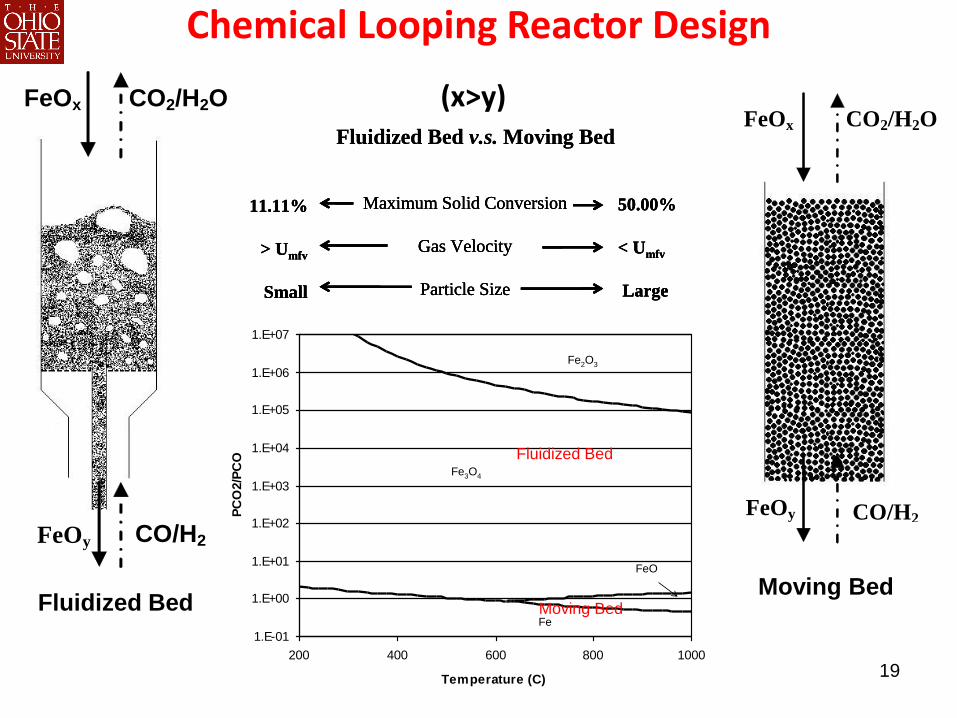
Chemical Looping Reactor Design
FeOy
FeOx
CO/H2
CO2/H2O
(x>y)
FeOy CO/H2
(x>y)
FeOx CO2/H2O
Fluidized BedMoving Bed
FeOy CO/H2
(X>Y)
FeOx CO2/H2O
Fluidized Bed Moving Bed
Moving Bed – The Selected Reactor Type
FeOy
FeOx
CO/H2
CO2/H2O
(X>Y)
Fluidized Bed v.s. Moving Bed
Maximum Solid Conversion
Gas Velocity
Particle Size
11.11%
> Umfv
Small
50.00%
< Umfv
Large
Fluidized Bed v.s. Moving Bed
Maximum Solid Conversion
Gas Velocity
Particle Size
11.11%
> Umfv
Small
50.00%
< Umfv
Large
Maximum Solid Conversion
Gas Velocity
Particle Size
11.11%
> Umfv
Small
50.00%
< Umfv
Large
1.E-01
1.E+00
1.E+01
1.E+02
1.E+03
1.E+04
1.E+05
1.E+06
1.E+07
200 400 600 800 1000
Temperature (C)
PC
O2/P
CO
Fe2O3
Fe3O4
FeO
Fe
1.E-01
1.E+00
1.E+01
1.E+02
1.E+03
1.E+04
1.E+05
1.E+06
1.E+07
200 400 600 800 1000
Temperature (C)
PC
O2/P
CO
Fe2O3
Fe3O4
FeO
Fe
Fluidized Bed
Moving Bed
(x>y)

20
Particle Type Ni Cu Fe
Type of Data
Lab
Scale
CFB 120
kW
Lab
Scale CFB 10kW Lab Scale
CFB
300W
Moving Bed -H2
25 kW
Particle Type
NiO/
MgAl2O4
NiO/
MgAl2O4
CuO/
Al2O3 CuO/Al2O3
Fe2O3/
MgAl2O4
Fe2O3/
Al2O3 Composite Fe2O3
Air Flow Rate @1000 MWth and 10% Excess (mol/s) 11784 1309
Volumetric Air Flow Rate at 1 atm and 900 ºC (m3/s) 1134 126
Particle Circulation Rate @ 1000 MWth (kg/s) 4000 10000 3000 6000 8000 10000 800
Reducer Solids Inventory (tonne) 230 160 70total
2100
500 12001500 Total
Oxidizer Solids Inventory (tonne) 390 80 390 n/a 350
Medium Particle Size (μm) 153 120 300 200 153 151 2000
Particle Density (g/cm3) 1.9 5 2.5 2.5 4.1 2.15 2.5
Ut (m/s) 2 0.8 2 1.2 1.1 0.6 11
Uc (m/s) 4 4.8 4.9 4.2 4.8 3.6 4
Use (m/s) 6 6.7 7.5 6.1 6.9 4.9 9.7
Typical Riser Superficial Gas Velocity (m/s) 7.00 12
Bed Area Turbulent Section (if Required) at 1 atm (m2) 231.47 25.18
Bed Area Required for Riser Section at 1 atm (m2) 162.03 10.49
Corresponding Riser Diameter (m) 14.37 3.66
Solids Flux at 1 atm (kg/m2s) 24.69 61.72 18.52 37.03 49.37 61.72 76.23
Number of Beds Needed given 8 m ID Riser 3.23 <1
Number of Beds Needed given 1.5 m ID Riser 91.73 5.94
Ug for a Single 1.5 m ID Riser at 1 atm (m/s) 642.14 71.29
Ug for a Single 8 m ID riser at 1 atm (m/s) 22.58 2.5 (Ug < Ut; N/A)
Required Pressure for a Single 1.5m ID Riser (atm) 91.73 10.00
Solids Flux for a Single 1.5 m ID Riser (kg/m2s) 2264.69 5661.71 1699 3397.03 4529.37 5661.71 452.88
Required Pressure for a Single 8 m ID Riser (atm) 3.23Ug < Ut; N/A
Solids Flux for a Single 8 m ID Riser (kg/m2s) 79.62 199.04 59.71 119.43 159.24 199.04
4000 – 10000 kg/s or 14,000 – 36,000 ton/hour
< 3,000 ton/hour
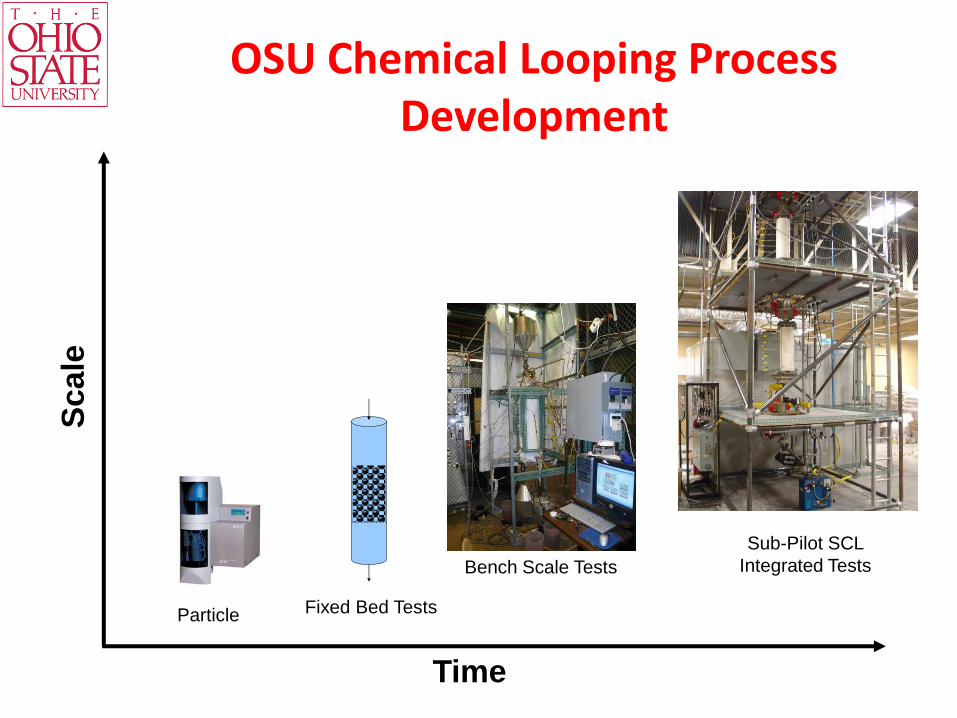
Particle Fixed Bed Tests
Bench Scale Tests
Time
Sca
le
Sub-Pilot SCL
Integrated Tests
OSU Chemical Looping Process Development

25 kWth OSU Sub-Pilot CDCL Demonstration for Coal Combustion
• Fully assembled and operational
• 500+ hours of operational experience
• 200+ hours continuous successful operation
• Smooth solid circulation
• Confirmed non-mechanical gas sealing under reactive conditions
• 13 test campaigns completed

Once-Through Reducer Carbon Conversion Profile Reducer Gas Concentration Profile
200+ Hour Sub-Pilot Continuous Run - Sample Results
0%
1%
1%
2%
2%
3%
3%
4%
4%
5%
5%
90%
91%
92%
93%
94%
95%
96%
97%
98%
99%
100%
0 50 100 150 200
Co
ncen
trati
on
CO
, C
H4,
O2 (
%)
Co
ncen
trati
on
CO
2 (
%)
Time (min)
CO2
CO
CH4
CH4
CO2
CO
0%
10%
20%
30%
40%
50%
60%
70%
80%
90%
100%
10 30 50 70 90 110 130
Carb
on
Co
nv
ers
ion
(%
)
Time of reaction (min)
0
0.05
0.1
0.15
0.2
0.25
0.3
0.35
0.4
0.45
0.5
0
2
4
6
8
10
2 4 6 8 10 12 14 16 18
Co
nc
en
tra
tio
n (
%)
CO
, C
H4
, C
O2
Co
nc
en
tra
tio
n (
%)
O2
Time (min)
CO2
O2
CO
CH4
Combustor Gas Concentration Profile
Reducer Combustor
SOx (ppm) 190-1170 0 - 70
NOX (lb/MMBTU) 0.100 – 0.200* ~ 0
1. NETL. Cost and Performance Baseline for Fossil Energy Plants Volume 1 & 3b
*Conventional PC Boiler NOx Generation = 0.2 – 0.5 lb/MMBTU1
CDCL NOx/SOx Analysis
• Continuous steady >90% carbon conversion from reducer throughout all solid fuel loading (5- 25kWth)
• <0.25% CO and CH4 in reducer outlet = full fuel conversion to CO2/H2O
• <0.1% CO, CO2, and CH4 in combustor = negligible carbon carry over, nearly 100% carbon capture

25 kWth OSU Sub-Pilot SCL Unit for Hydrogen Generation
Reducer Gas Composition
0
20
40
60
80
100
13:33:36 14:09:36 14:45:36 15:21:36
Co
nce
ntr
atio
n (
%)
H2
CO
CO2
Oxidizer Gas Composition
0
20
40
60
80
100
8:52:48 AM 10:19:12 AM 11:45:36 AM 1:12:00 PM
Co
nce
ntr
atio
n (
%)
H2
CO
CO2
Recent Unit Demonstration
• Over 300+ hours operation• Average CO2 purity generated
throughout run > 99% • >99.99% hydrogen purity at steady
state• Steady Pressure Profile throughout
Test run
-2
0
2
4
6
8
10
12
0 2 4 6 8 10 12
Pressure("H20)
Hours
DP2
DP3
DP4
Differential Pressure Profile

Concluding Remarks
• Chemical Looping embodies all elements of particle science and technology - particle synthesis, reactivity and mechanical properties, flow stability and contact mechanics, gas-solid reaction engineering…
• OSU processes characterized by the moving bed reducer configuration are compact in design and high efficiency in operation. Success achieved in the operation of 200+ hour continuous sub-pilot CDCL run using coal and progress made in the on-going SYNGAS Chemical Looping pilot demonstration reflect the likelihood of commercialization of these technologies in the near future.

My Graduate Students and Research Associates
Zhenchao Sun
Mandar Kathe
William Wang
Songgeng Li
Andrew Tong
Nihar Phalak
Siwei Luo
Yao Wang
Niranjani Deshpande
Omar McGiveron
Ankita Majumder
Ted Thomas
Himanshu Gupta
Puneet Gupta
Alissa Park
Mahesh Iyer
Luis Velazquez-Vargas
Bartev Boghos Sakadjian
Danny Wong
Fanxing Li
Shwetha Ramkumar
FuChen Yu
Fei Wang
Liang Zeng
Deepak Sridhar
Ray Kim
Dawei Wang
Elena Chung
Samuel Bayham

Industrial Collaborators
• Clear Skies: Bob Statnick
• B&W: Tom Flynn, Luis Vargas, Doug Devault, Bartev Sakadjian, Tom Flynn and Hamid Sarv
• CONSOL Energy: Dan Connell, Richard Winschel, and Steve Winberg
• Air Products: Robert Broekhuis, Bernard Toseland
• Shell/CRI: Tom Brownscombe
• PSRI: Reddy Kerry, Ted Knowlton and Ray Cocco