
Chemical Hazards and Poisons Report No. 25
66
Chemical Hazards and Poisons Report Issue 25 September 2015
Transcript of Chemical Hazards and Poisons Report No. 25
Chemical Hazards and Poisons Report
Issue 25 September 2015
Chemical Hazard and Poisons Report – September 2015
2
About Public Health England
Public Health England exists to protect and improve the nation's health and wellbeing, and reduce health inequalities. It does this through world-class science, knowledge and intelligence, advocacy, partnerships and the delivery of specialist public health services. PHE is an operationally autonomous executive agency of the Department of Health. Public Health England Wellington House 133–155 Waterloo Road London SE1 8UG Tel: 020 7654 8000 www.gov.uk/phe Twitter: @PHE_uk Facebook: www.facebook.com/PublicHealthEngland For queries relating to this document, please contact: [email protected]. © Crown copyright 2015 You may re-use this information (excluding logos) free of charge in any format or medium, under the terms of the Open Government Licence v3.0. To view this licence, visit OGL or email [email protected]. Where we have identified any third party copyright information you will need to obtain permission from the copyright holders concerned. Published September 2015 PHE publications gateway number: 2015311

Chemical Hazard and Poisons Report – September 2015
3
Contents
About Public Health England 2
Editorial 4
Incident response, case studies and exercise reviews 6
Peanut soup – fire at a peanut factory in Northamptonshire 6
Case study of a waste site fire in Swindon 14
Emergency Preparedness and Response 20
Updates to the UK Recovery Handbook for Radiation Incidents 20
Environmental or Toxicological Research 23
Fluoridation of drinking water and the role of Public Health England 23
In vivo and in vitro tests used to assess the oral bioaccessibility and bioavailability of arsenic in soil 30
Is traffic pollution a risk to community gardening and horticulture in urban areas? 35
Greening an urban canyon to reduce levels of nitrogen dioxide and particulate matter in the West Midlands 49
Action on air pollution 55
News and Updates 61
Introducing the National Institute for Health Research Health Protection Research Units (NIHR HPRU) 61
Chemical Hazard and Poisons Report – September 2015
4
Editorial
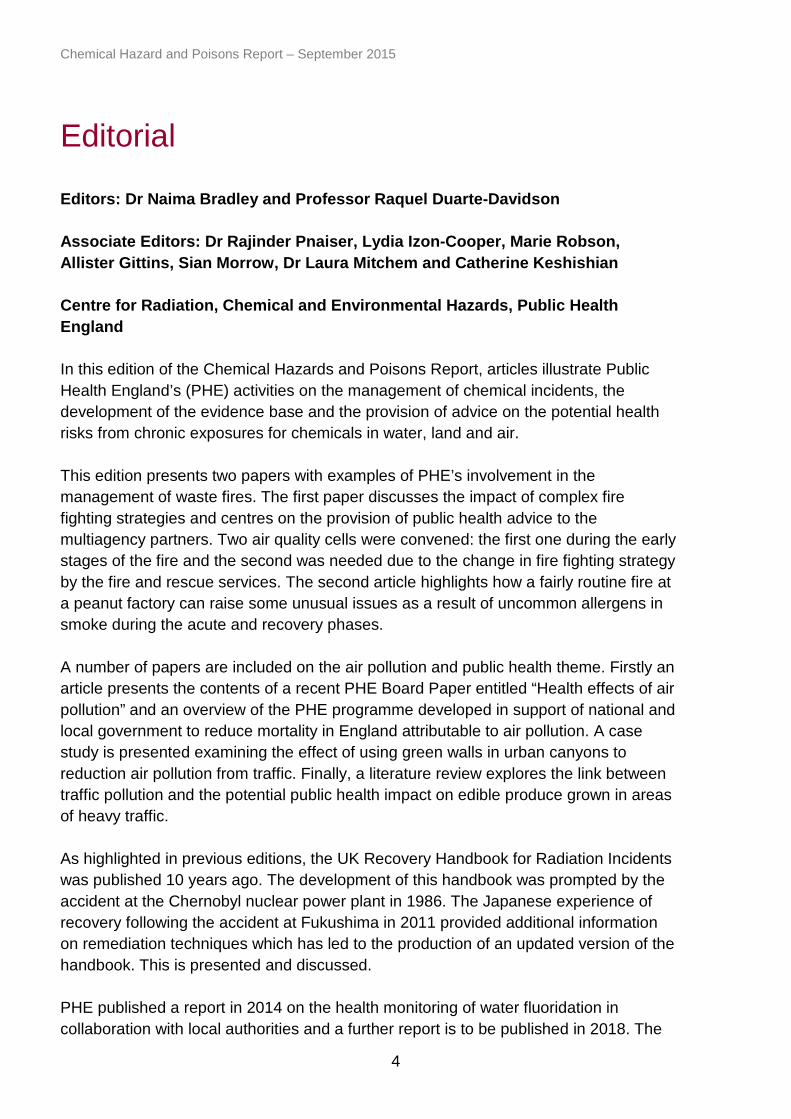
Editors: Dr Naima Bradley and Professor Raquel Duarte-Davidson Associate Editors: Dr Rajinder Pnaiser, Lydia Izon-Cooper, Marie Robson, Allister Gittins, Sian Morrow, Dr Laura Mitchem and Catherine Keshishian Centre for Radiation, Chemical and Environmental Hazards, Public Health England In this edition of the Chemical Hazards and Poisons Report, articles illustrate Public Health England’s (PHE) activities on the management of chemical incidents, the development of the evidence base and the provision of advice on the potential health risks from chronic exposures for chemicals in water, land and air. This edition presents two papers with examples of PHE’s involvement in the management of waste fires. The first paper discusses the impact of complex fire fighting strategies and centres on the provision of public health advice to the multiagency partners. Two air quality cells were convened: the first one during the early stages of the fire and the second was needed due to the change in fire fighting strategy by the fire and rescue services. The second article highlights how a fairly routine fire at a peanut factory can raise some unusual issues as a result of uncommon allergens in smoke during the acute and recovery phases. A number of papers are included on the air pollution and public health theme. Firstly an article presents the contents of a recent PHE Board Paper entitled “Health effects of air pollution” and an overview of the PHE programme developed in support of national and local government to reduce mortality in England attributable to air pollution. A case study is presented examining the effect of using green walls in urban canyons to reduction air pollution from traffic. Finally, a literature review explores the link between traffic pollution and the potential public health impact on edible produce grown in areas of heavy traffic. As highlighted in previous editions, the UK Recovery Handbook for Radiation Incidents was published 10 years ago. The development of this handbook was prompted by the accident at the Chernobyl nuclear power plant in 1986. The Japanese experience of recovery following the accident at Fukushima in 2011 provided additional information on remediation techniques which has led to the production of an updated version of the handbook. This is presented and discussed. PHE published a report in 2014 on the health monitoring of water fluoridation in collaboration with local authorities and a further report is to be published in 2018. The
Chemical Hazard and Poisons Report – September 2015
5
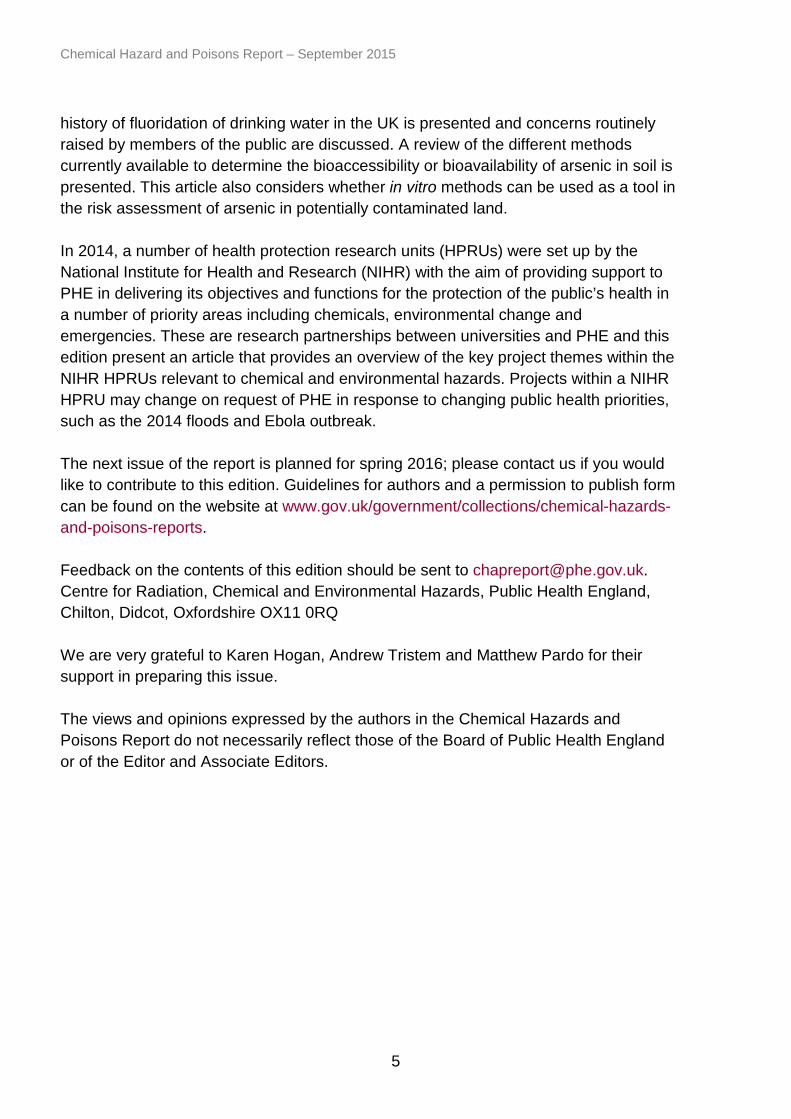
history of fluoridation of drinking water in the UK is presented and concerns routinely raised by members of the public are discussed. A review of the different methods currently available to determine the bioaccessibility or bioavailability of arsenic in soil is presented. This article also considers whether in vitro methods can be used as a tool in the risk assessment of arsenic in potentially contaminated land. In 2014, a number of health protection research units (HPRUs) were set up by the National Institute for Health and Research (NIHR) with the aim of providing support to PHE in delivering its objectives and functions for the protection of the public’s health in a number of priority areas including chemicals, environmental change and emergencies. These are research partnerships between universities and PHE and this edition present an article that provides an overview of the key project themes within the NIHR HPRUs relevant to chemical and environmental hazards. Projects within a NIHR HPRU may change on request of PHE in response to changing public health priorities, such as the 2014 floods and Ebola outbreak. The next issue of the report is planned for spring 2016; please contact us if you would like to contribute to this edition. Guidelines for authors and a permission to publish form can be found on the website at www.gov.uk/government/collections/chemical-hazards-and-poisons-reports. Feedback on the contents of this edition should be sent to [email protected]. Centre for Radiation, Chemical and Environmental Hazards, Public Health England, Chilton, Didcot, Oxfordshire OX11 0RQ We are very grateful to Karen Hogan, Andrew Tristem and Matthew Pardo for their support in preparing this issue. The views and opinions expressed by the authors in the Chemical Hazards and Poisons Report do not necessarily reflect those of the Board of Public Health England or of the Editor and Associate Editors.
Chemical Hazard and Poisons Report – September 2015
6
Incident response, case studies and exercise reviews
Peanut soup – fire at a peanut factory in Northamptonshire
Nick Brooke1, Karen Pell2, Greg Oakes3
1. Centre for Radiation, Chemical and Environmental Hazards, Environmental Hazards and Emergencies, Public Health England
2. Daventry District Council 3. Environment Agency
Email: [email protected] Introduction
Public Health England (PHE) (and the Health Protection Agency previously) is involved in responding to a large number of fires covering a wide variety of materials including wood, plastics and tyres. Although some of these fires may burn for prolonged periods impacting on local air pollution, once extinguished they tend to present less of a subsequent public health risk, although recovery issues have been noted for both plastics and tyre fires. An example of a large fire where PHE became involved took place at a peanut factory in Northamptonshire in June 2013. This incident is novel in that it involved an unusual, high energy fuel (peanuts) and also illustrated how actions taken in the acute response (emergency) phase can influence subsequent public health issues and clean-up during the recovery phase. Initial fire
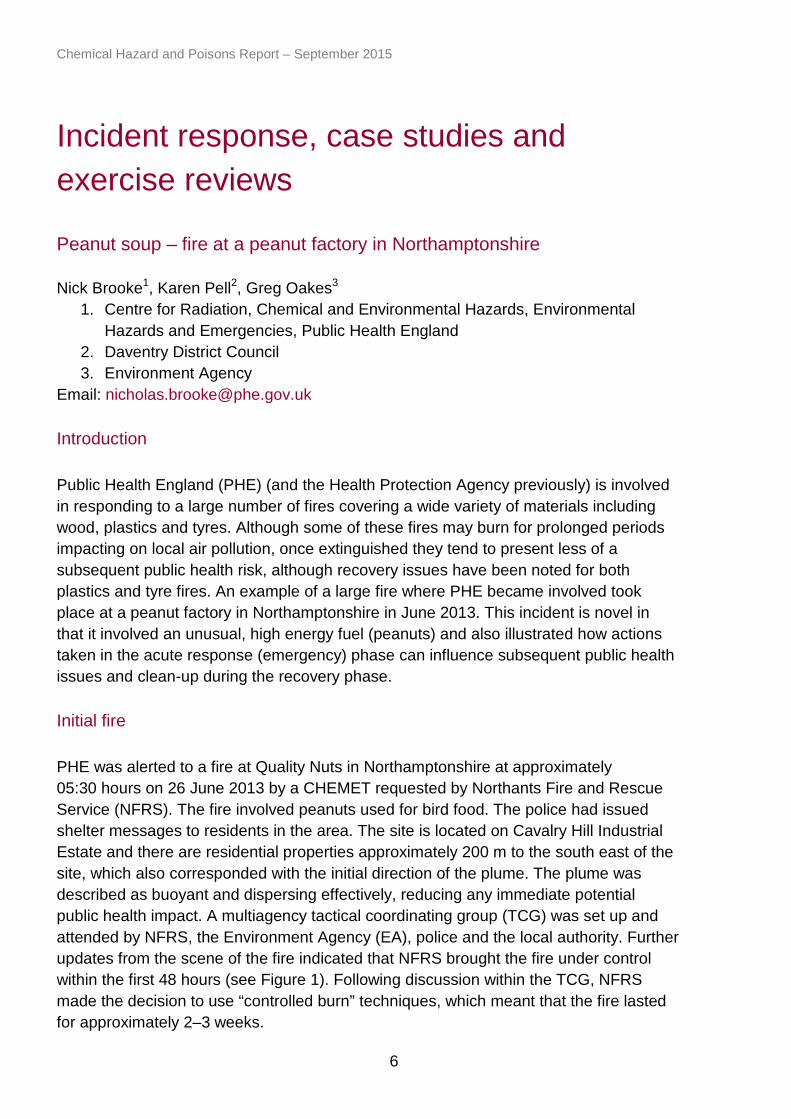
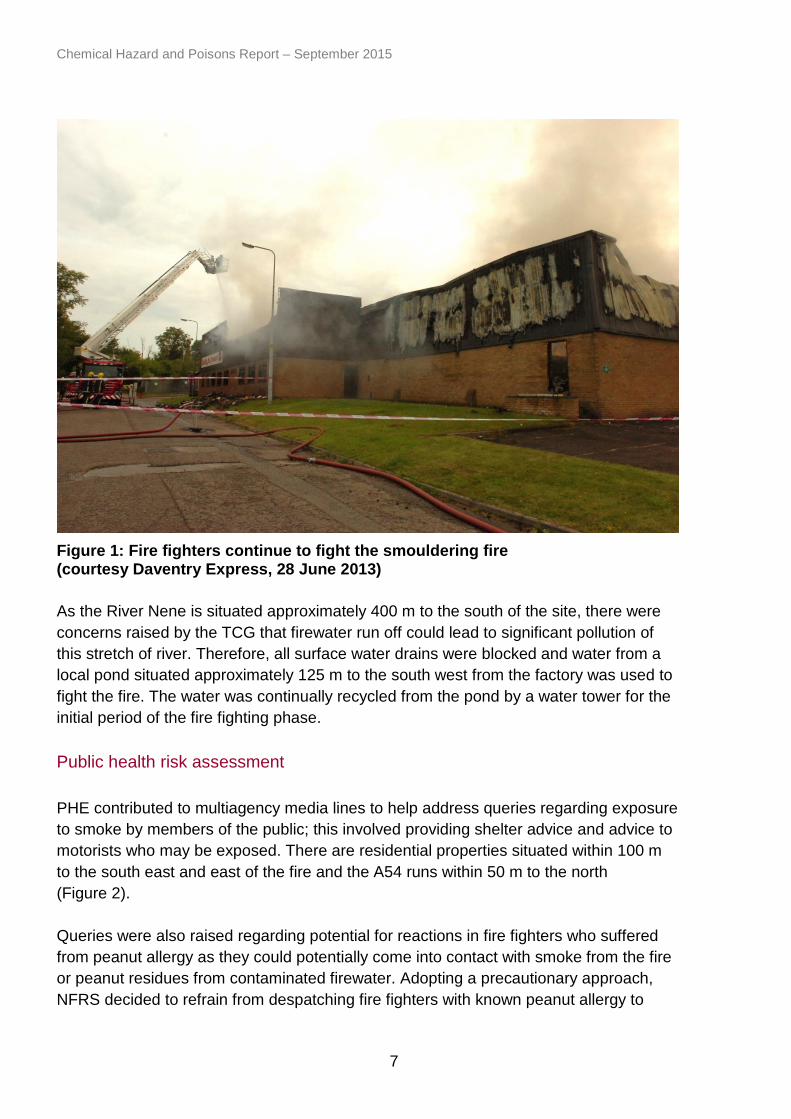
PHE was alerted to a fire at Quality Nuts in Northamptonshire at approximately 05:30 hours on 26 June 2013 by a CHEMET requested by Northants Fire and Rescue Service (NFRS). The fire involved peanuts used for bird food. The police had issued shelter messages to residents in the area. The site is located on Cavalry Hill Industrial Estate and there are residential properties approximately 200 m to the south east of the site, which also corresponded with the initial direction of the plume. The plume was described as buoyant and dispersing effectively, reducing any immediate potential public health impact. A multiagency tactical coordinating group (TCG) was set up and attended by NFRS, the Environment Agency (EA), police and the local authority. Further updates from the scene of the fire indicated that NFRS brought the fire under control within the first 48 hours (see Figure 1). Following discussion within the TCG, NFRS made the decision to use “controlled burn” techniques, which meant that the fire lasted for approximately 2–3 weeks.
Chemical Hazard and Poisons Report – September 2015
7
Figure 1: Fire fighters continue to fight the smouldering fire (courtesy Daventry Express, 28 June 2013) As the River Nene is situated approximately 400 m to the south of the site, there were concerns raised by the TCG that firewater run off could lead to significant pollution of this stretch of river. Therefore, all surface water drains were blocked and water from a local pond situated approximately 125 m to the south west from the factory was used to fight the fire. The water was continually recycled from the pond by a water tower for the initial period of the fire fighting phase. Public health risk assessment
PHE contributed to multiagency media lines to help address queries regarding exposure to smoke by members of the public; this involved providing shelter advice and advice to motorists who may be exposed. There are residential properties situated within 100 m to the south east and east of the fire and the A54 runs within 50 m to the north (Figure 2). Queries were also raised regarding potential for reactions in fire fighters who suffered from peanut allergy as they could potentially come into contact with smoke from the fire or peanut residues from contaminated firewater. Adopting a precautionary approach, NFRS decided to refrain from despatching fire fighters with known peanut allergy to

Chemical Hazard and Poisons Report – September 2015
8
Figure 2: GIS map of sensitive receptors © Crown copyright [and database rights] 2015 Ordnance Survey 100016969/100022432 tackle the fire. PHE provided initial advice that it was unlikely to cause sensitisation in those individuals that were not already allergic to peanuts. A key consideration related to whether heat would alter the allergenic effect of peanuts. Laboratory studies have indicated that peanut protein allergen is not deactivated by high temperatures1. However, it is difficult to predict whether any allergen would be present in smoke and be a potential public health threat. A rapid search of the scientific literature was undertaken and revealed that in previous large-scale fires involving peanuts, the development of allergic reactions had not been observed in individuals exposed to the subsequent smoke. No effects were observed in this incident either. Recovery phase
As the water from the pond was recycled to extinguish the fire, peanut oil, products of combustion, other wastes and chemicals present on the site were carried and deposited into the pond. A film formed on the pond surface causing oxygen depletion within the pond, a significant fish kill, bubbling on the surface and a rancid odour (Figure 3). In addition, rotting food on the factory site led to an increase in the number of flies in the area.

Chemical Hazard and Poisons Report – September 2015
9
Figure 3: Contaminated pond during the recovery phase (courtesy Environment Agency, 2013) Once the response phase had ended, the responsibility for the management of the incident was passed from the emergency services to Daventry District Council (DDC) who liased with the Environment Agency (EA) to address the subsequent clean-up issues. The EA initially treated the pond with hydrogen peroxide in an effort to raise oxygen concentrations. However, following a few days of treatment, oxygen levels had not improved, so alternative treatment methods were sought. Specialist contractors were employed to skim the peanut oil and other potential contaminants from the pond surface; dead fish were also removed. Any further remediation of the pond had to proceed carefully to avoid polluting the River Nene – for example, diluting the pond contents with excess water could have led to the spread of contamination to the river with more significant environmental consequences. Subsequent water quality monitoring of the pond for the key chemical components typically used as indicators of water quality – biological oxygen demand (BOD), chemical oxygen demand (COD), suspended solids, dissolved oxygen (DO) and ammonia – gave confidence that natural attenuation of the contamination was occurring.
Chemical Hazard and Poisons Report – September 2015
10
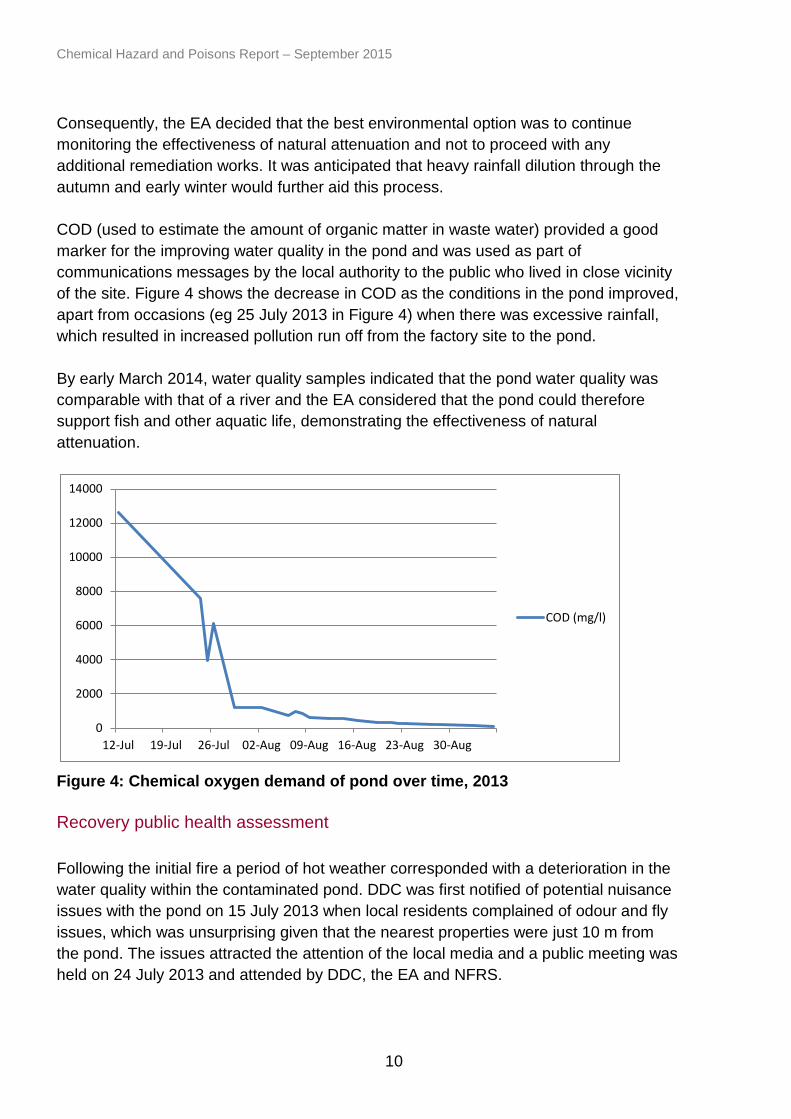
Consequently, the EA decided that the best environmental option was to continue monitoring the effectiveness of natural attenuation and not to proceed with any additional remediation works. It was anticipated that heavy rainfall dilution through the autumn and early winter would further aid this process. COD (used to estimate the amount of organic matter in waste water) provided a good marker for the improving water quality in the pond and was used as part of communications messages by the local authority to the public who lived in close vicinity of the site. Figure 4 shows the decrease in COD as the conditions in the pond improved, apart from occasions (eg 25 July 2013 in Figure 4) when there was excessive rainfall, which resulted in increased pollution run off from the factory site to the pond. By early March 2014, water quality samples indicated that the pond water quality was comparable with that of a river and the EA considered that the pond could therefore support fish and other aquatic life, demonstrating the effectiveness of natural attenuation.
Figure 4: Chemical oxygen demand of pond over time, 2013 Recovery public health assessment
Following the initial fire a period of hot weather corresponded with a deterioration in the water quality within the contaminated pond. DDC was first notified of potential nuisance issues with the pond on 15 July 2013 when local residents complained of odour and fly issues, which was unsurprising given that the nearest properties were just 10 m from the pond. The issues attracted the attention of the local media and a public meeting was held on 24 July 2013 and attended by DDC, the EA and NFRS.
0
2000
4000
6000
8000
10000
12000
14000
12-Jul 19-Jul 26-Jul 02-Aug 09-Aug 16-Aug 23-Aug 30-Aug
COD (mg/l)

Chemical Hazard and Poisons Report – September 2015
11
Subsequent to the public meeting, PHE was asked to contribute to the development of a public health message in relation to the incident. The EA had commissioned monitoring of the pond water, which had found a number of potential contaminants including pyridine, phenols, cyclohexanone and di(2-ethylhexyl)phthalate (DEHP). PHE identified a number of these contaminants as odorous and exceeding the relevant environmental quality standards for water. As there was little risk of the pondwater being ingested, the exposure pathway of concern was considered to be inhalation. However, air quality monitoring was not undertaken in the vicinity of the pond which would have aided the public health risk assessment. The personal monitors worn by EA staff which monitored for hydrogen sulphide, carbon monoxide, carbon dioxide and flammable gases had not been activated, which provided some reassurance from an occupational health perspective. Based on the limited information available, PHE drafted the following statement relating to the toxicity of peanut oil and general information on odour (see the box).
Local authority – nuisance issues
Due to the protracted time scales involved between the original fire, final demolition of the building and removal of waste products (mid-September 2013), complaints about odour from the burnt nuts on site, burnt fuel in the pond and flies from the factory site were received regularly by DDC. DCC carried out investigations into statutory nuisance, resulting in formal abatement notices being served on the property owner requiring the owner to carry out pest control treatments at the site to reduce the number of flies feeding and breeding on the waste
Box: Public health message relayed to concerned residents “Peanut oil is of low toxicity but has the potential to cause allergic reactions to those who may have an allergy to nuts. We would not consider there to be a risk to public health from the peanut oil unless individuals with such allergy came into direct contact with the oil such as swallowing it or via skin contact. From the monitoring data available, we can tell that a number of chemicals are present in the pond and some of these are odorous. The human nose is very sensitive to odours, and many substances that are perceived as odorous are usually present at levels below which there is a direct harmful effect. Some people may experience symptoms such as nausea, headaches or dizziness, as a reaction to odours even when the substances that cause those smells are themselves not harmful to health. If you experience any symptoms or have concerns about your health, please contact your GP or NHS111.”
Chemical Hazard and Poisons Report – September 2015
12
nuts inside the building. As the building was not structurally sound, access to carry out such treatments was difficult and required significant resources. A regular newsletter was sent to local residents by DDC and EA updating them on progress and of planned future actions. The incident was more protracted in length and took considerably more resource than DDC initially anticipated. Work was carried out by both DDC and the EA to establish ownership of the pond; however, full ownership was not formally established. While responsibility for the remediation ultimately lies with the owner, where no owner can be found this can result in delays to the remediation process. Discussion
This was a unique and protracted incident that required public health investigation in both the acute and recovery phase, with monitoring data provided for PHE to interpret and input into public health messages. Environmental remediation was required, which highlighted a number of legislative issues around pond ownership and responsibility for clean-up. A multiagency response was required to ensure timely and accurate communications to the local public though both acute and recovery phases. The UK Recovery Handbook for Chemical Incidents provides a decision framework for implementing environmental decontamination measures following a chemical release2. Hence, lessons identified in incidents such as these provide evidence for the use of interventions in the recovery phase. The handbook includes information on natural attenuation (with monitoring) and in situ treatment of inland waters, both of which were implemented in this incident. Learning points identified
• it is unlikely that emissions of smoke from peanut fires pose a risk of inducing a reaction in individuals who suffer from peanut allergies
• actions taken in the response phase can significantly influence the subsequent clean-up/recovery
• natural attenuation (with monitoring) can be an effective environmental recovery strategy
• odours can cause a nuisance even if they are not likely to impact directly on the public’s health
• water quality monitoring is of limited value in assessing the potential public health risk of air emissions from contaminated water bodies
• timely clean up of a site is not always possible, despite the protracted efforts of agencies, this may cause longer term issues for residents
Chemical Hazard and Poisons Report – September 2015
13
References
1. Koppelman SJ et al. Heat-induced conformational changes of Ara h 1, a major peanut allergen, do not affect its allergenic properties. Journal of Biological Chemistry 1999; 274: 4770–4777.
2. Wyke-Sanders S, Brooke N, Dobney A, Baker D, Murray V. The UK Recovery Handbook for Chemical Incidents. Available at https://www.gov.uk/government/publications/uk-recovery-handbook-for-chemical-incidents-and-associated-publications.
Chemical Hazard and Poisons Report – September 2015
14
Case study of a waste site fire in Swindon
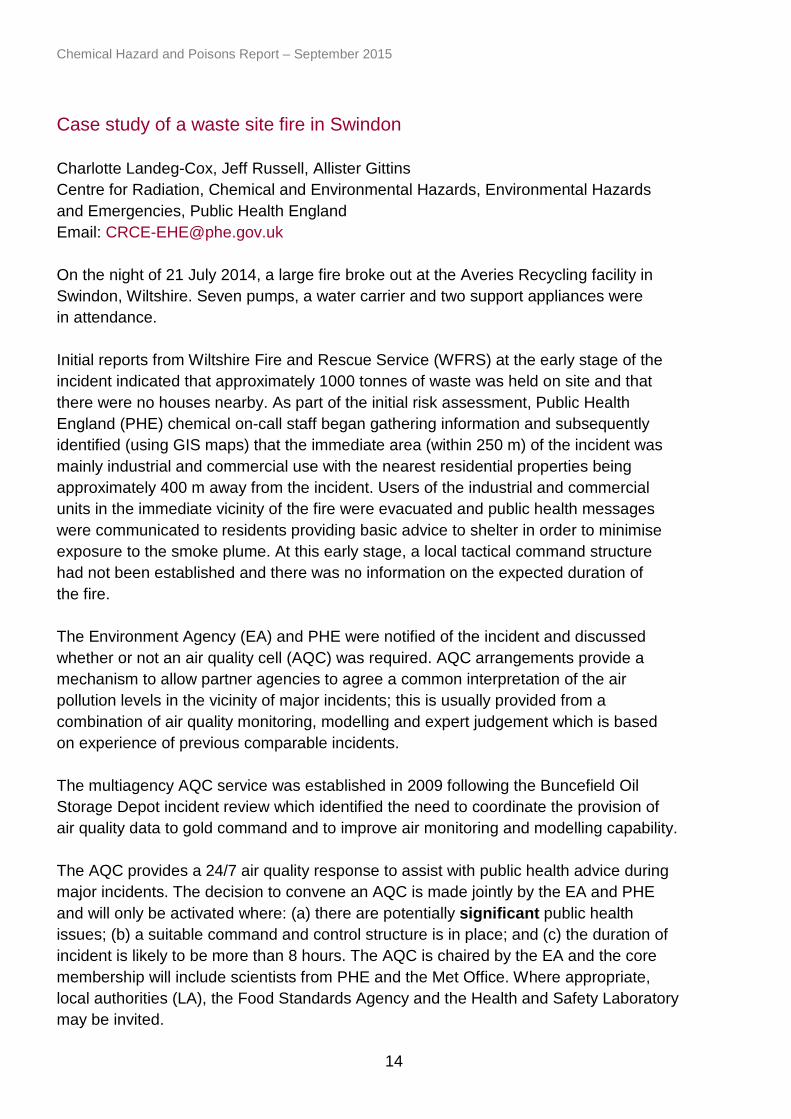
Charlotte Landeg-Cox, Jeff Russell, Allister Gittins Centre for Radiation, Chemical and Environmental Hazards, Environmental Hazards and Emergencies, Public Health England Email: [email protected] On the night of 21 July 2014, a large fire broke out at the Averies Recycling facility in Swindon, Wiltshire. Seven pumps, a water carrier and two support appliances were in attendance. Initial reports from Wiltshire Fire and Rescue Service (WFRS) at the early stage of the incident indicated that approximately 1000 tonnes of waste was held on site and that there were no houses nearby. As part of the initial risk assessment, Public Health England (PHE) chemical on-call staff began gathering information and subsequently identified (using GIS maps) that the immediate area (within 250 m) of the incident was mainly industrial and commercial use with the nearest residential properties being approximately 400 m away from the incident. Users of the industrial and commercial units in the immediate vicinity of the fire were evacuated and public health messages were communicated to residents providing basic advice to shelter in order to minimise exposure to the smoke plume. At this early stage, a local tactical command structure had not been established and there was no information on the expected duration of the fire. The Environment Agency (EA) and PHE were notified of the incident and discussed whether or not an air quality cell (AQC) was required. AQC arrangements provide a mechanism to allow partner agencies to agree a common interpretation of the air pollution levels in the vicinity of major incidents; this is usually provided from a combination of air quality monitoring, modelling and expert judgement which is based on experience of previous comparable incidents. The multiagency AQC service was established in 2009 following the Buncefield Oil Storage Depot incident review which identified the need to coordinate the provision of air quality data to gold command and to improve air monitoring and modelling capability. The AQC provides a 24/7 air quality response to assist with public health advice during major incidents. The decision to convene an AQC is made jointly by the EA and PHE and will only be activated where: (a) there are potentially significant public health issues; (b) a suitable command and control structure is in place; and (c) the duration of incident is likely to be more than 8 hours. The AQC is chaired by the EA and the core membership will include scientists from PHE and the Met Office. Where appropriate, local authorities (LA), the Food Standards Agency and the Health and Safety Laboratory may be invited.
Chemical Hazard and Poisons Report – September 2015
15
Once established, an AQC typically operates for up to 3 days or until the acute phase of the incident is over, whichever is the shorter. The AQC partners, in discussion with any multiagency partners decide when to stand down, at which point the incident is usually handed over to the multiagency recovery group led by the relevant local authority.
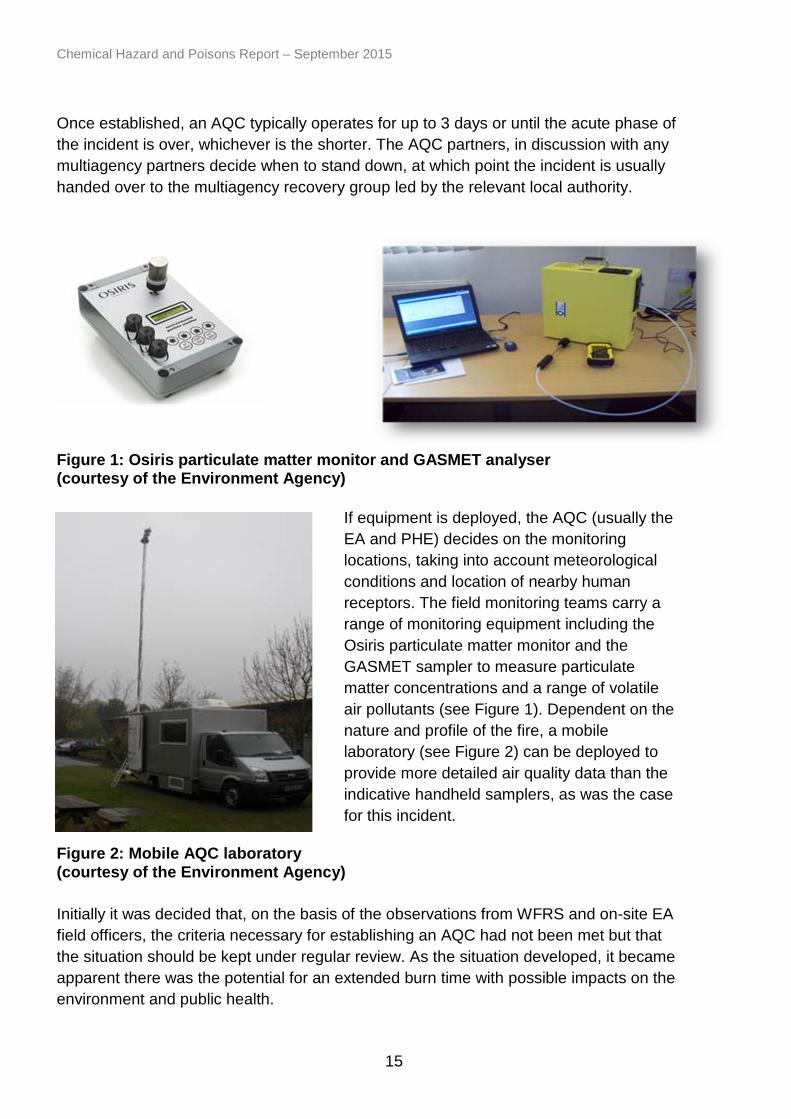
Figure 1: Osiris particulate matter monitor and GASMET analyser (courtesy of the Environment Agency)
If equipment is deployed, the AQC (usually the EA and PHE) decides on the monitoring locations, taking into account meteorological conditions and location of nearby human receptors. The field monitoring teams carry a range of monitoring equipment including the Osiris particulate matter monitor and the GASMET sampler to measure particulate matter concentrations and a range of volatile air pollutants (see Figure 1). Dependent on the nature and profile of the fire, a mobile laboratory (see Figure 2) can be deployed to provide more detailed air quality data than the indicative handheld samplers, as was the case for this incident.
Figure 2: Mobile AQC laboratory (courtesy of the Environment Agency) Initially it was decided that, on the basis of the observations from WFRS and on-site EA field officers, the criteria necessary for establishing an AQC had not been met but that the situation should be kept under regular review. As the situation developed, it became apparent there was the potential for an extended burn time with possible impacts on the environment and public health.
Chemical Hazard and Poisons Report – September 2015
16
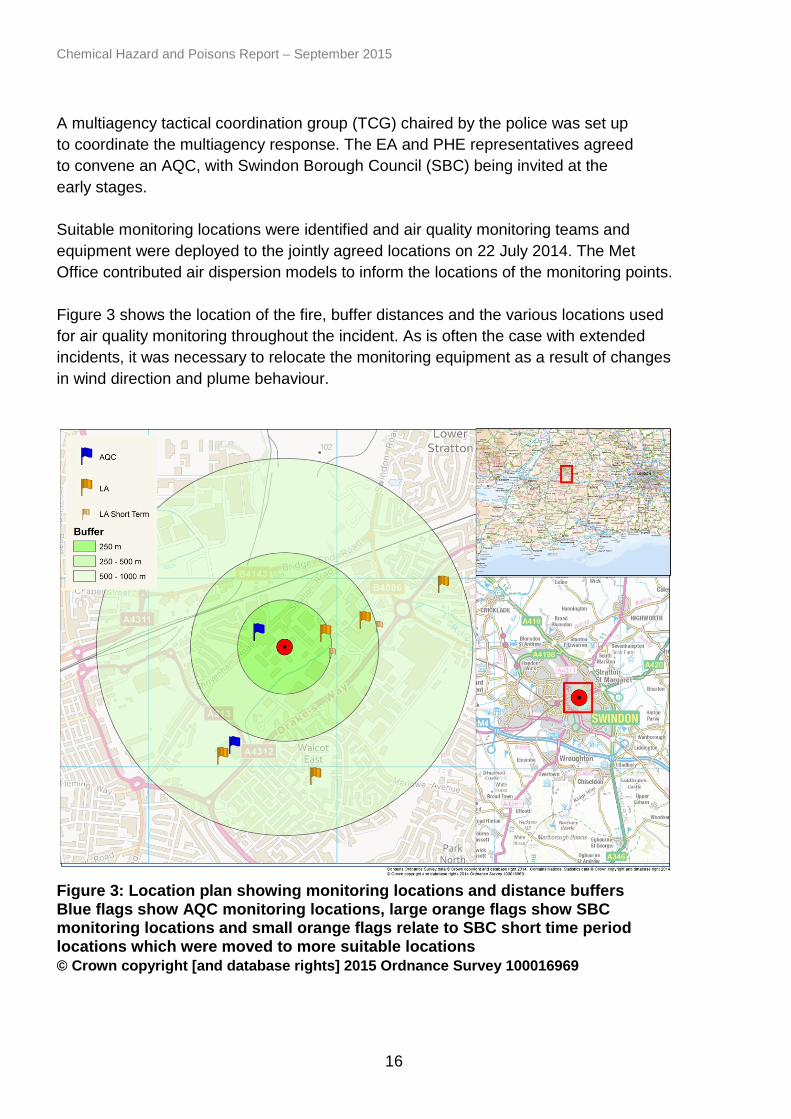
A multiagency tactical coordination group (TCG) chaired by the police was set up to coordinate the multiagency response. The EA and PHE representatives agreed to convene an AQC, with Swindon Borough Council (SBC) being invited at the early stages. Suitable monitoring locations were identified and air quality monitoring teams and equipment were deployed to the jointly agreed locations on 22 July 2014. The Met Office contributed air dispersion models to inform the locations of the monitoring points. Figure 3 shows the location of the fire, buffer distances and the various locations used for air quality monitoring throughout the incident. As is often the case with extended incidents, it was necessary to relocate the monitoring equipment as a result of changes in wind direction and plume behaviour.
Figure 3: Location plan showing monitoring locations and distance buffers Blue flags show AQC monitoring locations, large orange flags show SBC monitoring locations and small orange flags relate to SBC short time period locations which were moved to more suitable locations © Crown copyright [and database rights] 2015 Ordnance Survey 100016969
Chemical Hazard and Poisons Report – September 2015
17
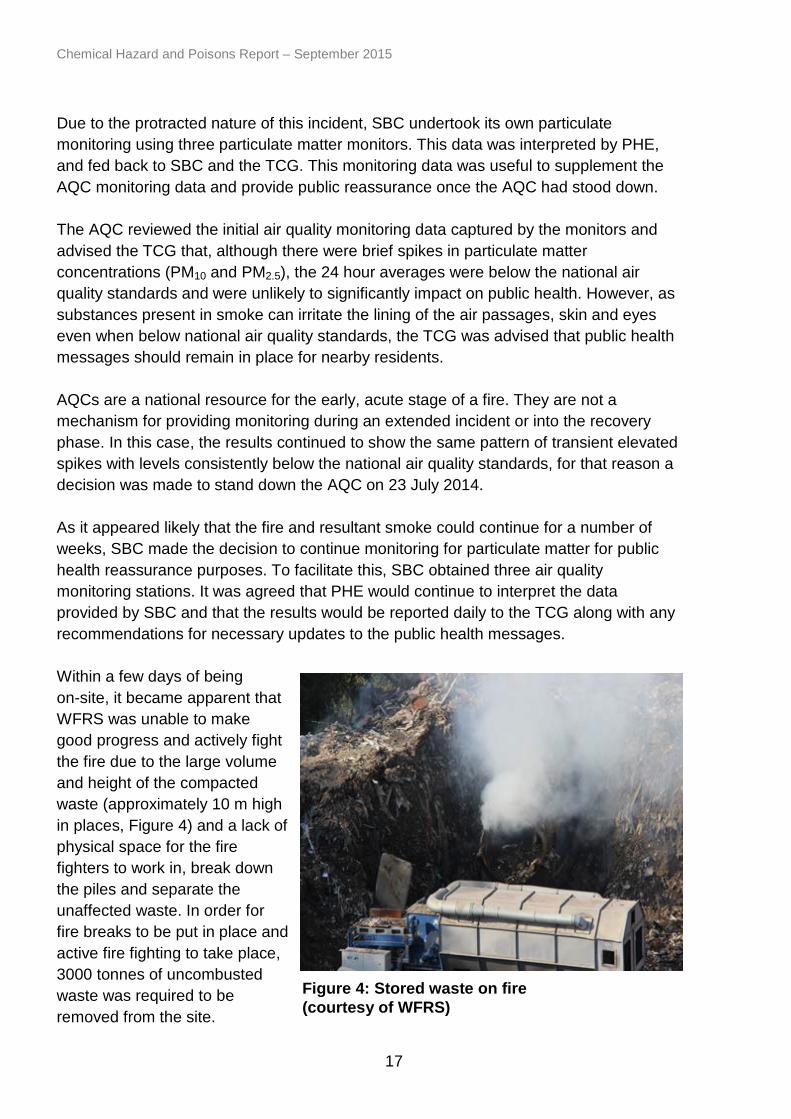
Due to the protracted nature of this incident, SBC undertook its own particulate monitoring using three particulate matter monitors. This data was interpreted by PHE, and fed back to SBC and the TCG. This monitoring data was useful to supplement the AQC monitoring data and provide public reassurance once the AQC had stood down. The AQC reviewed the initial air quality monitoring data captured by the monitors and advised the TCG that, although there were brief spikes in particulate matter concentrations (PM10 and PM2.5), the 24 hour averages were below the national air quality standards and were unlikely to significantly impact on public health. However, as substances present in smoke can irritate the lining of the air passages, skin and eyes even when below national air quality standards, the TCG was advised that public health messages should remain in place for nearby residents. AQCs are a national resource for the early, acute stage of a fire. They are not a mechanism for providing monitoring during an extended incident or into the recovery phase. In this case, the results continued to show the same pattern of transient elevated spikes with levels consistently below the national air quality standards, for that reason a decision was made to stand down the AQC on 23 July 2014. As it appeared likely that the fire and resultant smoke could continue for a number of weeks, SBC made the decision to continue monitoring for particulate matter for public health reassurance purposes. To facilitate this, SBC obtained three air quality monitoring stations. It was agreed that PHE would continue to interpret the data provided by SBC and that the results would be reported daily to the TCG along with any recommendations for necessary updates to the public health messages. Within a few days of being on-site, it became apparent that WFRS was unable to make good progress and actively fight the fire due to the large volume and height of the compacted waste (approximately 10 m high in places, Figure 4) and a lack of physical space for the fire fighters to work in, break down the piles and separate the unaffected waste. In order for fire breaks to be put in place and active fire fighting to take place, 3000 tonnes of uncombusted waste was required to be removed from the site.
Figure 4: Stored waste on fire (courtesy of WFRS)

Chemical Hazard and Poisons Report – September 2015
18
A strategic coordination group (SCG) was activated to assist in finding alternative locations for the waste and plan how the waste would be removed if the site operator did not comply within a given deadline. Options considered included the removal of a quantity of waste to appropriate waste sites nearby, and placing some of the waste on a disused park and ride site. PHE was represented in the scientific technical advice cell (STAC) which was established to support the SCG.
In this incident the site operator did not remove the waste from the site by the specified deadline, therefore the EA used its regulatory powers to implement the clean-up operation nearly a month after the fire started. The waste was to be checked and dampened down as a precaution prior to leaving the site and being transported to the agreed landfill site for disposal (see Figure 5).
Figure 5: Breaking down piles and cooling waste (courtesy of WFRS) Under normal circumstances an AQC would not be redeployed to the same site during a single incident. However, following discussions between PHE and the EA, it was agreed that due to the changes in the fire fighting regime proposed, a second AQC would be needed to assess the impacts of active fire fighting on the plume and subsequent impact on public health. The monitoring results indicated that, even when active fire fighting commenced the plume showed similar characteristics to that recorded during the first AQC period. Occasional peaks in particulate matter concentrations were noted, correlating with active fire fighting at the site (Figure 6). The public health advice remained that people impacted by the plume should shelter in place and minimise their time outdoors. This incident generated national media and public concern. Therefore public engagement was a critical element of the incident management process at the acute and recovery phases. Multiagency communication of public health messages were coordinated by the SCG and delivered by SBC to nearby businesses, residents and schools. As there was already a high degree of anxiety and concern from members of the local community, before the start of the active fire fighting phase, local residents and businesses were informed to expect an increase in the amount of smoke from the fire and active fire fighting was to be undertaken during hours when meteorological conditions would allow dispersal to minimise the impact on the community.

Chemical Hazard and Poisons Report – September 2015
19
Figure 6: Particulate monitoring data at Colebrook Road monitoring station, showing spikes correlating to active fire fighting on site The active fire fighting commenced on 27 August 2014 and the community was informed that this tactic was expected to continue for several weeks and during that time period reassuringly from a public health point of view, the number of complaints received was relatively small. There were no associated notifications to the NHS or PHE of any increase in the numbers of calls to NHS 111, visits to GPs or hospitals. The fire was finally extinguished on 15 September 2014. In conclusion, this was the first occasion where an AQC was activated and monitoring equipment deployed twice during the same incident location. Although there was some political will for a second stage of monitoring, it should be stressed that the decision to re-establish an AQC was based solely on the need to assess the impact on public health of the changes in the fire fighting regime. The monitoring data and risk assessments highlighted that the Averies fire was unlikely to have had an impact on the long-term health of the local community.
Chemical Hazard and Poisons Report – September 2015
20
Emergency Preparedness and Response
Updates to the UK Recovery Handbook for Radiation Incidents
Anne Nisbet, Samantha Watson, Antonio Peña-Fernández, Stacey Wyke Centre for Radiation, Chemical and Environmental Hazards, Public Health England Email: [email protected] Introduction
Ten years ago the first version of the UK Recovery Handbook for Radiation Incidents was published, prompted by an accident at the Chernobyl nuclear power plant, Ukraine, in 1986. The handbook was the first of its kind to provide a framework for decision makers to evaluate options for managing recovery across a range of environments, including contaminated food production systems, inhabited areas and drinking water supplies. The handbook was produced in close collaboration with a wide range of government and non-government organisations to ensure that it met the needs of end users. Since 2005, the handbook has been customised by various European countries and is currently being adopted in the US. Two further versions of the UK Recovery Handbook for Radiation Incidents were published in 2008 and 20091 to incorporate new information and to introduce a stepwise approach to selecting and combining recovery options. The 2009 version was subsequently used as a basis for developing the UK Recovery Handbook for Chemical Incidents2 and the UK Recovery Handbook for Biological Incidents, which is due for publication later this year. Public Health England’s Centre for Chemical, Radiation and Environmental Hazards (CRCE) is committed to providing authoritative guidance and advice for the protection of human health and assisting with the recovery and restoration of the environment in the aftermath of a chemical or radiation incident. CRCE is working in close collaboration with the Department for Environment, Food and Rural Affairs (including the Government Decontamination Service), the Food Standards Agency and the Department for Transport to develop a chemical and radiation recovery decision support tool3. One aspect of this project is to produce a further update to the UK Recovery Handbook for Radiation Incidents to maintain it as a state-of-the-art product.
Chemical Hazard and Poisons Report – September 2015
21
Updates
The Japanese experience of recovery following the accident at the Fukushima nuclear power plant in 2011 provided much useful information on remediation techniques, including data on effectiveness, constraints and waste generation. As part of the update process, a comprehensive literature review was carried out to capture relevant information from this event for inclusion in Version 4 of the UK Recovery Handbook for Radiation Incidents. As a consequence of the literature review, all management option datasheets were updated. Additional datasheets were created for new management options, such as natural attenuation with monitoring, product recall, soil washing and treatment of waste water. To avoid unnecessary repetition, some options have been combined into a single datasheet and a few options, no longer considered applicable in the UK, have been removed completely from the handbook. Overall these changes have led to an increase in the number of recovery options for food production systems from 40 to 42, while the number of options for inhabited areas has decreased from 51 to 29. The number of options for drinking water supplies has increased from 6 to 7. Additional updates to reflect changes in legislation and changes in radiological protection guidance for recovery have also been incorporated. A comparison with the UK Recovery Handbook for Chemical Incidents was made to ensure consistency where appropriate. This resulted in the inclusion of semi-enclosed areas and vehicles as surface types within inhabited areas for the first time. Furthermore, new flow charts have been added to aid the classification of recovery options according to the type of production system or inhabited area surface under consideration. Additional information on constraints, both major and moderate, according to technical, social, economic, temporal and waste generation is also presented for the first time in the update. The updated handbook has undergone a rigorous peer-review process, involving a wide range of internal and external stakeholders. Furthermore, a workshop to discuss recovery options for inhabited areas was organised by the Government Decontamination Service in October 2014 with participants from CRCE, Cavendish Nuclear, Nuvia and Studsvik. Expert opinion, comments and feedback have been incorporated into the updated handbook.
Chemical Hazard and Poisons Report – September 2015
22
What’s next?
A radiation recovery navigation tool (RNT), based on the updated handbook, is being developed to complement the recently published chemical RNT. The tool includes an interactive component that provides a stepwise process to facilitate and guide decision makers in the selection and combining of recovery options. It also includes a downloadable recovery record form, as a means of capturing the underlying rationale for decisions on the selection of options, thereby serving as an audit trail. Stakeholder workshops will assist in the fine-tuning of the tool for radiation incidents. Version 4 of the UK Recovery Handbook for Radiation Incidents4 was published in June 2015; the associated RNT will be published in web format in autumn 2015. For more information, please contact the project team at [email protected]. References
1. Nisbet A, Brown J, Jones A, Rochford H, Hammond D, Cabianca T. The UK Recovery Handbook for Radiation Incidents, Version 3, 2009. Health Protection Agency, HPA-RPD-064.
2. Wyke-Sanders S, Brooke N, Dobney A, Baker D, Murray V. The UK Recovery Handbook for Chemical Incidents. Version 1, 2012. https://www.gov.uk/government/publications/uk-recovery-handbook-for-chemical-incidents-and-associated-publications.
3. Wyke-Sanders S, Peña-Fernández A, Nisbet A, Silvey V, Watson S, Duart-Davidson R. Developing tools to assist with evaluating a recovery strategy. CHaP Report 2014; 24: 52. https://www.gov.uk/government/publications/chemical-hazards-and-poisons-report-issue-24.
4. Nisbet A, Watson S, Brown J. The UK Recovery Handbook for Radiation Incidents, Version 4, 2015. https://www.gov.uk/government/publications/uk-recovery-handbooks-for-radiation-incidents-2015.
Chemical Hazard and Poisons Report – September 2015
23
Environmental or Toxicological Research
Fluoridation of drinking water and the role of Public Health England
Stephen Robjohns1, John Morris2, Julia Verne3 1. Centre for Radiation, Chemical and Environmental Hazards, Health Protection,
Public Health England 2. Health and Wellbeing, Public Health England 3. Knowledge and Intelligence, Public Health England
Email: [email protected] Introduction
Public Health England (PHE) has an important role in relation to the fluoridation of drinking water. Due to changes introduced by the Health and Social Care Act 2012, responsibility passed from the NHS to the Secretary of State for Health and upper tier and unitary local authorities. The Secretary of State holds the legal agreements with the five water companies who operate fluoridation schemes and local authorities have the powers to propose, vary or terminate schemes affecting their residents. PHE acts on behalf of the Secretary of State and manages the relationship with water companies, liaising with the Drinking Water Inspectorate. PHE also leads on providing advice to partner organisations regarding the underlying science and evidence in relation to water fluoridation and assists in the drafting of responses to parliamentary questions, freedom of information requests and enquiries from the public. Within PHE, the responsibility is with the Health and Wellbeing Directorate, specifically the Dental Public Health Team. In the early part of the 20th century, lower levels of tooth decay were observed in areas where drinking water naturally contained relatively high fluoride levels. This led to the introduction of fluoridation schemes with the aim to reduce the level of tooth decay. The first water fluoridation scheme was introduced in 1945, in the city of Grand Rapids, Michigan, in the US. The first substantive fluoridation scheme introduced in the UK was in Birmingham in 19641. PHE considers there is strong evidence for the effectiveness of water fluoridation in preventing or reducing the occurrence of dental decay and recommends fluoridation where appropriate alongside a number of other measures, such as regular brushing of teeth with fluoride toothpaste and healthier eating.
Chemical Hazard and Poisons Report – September 2015
24
This article will not focus on the dental benefits or efficacy, but presents an overview of the potential health concerns that are sometimes raised regarding the addition of fluoride to drinking water. PHE’s Centre for Radiation, Chemical and Environmental Hazards (CRCE) provides authoritative advice on the toxicology and potential health risks of fluoride when requested by colleagues within PHE and particularly the Dental Public Health Team. What is fluoridation?
Fluoride is a naturally occurring substance that is present in all drinking water sources in varying amounts. It is also present in some foods2. Two chemicals are permitted to be used in fluoridation schemes in England and Wales by the Water Industry Act 1991. Their quality and purity have to comply with the relevant British (EN) standards. These are: • disodium hexafluorosilicate BS EN 12174: 2013 • hexafluorosilicic acid BS EN 12175: 2013 Once dissolved in water, hexafluorosilicic acid (or the sodium salt of hexafluorosilicate) produces fluoride and silicate ions3 . The EU and UK regulatory limit for fluoride in drinking water is 1.5 milligrams per litre (mg/L). This is the same as the World Health Organization health based guideline value, which is applicable to both fluoridated water and naturally occurring levels of fluoride. However, the target and optimal dosing concentration in water fluoridation areas in England is lower, at a concentration of 1.0 mg/L. Adverse health effects of fluoride
PHE answers enquiries from members of the public and members of parliament over claims of various health effects relating to fluoride exposure. Such concerns have included effects on the thyroid, kidney, pineal gland, reproduction and birth defects. However, PHE considers that there is no convincing evidence that exposure to fluoridated water in the UK (ie at a concentration of 1.0 mg/L) causes any of these adverse effects. Dental fluorosis in children under 8 years
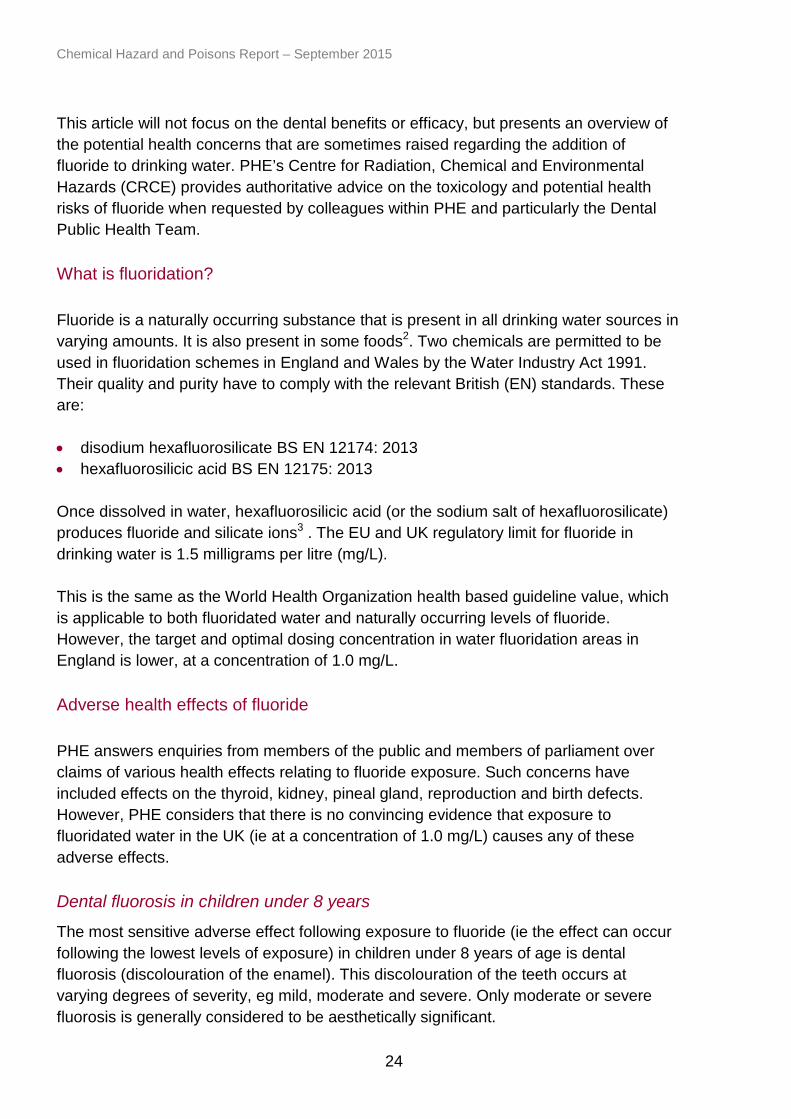
The most sensitive adverse effect following exposure to fluoride (ie the effect can occur following the lowest levels of exposure) in children under 8 years of age is dental fluorosis (discolouration of the enamel). This discolouration of the teeth occurs at varying degrees of severity, eg mild, moderate and severe. Only moderate or severe fluorosis is generally considered to be aesthetically significant.

Chemical Hazard and Poisons Report – September 2015
25
Dentists mainly consider the less severe forms of dental fluorosis to be a cosmetic effect, because it affects appearance to a degree that can only be detected by dental professionals and does not damage or harm the teeth. Dental fluorosis occurs as a consequence of systemic exposure to fluoride (following ingestion) during tooth development and the period of risk only occurs up to the age of about 8 years old. The critical time for dental fluorosis is during the formation of the front permanent teeth at between 3 and 4 years old. Dental fluorosis does not develop in older children or adults. The UK Committee on the Toxicity of Chemicals in Food, Consumer Products and the Environment (COT) noted that in early US epidemiological studies, no cases of moderate or severe dental fluorosis were seen in populations receiving water containing approximately 1.0 mg/L of fluoride. This equates to an estimated average fluoride intake of 0.05 mg per kilogram of body weight per day. The COT considered this to be a no observed adverse effect level (NOAEL)4. More recent dose-response modelling of dental fluorosis by the US EPA revealed similar findings5. Surveys in England have found very low levels of moderate dental fluorosis in both fluoridated and non-fluoridated areas and no cases of severe fluorosis6. Skeletal fluorosis in individuals over 8 years
For individuals over the age of 8 years, the most sensitive toxicological endpoint of exposure to excess fluoride on a long-term basis is adverse skeletal effects. Symptomatic or clinical skeletal fluorosis is a condition that is characterised by abnormalities of the bone structure and joint pain. In severe cases, it can cause curvature of the spine, loss of the use of limbs and chronic disablement. Secondary neurological complications can occur resulting from damage to the spine (eg myelopathy). Skeletal fluorosis and an increased risk of bone fracture have been associated with long-term exposure to naturally elevated levels of fluoride in drinking water. Such effects may be seen in areas of the world, such as parts of Africa, China and India, where there may be high levels of fluoride in groundwater and where there may also be additional exposure to fluoride from other sources (eg naturally high levels in food and inhalation exposure from burning coal with high fluoride content)4,7,8. Although the dose-response data is generally difficult to interpret (eg due to potential confounding factors), the WHO has stated that skeletal fluorosis has been reported
Figure: Child drinking water

Chemical Hazard and Poisons Report – September 2015
26
after chronic exposure to relatively high concentrations of fluoride in drinking water (3–6 mg/L, equating to an approximate intake of 0.1 to 0.2 mg/kg bw/day for a 60 kg adult)7. Such levels in water are well above the regulatory limit in the UK and it is important to emphasise that there is no evidence of clinical skeletal fluorosis arising from the fluoride concentrations that occur in the UK4. Neurotoxicity
Recent concern in members of the public has been generated by reported findings of developmental fluoride neurotoxicity in a meta-analysis by Choi et al in 20128. Attention was drawn to this study when it was cited in a general review of neurotoxicants published in the journal Lancet Neurology (Grandjean and Landrigan, 2014)9. The meta-analysis by Choi et al has important limitations that prevent an assessment of the validity of its findings. For example, no information was provided on whether IQ assessment was adequately conducted, or whether there was adequate adjustment for confounding factors (eg socioeconomic status, education or dietary deficiency), or whether there was exposure to fluoride from other sources; further, there was no assessment of co-exposure to other neurotoxicants (eg lead or arsenic). Furthermore, the concentrations of fluoride in water in the Choi et al study were generally much higher than those occurring in the UK and are not directly comparable. Therefore, this study provides insufficient evidence to suggest that the levels of fluoride in the public drinking water supply in the UK would present a risk for developmental neurotoxicity. Evaluations by various authoritative expert groups also do not consider that developmental neurotoxicity is likely to occur following exposure to fluoridated drinking water7,10,11. Cancer
Fluoride accumulates in the bone, which has raised the suggestion of a plausible risk of bone cancer. However, the available evidence does not suggest that fluoride in drinking water causes any form of cancer10 –13. Recently, the EC Scientific Committee on Health and Environmental Risks (SCHER, 2011)3 concluded that epidemiological studies do not indicate a clear link between fluoride in drinking water and cancer in general or more specifically bone cancer. Animal studies do not demonstrate that fluoride is carcinogenic. Private water supplies
Local authorities are responsible for regulating private water supplies. The regulatory limit for fluoride in private water supplies is the same as for the public water supply, ie 1.5 mg/L. Some private water supplies in the UK can have naturally elevated fluoride concentrations that exceed the regulatory limit. In such instances the local authority is

Chemical Hazard and Poisons Report – September 2015
27
likely to require changes to those water supplies to ensure compliance with drinking water standards. For private water supplies with concentrations of approximately 3–4 mg/L fluoride or above, PHE would advise that individuals should not drink the water on a regular basis to prevent an increased risk of dental fluorosis and potentially adverse skeletal effects. PHE has provided this advice in a few cases where such levels have been detected. PHE monitoring of the health effects of fluoridated water
The Water Industry Act 1991 requires the monitoring of health effects in fluoridated areas at no greater than 4-yearly intervals by the “relevant authority”, which is PHE acting for the Secretary of State. Previously, this responsibility within PHE fell within the Chief Knowledge Officer’s Directorate; however, the responsibility for monitoring has now transferred to CRCE. In 2014 PHE published its health monitoring report for England1, which compared indicators of health in people in fluoridated and non-fluoridated areas. This included both dental health and potential adverse health outcomes. Indicators of various adverse health conditions potentially associated with fluoridated water were selected based on a number of factors including the evidence base, theoretical plausibility, the availability of data and validity of the indicator. The selected indicators were dental fluorosis, bone health (hip fracture), kidney effects (incidence of kidney stones), mortality (all causes), birth defects (incidence of Down’s syndrome) and cancer (bladder cancer, osteosarcoma – a form of bone cancer – and overall cancer incidence rate). CRCE gave advice on the proposed health indicators and biological plausibility to the Chief Knowledge Officer’s Directorate. For example, water fluoridation can increase dietary intake of fluoride by about 50% and about half of the ingested fluoride is taken up by bone. A large proportion of ingested fluoride is excreted by the kidney in urine, which means that both the kidney and bladder could be exposed to relatively high fluoride concentrations. Furthermore, there is a theoretical plausibility for bone cancer due to the deposition in bone and the mitogenic effect of fluoride on osteoblasts. Key findings of the 2014 report included: • on average there were 15% fewer 5 year olds with tooth decay in fluoridated areas
than in non-fluoridated areas. When deprivation and ethnicity were taken into account (important factors for dental health), 28% fewer 5 year olds had tooth decay in fluoridated areas than in non-fluoridated areas

Chemical Hazard and Poisons Report – September 2015
28
• on average, there were 11% fewer 12 year olds with tooth decay in fluoridated areas than in non-fluoridated areas. When deprivation and ethnicity were taken into account, 21% fewer 12 year olds had tooth decay in fluoridated areas than in non-fluoridated areas
• the reduction in tooth decay in children appeared greatest in deprived areas • there was no evidence of higher rates of non-dental health indicators studied in
fluoridated areas compared to non-fluoridated areas1 Further details can be obtained from the health monitoring report1. Another report will be required within 4 years of the report’s publication. It is anticipated that CRCE will be consulted for advice during the planning process for the next PHE monitoring study. Conclusion
PHE considers there is strong evidence for the effectiveness of water fluoridation in preventing or reducing the occurrence of dental decay and recommends fluoridation where appropriate alongside a number of other measures, such as regular brushing of teeth with fluoride toothpaste and healthier eating. PHE also considers there is no convincing evidence that exposure to fluoridated water in the UK (ie at a concentration of 1.0 mg/L) causes adverse effects. References
1. Public Health England. Water fluoridation health monitoring report for England 2014. Available at https://www.gov.uk/government/uploads/system/uploads/attachment_data/file/300202/Water_fluoridation_health_monitoring_for_england__full_report_1Apr2014.pdf.
2. World Health Organization (WHO) (2006). Fluoride in drinking Water. Fawell J, Bailey K, Chilton J, Dahi E, Fewtrell L, Magara Y. Available at http://www.who.int/water_sanitation_health/publications/fluoride_drinking_water_full.pdf.
3. Scientific Committee on Health and Environmental Risks (SCHER) (2011). Critical review of any new evidence on the hazard profile, health effects, and human exposure to fluoride and the fluoridating agents of drinking water. Available at http://ec.europa.eu/health/scientific_committees/environmental_risks/docs/scher_o_139.pdf.
4. Committee on Toxicity of Chemicals in Food, Consumer Products and the Environment (2003). COT Statement on Fluorine in the 1997 Total Diet Study. Available at http://www.food.gov.uk/multimedia/pdfs/fluoride.pdf.
Chemical Hazard and Poisons Report – September 2015
29
5. US Environmental Protection Agency (EPA) (2010). Fluoride: Dose-Response Analysis for non-cancer effects. Available at http://water.epa.gov/action/advisories/drinking/upload/Fluoride_dose_response.pdf.
6. McGrady M, Ellwood R, Maquire A, Goodwin M, Boothman N, Pretty I. The association between social deprivation and the prevalence and severity of dental caries and fluorosis in populations with and without water fluoridation. BMC Public Health 2012; 12: 1122 [cited in PHE report 2014].
7. World Health Organization (WHO) (2004). Fluoride in Drinking-water. Background document for development of WHO Guidelines for Drinking-water Quality. Available at http://www.who.int/water_sanitation_health/dwq/chemicals/fluoride.pdf.
8. Choi A, Sun G, Zhang Y, Grandjean P. Developmental fluoride neurotoxicity: a systematic review and meta-analysis. Environmental Health Perspectives 2012; 120(10): 1362–1368.
9. Grandjean P, Landrigan P. Neurobehavioural effects of developmental toxicity. Lancet Neurology 2014; 13(3): 330–338.
10. European Food Safety Authority (EFSA) (2005). Opinion of the Scientific Panel on Dietetic Products Nutrition and Allergies (NDA) on a request from the Commission related to the Tolerable Upper Intake Level of Fluoride. Available at http://www.efsa.europa.eu/EFSA/efsa_locale-1178620753812_1178620766918.htm.
11. International Programme on Chemical Safety (IPCS) (2002). Fluorides. Environmental Health Criteria 227. WHO. Geneva. Available at http://www.inchem.org/documents/ehc/ehc/ehc227.htm.
12. Committee on Carcinogenicity of Chemicals in Food, Consumer Products and the Environment (COC) (1990). Statement on Fluoride. Cited in COT 2003 Statement on Fluorine in the 1997 Diet Study. Available at http://cot.food.gov.uk/sites/default/files/cot/fluoride.pdf.
13. International Agency for Research on Cancer (IARC) (1987). Summaries and Evaluations. Fluorides (Inorganic, used in drinking water). Available at http://www.inchem.org/documents/iarc/suppl7/fluorides.html.

Chemical Hazard and Poisons Report – September 2015
30
In vivo and in vitro tests used to assess the oral bioaccessibility and bioavailability of arsenic in soil
Mohamed Al-Shehri1, Kerry Foxall2, Antonio Peña-Fernández2 1. School of Biosciences, University of Birmingham 2. Centre for Radiation, Chemical and Environmental Hazards, Public Health
England Email: [email protected]; [email protected] Introduction
This article provides a summary of a Public Health England (PHE) supervised Birmingham University MSc in toxicology project report. This article does not necessarily reflect the opinions of PHE. Human oral bioavailability can be predicted by several in vivo and in vitro methods; the aim of the project was to: • review the different methods available for determining the bioaccessibility or
bioavailability of arsenic (As) in soil • consider whether in vitro methods can be used as a tool in the risk assessment of As
in potentially contaminated land Oral bioaccessibility can be defined as the fraction of a chemical that is soluble in the gastrointestinal tract and is available for absorption1. Oral bioavailability is the fraction of the ingested chemical that reaches systemic circulation unchanged (ie without the first pass effect of metabolism) after absorption from the gastrointestinal tract. Where there is concern regarding potentially unacceptable risks from land contamination to public health it is important to carefully investigate and assess the risks further and if necessary take measures to remediate the land to reduce contamination to acceptable levels. The potential health risks from exposure to contaminants in soil are related to the bioavailable fraction, rather than the total level of contaminants in soil. The assumption that a contaminant in soil is 100% bioavailable can result in an overestimation of the actual risk. Bioavailability testing could be used to refine site-specific risk assessments of potentially contaminated sites and give a more accurate estimation of the risk. Project methodology
A comprehensive literature review was conducted using a number of databases, including Find@bham, ScienceDirect, Pubmed, Elsevier, and the PHE website. These

Chemical Hazard and Poisons Report – September 2015
31
databases were searched using several key words including arsenic, soil, bioavailability, bioaccessibility, in vitro digestion, in vivo validation and risk assessment. Factors influencing the bioaccessibility and bioavailability of As in soils
There is a wide variation in the bioaccessibility and bioavailability of As in soils. This can be attributed to a number of factors that may increase or decrease the bioaccessibility and bioavailability1–7. These factors include: • soil type and characteristics such as organic matter content, percentage of clay (soil
matrix), particle size and pH • chemical weathering and ageing • total content of As in soil and its natural geochemical form(s) (speciation or chemical
composition), such as association of As with phosphates, sulphides, carbonates and oxides
• whether the source of As is anthropogenic or natural In vivo and in vitro approaches for the measurement of bioaccessibility and bioavailability of As in soil
In vivo models
In vivo models can be used to measure the oral bioavailability of soil contaminants. These studies involve dosing various animal species with contaminated soil and measuring the level of the contaminant in the blood and organs of the animal. These studies are both laborious and expensive and there are also ethical considerations. These constraints make in vivo models impractical to use in a contaminated land risk assessment; as a result, they are replaced by in vitro methods1. In vitro test methods
In vitro tests can be used to assess the oral bioaccessibility of a contaminant by the measurement of the potential pollutant fraction that is dissolved in gastrointestinal tract medium, before absorption into systemic circulation; it is designed to mimic the absorption of a chemical in the human gut. In vitro bioaccessibility data can be used as a surrogate measure of bioavailability for use in refining site‐specific land contamination risk assessment. It is important that validated methodologies are used; therefore, an in vitro method should correlate well with a suitable in vivo model used as a surrogate for humans and this correlation needs to be consistent across a range of soil types and forms of the contaminant3,8. There are two classes of in vitro tests: chemical extraction and gastrointestinal analogues.
Chemical Hazard and Poisons Report – September 2015
32
Chemical extraction tests
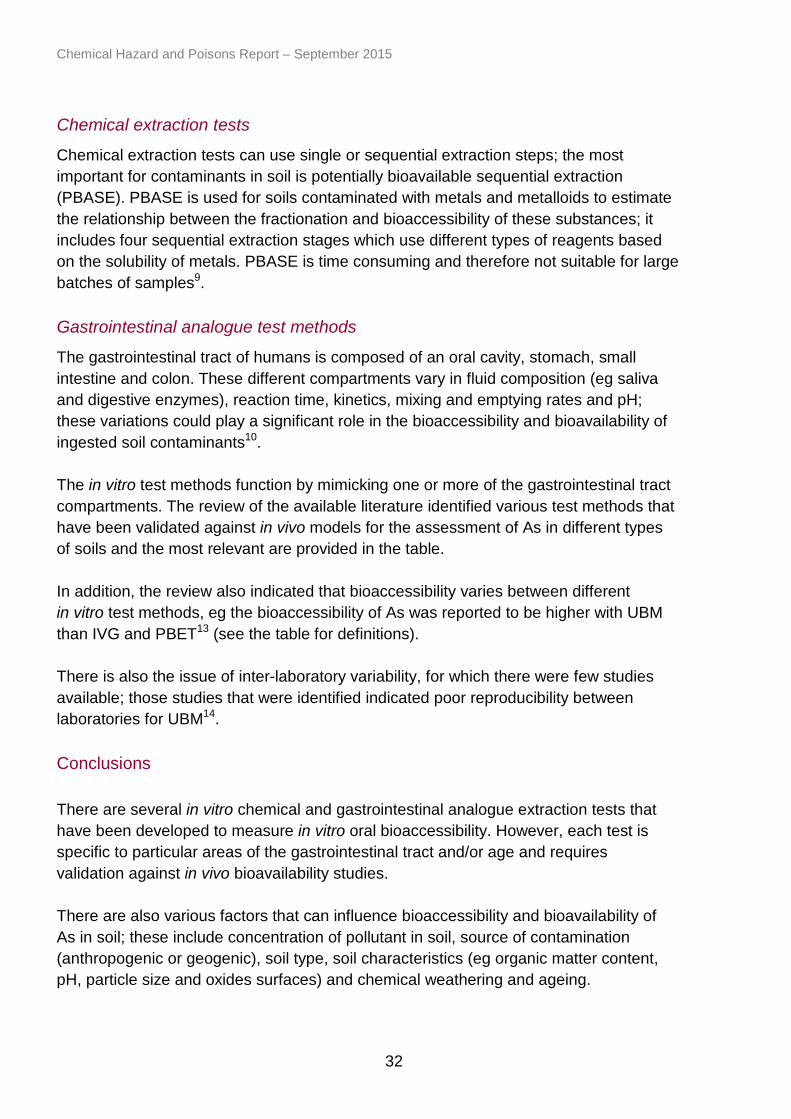
Chemical extraction tests can use single or sequential extraction steps; the most important for contaminants in soil is potentially bioavailable sequential extraction (PBASE). PBASE is used for soils contaminated with metals and metalloids to estimate the relationship between the fractionation and bioaccessibility of these substances; it includes four sequential extraction stages which use different types of reagents based on the solubility of metals. PBASE is time consuming and therefore not suitable for large batches of samples9. Gastrointestinal analogue test methods
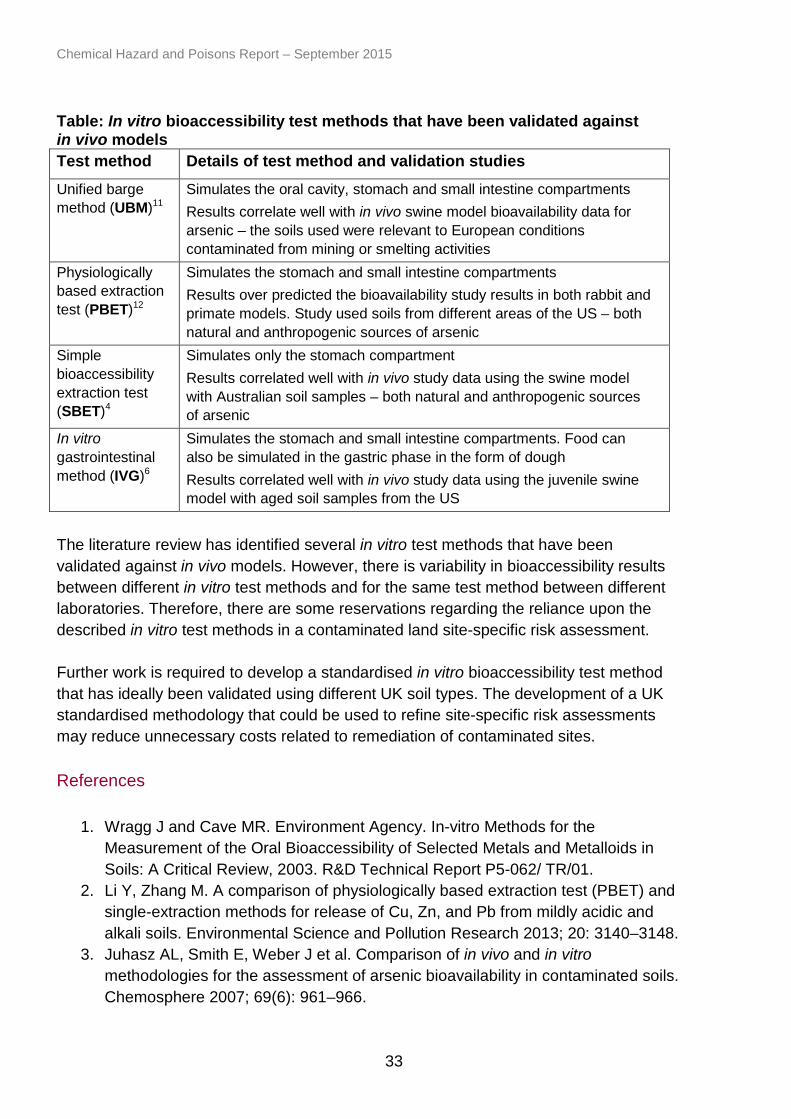
The gastrointestinal tract of humans is composed of an oral cavity, stomach, small intestine and colon. These different compartments vary in fluid composition (eg saliva and digestive enzymes), reaction time, kinetics, mixing and emptying rates and pH; these variations could play a significant role in the bioaccessibility and bioavailability of ingested soil contaminants10. The in vitro test methods function by mimicking one or more of the gastrointestinal tract compartments. The review of the available literature identified various test methods that have been validated against in vivo models for the assessment of As in different types of soils and the most relevant are provided in the table. In addition, the review also indicated that bioaccessibility varies between different in vitro test methods, eg the bioaccessibility of As was reported to be higher with UBM than IVG and PBET13 (see the table for definitions). There is also the issue of inter-laboratory variability, for which there were few studies available; those studies that were identified indicated poor reproducibility between laboratories for UBM14. Conclusions
There are several in vitro chemical and gastrointestinal analogue extraction tests that have been developed to measure in vitro oral bioaccessibility. However, each test is specific to particular areas of the gastrointestinal tract and/or age and requires validation against in vivo bioavailability studies. There are also various factors that can influence bioaccessibility and bioavailability of As in soil; these include concentration of pollutant in soil, source of contamination (anthropogenic or geogenic), soil type, soil characteristics (eg organic matter content, pH, particle size and oxides surfaces) and chemical weathering and ageing.
Chemical Hazard and Poisons Report – September 2015
33
Table: In vitro bioaccessibility test methods that have been validated against in vivo models Test method Details of test method and validation studies Unified barge method (UBM)11
Simulates the oral cavity, stomach and small intestine compartments Results correlate well with in vivo swine model bioavailability data for arsenic – the soils used were relevant to European conditions contaminated from mining or smelting activities
Physiologically based extraction test (PBET)12
Simulates the stomach and small intestine compartments Results over predicted the bioavailability study results in both rabbit and primate models. Study used soils from different areas of the US – both natural and anthropogenic sources of arsenic
Simple bioaccessibility extraction test (SBET)4
Simulates only the stomach compartment Results correlated well with in vivo study data using the swine model with Australian soil samples – both natural and anthropogenic sources of arsenic
In vitro gastrointestinal method (IVG)6
Simulates the stomach and small intestine compartments. Food can also be simulated in the gastric phase in the form of dough Results correlated well with in vivo study data using the juvenile swine model with aged soil samples from the US
The literature review has identified several in vitro test methods that have been validated against in vivo models. However, there is variability in bioaccessibility results between different in vitro test methods and for the same test method between different laboratories. Therefore, there are some reservations regarding the reliance upon the described in vitro test methods in a contaminated land site-specific risk assessment. Further work is required to develop a standardised in vitro bioaccessibility test method that has ideally been validated using different UK soil types. The development of a UK standardised methodology that could be used to refine site-specific risk assessments may reduce unnecessary costs related to remediation of contaminated sites. References
1. Wragg J and Cave MR. Environment Agency. In-vitro Methods for the Measurement of the Oral Bioaccessibility of Selected Metals and Metalloids in Soils: A Critical Review, 2003. R&D Technical Report P5-062/ TR/01.
2. Li Y, Zhang M. A comparison of physiologically based extraction test (PBET) and single-extraction methods for release of Cu, Zn, and Pb from mildly acidic and alkali soils. Environmental Science and Pollution Research 2013; 20: 3140–3148.
3. Juhasz AL, Smith E, Weber J et al. Comparison of in vivo and in vitro methodologies for the assessment of arsenic bioavailability in contaminated soils. Chemosphere 2007; 69(6): 961–966.

Chemical Hazard and Poisons Report – September 2015
34
4. Juhasz AL, Smith E, Weber J et al. In vitro assessment of arsenic bio-accessibility in contaminated (anthropogenic and geogenic) soils. Chemosphere 2007; 69: 69–78.
5. Ruby M, Schoof R, Brattin W et al. Advances in evaluating the oral bioavailability of inorganics in soil for use in human health risk assessment. Environmental Science and Technology 1999; 33: 3697–3705.
6. Rodriguez R, Basta N, Casteel S et al. An in vitro gastrointestinal method to estimate bio-available arsenic in contaminated soils and solid media. Environmental Science and Technology 1999; 33: 642–649.
7. Jeong S, Moon H, Nam K. Differential in vitro bioaccessibility of residual As in a field-aged former smelter site and its implication for potential risk. Science of the Total Environment 2013; 463–464: 348–354.
8. Gbefa K, Entwistle J, Dean J. Oral bio-accessibility of metals in an urban catchment, Newcastle upon Tyne. Environmental Geochemistry and Health 2011; 33: 167–181.
9. Basta N, Gradwohl R. Estimation of Cd, Pb, and Zn bioavailability in smelter-contaminated soils by a sequential extraction procedure. Journal of Soil Contamination 2000; 9: 146–149.
10. Oomen AG, Hack A, Minekus M et al. Comparison of five in vitro digestion models to study the bioaccessibility of soil contaminants. Environmental Science and Technology 2002; 36: 3326–3334.
11. Denys S, Caboche J, Tack K et al. In vivo validation of the Unified BARGE Method to assess the bioaccessibility of arsenic, antimony, cadmium, and lead in soils. Environmental Science and Technology 2012; 46: 6252–6259.
12. Ruby M, Davis A, Schoof R et al. Estimation of lead and arsenic bio-availability using a physiologically based extraction test. Environmental Science and Technology 1996; 30: 422–430.
13. Juhasz AL, Weber J, Smith E. Influence of saliva, gastric and intestinal phases on the prediction of As relative bioavailability using the Unified Bioaccessibility Research Group of Europe Method (UBM). Journal of Hazardous Materials 2011; 197(0): 161–168.
14. Wragg J, Cave M, Basta N et al. An inter-laboratory trial of the unified BARGE bioaccessibility method for arsenic, cadmium and lead in soil. Science of the Total Environment 2011; 409(19): 4016–4030.

Chemical Hazard and Poisons Report – September 2015
35
Is traffic pollution a risk to community gardening and horticulture in urban areas?
Sarah Dack Centre for Radiation, Chemical and Environmental Hazards, Environmental Hazards and Emergencies, Public Health England Email: [email protected] Introduction
In the UK, community gardens are used to encourage healthy eating, reduce social isolation, improve health and fitness, and promote community cohesion. However, recent studies have identified potential risks from soil and vegetation near roads1,2,3,4. There is widespread evidence that urban derelict land and garden soils can contain pollutants above background concentrations and that point sources (eg historic factories) may impact soil and vegetation concentrations1. In 2007, a UK study where samples from rural, urban and industrial soils were analysed for a range of chemicals (metals, polychlorinated biphenyls, polycyclic aromatic hydrocarbons (PAHs) and dioxins) showed widespread background contamination, particularly in urban and industrial areas. However, metals can also be elevated due to natural geology5. National and local government guidance6,7,8 on the use of land for community gardens primarily focuses on brownfield sites rather than available land near road corridors. A number of organisations and charities are encouraging the development of urban community gardening schemes and “guerrilla gardening”, backed up by the guidance above6,7,8. Therefore, a review was undertaken on the potential for traffic to contaminate fruit and vegetables grown in roadside plots. These are often disused open spaces used by gardeners without permission (guerrilla gardening) or land used by community groups with the landholder’s permission. Traffic sourced pollutants that could affect urban gardening
It is known that traffic pollution affects air quality. Exhaust emissions typically comprise particulate matter (PM) and vapours. Many of the volatile gasses are of more significance to gardeners from direct inhalation, than through the soil and vegetation. Inhalation pathways are considered by the independent Committee on the Medical Effects of Air Pollutants9. The first stage of this review was to identify if traffic-related pollution could also have an impact on soils and edible produce, thus providing a secondary pollution pathway.

Chemical Hazard and Poisons Report – September 2015
36
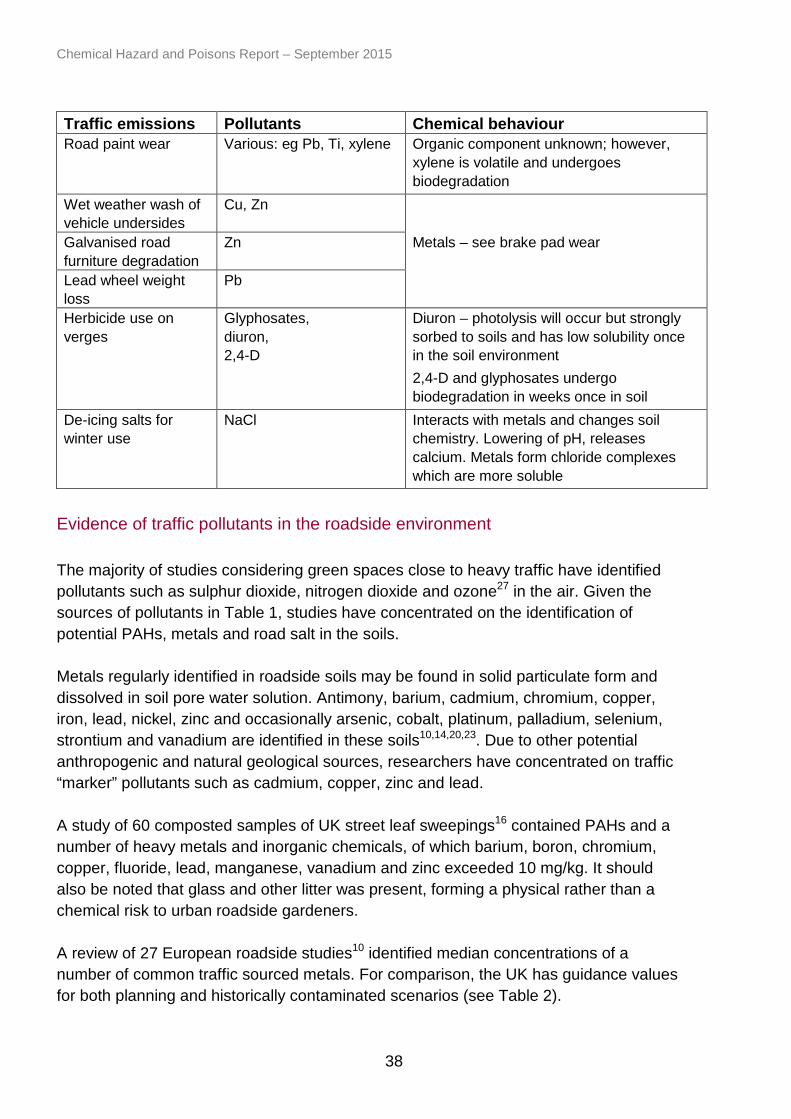
A portion of the particulate matter emitted undergoes dry and wet aerial deposition on to nearby vegetation and soils. Infiltration can occur on to surface soils by road run off or traffic spray water on to vegetation and soils10. Particulate matter may collect in road puddles, dry out, and become resuspended by wind and traffic abrasion. Traffic pollutants can therefore affect both roadside soils and vegetation by either direct emissions (from exhausts) or indirect emissions (from vehicle and road wear). These are summarised in Table 1. Although lead has been banned from petrol in the European Union (EU) and elsewhere, for approximately 15 years, it is still identifiable within roadside soils deposited from exhaust emissions11,12. Brake pads historically contained asbestos but this was prohibited by the UK and EU in 1999; more recently copper, antimony and cadmium used as replacements have been identified in roadside soils (along with other trace metals) in Sweden, Spain, the US and the UK12,13,14,15. Experiments suggest that 50% of wear to brakes is emitted to atmosphere as particulate matter, up to 30% of brake material falls on the road surface and is then resuspended, and the remainder is retained on the car16. A single study claims that it can be removed later as wet weather “wash”15, although this was based on swabbing cars in a tyre service centre. Tyre wear is an important contributor to PM10 emissions16. Besides organic compounds, inorganic pollutants in tyres comprise predominantly zinc; however, a range of other metals have been identified14. Other indirect emissions include chemicals in engine oils and lubricants and the platinum group metals which originate from catalytic converters17,18. Road surface abrasion is a major component of indirect emissions. Road dust may also include construction and demolition dust, de-icing grit, salt and natural regolith19. Approximately half the PM10 fraction measured at European roadsides may be due to resuspended road dust20. Other road sourced pollutants are road paint21, zinc leaching from galvanised road furniture13, and lead wheel weights21. On roads with verges, there may be historic herbicide spraying residues22.

Chemical Hazard and Poisons Report – September 2015
37
Table 1: Summary of traffic emissions and their chemical behaviour in the environment, based on a review of the literature Traffic emissions Pollutants Chemical behaviour Exhaust emissions Gasses:
N2, NOX, SO2, CO2, CO, H2O, VOCs Particulate matter: Pb (historic), Ba, PAHs
Gasses: volatile organic compounds (VOCs) undergo photolysis and are involved in production of ozone (with NOx). Persistence of few hours only Other gasses: travel distance from roadside may be significant. React with water to produce weak acids (acid rain) which lowers pH in soil and in the case of SO2 may aid nucleation of semi volatile organic compounds (SVOCs) into particles. Can react with metals in soil – nitrate and sulphate salts more soluble than oxides Lead persistent in roadside soils 15 years after ban in petrol Polycyclic aromatic hydrocarbons (PAHs) persistent, although microbial action does occur. Sorption on to organic matter in soil
Brake pad wear Asbestos (historic) Metals: Predominantly – Cd, Cu, Sb Trace – Al, Ba, Ca, Cr, Fe, Mg, Mn, Pb, Ti, Zn
Asbestos is persistent in the environment Metals are persistent and may form stable complexes with organic matter or form salts with anions. The metal salts have varying solubility Soil composition/pH and other traffic pollutants affect solubility/leachability
Tyre wear PAHs Metals: Predominantly – Cu, Zn Trace – Ca, Cd, Co, Cr, Cu, Fe, K, Mn, Mo, Ni, Pb, Ti, W
PAHs – see exhaust emissions Metals – see brake pad wear
Engine oils and lubricant loss
Hydrocarbons (Lube oil – Zn)
Higher molecular weight hydrocarbons undergo less biodegradation. Solubility varies with structure and molecular weight
Catalytic converter wear
Metals: Pt, Pd, Rh, Au, Rb
All persistent in soil once deposited. Unreactive
Road surface abrasion
PAHs Bituminous material Metals – various, dependent on source (eg Ba, Ca, Cr, Cu, Fe, K, Mn, Mo, Pb, Rb, Sr, Ti, Zn, Zr)
PAHs – see exhaust emissions High molecular weight hydrocarbons have low biodegradation and solubility Metals – see brake pad wear
Chemical Hazard and Poisons Report – September 2015
38
Traffic emissions Pollutants Chemical behaviour Road paint wear Various: eg Pb, Ti, xylene Organic component unknown; however,
xylene is volatile and undergoes biodegradation
Wet weather wash of vehicle undersides
Cu, Zn
Galvanised road furniture degradation
Zn Metals – see brake pad wear
Lead wheel weight loss
Pb
Herbicide use on verges
Glyphosates, diuron, 2,4-D
Diuron – photolysis will occur but strongly sorbed to soils and has low solubility once in the soil environment 2,4-D and glyphosates undergo biodegradation in weeks once in soil
De-icing salts for winter use
NaCl Interacts with metals and changes soil chemistry. Lowering of pH, releases calcium. Metals form chloride complexes which are more soluble
Evidence of traffic pollutants in the roadside environment
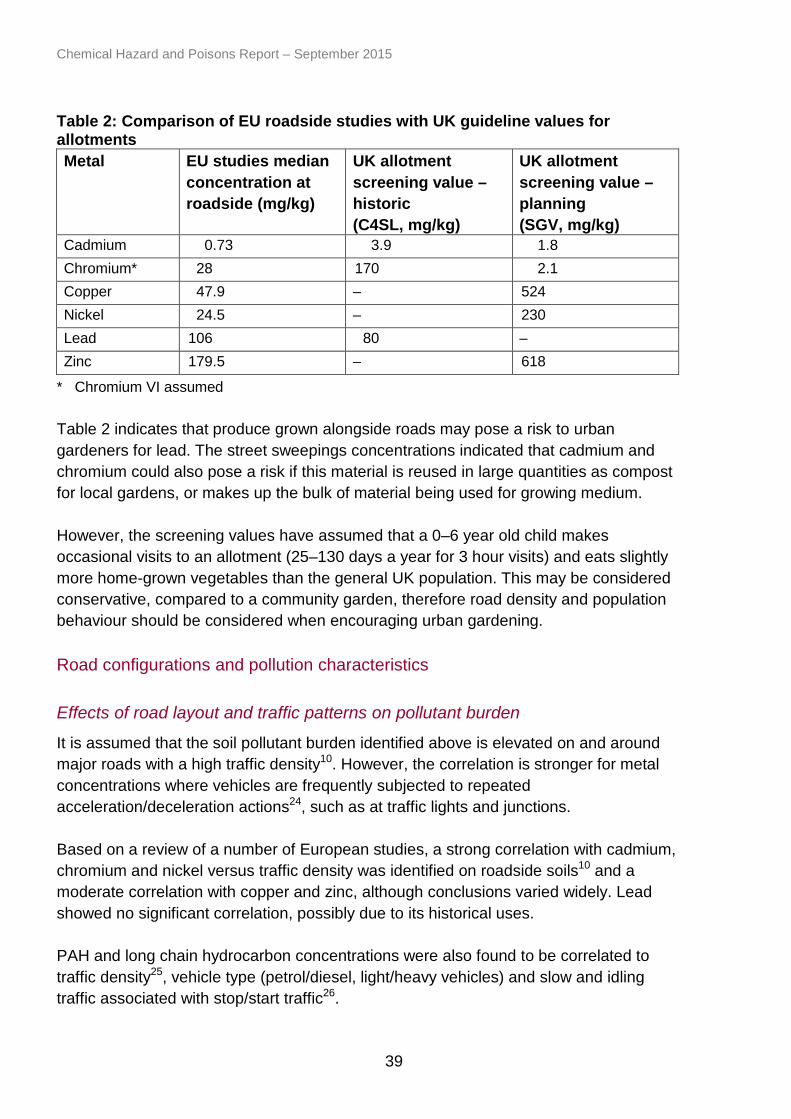
The majority of studies considering green spaces close to heavy traffic have identified pollutants such as sulphur dioxide, nitrogen dioxide and ozone27 in the air. Given the sources of pollutants in Table 1, studies have concentrated on the identification of potential PAHs, metals and road salt in the soils. Metals regularly identified in roadside soils may be found in solid particulate form and dissolved in soil pore water solution. Antimony, barium, cadmium, chromium, copper, iron, lead, nickel, zinc and occasionally arsenic, cobalt, platinum, palladium, selenium, strontium and vanadium are identified in these soils10,14,20,23. Due to other potential anthropogenic and natural geological sources, researchers have concentrated on traffic “marker” pollutants such as cadmium, copper, zinc and lead. A study of 60 composted samples of UK street leaf sweepings16 contained PAHs and a number of heavy metals and inorganic chemicals, of which barium, boron, chromium, copper, fluoride, lead, manganese, vanadium and zinc exceeded 10 mg/kg. It should also be noted that glass and other litter was present, forming a physical rather than a chemical risk to urban roadside gardeners. A review of 27 European roadside studies10 identified median concentrations of a number of common traffic sourced metals. For comparison, the UK has guidance values for both planning and historically contaminated scenarios (see Table 2).
Chemical Hazard and Poisons Report – September 2015
39
Table 2: Comparison of EU roadside studies with UK guideline values for allotments Metal EU studies median
concentration at roadside (mg/kg)
UK allotment screening value – historic (C4SL, mg/kg)
UK allotment screening value – planning (SGV, mg/kg)
Cadmium 0.73 3.9 1.8 Chromium* 28 170 2.1 Copper 47.9 – 524 Nickel 24.5 – 230 Lead 106 80 – Zinc 179.5 – 618
* Chromium VI assumed Table 2 indicates that produce grown alongside roads may pose a risk to urban gardeners for lead. The street sweepings concentrations indicated that cadmium and chromium could also pose a risk if this material is reused in large quantities as compost for local gardens, or makes up the bulk of material being used for growing medium. However, the screening values have assumed that a 0–6 year old child makes occasional visits to an allotment (25–130 days a year for 3 hour visits) and eats slightly more home-grown vegetables than the general UK population. This may be considered conservative, compared to a community garden, therefore road density and population behaviour should be considered when encouraging urban gardening. Road configurations and pollution characteristics
Effects of road layout and traffic patterns on pollutant burden
It is assumed that the soil pollutant burden identified above is elevated on and around major roads with a high traffic density10. However, the correlation is stronger for metal concentrations where vehicles are frequently subjected to repeated acceleration/deceleration actions24, such as at traffic lights and junctions. Based on a review of a number of European studies, a strong correlation with cadmium, chromium and nickel versus traffic density was identified on roadside soils10 and a moderate correlation with copper and zinc, although conclusions varied widely. Lead showed no significant correlation, possibly due to its historical uses. PAH and long chain hydrocarbon concentrations were also found to be correlated to traffic density25, vehicle type (petrol/diesel, light/heavy vehicles) and slow and idling traffic associated with stop/start traffic26.
Chemical Hazard and Poisons Report – September 2015
40
Slow or idling traffic was shown to increase levels of emissions as did frequent braking; therefore junctions are especially impacted10,26,27. In Sweden, copper, antimony and zinc were identified as deceleration metals10,13,28; in the UK (M25 junctions) a strong correlation was found between platinum and deceleration lanes, but not acceleration lanes29. There is also an increased frequency in metal road dust around roundabouts in comparison to traffic lights17. Similar conclusions were reached in Sweden, although lead, copper and antimony were still elevated above background at traffic lights13, and for platinum in Seoul30. There is no definition of a “busy” or “high traffic density” road. For local air quality management, UK technical guidance LAQM TG(09)28 identifies areas at which local authorities may need to assess against air quality objectives. These are narrow, congested streets with residential properties close to the roadside causing a “street canyon” effect with over 5,000 vehicles a day or busy roads with people present/junctions present with over 10,000 vehicles a day. The technical guidance also notes the decrease in air quality with heavy goods vehicles and buses and identifies that monitoring could be needed near bus and coach stations. Therefore it can be concluded that the presence of traffic soil and vegetation pollutants may be influenced by road design, maintenance, junction types, volumes of light and heavy-wheel-based traffic, speeds, accidents, acceleration, braking, etc14,10,21. Mobility processes of pollutants on to soil and leaves
Werkenthin et al10 noted that the area 0–2 m from the road edge is dominated by run off and traffic spray water on to soils and vegetation (the pollutants on leaves may then wash off on to soil or deposit on to soil as dead leaves); the area 2–10 m is dominated by spray; and that at 10–50 m is dominated by aerial deposition. This is affected by wind speed and direction, amount and intensity of precipitation, dry spells and vegetation cover. Furthermore, run off may collect and dry out, leading to particulate matter being resuspended by wind. Plant contaminant burden may be from soil uptake as well as deposition and therefore influenced by soil concentrations. Where deposition on leaves occurs, precipitation may wash off particulate matter, but some adsorption may occur early on in the year during the growing phase22. Another process affecting the mobility of traffic pollutants is traffic height; the turbulent wake from a vehicle is 10–15 times the vehicle height, hence increasing levels of particulate matter are noted along roads with a high density of heavy vehicles or busses31, due to resuspension, turbulent flow followed by dispersion of existing

Chemical Hazard and Poisons Report – September 2015
41
particulate matter and the condensation of condensable vapours in the exhaust emissions into ultrafine particulates32. Low temperatures cause super-saturation of vapours encouraging nucleation32,33, increasing the numbers of particles close to the road in winter, therefore the burden of particulate matter deposited on to roadside soils and vegetation can be increased during the winter months. Open configuration roads generally have more elevated metal concentrations on the downwind side22,34; however, the presence of tall buildings surrounding a relatively narrow road (street canyons) can limit dispersion, so traffic pollutant levels in these settings can be several times higher than those in open street configurations32, increasing deposition on to soils and vegetation. Parallel winds in street canyons can increase mixing and dilution, and perpendicular winds produce vortices resulting in increased pollution on the leeward road side35,36. Therefore the canyon effect on deposition can be complicated27,37,38. It should be assumed that both road verges could be equally polluted in these environments unless the soil is tested before produce is grown. Contradictory findings have been cited for biodegradation of PAHs in soil. One study found elevated bacteria and fungi at a roadside with elevated concentrations of hydrocarbons, suggesting microbial action breaks down PAHs; however, significant levels were still present in soil39. Precautionary roadside distances to garden plots on busy roads
The World Health Organization40 noted that NOX and low molecular weight hydrocarbons (eg benzene) are much less likely to be identified in soils or within plant materials as their half-life is short; these pose a more direct inhation risk to the gardener. The majority of studies indicate that elevated organic and metal concentrations are identified immediately adjacent to the road and in decreasing concentrations against distance and soil depth. As the presence of pollutants close to roadways may increase the potential health risks to an urban gardener, a number of studies were reviewed to identify whether a recommendation could be made on the precautionary distance of garden to road. Comprehensive sampling transects on roadside greenspace along busy roads have been carried out for metals41,42,43 and de-icing salts43. Soils in a Dublin park bisected by a busy road, reached background at 70 m horizontal distance, with the highest concentrations within the first 20 m. The radius of influence of the road was calculated

Chemical Hazard and Poisons Report – September 2015
42
as 29.9 m for lead, 39.4 m for copper and 34.3 m for zinc, indicating that the first 40 m may be impacted above background. The differing distances between metal pollution spread were not attributed, although it may be due to particle size44. Nabulo et al42 identified the highest concentrations within 30 m of the roadside. Both sites were busy open sites (not canyons) with occasional stop/start traffic, and studies in Beijing35 concur with this distance. A comprehensive Austrian study43 on a straight area of autobahn, representing a major intercontinental busy road, found less impact with distance away from the road, possibly due to little deceleration. De-icing salts and metals reached background between 5 m and 10 m from the road. A 10 m zone for road salt due to road spray was also noted by a Swedish study45. A number of other studies have identified the highest concentrations closer to the road, but little information was provided on the likely road type and behaviour. A review of 27 European studies10 found that concentrations were elevated but decreasing between 5 m and 10 m, and often at background at between 10 m and 25 m. Other studies identified the first 20 m14,22,46,47 as being elevated, with a number of studies primarily identifying the first 10 m as potentially elevated above background1,48,49. At the other end of the scale, a study in the Czech Republic50 identified metals 160 m to 320 m from a busy highway, and a US study found de-icing salts 184 m from the roadside51, attributed to spray and aerial deposition. In all cases, however, the majority of impact was within the first 3 m of the roadside. With regard to PAHs, they have been found most elevated within the first 10 m, although present up to 100 m away in soils39. In recommendations made by Toronto Public Health52 it was stated that the first 30 m from a busy road may be impacted, but the research basis for this was not given. From the studies highlighted above, roadsides may be impacted by traffic pollution at least 10 m from the verge, and potentially up to 320 m away. Taking into account that many studies discuss “busy roads” without stating traffic density or presence of idling traffic, it would appear that where stop/start, high density traffic may occur, soils and vegetation could be potentially polluted for up to 40 m from the roadside. Thus in such areas where urban gardening is carried out or is proposed, mitigation should be considered as a precautionary measure. Depth of sampling has also been carried out within many soil studies, to identify whether one mitigation option would be to remove current topsoil, or rotovate it to mix it with cleaner soil at depth. Generally the presence of traffic-related pollution was shallow, although metal concentrations may be deeper if tillage or construction
Chemical Hazard and Poisons Report – September 2015
43
disturbance occurs46. The majority of studies identified traffic-related pollution down to depths not exceeding 20 cm10,12,46, but this was dependent on the metal species and leachability. Lack of soil fauna, compaction and the presence of de-icing salts may affect vertical pollutant mobility10. The sodium ion in road salt (Na+Cl–) can replace calcium in soils and increases the mobility of soil colloids and any heavy metals, while the chloride ion concentrations favour the formation of the more mobile metal chloride complexes43. Thus, there is potential for pollution to have migrated further into the soil layer in roadside soils, although pollution is likely to be very shallow if no disturbance or de-icing salts have been used locally. Therefore rotovation would not be a suitable mitigation measure unless soil depth sampling had been carried out to identify if pollutants were only in the upper topsoil. Samples from secondary/quieter roads were observed to be impacted over the first 1 m horizontal distance and top 2 cm of soil12,46, therefore gardens and road verges along these roads are unlikely to be impacted by traffic pollution at levels that may impact on human health. Mitigation and conclusion
Based on sampling and known traffic pollutants, there is the potential for pollution to be present along roadside spaces from vehicles as well as general litter (eg plastic, paper, road kill and dog faeces). Most UK urban gardens are not subsistence agriculture providing the entire need of the family, and thus, based even on an allotment scenario, any potential risk to health is likely to be low from the majority of near-road plots. However, given that a potential risk, albeit low, has been recognised, as a precaution it would be prudent for the siting of new urban community gardens to be 30–40 m away from busy roads, especially ones with stop/start traffic. Alternatively, hedges and walls can provide barriers to aerial deposition and traffic spray; however, soils behind these barriers may be contaminated by historic road usage, therefore the use of raised beds with clean soil or removal/replacement with a geotextile barrier to prevent soil mixing is suggested. With regard to which crops are less susceptible to traffic, plant uptake varies according to soil concentration, soil type and plant type, including individual cultivars. Generally, leafy vegetables exhibit the highest metal accumulation, followed by roots, legumes and then fruits53,54,55,56,57. However, a study in Berlin noted variation among these generalisations: chard (leafy vegetable) accumulated metals, white cabbage did not1.

Chemical Hazard and Poisons Report – September 2015
44
In addition, some leafy vegetables such as mustard may be hyperaccumulators58. Toronto Public Health52 identified brassicas and maize as common hyperaccumulators for a large range of metals. Generally, tree and shrub fruits/nuts seem to accumulate fewer metals than vegetables3,48. For species that are adsorbing metals from aerial deposition rather than root uptake and transport to the leaves and fruit, the leaf character, shape and leaf density (particularly hairiness and waxiness) affect the metal content of the leaf49,57,59,60 by either physically trapping particulate matter, adsorbing the metals or allowing rain to wash particles easily off. Where particulate matter is present, but metals are not adsorbed, the effectiveness of washing is also affected by the leaf shape, size and structure56. With trailing species subject to soil splash, mulch can reduce this and thus soil entrainment on leaves1,2. Peeling, especially of roots where the outer skin is often enriched42, or removing skin, shells or casings from tree fruit and nuts3 further reduces the pollutant burden. Close to the road there is an increased risk to the gardener due to inhalation and ingestion of airborne particulate matter and vapours from the traffic dependent on time spent at a roadside location, and more emphasis will have to be made in keeping the community safe with road safety and traffic awareness. Regardless of position, any reclaimed space is likely to comprise soils where good hygiene practices should be followed, such as washing hands after gardening, wearing gloves and for vegetables, washing, peeling or removing outer leaves. Acknowledgements
Many thanks to Marie Robson for helpful comments, and to Jane Jobateh of PHE for being concerned about urban gardening in the East Midlands. References
1. Säumel I, Kotsyuk I, Hölscher M et al. How healthy is urban horticulture in high traffic areas? Trace metal concentrations in vegetable crops from plantings within inner city neighbourhoods in Berlin, Germany. Environmental Pollution 2012; 165: 124–132.
2. Kim BF, Poulsen MN, Margulies JD et al. Urban community gardeners' knowledge and perceptions of soil contaminant risks. PLoS ONE 2014; 9.
3. Von Hoffen LP, Säumel I. Orchards for edible cities: Cadmium and lead content in nuts, berries, pome and stone fruits harvested within the inner city
Chemical Hazard and Poisons Report – September 2015
45
neighbourhoods in Berlin, Germany. Ecotoxicology and Environmental Safety 2014; 101: 233–239.
4. McClintock N. Assessing soil lead contamination at multiple scales in Oakland, California: Implications for urban agriculture and environmental justice. Applied Geography 2012; 35: 460–473.
5. Environment Agency (2007). UK Soil & Herbage Pollutant Survey. EA, Bristol. 6. Department for Communities and Local Government (2012). Space for food
growing: Guide. DCLG, London. 7. Local Government Association (2009). Growing in the community, 2nd Edition.
LGA. 8. Welsh Government (2014). Consultation on improving the availability of
allotments and community gardens. Consultation Document. 9. Committee on the Medical Effects of Air Pollutants (COMEAP) (2010). The
Mortality Effects of Long-Term Exposure to Particulate Air Pollution in the United Kingdom. HPA, UK.
10. Werkenthin M, Kluge B, Wessolek G. Metals in European roadside soils and soil solution – A review. Environmental Pollution 2014; 189: 98–110.
11. Díaz Rizo O, Fonticiella Morell D, Arado López JO et al. Spatial distribution and contamination assessment of heavy metals in urban topsoils from Las Tunas City, Cuba. Bulletin of Environmental Contamination and Toxicology 2013; 91: 29–35.
12. Carrero JA, Arrizabalaga I, Bustamante J et al. Diagnosing the traffic impact on roadside soils through a multianalytical data analysis of the concentration profiles of traffic-related elements. Science of the Total Environment 2013; 458–460: 427–434.
13. Hjortenkrans D, Bergbäck B, Häggerud A. New metal emission patterns in road traffic environments. Environmental Monitoring and Assessment 2006; 117: 85–98.
14. Apeagyei E, Bank MS, Spengler JD. Distribution of heavy metals in road dust along an urban-rural gradient in Massachusetts. Atmospheric Environment 2011; 45: 2310–2323.
15. Mckenzie ER, Money JE, Green PG, Young TM. Metals associated with stormwater-relevant brake and tire samples. Science of the Total Environment 2009; 407: 5855–5860.
16. Environment Agency (2013). Leaf litter in street sweepings: investigation into collection and treatment. EA, Bristol.
17. Prichard HM, Sampson J, Jackson M. A further discussion of the factors controlling the distribution of Pt, Pd, Rh and Au in road dust, gullies, road sweeper and gully flusher sediment in the city of Sheffield, UK. Science of the Total Environment 2009; 407: 1715–1725.
18. Kalavrouziotis IK, Koukoulakis PH. The environmental impact of the platinum group elements (Pt, Pd, Rh) emitted by the automobile catalyst converters. Water, Air, and Soil Pollution 2009; 196: 393–402.
Chemical Hazard and Poisons Report – September 2015
46
19. Charlesworth S, De Miguel E, Ordóñez A. A review of the distribution of particulate trace elements in urban terrestrial environments and its application to considerations of risk. Environmental Geochemistry and Health 2011; 33: 103–123.
20. Thorpe A, Harrison RM. Sources and properties of non-exhaust particulate matter from road traffic: A review. Science of the Total Environment 2008; 400: 270–282.
21. Wiseman CLS, Zereini F, Püttmann W. Traffic-related trace element fate and uptake by plants cultivated in roadside soils in Toronto, Canada. Science of the Total Environment 2013; 442: 86–95.
22. Forman RTT, Alexander LE. Roads and their major ecological effects. Annual Review of Ecology and Systematics 1998; 29: 207–231.
23. Wu S, Zhou S, Li X. Determining the anthropogenic contribution of heavy metal accumulations around a typical industrial town: Xushe, China. Journal of Geochemical Exploration 2011; 110: 92–97.
24. Ewen C, Anagnostopoulou MA, Ward NI. Monitoring of heavy metal levels in roadside dusts of Thessaloniki, Greece in relation to motor vehicle traffic density and flow. Environmental Monitoring and Assessment 2009; 157: 483–498.
25. Alam MS, Delgado-Saborit JM, Stark C, Harrison RM. Using atmospheric measurements of PAH and quinone compounds at roadside and urban background sites to assess sources and reactivity. Atmospheric Environment 2013; 77: 24–35.
26. Matti Maricq M. Chemical characterization of particulate emissions from diesel engines: A review. Journal of Aerosol Science 2007; 38: 1079–1118.
27. Agrawal M, Singh B, Rajput M et al. Effect of air pollution on peri-urban agriculture: A case study. Environmental Pollution 2003; 126: 323–329.
28. Department for Environment, Food And Rural Affairs (2009). Local Air Quality Management. Technical Guidance. LAQM TG(09). Defra, London.
29. Ward NI, Dudding LM. Platinum emissions and levels in motorway dust samples: Influence of traffic characteristics. Science of the Total Environment 2004; 334–335: 457–463.
30. Lee HY, Chon HT, Sager M, Marton L. Platinum pollution in road dusts, roadside soils, and tree barks in Seoul, Korea. Environmental Geochemistry and Health 2012; 34: 5–12.
31. Thorpe AJ, Harrison RM, Boulter PG, McCrae IS. Estimation of particle resuspension source strength on a major London Road. Atmospheric Environment 2007; 41: 8007–8020.
32. Kumar P, Ketzel M, Vardoulakis S et al. Dynamics and dispersion modelling of nanoparticles from road traffic in the urban atmospheric environment – A review. Journal of Aerosol Science 2011; 42: 580–603.
33. Price HD, Arthur R, Bérubé KA, Jones TP. Linking particle number concentration (PNC), meteorology and traffic variables in a UK street canyon. Atmospheric Research 2014; 147–148: 133–144.
Chemical Hazard and Poisons Report – September 2015
47
34. Chen X, Xia X, Zhao Y, Zhang P. Heavy metal concentrations in roadside soils and correlation with urban traffic in Beijing, China. Journal of Hazardous Materials 2010; 181: 640–646.
35. Boddy JWD, Smalley RJ, Goodman PS et al. The spatial variability in concentrations of a traffic-related pollutant in two street canyons in York, UK – Part II: The influence of traffic characteristics. Atmospheric Environment 2005; 39: 3163–3176.
36. Weber S, Kuttler W, Weber K. Flow characteristics and particle mass and number concentration variability within a busy urban street canyon. Atmospheric Environment 2006; 40: 7565–7578.
37. Kumar P, Fennell P, Britter R. Effect of wind direction and speed on the dispersion of nucleation and accumulation mode particles in an urban street canyon. Science of the Total Environment 2008; 402: 82–94.
38. Boddy JWD, Smalley RJ, Dixon NS et al. The spatial variability in concentrations of a traffic-related pollutant in two street canyons in York, UK – Part I: The influence of background winds. Atmospheric Environment 2005; 39: 3147–3161.
39. Tuháčková J, Cajthaml T, Novák K et al. Hydrocarbon deposition and soil microflora as affected by highway traffic. Environmental Pollution 2001; 113: 255–262.
40. World Health Organization (2006). Air Quality Guidelines Global Update 2005 Particulate matter, ozone, nitrogen dioxide and sulfur dioxide. WHO Regional Office for Europe, Denmark.
41. Dao L, Morrison L, Zhang H, Zhang C. Influences of traffic on Pb, Cu and Zn concentrations in roadside soils of an urban park in Dublin, Ireland. Environmental Geochemistry and Health 2014; 36: 333–343.
42. Nabulo G, Oryem-Origa H, Diamond M. Assessment of lead, cadmium, and zinc contamination of roadside soils, surface films, and vegetables in Kampala City, Uganda. Environmental Research 2006; 101: 42–52.
43. Zehetner F, Rosenfellner U, Mentler A, Gerzabek MH. Distribution of road salt residues, heavy metals and polycyclic aromatic hydrocarbons across a highway-forest interface. Water, Air, and Soil Pollution 2009; 198: 125–132.
44. Fernández-Espinosa AJ, Ternero-Rodríguez M. Study of traffic pollution by metals in Seville (Spain) by physical and chemical speciation methods. Analytical and Bioanalytical Chemistry 2004; 379: 684–699.
45. Bäckström M, Karlsson S, Bäckman L et al. Mobilisation of heavy metals by deicing salts in a roadside environment. Water Research 2004; 38: 720–732.
46. Guney M, Onay TT, Copty NK. Impact of overland traffic on heavy metal levels in highway dust and soils of Istanbul, Turkey. Environmental Monitoring and Assessment 2010; 164: 101–110.
47. Sharma S, Prasad FM. Accumulation of lead and cadmium in soil and vegetable crops along major highways in Agra (India). E-Journal of Chemistry 2010; 7: 1174–1183.

Chemical Hazard and Poisons Report – September 2015
48
48. Peachey CJ, Sinnett D, Wilkinson M et al. Deposition and solubility of airborne metals to four plant species grown at varying distances from two heavily trafficked roads in London. Environmental Pollution 2009; 157: 2291–2299.
49. Weber F, Kowarik I, Säumel I. Herbaceous plants as filters: Immobilization of particulates along urban street corridors. Environmental Pollution 2014; 186: 234–240.
50. Žalud P, Száková J, Sysalová J, Tlustoš P. Factors influencing uptake of contaminated particulate matter in leafy vegetables. Central European Journal of Biology 2012; 7: 519–530.
51. Cunningham MA, Snyder E, Yonkin D et al. Accumulation of deicing salts in soils in an urban environment. Urban Ecosystems 2008; 11: 17–31.
52. Toronto Public Health (2011). Assessing Urban Impacted Soil for Urban Gardening: Decision Support Tool, Technical Report & Rationale. City of Toronto, Canada.
53. Alexander PD, Alloway BJ, Dourado AM. Genotypic variations in the accumulation of Cd, Cu, Pb and Zn exhibited by six commonly grown vegetables. Environmental Pollution 2006; 144: 736–745.
54. Bešter PK, Lobnik F, Eržen I et al. Prediction of cadmium concentration in selected home-produced vegetables. Ecotoxicology and Environmental Safety 2013; 96: 182–190.
55. Szolnoki Z, Farsang A, Puskás I. Cumulative impacts of human activities on urban garden soils: Origin and accumulation of metals. Environmental Pollution 2013; 177: 106–115.
56. Wiseman CLS, Zereini F, Püttmann W. Metal translocation patterns in Solanum melongena grown in close proximity to traffic. Environmental Science and Pollution Research 2014; 21: 1572–1581.
57. Environment Agency (2009). Updated Technical Background to the CLEA model, SR3. EA, Bristol.
58. McBride MB, Simon T, Tam G, Wharton S. Lead and arsenic uptake by leafy vegetables grown on contaminated soils: Effects of mineral and organic amendments. Water, Air, and Soil Pollution 2013; 224.
59. Hwang HJ, Yook SJ, Ahn KH. Experimental investigation of submicron and ultrafine soot particle removal by tree leaves. Atmospheric Environment 2011; 45: 6987–6994.
60. Sæbø A, Popek R, Nawrot B et al. Plant species differences in particulate matter accumulation on leaf surfaces. Science of the Total Environment 2012; 427–428: 347–354.

Chemical Hazard and Poisons Report – September 2015
49
Greening an urban canyon to reduce levels of nitrogen dioxide and particulate matter in the West Midlands
Richard White1, Alec Dobney2, Toby Smith2, Lydia Izon-Cooper2 1. Public Health, Sandwell Metropolitan Borough Council 2. Centre for Radiation, Chemical and Environmental Hazards, Environmental
Hazards and Emergencies, Public Health England Email: [email protected] Background
Mortality burden estimates undertaken by Public Health England (PHE) at local authority level have indicated that there are approximately 200 attributable deaths a year alone in Sandwell Metropolitan Borough Council (the council) area due to particulate matter (PM) air pollution1. Other air pollutants also have adverse effects on health, with nitrogen dioxide (NO2) and ozone (O3) levels causing concern. NO2 is a gas which is emitted from the same combustion sources as PM, road traffic being the largest local source. The Committee on the Medical Health Effects of Air Pollutants (COMEAP) concluded recently that evidence associating NO2 with health effects has strengthened substantially in recent years and considers that NO2 itself is responsible for some of the health impact, particularly the respiratory effects, reported in epidemiological studies2. Measured air pollution levels in the council area are among the highest in the West Midlands, with concentrations exceeding the annual air quality objective for NO2 at the roadside monitoring site since recording began. The whole borough was declared an air quality management area (AQMA) in 20053. Bearwood Road is an urban canyon in Smethwick; it is a heavily trafficked commercial thoroughfare (with approximately 11,000 vehicle movements a day), experiencing high levels of traffic-related air pollution, primarily through direct vehicular exhaust emissions of NO2 and PM. An urban street canyon may arise where a road cuts through a dense area of buildings, which are higher than the width of the street. Urban canyons restrict air movement and increase the residence time of pollution, resulting in an increase in concentration levels and exposure periods. As the principal shopping centre in Smethwick and a road transport hub, Bearwood Road attracts large numbers of shoppers and commuters3; in addition, there is living accommodation on the upper floors of most of the commercial premises. Figure 1 shows the extent of Bearwood Road and its location in relation to sensitive public land

Chemical Hazard and Poisons Report – September 2015
50
uses. The concentrations of NO2 at Bearwood Road sites are repeatedly above the annual mean objective by a large margin3 (Figure 2). The annual mean objective for NO2 is 40 µg/m3 for the protection of human health.
Figure 1: Location and extent of Bearwood Road and sensitive receptors © Crown copyright [and database rights] 2015 Ordnance Survey 100016969/100022432 The rate at which pollutants in the air are deposited on to surfaces is dependent on the nature of the surface; the rate of deposition on to vegetation is much higher than on to hard surfaces, such as brick and concrete. Planting vegetation (known in this context as “greening”) in urban canyons has been shown to reduce street level concentrations of pollution by up to 30%. Other benefits include reduced noise pollution and surface temperature, increased amenity value, and improved aesthetic appearance4. Given the challenges of further reducing levels of NO2 using conventional control measures, PHE and the council worked with the universities of Birmingham and Staffordshire to explore the emerging potential for greening urban corridors to reduce pollution as well as to enhance local environments.
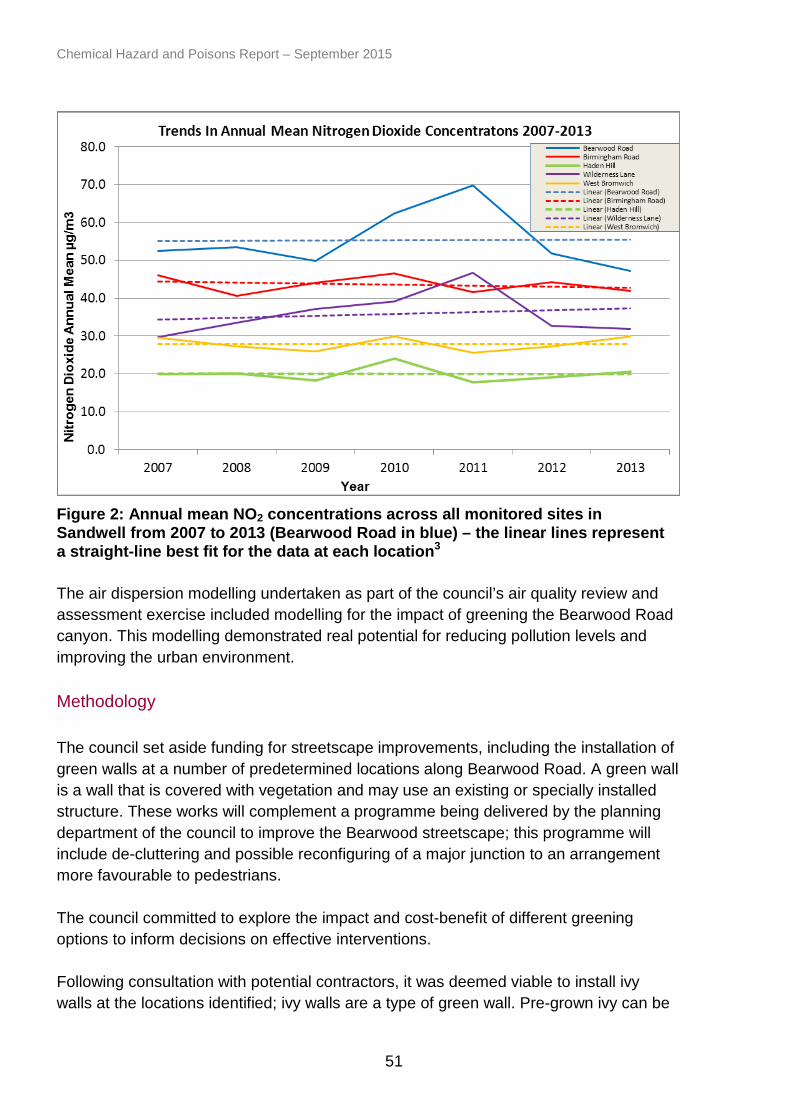
Chemical Hazard and Poisons Report – September 2015
51
Figure 2: Annual mean NO2 concentrations across all monitored sites in Sandwell from 2007 to 2013 (Bearwood Road in blue) – the linear lines represent a straight-line best fit for the data at each location3 The air dispersion modelling undertaken as part of the council’s air quality review and assessment exercise included modelling for the impact of greening the Bearwood Road canyon. This modelling demonstrated real potential for reducing pollution levels and improving the urban environment. Methodology
The council set aside funding for streetscape improvements, including the installation of green walls at a number of predetermined locations along Bearwood Road. A green wall is a wall that is covered with vegetation and may use an existing or specially installed structure. These works will complement a programme being delivered by the planning department of the council to improve the Bearwood streetscape; this programme will include de-cluttering and possible reconfiguring of a major junction to an arrangement more favourable to pedestrians. The council committed to explore the impact and cost-benefit of different greening options to inform decisions on effective interventions. Following consultation with potential contractors, it was deemed viable to install ivy walls at the locations identified; ivy walls are a type of green wall. Pre-grown ivy can be

Chemical Hazard and Poisons Report – September 2015
52
installed directly on to existing structures; ivy is quick growing, robust and can cover large areas. Ivy is effective at removing air pollution and being evergreen, it works all year round. The first ivy wall was installed at Bearwood Infant School, which made available around 34 m length of boundary fencing facing Bearwood Road. The school was chosen for the first trial of ivy walls as children are vulnerable to the effects of air pollution and the playground stands immediately alongside a busy stretch of Bearwood Road. Another six potential hotspot areas were identified within the Bearwood area and green walls were installed at three of these sites. Figure 3 shows one of these installations.
Figure 3: Green wall installation at junction of Adkins Lane and Bearwood Road © Sandwell Metropolitan Borough Council 2015 With reference to research, the manufacturer claims that annually 23 m2 of ivy wall will absorb the equivalent carbon emissions of an average city tree5. These installations are the total equivalent of between five and seven fully grown trees, but only take up a fraction of the area in comparison. The architecture and layout of Bearwood Road require a portfolio of greening interventions as some parts are unsuitable for green walls and roofs and others are unsuited to street level green walls. A review of the effectiveness of interventions will be conducted in 2019, together with the ongoing monitoring which is conducted as part of the air quality regime. If this intervention proves successful, the council will seek funding to implement it as a long-term public health investment. Other considerations
An automated number plate recognition (ANPR) traffic survey was commissioned in November 2014 by the council’s public health department to gather information on vehicle types to determine emission source apportionment for Bearwood Road.
Chemical Hazard and Poisons Report – September 2015
53
Number plates were matched to the Driver and Vehicle Licensing Agency (DVLA) database, and then fed into the Department for Environment, Food And Rural Affairs’ emissions factor toolkit to determine the oxides of nitrogen (NOX) (which comprise NO2 and nitric oxide, NO) and PM emission rate for every vehicle observed by the cameras; based on their European emission standard and recorded speed. The study reported back on findings in January 20153. The study showed that buses contributed 57% of NOx emissions and 32% of PM emissions in Bearwood Road, despite making up only 6% of vehicle flow. Overall cars made up 86% of the total vehicle flow in the street and contributed to 31% of NOX emissions and 54% of PM emissions, the majority of contributions coming from diesel vehicles. Because of slow average traffic speeds (around 12 km/h), emission rates were similar on weekdays and Saturday. The survey was able to apportion the contribution to emissions made by each type of vehicle seen along Bearwood Road and use this in the evidence base to present to the public transport operators3. The council is currently giving consideration to developing further air quality interventions for Bearwood Road, which take into account the findings from the ANPR study, using various statutory powers, as well as examples of approaches to reduce vehicle emissions that have been adopted elsewhere. Given the introduction of PM2.5 as a public health concern to be addressed through the Public Health Outcomes Framework6 and the impact of an increasing number of private car owners using diesel vehicles, further interventions are being planned around raising air pollution awareness, including encouraging private car users to use alternative routes or making more local trips by walking or cycling. References
1. Gowers AM, Miller BG, Stedman JR. Estimating local mortality burdens associated with particulate air pollution, 2014. Available at https://www.gov.uk/government/uploads/system/uploads/attachment_data/file/332854/PHE_CRCE_010.pdf (accessed 15/07/15).
2. Committee on the Medical Effects of Air Pollutants. Statement on the evidence for the effects of nitrogen dioxide, March 2015. Available at https://www.gov.uk/government/uploads/system/uploads/attachment_data/file/411756/COMEAP_The_evidence_for_the_effects_of_nitrogen_dioxide.pdf (accessed 17/07/15).
3. White R, Sandwell Metropolitan Borough Council. Emissions source apportionment – Bearwood Road, 2014.

Chemical Hazard and Poisons Report – September 2015
54
4. Pugh TAM, MacKenzie AR, Whyatt JD, Hewitt CN. Effectiveness of green infrastructure for improvement of air quality in urban street canyons. Environmental Science and Technology 2012; 46(12): 7692-99 doi: 10.1021/es300826w.
5. Hedera Screens. Environmental. Available at http://www.hederascreens.co.uk/environmental/ (accessed 19/08/15).
6. Department of Health (2012). Public Health Outcomes Framework 2013 to 2016(last updated 2015). Available at https://www.gov.uk/government/publications/healthy-lives-healthy-people-improving-outcomes-and-supporting-transparency (accessed 23/07/15).
Chemical Hazard and Poisons Report – September 2015
55
Action on air pollution
Sotiris Vardoulakis1, Karen Exley1, Naima Bradley2, Alec Dobney2 1. Centre for Radiation, Chemical and Environmental Hazards, Environmental
Change – Air Pollution and Climate Change, Public Health England 2. Centre for Radiation, Chemical and Environmental Hazards, Environmental
Hazards and Emergencies, Public Health England Email: [email protected] Introduction
This article presents the contents of a recent PHE Board Paper “Health effects of air pollution”1 and an overview of the Public Health England (PHE) programme which has been developed in support of national and local government to reduce mortality in England attributable to air pollution. Background
Short-term exposure to elevated levels of air pollution can cause a range of adverse health effects including exacerbation of asthma, effects on lung function, increases in hospital admissions and mortality. Air pollution episodes typically occur several times a year in the UK. Public information on air quality is provided by the Department for Environment, Food and Rural Affairs (Defra) in the form of a daily air quality index (DAQI) and is accompanied by advice to both vulnerable individuals and the general population on proportionate actions that can be taken to reduce health risk on high pollution days – for example, by reducing strenuous activities outdoors. Both the DAQI and the accompanying health advice are based on recommendations from the Committee on the Medical Effects of Air Pollutants (COMEAP) for which PHE’s Centre for Radiation, Chemical and Environmental Hazards (CRCE) provides the scientific secretariat. Studies have shown that long-term exposure to air pollution reduces life expectancy by increasing deaths from cardiovascular and respiratory conditions and from lung cancer. The evidence suggests that exposure to fine particulate pollution is the main cause. A report published by PHE in April 2014 estimated the annual mortality burden in England of long-term exposure to particulate air pollution arising from human activities as equivalent to 25,000 deaths with an associated loss of life of 265,000 years. Long-term exposure to air pollution is likely to be a contributory factor in the initiation, progression and exacerbation of disease2.
Chemical Hazard and Poisons Report – September 2015
56
Considerable research effort has been directed towards trying to understand which sources and components of airborne particles are responsible for adverse health effects. Ultrafine particles, diesel particles, black carbon, metal content and secondary sulphates have variously been suggested as particularly important. However, most authoritative bodies regard the mass of particles that are of sizes that can enter the airways and/or lungs (PM10 and PM2.5) as the most appropriate basis for quantification and regulation3,4. The Public Health Outcomes Framework (PHOF) for England reports on a range of indicators for local authorities, including an indicator for air pollution expressed as the fraction of adult mortality attributable to long-term exposure to human-made particulate air pollution (indicator 3.01)5. The intention is to enable directors of public health and health and wellbeing boards to assess the importance of air pollution locally, alongside other factors detrimental to public health. Other air pollutants also have adverse effects on health, with nitrogen dioxide (NO2) and ozone (O3) levels causing concern in England and elsewhere. Nitrogen dioxide is a gas that is emitted by the same combustion sources as particles – most notably from road traffic. COMEAP concluded recently that evidence associating NO2 with health effects has strengthened substantially in recent years and considerS that NO2 itself is responsible for some of the health impact, particularly the respiratory effects, reported in epidemiological studies6. COMEAP is currently considering how to quantify the association between long-term average concentrations of ambient NO2 and mortality in the UK and intends to publish its views in December 2015. Ozone, which is also a greenhouse gas, is formed in the air by reactions with other gases often over long distances and timescales. This means that, as well as locally generated O3, much of the O3 experienced in England is due to emissions of its precursors in other areas of the world. International approaches are therefore needed to achieve reductions. For O3, the majority of adverse health effects from short-term exposures are respiratory in nature7. A significant amount of the outdoor air pollution we experience today, particularly in cities, is associated with local road traffic. Emissions from transport, industry, commercial and domestic sources, agriculture and power generation also make significant contributions. Therefore, effective control of air pollution requires concerted international, national, regional and local action.
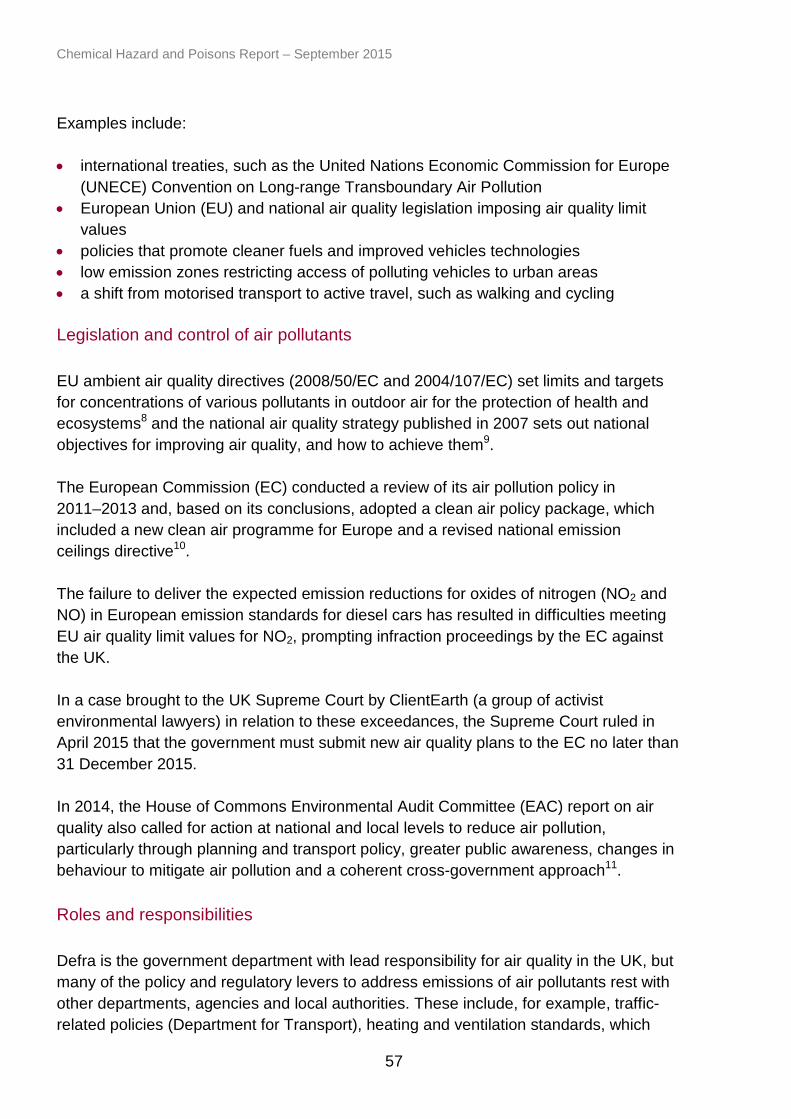
Chemical Hazard and Poisons Report – September 2015
57
Examples include: • international treaties, such as the United Nations Economic Commission for Europe
(UNECE) Convention on Long-range Transboundary Air Pollution • European Union (EU) and national air quality legislation imposing air quality limit
values • policies that promote cleaner fuels and improved vehicles technologies • low emission zones restricting access of polluting vehicles to urban areas • a shift from motorised transport to active travel, such as walking and cycling Legislation and control of air pollutants
EU ambient air quality directives (2008/50/EC and 2004/107/EC) set limits and targets for concentrations of various pollutants in outdoor air for the protection of health and ecosystems8 and the national air quality strategy published in 2007 sets out national objectives for improving air quality, and how to achieve them9. The European Commission (EC) conducted a review of its air pollution policy in 2011–2013 and, based on its conclusions, adopted a clean air policy package, which included a new clean air programme for Europe and a revised national emission ceilings directive10. The failure to deliver the expected emission reductions for oxides of nitrogen (NO2 and NO) in European emission standards for diesel cars has resulted in difficulties meeting EU air quality limit values for NO2, prompting infraction proceedings by the EC against the UK. In a case brought to the UK Supreme Court by ClientEarth (a group of activist environmental lawyers) in relation to these exceedances, the Supreme Court ruled in April 2015 that the government must submit new air quality plans to the EC no later than 31 December 2015. In 2014, the House of Commons Environmental Audit Committee (EAC) report on air quality also called for action at national and local levels to reduce air pollution, particularly through planning and transport policy, greater public awareness, changes in behaviour to mitigate air pollution and a coherent cross-government approach11. Roles and responsibilities
Defra is the government department with lead responsibility for air quality in the UK, but many of the policy and regulatory levers to address emissions of air pollutants rest with other departments, agencies and local authorities. These include, for example, traffic-related policies (Department for Transport), heating and ventilation standards, which
Chemical Hazard and Poisons Report – September 2015
58
relate to indoor air quality (Department for Communities and Local Government) and regulation of emissions from large and complex industrial processes (Defra through the Environment Agency). Defra is currently working on an action plan for improving air quality in the UK in collaboration with local authorities and other government departments; this plan will be available for consultation later this year. Local authorities have a responsibility to ensure compliance with certain air quality limit values under the local air quality management (LAQM) regime. Defra provides advice and guidance to local authorities who are responsible for regularly reviewing and assessing air quality, to check they meet national air quality objectives. If they are not meeting the objectives they must declare an air quality management area (AQMA) and produce an action plan showing how they are going to improve air quality within the AQMA. PHE’s role is in developing and interpreting the available scientific evidence on the health effects of air pollution and on assessing interventions to reduce exposure to air pollution, and improve health and wellbeing. PHE also has a role in advising those who are in a position to take action to improve air quality at local, national and international level. PHE can also play an important role by highlighting the scale of the public health problem associated with air pollution, and encouraging healthcare and public health professionals to support local, national and international initiatives to reduce emissions of pollutants and to reduce exposure of the population to these emissions. A focus on measures that have co-benefits for air pollution along with other public health priorities such as increased physical activity, climate change mitigation and adaptation, and community cohesion and road safety would be appropriate. PHE air pollution and public health programme
PHE has developed a programme in support of national and local government to reduce mortality in England attributable to air pollution. To inform the development of PHE’s work programme, an air pollution and public health advisory group with representatives from local authorities, government, academia and professional bodies was established in 2014. This work programme was also informed by a wider stakeholder event held in February 2015 and in discussion within COMEAP. PHE’s air pollution programme aims to reduce exposure to air pollution and provide wider public health benefits and focuses on: (a) raising public and professional awareness through sustained public health engagement with local authorities and other stakeholders; and (b) providing evidence on the health effects of air pollutants. The aim

Chemical Hazard and Poisons Report – September 2015
59
is to develop a practical framework for local authorities to evaluate the health benefits of local interventions, such as active travel. The following are the main PHE air pollution programme activities planned during 2015–16: • engaging with key local authority and other stakeholders to raise awareness of,
engage with, support and develop networks that promote and support local and regional interventions to reduce exposure to air pollution and provide wider health benefits
• developing the evidence and quantifying the health effects of air pollutants, including NO2, particulate matter and O3, working with external partners such as COMEAP
• raising awareness among decision makers by disseminating and providing guidance on key resources, such as use of the PHOF indicator for air pollution
• raising awareness among the healthcare sector, including the dissemination of research
• raising awareness on the health effects of air pollution and on actions to reduce exposure to air pollution and maximise health benefits among the public
Acknowledgements
This programme of work is led by PHE’s Air Pollution and Public Health project group. The group includes Sotiris Vardoulakis, Naima Bradley, Karen Exley, Alec Dobney, Adrienne Dunne, Alison Gowers and Sani Dimitroulopoulou and is project managed by Clare Heaviside and Lydia Izon-Cooper. Previous members included Rachel Moll, Sarah Robertson and James Stewart-Evans. References
1. Vardoulakis S, Exley K, Bradley N, Dobney A (2015). Health effects of air pollution. Available at https://www.gov.uk/government/uploads/system/uploads/attachment_data/file/445448/PHE15-16_Air_pollution.pdf (accessed 30/07/15).
2. Gowers AM, Miller BG, Stedman JR (2014). Estimating local mortality burdens associated with particulate air pollution. Available at https://www.gov.uk/government/uploads/system/uploads/attachment_data/file/332854/PHE_CRCE_010.pdf (accessed 15/07/15).
3. Committee on the Medical Effects of Air Pollutants (2015). Statement on the evidence for differential health effects of particulate matter according to source or components. Available at https://www.gov.uk/government/uploads/system/uploads/attachment_data/file/411762/COMEAP_The_evidence_for_differential_health_effects_of_particulate_matter_according_to_source_or_components.pdf (accessed 23/07/15).

Chemical Hazard and Poisons Report – September 2015
60
4. World Health Organization (2013). Project: Technical Report: Review of evidence on health aspects of air pollution –REVIHAAP. WHO Regional Office for Europe. Available at http://www.euro.who.int/en/health-topics/environment-and-health/air-quality/publications/2013/review-of-evidence-on-health-aspects-of-air-pollution-revihaap-project-final-technical-report (accessed 21/08/15).
5. Department of Health (2012). Public Health Outcomes Framework 2013 to 2016 (last updated 2015). Available at https://www.gov.uk/government/publications/healthy-lives-healthy-people-improving-outcomes-and-supporting-transparency (accessed 23/07/15).
6. Committee on the Medical Effects of Air Pollutants (2015). Statement on the evidence for the effects of nitrogen dioxide. Available at https://www.gov.uk/government/uploads/system/uploads/attachment_data/file/411756/COMEAP_The_evidence_for_the_effects_of_nitrogen_dioxide.pdf (accessed 17/07/15).
7. Heal MR, Heaviside C, Doherty RM, Vieno M, Stevenson DS, Vardoulakis S. Health burdens of surface ozone in the UK for a range of future scenarios. Environment International 2013; 61: 36–44.
8. European Commission. Air quality – existing legislation. Available at http://ec.europa.eu/environment/air/quality/legislation/existing_leg.htm (accessed 23/07/15).
9. Department for Environment, Food and Rural Affairs (2007). The Air Quality Strategy for England, Scotland, Wales and Northern Ireland. Available at https://www.gov.uk/search?q=air+quality+strategy (accessed 23/07/15).
10. European Commission (2015). Air. Available at http://ec.europa.eu/environment/air/index_en.htm (accessed 30/07/2015).
11. House of Commons. Environmental Audit Committee (2014). Action on air quality, sixth report of session 2014–15. Available at http://www.parliament.uk/documents/commons-committees/environmental-audit/HC-212-for-web.pdf (accessed 23/07/15).
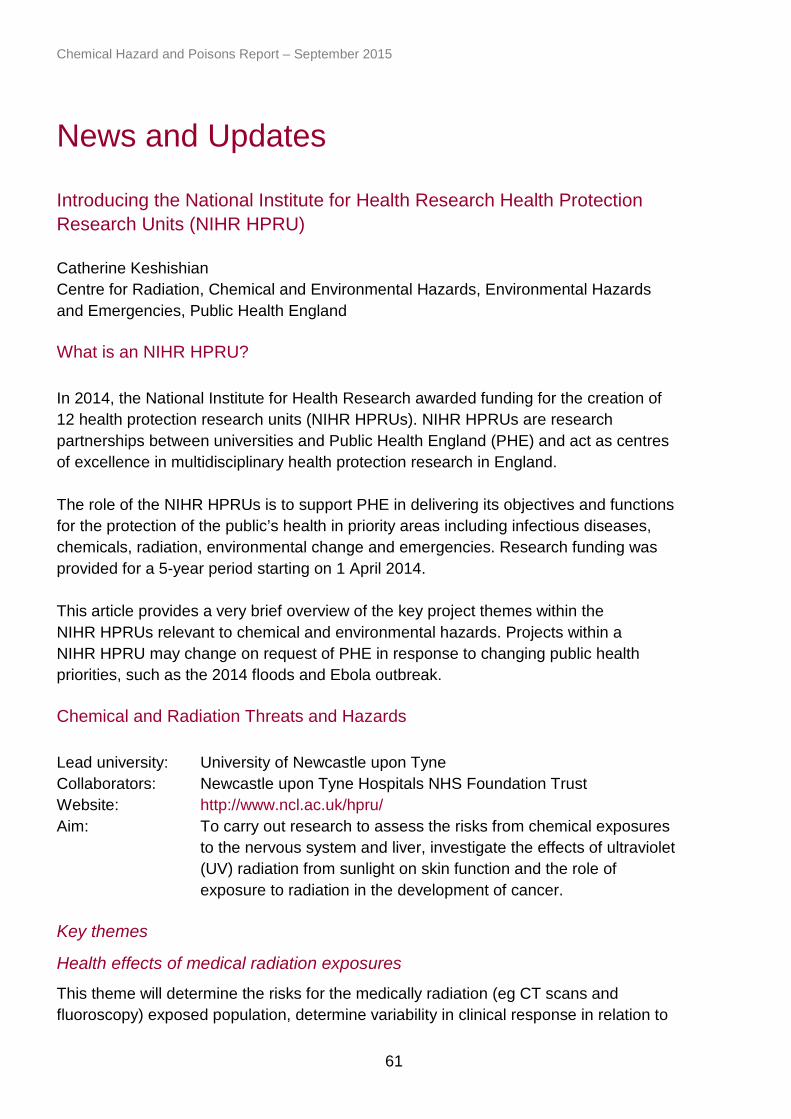
Chemical Hazard and Poisons Report – September 2015
61
News and Updates
Introducing the National Institute for Health Research Health Protection Research Units (NIHR HPRU)
Catherine Keshishian Centre for Radiation, Chemical and Environmental Hazards, Environmental Hazards and Emergencies, Public Health England What is an NIHR HPRU?
In 2014, the National Institute for Health Research awarded funding for the creation of 12 health protection research units (NIHR HPRUs). NIHR HPRUs are research partnerships between universities and Public Health England (PHE) and act as centres of excellence in multidisciplinary health protection research in England. The role of the NIHR HPRUs is to support PHE in delivering its objectives and functions for the protection of the public’s health in priority areas including infectious diseases, chemicals, radiation, environmental change and emergencies. Research funding was provided for a 5-year period starting on 1 April 2014. This article provides a very brief overview of the key project themes within the NIHR HPRUs relevant to chemical and environmental hazards. Projects within a NIHR HPRU may change on request of PHE in response to changing public health priorities, such as the 2014 floods and Ebola outbreak. Chemical and Radiation Threats and Hazards
Lead university: University of Newcastle upon Tyne Collaborators: Newcastle upon Tyne Hospitals NHS Foundation Trust Website: http://www.ncl.ac.uk/hpru/ Aim: To carry out research to assess the risks from chemical exposures
to the nervous system and liver, investigate the effects of ultraviolet (UV) radiation from sunlight on skin function and the role of exposure to radiation in the development of cancer.
Key themes
Health effects of medical radiation exposures
This theme will determine the risks for the medically radiation (eg CT scans and fluoroscopy) exposed population, determine variability in clinical response in relation to

Chemical Hazard and Poisons Report – September 2015
62
biomarkers and measures of exposure in patients, and identify in vitro variability in cellular responses and novel biomarkers of exposure. Skin and barrier function in radiation and chemical exposures
This theme will provide the research evidence to demonstrate the role of the skin as a barrier and the effects of UV radiation, sunscreen (including nanoparticles) and age. Chemical exposures and the development of primary biliary cirrhosis (PBC)
PBC is an autoimmune disease of the liver for which an environmental component is suggested. This theme will look at biomarkers of chemical exposure in PBC using cohort studies and in vitro screening, and use spatial mapping to determine disease clusters and whether they indicate chemical exposures. The theme will develop methodologies for investigating chemical exposures for a specific disorder and can be applied to other conditions. Acute and chronic chemical exposure and neurological and psychiatric disorders
This theme will investigate the possible link between chemical exposures and the development of chronic nervous system disorders. Projects will investigate severe intoxication from novel psychoactive substances (“legal highs”), the psychological effects of chemical exposure in individuals, exposure monitoring in neurodegenerative disease and biomarkers of exposure, and in vitro methods for the assessment of neurotoxicity. Emergency Preparedness and Response
Lead university: King’s College London Collaborators: University of Newcastle upon Tyne, University of East Anglia Website: http://epr.hpru.nihr.ac.uk/ Aim: To conduct multidisciplinary research that enhances PHE’s ability
to minimise the health impacts of emergencies. Key themes
Protecting wellbeing during and after a major incidents
This theme has numerous projects focused on reducing the psychological impact of major incidents, falling under two main topics. The first involves managing physical symptoms that are attributed by patients to either a hazardous exposure or emergency medical intervention, and projects will include major incident health registers, investigating mass psychogenic illness and reported side effects of people taking medicine during emergencies. The second strand in this theme explores how to protect the mental health of those involved in a major incident, in particular for workers.

Chemical Hazard and Poisons Report – September 2015
63
Improving the behavioural impact of communications
This theme focuses on two priorities. First, understanding the likely reactions, needs and appropriate communication strategies for groups who may be particularly vulnerable during an emergency. A second strand of work is considering how best to reduce the problem of widespread non-adherence to prophylactic medication during a crisis. Enhancing syndromic surveillance for early detection of incidents
This theme is expanding work to quantify the ability of existing syndromic surveillance systems to detect new outbreaks of disease or covert incidents involving a chemical, biological or radiological agent. Improving the evidence base for risk assessment and risk reduction
A series of in-depth systematic reviews of peer-reviewed, grey literature and unpublished case studies is being used to fill gaps in our understanding of the biology, epidemiology and public health threats posed by selected agents and scenarios, including use of modern statistical approaches and modelling. Improving the operational effectiveness of skin decontamination in exposure to toxic chemicals
This theme is developing the evidence-base for what constitutes effective decontamination. Projects within this theme include laboratory evaluation of existing and novel methods for decontamination in acute chemical emergencies and assessing the “delayed” absorption of chemicals. Biomarkers in detection and triage
Work in this theme is focused on the development of robust, rapid and reliable biomarkers that enable the identification of a chemical or radiation exposure and contribute to decisions about the management of casualties. Enhancing emergency preparedness through improved exercises and training
This theme will tackle the need to evaluate and develop the emergency response exercises run by PHE and other bodies. It aims to identify how best to help people learn from exercises. Environmental Change and Health
Lead university: London School of Hygiene and Tropical Medicine Collaborators: Exeter University, University College London Website: http://blogs.lshtm.ac.uk/hpru-ech/
Chemical Hazard and Poisons Report – September 2015
64
Aim: To provide high quality scientific evidence to support public health policies relating to climate change, land use change, and low carbon strategies.
Key themes
Climate resilience
Focusing on preventing adverse health effects of extreme weather events, projects cover impacts of heat and cold, flooding and public health measures to reduce the impacts of extreme weather and climate change. Healthy sustainable cities
This theme focuses on how the built environment, housing and urban planning affect our health. Projects include urban atmosphere modelling for temperature by mapping green infrastructure, linking syndromic surveillance data with high resolution air pollution maps, and the assessment of the health co-benefits of mitigation and adaptation strategies in the urban environment. Health and the natural environment
Focusing on the health effects of the natural environment, this theme covers climate change and infectious diseases, wellbeing associated with green space, and the mapping and analysis of pollen species and asthma outcomes. Health Impact of Environmental Hazards
Lead university: King’s College London Collaborators: Imperial College London Website: http://hieh.hpru.nihr.ac.uk/ Aim: To gain greater understanding of the mechanisms and impact of
exposure to exogenous environmental chemicals and the health risks to the human population.
Key themes
Epidemiological assessment of low level environmental exposures
Projects within this theme include surveillance of carbon monoxide poisoning, development of guidance for the investigation of non-infectious disease clusters and a rapid inquiry facility, and investigating health impacts from bioaerosols from waste composting facilities. Modes and mechanisms of toxicity
Projects within this theme include epigenetic effects of chemical exposure, fetal exposure to chemicals, developing toxicokinetic models that permit the evaluation of
Chemical Hazard and Poisons Report – September 2015
65
internal exposure, mechanisms of chemical effects in response to aeroallergens, analysis of fungal species in bioaerosols, aeroallergens and complex mixtures and their relation to health, investigating the genotoxic components of polluted air, and analytic approaches for the analysis of the human metabolome. Health impact of low dose non-ionising and ionising radiation
This theme aims to quantify the health risks and benefits associated with exposures to low level non-ionising and ionising radiation, including the effects of light, UV and radiofrequency exposures. Health effects of noise and air pollution including nanoparticles
Projects within this theme include optimising the assessment of the health impacts of air pollution, Neurocognitive and behavioural impacts of traffic derived pollutants in children, assessment of exposure to nanoparticle consumer products available, and understanding the potential health risk from nanoparticles. Cross-cutting NIHR HPRUs
Two further HPRUs are designed to be ‘cross-cutting’ and be of relevance to all NIHR HPRU research areas. The Evaluation of Interventions at University of Bristol (with University College London, Cambridge MRC Biostatistics Unit and University of the West of England) NIHR HPRU aims to be responsive, undertaking high quality applied research to support health protection intervention, methodological development and evaluation. Workstreams currently cover infectious diseases only, including vaccination, screening, prevention, behaviour and GP prescribing. Modelling Methodology at Imperial College London also mainly focuses on infectious diseases, looking at transmission networks, outbreak size and behaviour dynamics. Potentially relevant themes include investigating use of mobile phone data to estimate location and time of covert biological attacks, developing user-friendly online epidemiological analysis tools and providing training for non-modellers. Infectious disease NIHR HPRUs
A number of other NIHR HPRUs exist that focus only on infectious diseases: • Blood Borne and Sexually Transmitted Infections – University College London and
the London School of Hygiene and Tropical Medicine • Respiratory Infections – Imperial College London and Birmingham University.
http://www1.imperial.ac.uk/hprurespiratoryinfections/

Chemical Hazard and Poisons Report – September 2015
66
• Immunisation – London School of Hygiene and Tropical Medicine • Healthcare Associated Infections and Antimicrobial Resistance – Imperial College
London, Wellcome Sanger Institute, NWL Academic Health Science Network, Cambridge Veterinary School. http://hieh.hpru.nihr.ac.uk/
• Gastrointestinal Infections – University of Liverpool, University of East Anglia, University of Oxford, Institute of Food Research. http://www.herc.ox.ac.uk/research/disease-cost-studies-2/studies-28/health-protection-research-unit-in-gastrointestinal-infections-2
• Emerging and Zoonotic Infections – University of Liverpool, Liverpool School of Tropical Medicine. http://www.liv.ac.uk/infection-and-global-health/research/zoonotic-infections/hpruzoonotic/


![Chemical Hazards[2]](https://static.fdocuments.us/doc/165x107/55cf883f55034664618ee594/chemical-hazards2.jpg)