CHEMICAL ENG JOURNAL
9
Probing the role of thermally reduced graphene oxide in enhancing performance of TiO 2 in photocatalytic phenol removal from aqueous environments Haruna Adamu a , Prashant Dubey b , James A. Anderson a,c,⇑ a Surface Chemistry and Catalysis Group, Department of Chemistry, University of Aberdeen, AB24 3UE, UK b Centre of Material Sciences, Institute of Interdisciplinary Studies, University of Allahabad, Allahabad 211002, India c Materials and Chemical Engineering Group, School of Engineering, University of Aberdeen, AB24 3UE, UK highlights One-pot syntheses of titania graphene oxide (GO) and titania thermally reduced graphene oxide (TGO) composites. Enhanced photocatalytic behaviour of composites with respect to titania. Improved adsorption and reduced hole/electron recombination rates for composites. Reaction under nitrogen shows TGO to acts in electron transport and storage. graphical abstract article info Article history: Received 18 June 2015 Received in revised form 6 August 2015 Accepted 11 August 2015 Available online 9 September 2015 Keywords: Phenol Photodegradation Graphene oxide Thermally reduced graphene oxide Adsorption abstract A simple one-pot syntheses of TiO 2 -graphene oxide (GO)/thermally reduced graphene oxide (TGO) com- posites were performed with different concentrations of GO/TGO (0.25, 0.5 and 1.0 wt%). The materials were characterised by scanning electron microscopy, X-ray diffraction, Fourier transform infrared spec- troscopy, Raman spectroscopy, and nitrogen adsorption–desorption isotherms in order to evaluate struc- tural and physiochemical properties of synthesised materials. The TiO 2 -0.25% TGO exhibited the highest photocatalytic activity for phenol degradation in aqueous solution and this was attributed to optimal adsorption efficiency of phenol along with prolonged lifetime of electron–hole pairs. Photocatalytic activ- ity in the absence of dissolved oxygen (under nitrogen) was also performed and, in the case of TGO, con- firmed the role of graphene as an electron sink and transporter for suppression of electron–hole pair recombination. Ó 2015 Elsevier B.V. All rights reserved. 1. Introduction Following the work of Novoselov and Geim on graphene [1], this material has received great attention in the arena of nanotechnol- ogy and photocatalysis due to its outstanding properties, especially those which exploit its high electron mobility and chemical stabil- ity [2,3], and its high adsorption capacity for organic pollutant [4,5]. Therefore, in recent years, graphene has been embraced in the design of photocatalysts as a tool for enhancing their photocat- alytic performance. For example, many graphene-based semicon- ductor photocatalysts have been developed, evaluated and reported, the most common being graphene-coupled with CdS, TiO 2 and ZnO [6–8]. Results from these studies indicate that gra- phene is an excellent co-catalyst in enhancing photocatalytic http://dx.doi.org/10.1016/j.cej.2015.08.147 1385-8947/Ó 2015 Elsevier B.V. All rights reserved. ⇑ Corresponding author at: Surface Chemistry and Catalysis Group, Department of Chemistry, University of Aberdeen, AB24 3UE, UK. E-mail address: [email protected] (J.A. Anderson). Chemical Engineering Journal 284 (2016) 380–388 Contents lists available at ScienceDirect Chemical Engineering Journal journal homepage: www.elsevier.com/locate/cej
-
Upload
haruna-adamu -
Category
Documents
-
view
88 -
download
1
Transcript of CHEMICAL ENG JOURNAL

Chemical Engineering Journal 284 (2016) 380–388
Contents lists available at ScienceDirect
Chemical Engineering Journal
journal homepage: www.elsevier .com/locate /ce j
Probing the role of thermally reduced graphene oxide in enhancingperformance of TiO2 in photocatalytic phenol removal from aqueousenvironments
http://dx.doi.org/10.1016/j.cej.2015.08.1471385-8947/� 2015 Elsevier B.V. All rights reserved.
⇑ Corresponding author at: Surface Chemistry and Catalysis Group, Departmentof Chemistry, University of Aberdeen, AB24 3UE, UK.
E-mail address: [email protected] (J.A. Anderson).
Haruna Adamu a, Prashant Dubey b, James A. Anderson a,c,⇑a Surface Chemistry and Catalysis Group, Department of Chemistry, University of Aberdeen, AB24 3UE, UKbCentre of Material Sciences, Institute of Interdisciplinary Studies, University of Allahabad, Allahabad 211002, IndiacMaterials and Chemical Engineering Group, School of Engineering, University of Aberdeen, AB24 3UE, UK
h i g h l i g h t s
� One-pot syntheses of titania grapheneoxide (GO) and titania thermallyreduced graphene oxide (TGO)composites.
� Enhanced photocatalytic behaviour ofcomposites with respect to titania.
� Improved adsorption and reducedhole/electron recombination rates forcomposites.
� Reaction under nitrogen shows TGOto acts in electron transport andstorage.
g r a p h i c a l a b s t r a c t
a r t i c l e i n f o
Article history:Received 18 June 2015Received in revised form 6 August 2015Accepted 11 August 2015Available online 9 September 2015
Keywords:PhenolPhotodegradationGraphene oxideThermally reduced graphene oxideAdsorption
a b s t r a c t
A simple one-pot syntheses of TiO2-graphene oxide (GO)/thermally reduced graphene oxide (TGO) com-posites were performed with different concentrations of GO/TGO (0.25, 0.5 and 1.0 wt%). The materialswere characterised by scanning electron microscopy, X-ray diffraction, Fourier transform infrared spec-troscopy, Raman spectroscopy, and nitrogen adsorption–desorption isotherms in order to evaluate struc-tural and physiochemical properties of synthesised materials. The TiO2-0.25% TGO exhibited the highestphotocatalytic activity for phenol degradation in aqueous solution and this was attributed to optimaladsorption efficiency of phenol along with prolonged lifetime of electron–hole pairs. Photocatalytic activ-ity in the absence of dissolved oxygen (under nitrogen) was also performed and, in the case of TGO, con-firmed the role of graphene as an electron sink and transporter for suppression of electron–hole pairrecombination.
� 2015 Elsevier B.V. All rights reserved.
1. Introduction
Following the work of Novoselov and Geim on graphene [1], thismaterial has received great attention in the arena of nanotechnol-ogy and photocatalysis due to its outstanding properties, especially
those which exploit its high electron mobility and chemical stabil-ity [2,3], and its high adsorption capacity for organic pollutant[4,5]. Therefore, in recent years, graphene has been embraced inthe design of photocatalysts as a tool for enhancing their photocat-alytic performance. For example, many graphene-based semicon-ductor photocatalysts have been developed, evaluated andreported, the most common being graphene-coupled with CdS,TiO2 and ZnO [6–8]. Results from these studies indicate that gra-phene is an excellent co-catalyst in enhancing photocatalytic

H. Adamu et al. / Chemical Engineering Journal 284 (2016) 380–388 381
oxidation and reduction activity. For instance, many reports haveshown that integration of graphene into the matrix of semiconduc-tor can improve photocatalytic performance in the degradation oforganic pollutants [6–8]. Based on its excellent electron mobility,it is generally believed that graphene can quickly separate andtransfer photogenerated electrons and thus impede recombination[7,9]. Its high adsorption capacity is also deemed to provide advan-tages [4,5]. Phenols and their derivatives are important aqueouspollutants which result from their use as a key industrial feedstockfor manufacturing household cleaning commodities (such as disin-fectants, antiseptics and detergents), agricultural inputs (e.g., her-bicides) and numerous pharmaceutics into the waste streams,particularly surface-water bodies [10]. Consequently, phenol andits derivatives are often chosen as model pollutants in the evalua-tion of photocatalytic activity. Similarly, in this study, phenol waschosen to be the model aqueous organic pollutant for the evalua-tion of photocatalytic activity of the prepared composites.
Of all the most widely used graphene-based semiconductorphotocatalysts, innovative composite materials of TiO2-graphenehave emerged and are considered to be a viable and effectivemethod for complete mineralisation of organic pollutants in water[11,12]. Many studies have reported high photocatalytic perfor-mance of TiO2-graphene composites and attributed this to signifi-cant improvement of interfacial charge transfer, which is a vitalkey issue for photocatalytic activity [7,13]. It is suggested thatthe participation of graphene results in the reduction of photogen-erated electron–hole pairs recombination rate via its effectiveinterfacial charge transfer, which has been confirmed by a numberof experimental approaches including use of photovoltaicresponse, electrochemical impedance spectra, photoluminescence,laser pulse excitation and gaseous phase photocurrent [7,12–14].However, evidence of effective interfacial charge transfer by gra-phene through photocatalytic oxidative reaction in the absenceof molecular oxygen as an electron scavenger is limited. In thisstudy, the ability of graphene to accept and shuttle photogeneratedelectrons in the absence of electron scavenger is demonstrated andis implicated in reducing the rate of recombination of photogener-ated charge carriers that improved photodegradation of phenol.
A simple one-pot synthesis of TiO2-graphene oxide (GO)/ther-mally reduced graphene oxide (TGO) composite materials withvarying concentrations of GO/TGO is reported along with its photo-catalytic performance for the removal of phenol from aqueoussolutions. The ratio of GO/TGO within TiO2 matrix has been opti-mised for photocatalytic degradation of phenol. Photocatalyticoxidative reactions in the presence and absence (under nitrogen)of molecular oxygen were conducted in order to explore the rela-tionship between photocatalytic activity and the integration ofGO/TGO within TiO2 matrix.
2. Experimental
2.1. Materials
All chemicals were used as received without further purifica-tion. Phenol (C6H5OH) was used as model pollutant. Distilled andultra-pure deionised water (MilliQP 18.2 Mῼ-cm) were usedthroughout the study.
2.2. Synthesis of GO and TGO
GO was prepared from natural graphite (crystalline, 325 mesh,Alfa Aesar) by a modification to Hummer’s method [15]. The as-synthesised GO was used for the synthesis of TGO. In a typical syn-thesis of TGO, 100 mg of dried GO was measured into in a 250 mlbeaker. It was heated in a preheated muffle furnace at around
250 �C for 10 min. During the thermal reduction, the brown-tinted GO turned into fine-fluffy black powder and this obtainedpowder is denoted TGO.
2.3. Synthesis of TiO2-GO/TGO composite materials
In a typical synthetic method for TiO2-GO/TGO composite mate-rials, 7.4 ml of titanium tetraisopropoxide was added drop-wise to30 ml of aqueous 1 M HNO3. The resulting white precipitate wasagitated for 2 h with continuous stirring to obtain a clear solution.The desired amount of GO/TGO (0.25/0.5/1.0 wt%) was sonicated in20 ml of DI water for 30 min and added to the clear TiO2 solution.The resulting mixture was further sonicated for 30 min before add-ing 50 ml of DI water and agitated for another 1 h. The mixture pHwas adjusted to 3 by adding 1 M NaOH aqueous solution resultedin a turbid GO/TGO-TiO2 hybrid material in the form of a colloidwhich was then agitated for a further 1 h at room temperature.The colloidal composite material was collected by centrifugationfollowed by washing with DI water until the pH of the supernatantbecame neutral and the resulting solid was then dried overnight at80 �C. The as-synthesised composite materials were subjected toheat treatment at 300 �C under nitrogen for 1 h to encouragecrystal growth of TiO2 nanoparticles. Pure TiO2 nanoparticles wasalso synthesised under the same procedure but without additionof GO/TGO.
2.4. Characterisation
Field emission scanning electron microscopic (FESEM) imageswere obtained by using a SUPRA 40VP FESEM (Carl Zeiss NTS GmbH,Oberkochen) microscope under high-vacuum mode operated at10 kV. Samples were prepared by drop casting of ethanol suspen-sion of GO and TGO on to the conducting carbon substrate andevaporated to dryness. In addition to scanning electron microscopy(SEM), the morphology of the sample powder of the compositeswere observed by high resolution transmission electron micro-scopy (HRTEM, JEOL JEM-2000 EX).
Fourier transform infrared (FTIR) spectra were measured usinga Spectrum 2 PerkinElmer FTIR spectrometer using KBr discs.Raman spectra were acquired on a PerkinElmer Raman spectrom-eter (Raman Micro-200, 514.5 nm). To identify the crystalline phasecomposition of the samples, a powder X-ray diffraction (XRD) pat-terns were obtained on a Phillips X’Pert Pro X-ray diffractometer(PANalytical) with Cu Ka radiation (k = 0.15418 nm) and the oper-ational voltage and current were maintained at 40 kV and 40 mA,respectively. A scan rate of 5�/min was used to record the diffrac-tion patterns in the 2h range of 5–80�. The optical properties of thematerials were characterised in diffuse reflectance mode a usingUV–VIS spectrophotometer (Cary 60 UV–VIS), in which BaSO4
was used as the internal reference standard. To establish the bandgap of the materials, [F(a)hm]1/2 versus Ephoton for indirect transitionwas employed.
A Micromeritics Tristar-3000 was used for nitrogen adsorption–desorption isotherms on samples at �196 �C and in the pressurerange (P/P0) of 0.05–1.0. All samples were degassed at 200 �C for4 h prior to analysis. The specific surface area (SBET) of these mate-rials was determined using the multiple point Brunauer–Emmett–Teller (BET) procedure, whereas the pore volume and size distribu-tion profiles were obtained from Barrett–Joyner–Halender (BJH)method.
2.5. Adsorption tests
The adsorption tests were conducted to extract equilibrium iso-therms. Adsorption experiments were carried out by shaking0.25 g of TiO2-0.25 wt% GO/TGO composites and pure TiO2 in
382 H. Adamu et al. / Chemical Engineering Journal 284 (2016) 380–388
100 ml Pyrex bottles filled with 25 ml of phenol solution with con-centrations of 5, 10, 25, 50, and100 mg L�1 at a constant tempera-ture of 25 ± 0.1 �C in a thermostat water bath-cum-shaker for 24 h.The suspensions were then centrifuged, filtered with 0.45 lm syr-inge filter (Millipore) and then analysed to obtain the equilibriumconcentration of phenol using a UV–visible spectrophotometer(Lambda 25, PerkinElmer).
To determine the maximum adsorption uptake, the amount ofphenol adsorbed per unit mass of the materials used (mg g�1)was calculated from the following expression:
qe ¼ ðCi � CeÞ V=m ð1Þ
where qe is the amount adsorbed at equilibrium (mg g�1), Ci is theinitial concentration (mg L�1), Ce is the equilibrium concentration(mg L�1), V is the volume of the aqueous phase (L), and m is themass of photocatalyst used.
2.6. Photocatalytic tests
Photocatalytic reactions were carried out in a stirred, batchreactor fitted with a primary cooler (Fischer Scientific 3016S) tomaintain a constant reaction temperature of 25 ± 0.1 �C. A sec-ondary cooling system was also required to maintain constanttemperature due to the heat given out by the UV lamp (Heraeus400W 135V). Water was used as the coolant in this secondary cool-ing system by running a constant flow through a Pyrex coolerwhich encased the UV lamp. The temperature of the reactionswas monitored by digital thermometer inserted in the reaction pot.
To a total volume of 1.7 L phenol solution with concentration of50 mg L�1 in the reactor, 0.25 g of tested photocatalyst materialwas suspended. The suspension was magnetically stirred for 1 hin the dark in order to attain adsorption–desorption equilibriumbetween the phenol and solid. Immediately thereafter, samplewas withdrawn and considered as the initial concentration. Thelamp was then turned on and allowed to stabilise for 5 min beforethe first sample under illumination was taken. Subsequently, sam-pling of the solution was then carried out at 20 min intervals over a3 h period. Each 3 ml sample was filtered with a 0.45 lm syringefilter and the residual concentration of phenol in the filtered solu-tion was analysed by measuring the maximum absorbance of phe-nol at 210 nm using UV–visible spectrophotometer (Lambda 25,
Fig. 1. FESEM images of (a) GO, (b) TGO, (c)
PerkinElmer). The photocatalytic degradation of phenol in theabsence of molecular oxygen as electron scavenger was also con-ducted following the same procedure as above, but by replacingthe bubbled gas with nitrogen to remove dissolved oxygen.
3. Results and discussion
3.1. Characterisation of materials
Following an initial screening of samples of varying wt% of GOand TGO in the TiO2 matrix, 0.25 wt% in both cases was found tobe the most active in the photodegradation of phenol and there-fore, characterisation details are limited to those for this particularloading.
The FESEM micrographs of synthesised GO, TGO and their com-posites with 0.25% concentrations in TiO2 are presented in Fig. 1.From the micrographs, the layered structure for GO and TGO wasobserved, but TGO showed better layer separation than GO. Thethickness of the graphene layers was significantly reduced in thecase of TGO. Due to the typical wrinkled structure of TGO, it hasthe tendency to fold at the edge of the graphene sheets [7,15].The FESEM images of both composites (Fig. 1c and 1d) clearly showthe formation of TiO2 nanoparticles and the surface of GO and TGOare mostly covered by TiO2, confirming intimate contact betweenthe two components. Result from the HRTEM (Figs. S1 and S2)shows significant differences between the two composites. Thetitania aggregates were smaller in the case of TiO2-0.25% GO andthe graphene appeared to be relatively uniformly dispersed. Onthe other hand, TiO2-0.25% TGO showed larger aggregates of titaniaand the graphene appeared to be less well distributed over the tita-nia phase.
From results of the UV–Vis diffuse reflectance measurements,band gaps of 3.29, 3.08 and 3.03 eV were calculated for TiO2,TiO2-0.25% GO and TiO2-0.25% TGO, respectively. The reduced bandgaps for the composite materials with respect to pure titania sup-port the idea of significant interaction between components andalso should enhance light absorption properties of the sample withrespect to the lower frequency component of radiation applied.
Fig. 2a shows FTIR spectra of GO and TGO samples. Several char-acteristic peaks such as those at 1732 (C@O carboxyl or carbonylstretching vibration), 1404 (O–H deformations in the C–OH
TiO2-0.25% GO and (d) TiO2-0.25% TGO.

Fig. 2. FTIR (a) and Raman spectra (b) of GO and TGO.
Fig. 3. XRD patterns of GO, TGO, TiO2, TiO2-0.25% GO and TiO2-0.25% TGO.
H. Adamu et al. / Chemical Engineering Journal 284 (2016) 380–388 383
groups), 1224 (C–OH stretching vibration) and 1063 cm�1 (C–Ostretching vibrations in C–O–C of epoxy/ether) were observed forGO [16]. The broad peak centred at around 3412 cm�1 is assignedto adsorbed water or –OH groups linked to the graphene sheets.The peak at around 1623 cm�1 may be attributed to the deforma-tion mode of adsorbed water and non-oxidised graphitic domains.After thermal treatment of GO, the FTIR spectrum of TGO revealsalmost removal of the C@O band at around 1732 cm�1, which con-firms the successful removal of –COOH groups linked to GO [17].The presence of an intense peak at around 1076 cm�1 is assignedto epoxy groups still linked with TGO. It would appear that thermaltreatment of GO samples at 250 �C was effective in the reduction ofGO, as indicated by significant removal of –COOH groups and alsoby the exfoliation of GO.
Synthesised graphene materials were further characterised byRaman spectroscopy (Fig. 2b). Two typical peaks were observed,namely the D-band (disordered sp3 carbon atoms) and theG-band (graphitic sp2 carbon atoms) for GO and TGO, which arepeaks attributed to graphitic materials [18]. In the case of GO,the D- and G-band was found at �1332 and �1590 cm�1, respec-tively, while TGO showed corresponding features at �1356 and�1594 cm�1, respectively. The relative intensity of the disorderedD-band and crystalline G-band (ID/IG) that reflects order of defectswas lower for TGO (�0.7), than for GO (�1.1). This may be attrib-uted to removal of defect level in TGO during removal of –COOHgroups via thermal treatment as confirmed by FTIR [19]. In otherwords, TGO showed a decrease in ID/IG ratio compared to GO, sug-gesting an increase of the average size of the in-plane sp2 domainsof carbon atoms in TGO, resulting from removal of oxygencontaining groups. Therefore, it can be inferred that TiO2-0.25 wt% TGO contained more sp2 domains of carbon atoms thanTiO2-0.25 wt% GO.
The XRD patterns of synthesised GO, TGO, TiO2, and the com-posites TiO2-GO/TGO (0.25 wt% compositions) are presented inFig. 3. The XRD pattern of GO shows one major intense peak at2h = 11.8�, which corresponds to a d-spacing of 0.75 nm. This valueis much larger than the d-spacing of natural graphite (0.335 nm),and is attributed to effective oxidation of graphite to form GO[20]. After thermal treatment of GO to form TGO, this characteristicpeak of GO completely disappeared and a new peak at 2h = 26.0� ispresent which corresponds to a d-spacing of 0.34 nm, which char-acterises the thermal reduction of GO to TGO [21]. The diffrac-togram of pure TiO2 synthesised by sol–gel method, which showsgood crystallinity, and peaks at 2h = 25.3�, 37.9�, 48.0�, 54.4�,62.8�, 69.4� and 75.1� which are ascribed to reflections from(101), (004), (200), (211), (204), (220), and (215) planes of ana-tase phase of TiO2, respectively [22,23]. The diffraction patterns ofthe as-prepared composites are similar to that of pure TiO2. TheFWHM of the most intense peak for all of the materials(2t � 25.4�) allowed calculation of an approximate crystallite size
of 7.3, 9.6 and 13.8 nm for pure TiO2, TiO2-0.25% GO andTiO2-0.25% TGO, respectively. The larger crystallite dimensionsfor the latter are consistent with data form the TEM micrographs(Figs. S1 and S2). Separate diffraction features due to GO andTGO were not observed in the synthesised composites, whichmay be due to their low content and consequently low diffractionintensities [7,22].
In order to determine the specific surface area, pore volume andsize distribution of synthesised composites along with pure TiO2,GO and TGO, nitrogen adsorption–desorption measurements werecarried out (Fig. 4a). The isotherms are of type IV according to theIUPAC classifications, as they show open, large hysteresis loops[24] which are indication of mesoporous materials [25]. The iso-therms show comparatively more open hysteresis loop for bothcomposites than pure TiO2, which may be attributed to the opennature of the hysteresis loops for GO and TGO (inset of Fig. 4a)and resulted in the presence of large pores in the composites(Table 1). However, integration of GO and TGO into the TiO2
resulted in a decrease in surface area and porosity enhancementcompared to pure TiO2 (Table 1). The decrease in surface area issignificantly greater in the TGO composite compared to GO com-posite. This may have occurred due to higher penetration of TiO2
particles into exfoliated 2D graphene sheets of TGO than GO (beingthinner than GO as confirmed by FESEM) and thus, more of anagglomeration effect was found in the case of TiO2-0.25 wt% TGOcomposite [26]. The relatively greater loss in surface area for TGOafter incorporation into the titania is consistent with the largerestimated crystallite size of the titania measured by XRD for thissample and the large aggregate size for this sample in TEM(Figs. S1 and S2). Due to the incorporation of small amounts of

Fig. 4. (a) Nitrogen adsorption–desorption isotherms and (b) pore size distributionsof pure TiO2, TiO2-0.25% GO and TiO2-0.25% TGO composites. Inset of (a) representsthe isotherms and inset of (b) shows corresponding plots of the pore sizedistributions of GO and TGO.
384 H. Adamu et al. / Chemical Engineering Journal 284 (2016) 380–388
GO/TGO into TiO2, the synthesised composites show characteristicswhich are more akin to the surface properties of TiO2 [27]. Thespecific surface area and pore size distributions of all samples aresummarised in Table 1.
The pore size distributions lie within the range of 2–20 nm(Fig. 4b) reflecting the mesoporous nature of all materials (Table 1).The pore size of the prepared composites was found to be evengreater than that of pure TiO2, which could be an advantage inrespect to the photocatalytic reaction processes involving the com-posites where larger molecules are involved [26]. After the combi-nation of TiO2 with GO and TGO, the pore size distributionbroadened significantly, even though the GO and TGO show a
Table 1Samples characteristics based on the adsorption of nitrogen (�196 �C) and
Samples SBET (m2 g�1) Pore size (nm)
TiO2 224 3.1GO 28 4.9TGO 371 17.6TiO2-0.25 wt% GO 217 3.9TiO2-0.25 wt% TGO 180 4.2
a Langmuir constant from phenol adsorption.
narrow range of pore size distribution (inset of Fig. 4b) and thus,confirm the hybrid surface structure of the composites. Conse-quently, the pore size distribution of both composites comprisesa small amount of micropores and the majority as mesopores(Fig. 4b). The result of the pore size distribution and pore volumepattern obtained, particularly the TiO2-0.25 wt% TGO, are similarto those reported by other researchers [22,28].
3.2. Adsorption isotherms of phenol
Adsorption isotherms were measured to understand the inter-action of phenol with the surface of pure TiO2 and prepared com-posites. The rates of photodegradation of pollutants may dependon the affinity and surface coverage of the reactants on the photo-catalyst surface and therefore, combining GO and TGO with TiO2
could result in improved interaction and proximity of phenol withthe active centres of TiO2, potentially enhancing degradation rates[29].
Phenol uptake as a function of equilibrium concentration onpure TiO2, TiO2-0.25 wt% GO and TiO2-0.25 wt% TGO are presentedin Fig. 5a. As expected, the amount adsorbed increased withincreased phenol solution concentration and then reached a max-imum consistent with attainment of a monolayer. On a per massbasis, adsorption capacity increased in the sequence pure TiO2 fol-lowed by TiO2-0.25 wt% GO and with TiO2-0.25 wt% TGO adsorbingthe highest amount. This trend in adsorption capacity is not a func-tion of surface area and thus is likely to be related to the surfacefunctionality (Table 1). The high adsorptivity shown towards phe-nol by TiO2-0.25 wt% TGO may be attributed to selective adsorp-tion of the phenol on the composite photocatalyst, resulting fromp–p interaction between the aromatic rings of phenol and the gra-phene planes. Additionally, as confirmed by FTIR (Fig. 2a) the pres-ence of remnant epoxides in TGO, could lead to the formation ofhydrogen bonds with the hydroxyl groups of phenol. Conse-quently, these two types of TiO2-0.25 wt% TGO-phenol interactionscould account for the higher adsorption of phenol shown by thecomposite compared to the other materials. This has beenobserved by other researchers [5]. The high level of carboxylatefunctional groups on TiO2-0.25 wt% GO compared withTiO2-0.25 wt% TGOmay have explain the higher capacity of the lat-ter if it is assumed that these groups inhibit the otherwise favour-able p–p interaction between the aromatic rings of phenol and thegraphene planes.
Although the surface areas of TiO2 and TiO2-0.25 wt% GO weresimilar (224 and 217 m2 g�1, respectively), TiO2-0.25 wt% GOadsorbed twice as much phenol as pure TiO2 (Table 1). This maybe attributed to the phenol interactions with the composite viahydrogen bonds formation between the hydroxyl groups of phenoland oxygen-containing groups of GO. Furthermore, it was alsoreported that GO is capable of interacting with aromatic com-pounds through p–p conjugation [30] and this may also have con-tributed to the enhanced adsorption of phenol by TiO2-0.25 wt%GO compared with pure TiO2. However, based on the wide varia-tion in the respective adsorption capacity of the two composites,
phenol (25 �C).
Pore volume (cm3 g�1) Phenol Uptake(qe) (mg/g)
aKL (L mg�1)
0.29 4.08 � 10�1 7.64 � 10�2
0.131.560.33 9.67 � 10�1 1.54 � 10�1
0.27 20.9 � 10�1 2.27 � 10�1

Fig. 5. (a) Adsorption isotherms of phenol on pure TiO2, TiO2-0.25% GO and TiO2-0.25% TGO based on equilibrium concentrations, (b) data fits to the Langmuir expression.
H. Adamu et al. / Chemical Engineering Journal 284 (2016) 380–388 385
one could infer that the extent of phenol adsorption on theTiO2-0.25 wt% GO was governed by hydrogen bonding. Thisassumption is based on the reasoning that, even though remnantsof graphitic sp2 domain exists in the body of GO (Fig. 2b), the abun-dance of oxygen-containing functional groups in its basal planeand at the plane edges can restrain delocalisation of p-electronsor likely to restrict p–p conjugation of the sp2 domain and in effect,the possible p–p stacking between the GO sheets and phenol aro-matic rings could be relatively restrained and therefore has littleeffect on the adsorption of phenol. It has been reported that thecarbon atoms in GO are of sp3 hybridisation and connected to oxy-gen [31]. In a similar assertion, GO can only interact via p–p stack-ing on sp2 networks (if present) that are not oxidised or engaged inhydrogen bonding between –OH and –CO2H functionalities of theGO [32]. Overall, the loss of the peak at 2h = 26.4� that charac-terises the (002) plane of graphite in the diffractogram of GO indi-cates that graphite was completely oxidised to GO. This furtherimplies dominance of sp3 carbon atoms in GO after oxidation.Hence, adsorption of phenol by TiO2-0.25 wt% GO may be mainlythrough hydrogen bonding and augmented due to availability ofother surface sites.
Langmuir and Frendlich isotherm models were used in order todescribe the adsorption behaviour of the materials. The adsorptiondata of phenol was best fitted to the Langmuir model with a corre-lation coefficient (r2 > 0.99) compared to r2 < 0.85 with Frendlich.Equilibrium data of adsorption of phenol using the Langmuir equa-tion, are presented in Fig. 5b for pure TiO2, TiO2-0.25 wt% GO andTiO2-0.25 wt% TGO. A linearised Langmuir model was employed(Eq. (2)):
Ce=qe ¼ ð1=KLqmÞ þ ð1=qmÞCe ð2Þ
Fig. 6. Photocatalytic degradation of phenol under UV light irradiation of (a) for variouphotolysis.
where qe is the amount of phenol adsorbed at equilibrium (mg/g);Ce is the equilibrium concentration of phenol (mg/L); KL (L/mg)and qm (mg/g) are the Langmuir constant and maximum adsorptioncapacity. The constant KL was determined from the intercept andslope of the linear plot fitted to the experimental data of Ce/qe vs Ce.
The experimental adsorption capacity (qe) for each of the mate-rials and derived Langmuir constants are summarised in Table 1.The phenol uptake by TiO2-0.25 wt% TGO is 5 and 2 times higherthan that of the TiO2 and TiO2-0.25 wt% GO, respectively. The Lang-muir adsorption coefficient, KL, for TiO2-0.25 wt% TGO was thehighest, suggesting greater affinity for phenol than the other mate-rials despite the larger surface areas. These values are consistentwith the proposal that two kinds of adsorbate–adsorbent interac-tions could be responsible for the higher adsorption of phenol onTiO2-0.25 wt% TGO. However, the amounts of phenol adsorbedwas significantly improved after the integration of GO and TGOinto the TiO2 matrix regardless of the decrease in surface area(Table 1), which suggests that the adsorption of phenol by thecomposites were not only a function of surface area. This is in con-sistent with other reports that GO and/or reduced graphene oxideused as co-adsorbents in composites resulted in enhancement inthe adsorption of aqueous organic pollutants [30].
3.3. Photocatalytic performance evaluation
Photocatalytic tests using phenol as a model under UV light illu-mination were measured, and the results are summarised inFig. 6a and b for TiO2-GO and TiO2-TGO composites, respectively.The photocatalytic behaviour of pure TiO2 under the same condi-tions was also compared. Photolysis reaction was also investigated
s compositions of TiO2-GO and (b) TiO2-TGO composites along with pure TiO2 and
386 H. Adamu et al. / Chemical Engineering Journal 284 (2016) 380–388
and the results indicates that the concentration of phenol changedonly slightly (ca. 11%) after 3 h exposure. In contrast, 62% pho-todegradation of phenol was achieved in the presence of pureTiO2. Photodegradation of phenol was considerably improved byaddition of GO and TGO and photocatalytic efficiency was max-imised in both cases using 0.25 wt% loadings (Fig. 6a and b). 81%and 96% of phenol degradation after 3 h exposure was achievedwith TiO2-0.25 wt% GO and TiO2-0.25 wt% TGO, respectively. How-ever, photocatalytic performance was progressively worsened forhigher concentrations of both GO and TGO in TiO2-matrix. Thismay be due to blockage of the light harvesting centres of TiO2 thatwere disadvantageously occupied by GO and TGO with theiragglomerative nature at higher concentrations in their respectivecomposites and thus, prevented UV light due to shielding or scat-tering effects to reach the surface of TiO2 where the photocatalyticreaction takes place [28,33].
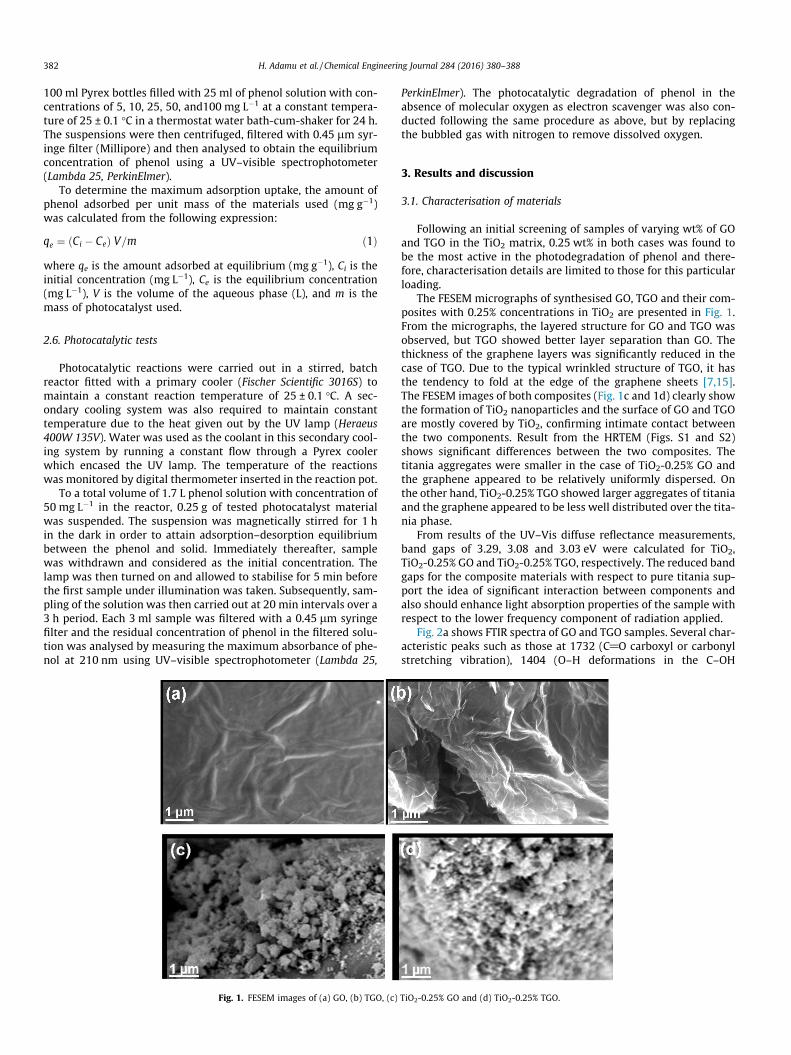
Under the conditions employed, TiO2-0.25 wt% TGO was by farthe best photocatalyst, and almost completely removed phenol(Fig. 6b). No initial induction period was observed for this sampleunlike the case of pure TiO2 and TiO2-0.25 wt% GO (Fig. 7a and b).This effect which gave the impression of increased solution con-centration remained significant up to 40 and 20 min after UV illu-mination was initiated during photodegradation of phenol withpure TiO2 and TiO2-0.25 wt% GO, respectively. As this phenomenonwas not observed in the case of TiO2-0.25 wt% TGO, it suggestsproperties specific to the other two samples were responsible.The apparent concentration increase was previously observedand attributed to desorption of phenoxyl radicals from the surfaceof photocatalyst and partially stabilised in solution due to freeelectron delocalisation within the aromatic ring [34]. In addition,it was also observed that shortly after the UV light initiation, a pinkcolour appeared in the reaction solution, which remained muchlonger before fading during the photodegradation process withpure TiO2 than TiO2-0.25 wt% GO but was very short forTiO2-0.25 wt% TGO. The pink colour was due to a mixture ofcatechol and hydroquinone in aqueous solution [35]. Even thoughpeaks attributed to aromatic intermediates and ring cleavage as aresult of phenol degradation have been reported [36,37], in thepresent case, no obvious maxima which could be assigned to suchphenol degradation products were detected in the UV–visibleabsorption spectra (Fig. 7a–c). As such, it can be inferred that themixture of the said intermediates produced were not easilydegraded by pure TiO2 and TiO2-0.25 wt% GO, while with TiO2-0.25 wt% TGO the intermediates were degraded rapidly, againhighlighting advantages of the TiO2-0.25 wt% TGO material.
It has been established that the introduction of GO and TGO intothe TiO2 matrix is responsible for improved photocatalytic activity.The observed enhancement can be attributed to the increasedadsorptive properties. The phenol was adsorbed on the GO andTGO surfaces with different orientation until adsorption–desorp-tion equilibriumwas attained. Under UV light, the adsorption equi-
Fig. 7. UV–visible absorbance spectra of phenol during photocatalytic degradation as
librium was disrupted because of the decomposition of theadsorbed phenol by the photogenerated carriers, which facilitatedrapid transfer of more phenol from solution to the interface andsuccessively decomposed via redox reactions. A similar case maybe made for the reaction intermediates. Therefore, enhancedadsorption and photocatalytic reaction was achieved in a singleprocess and led to improvement in photodegradation of phenol.This process, perhaps, accelerated by the transfer of photogener-ated carriers to the nearby adsorbed phenol, consequently retardedcharge recombination and leaving hole/electron pairs to partici-pate in redox reactions that led to higher photocatalytic activitycompared to pure TiO2. However, the observed improvement inthe photodegradation of phenol by the composites, particularlythe TiO2-0.25 wt% TGO, may be influenced by other characteristicsbeyond adsorption. This is due to the ability of graphene to acceptelectrons due to its 2D structure composed of p-conjugation [7,9].Therefore, in the case of TiO2-0.25 wt% TGO, there could be a trans-fer of photogenerated electrons from the TiO2 conduction band toTGO and can be stored in the abundant p–p domain within thecomposite, which could result in an effective interface charge sep-aration and suppress h+/e� recombination. The process of mitigat-ing electron–hole recombination could follow the samemechanism in TiO2-0.25 wt% GO, however, due to greater defectabundance, it has less possibility of delocalisation of electrons,and consequently exhibits lower photocatalytic activity.
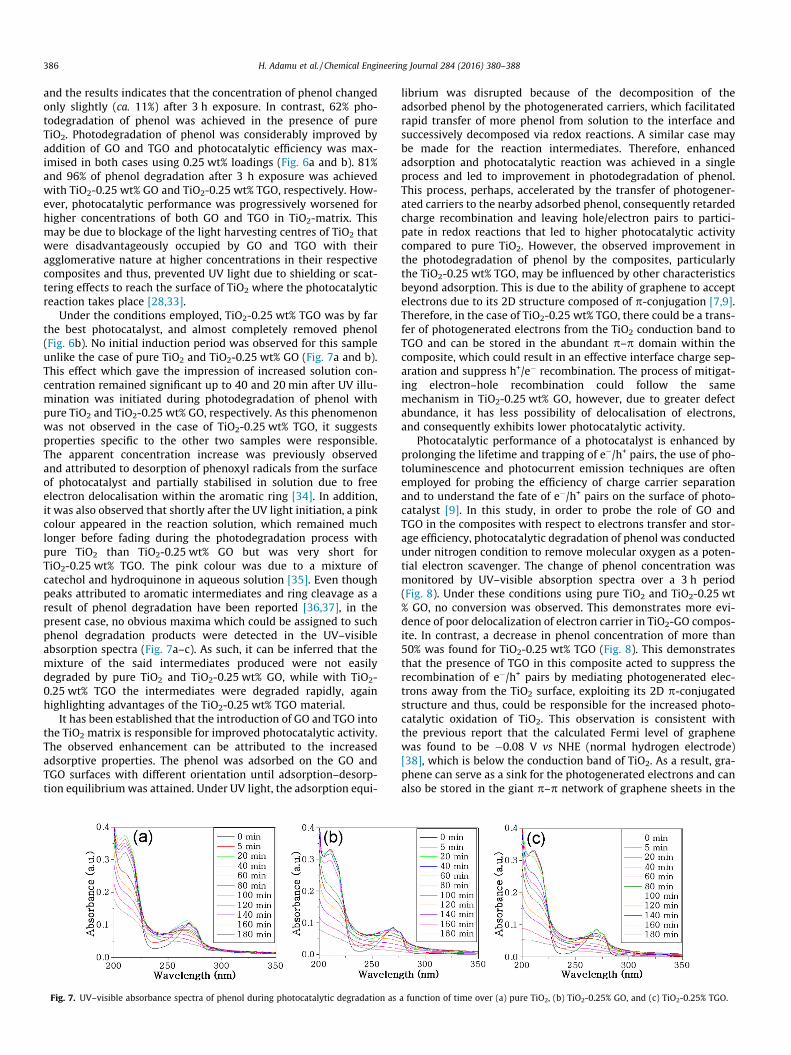
Photocatalytic performance of a photocatalyst is enhanced byprolonging the lifetime and trapping of e�/h+ pairs, the use of pho-toluminescence and photocurrent emission techniques are oftenemployed for probing the efficiency of charge carrier separationand to understand the fate of e�/h+ pairs on the surface of photo-catalyst [9]. In this study, in order to probe the role of GO andTGO in the composites with respect to electrons transfer and stor-age efficiency, photocatalytic degradation of phenol was conductedunder nitrogen condition to remove molecular oxygen as a poten-tial electron scavenger. The change of phenol concentration wasmonitored by UV–visible absorption spectra over a 3 h period(Fig. 8). Under these conditions using pure TiO2 and TiO2-0.25 wt% GO, no conversion was observed. This demonstrates more evi-dence of poor delocalization of electron carrier in TiO2-GO compos-ite. In contrast, a decrease in phenol concentration of more than50% was found for TiO2-0.25 wt% TGO (Fig. 8). This demonstratesthat the presence of TGO in this composite acted to suppress therecombination of e�/h+ pairs by mediating photogenerated elec-trons away from the TiO2 surface, exploiting its 2D p-conjugatedstructure and thus, could be responsible for the increased photo-catalytic oxidation of TiO2. This observation is consistent withthe previous report that the calculated Fermi level of graphenewas found to be �0.08 V vs NHE (normal hydrogen electrode)[38], which is below the conduction band of TiO2. As a result, gra-phene can serve as a sink for the photogenerated electrons and canalso be stored in the giant p–p network of graphene sheets in the
a function of time over (a) pure TiO2, (b) TiO2-0.25% GO, and (c) TiO2-0.25% TGO.
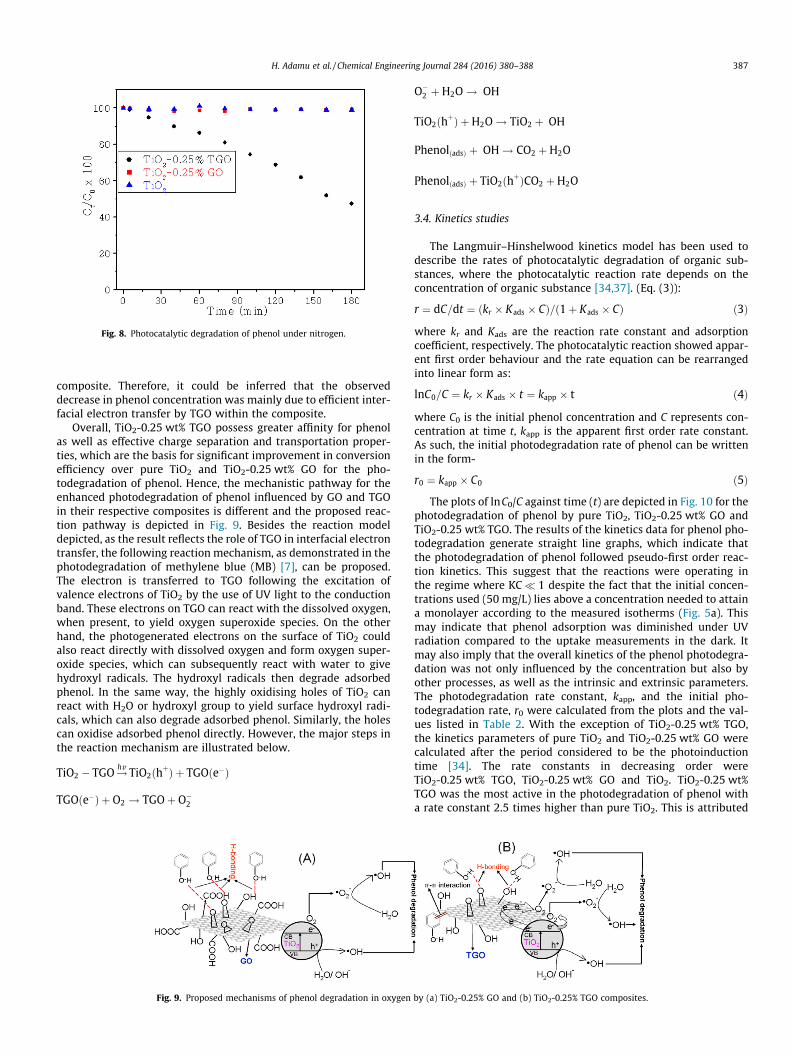
Fig. 8. Photocatalytic degradation of phenol under nitrogen.
H. Adamu et al. / Chemical Engineering Journal 284 (2016) 380–388 387
composite. Therefore, it could be inferred that the observeddecrease in phenol concentration was mainly due to efficient inter-facial electron transfer by TGO within the composite.
Overall, TiO2-0.25 wt% TGO possess greater affinity for phenolas well as effective charge separation and transportation proper-ties, which are the basis for significant improvement in conversionefficiency over pure TiO2 and TiO2-0.25 wt% GO for the pho-todegradation of phenol. Hence, the mechanistic pathway for theenhanced photodegradation of phenol influenced by GO and TGOin their respective composites is different and the proposed reac-tion pathway is depicted in Fig. 9. Besides the reaction modeldepicted, as the result reflects the role of TGO in interfacial electrontransfer, the following reaction mechanism, as demonstrated in thephotodegradation of methylene blue (MB) [7], can be proposed.The electron is transferred to TGO following the excitation ofvalence electrons of TiO2 by the use of UV light to the conductionband. These electrons on TGO can react with the dissolved oxygen,when present, to yield oxygen superoxide species. On the otherhand, the photogenerated electrons on the surface of TiO2 couldalso react directly with dissolved oxygen and form oxygen super-oxide species, which can subsequently react with water to givehydroxyl radicals. The hydroxyl radicals then degrade adsorbedphenol. In the same way, the highly oxidising holes of TiO2 canreact with H2O or hydroxyl group to yield surface hydroxyl radi-cals, which can also degrade adsorbed phenol. Similarly, the holescan oxidise adsorbed phenol directly. However, the major steps inthe reaction mechanism are illustrated below.
TiO2 � TGO!hv TiO2ðhþÞ þ TGOðe�Þ
TGOðe�Þ þ O2 ! TGOþ O�2
Fig. 9. Proposed mechanisms of phenol degradation in oxygen
O�2 þH2O ! �OH
TiO2ðhþÞ þH2O ! TiO2 þ �OH
PhenolðadsÞ þ �OH ! CO2 þH2O
PhenolðadsÞ þ TiO2ðhþÞCO2 þH2O
3.4. Kinetics studies
The Langmuir–Hinshelwood kinetics model has been used todescribe the rates of photocatalytic degradation of organic sub-stances, where the photocatalytic reaction rate depends on theconcentration of organic substance [34,37]. (Eq. (3)):
r ¼ dC=dt ¼ ðkr � Kads � CÞ=ð1þ Kads � CÞ ð3Þwhere kr and Kads are the reaction rate constant and adsorptioncoefficient, respectively. The photocatalytic reaction showed appar-ent first order behaviour and the rate equation can be rearrangedinto linear form as:
lnC0=C ¼ kr � Kads � t ¼ kapp � t ð4Þwhere C0 is the initial phenol concentration and C represents con-centration at time t, kapp is the apparent first order rate constant.As such, the initial photodegradation rate of phenol can be writtenin the form-
r0 ¼ kapp � C0 ð5ÞThe plots of lnC0/C against time (t) are depicted in Fig. 10 for the
photodegradation of phenol by pure TiO2, TiO2-0.25 wt% GO andTiO2-0.25 wt% TGO. The results of the kinetics data for phenol pho-todegradation generate straight line graphs, which indicate thatthe photodegradation of phenol followed pseudo-first order reac-tion kinetics. This suggest that the reactions were operating inthe regime where KC� 1 despite the fact that the initial concen-trations used (50 mg/L) lies above a concentration needed to attaina monolayer according to the measured isotherms (Fig. 5a). Thismay indicate that phenol adsorption was diminished under UVradiation compared to the uptake measurements in the dark. Itmay also imply that the overall kinetics of the phenol photodegra-dation was not only influenced by the concentration but also byother processes, as well as the intrinsic and extrinsic parameters.The photodegradation rate constant, kapp, and the initial pho-todegradation rate, r0 were calculated from the plots and the val-ues listed in Table 2. With the exception of TiO2-0.25 wt% TGO,the kinetics parameters of pure TiO2 and TiO2-0.25 wt% GO werecalculated after the period considered to be the photoinductiontime [34]. The rate constants in decreasing order wereTiO2-0.25 wt% TGO, TiO2-0.25 wt% GO and TiO2. TiO2-0.25 wt%TGO was the most active in the photodegradation of phenol witha rate constant 2.5 times higher than pure TiO2. This is attributed
by (a) TiO2-0.25% GO and (b) TiO2-0.25% TGO composites.

Fig. 10. Linearised apparent first order kinetics of photocatalytic degradation ofphenol by pure TiO2, TiO2-0.25% GO and TiO2-0.25% TGO.
Table 2Apparent rate constants and rates for the photodegradation of phenol.
Materials kapp (min�1) r0 (mg min�1)
Pure TiO2 0.0062 0.5501TiO2-0.25% GO 0.0109 0.9469TiO2-0.25% TGO 0.0154 1.4452
388 H. Adamu et al. / Chemical Engineering Journal 284 (2016) 380–388
to its distinctive surface properties such as electronic conductionand high adsorptivity. The enhancement of photocatalytic perfor-mance was not as significant following addition of GO to TiO2 asit was by adding TGO.
4. Conclusion
TiO2-GO and TiO2-TGO composites were synthesised by a sim-ple one-pot integration method. TiO2 particles are present in theanatase phase in both composites. TiO2-TGO exhibited goodphotocatalytic activity towards the removal and mineralisation ofphenol. However, photocatalytic activity declined with increasingloadings of both GO and TGO in the composites, which may beattributed to agglomerative or light scattering at high concentra-tions. The best performance was observed with 0.25 wt% loadingswhich of GO and TGO, resulted in 81 and 96% phenol degradation,respectively, after 3 h under UV illumination and which were bothenhanced performances with respect to pure TiO2. The photo-oxidative degradations of phenol under the conditions employedfollowed pseudo first order kinetics, with TiO2-0.25 wt% TGOshowing a rate constant 2.5 times higher than that of pure TiO2.The enhanced photocatalytic activity observed in TiO2-0.25 wt%TGO can be explained by hybridised adsorption-carrier charge sep-aration cooperation, These findings may be of significance not onlyin environmental catalysis, but also in other applications thatrequires electrons storage and shuttling in graphene-basedmaterials.
Acknowledgements
We thank the INSA-RSE bilateral exchange programme forfinancial assistance (PD) and the Petroleum Technology Develop-ment Fund (PTDF, Nigeria) for the award of PhD scholarship, aswell as Abubakar Tafawa Balewa University, Bauchi-Nigeria forthe granted fellowship (H.A.).
Appendix A. Supplementary data
Supplementary data associated with this article can be found, inthe online version, at http://dx.doi.org/10.1016/j.cej.2015.08.147.
References
[1] A.K. Geim, K.S. Novoselov, Nat. Mater. 6 (2007) 183.[2] A.K. Geim, Science 324 (2009) 1530.[3] M.J. Allen, V.C. Tung, R.B. Kaner, Chem. Rev. 110 (2010) 132.[4] Y. Yang, Y. Xie, L. Pang, M. Li, X. Song, J. Wen, H. Zhao, Langmuir 29 (2013)
10727.[5] J. Xu, L. Wang, Y. Zhu, Langmuir 28 (2012) 8418.[6] N. Jiang, Z. Xiu, Z. Xie, H. Li, G. Zhao, W. Wang, Y. Wu, X. Hao, New J. Chem. 38
(2014) 4312.[7] H. Zhang, X. Lv, Y. Li, Y. Wang, J. Li, ACS Nano 4 (2010) 380.[8] Z. Chen, N. Zhang, Y.-J. Xu, CrystEngComm 15 (2013) 3022.[9] Q. Huang, Shouqin Tian, Dawen Zeng, Xiaoxia Wang, Wulin Song, Yingying Li,
Wei Xiao, Changsheng Xie, ACS Catal. 3 (2013) 1477.[10] R.L. Autenrieth, J.S. Bonner, A. Akgerman, M. Okaygun, E.M. McCreary, J.
Hazard. Mater. 28 (1991) 29.[11] N. Zhang, Y. Zhang, Y.-J. Xu, Nanoscale 4 (2012) 5792.[12] D. Zhao, G. Sheng, C. Chen, X. Wang, Appl. Catal. B 111–112 (2012) 303.[13] H.-L. Kim, Gun-hee Moon, Damián Monllor-Satoca, Yiseul Park, Wonyong Choi,
J. Phys. Chem. C 116 (2012) 1535.[14] P. Wang, J. Wang, T. Ming, X. Wang, H. Yu, J. Yu, Y. Wang, M. Lei, ACS Appl.
Mater. Interfaces 5 (2013) 2924.[15] L.J. Cote, F. Kim, J. Huang, J. Am. Chem. Soc. 131 (2009) 1043.[16] V. Loryuenyong, K. Totepvimarn, P. Eimburanapravat, W. Boonchompoo, A.
Buasri, Adv. Mater. Sci. Eng. 2013 (2013).[17] M. Naebe, J. Wang, A. Amini, H. Khayyam, N. Hameed, L.H. Li, Y. Chen, B. Fox,
Sci. Reports 4 (2014).[18] R. Rao, R. Podila, R. Tsuchikawa, J. Katoch, D. Tishler, A.M. Rao, M. Ishigami, ACS
Nano 5 (2011) 1594.[19] K.S. Subrahmanyam, S.R.C. Vivekchand, A. Govindaraj, C.N.R. Rao, J. Mater.
Chem. 18 (2008) 1517.[20] E. Gao, W. Wang, M. Shang, J. Xu, Phys. Chem. Chem. Phys. 13 (2011) 2887.[21] B. Li, H. Cao, J. Yin, Y.A. Wu, J.H. Warner, J. Mater. Chem. 22 (2012) 1876.[22] M.S.A. Sher Shah, A.R. Park, K. Zhang, J.H. Park, P.J. Yoo, ACS Appl. Mater.
Interfaces 4 (2012) 3893.[23] L.-L. Tan, W.-J. Ong, S.-P. Chai, A.R. Mohamed, Nanoscale Res. Lett. 8 (2013).[24] K.S.W. Sing, Pure Appl. Chem. 54 (1982) 2201–2218.[25] M. Baek, J. Yoon, J. Hong, J. Suh, Appl. Catal. A 450 (2013) 222.[26] Y. Zhang, Z. Zhou, T. Chen, H. Wang, W. Lu, J. Environ. Sci. 26 (2014) 2114.[27] M.-Q. Yang, N. Zhang, Y.-J. Xu, ACS Appl. Mater. Interfaces 5 (2013) 1156.[28] B. Gao, P.S. Yap, T.M. Lim, T. Lim, Chem. Eng. J. 171 (2011) 1098.[29] J. Choi, H. Lee, Y. Choi, S. Kim, S. Lee, S. Lee, W. Choi, J. Lee, Appl. Catal. B 147
(2014) 8.[30] Y. Chen, L. Chen, H. Bai, L. Li, J. Mater. Chem. A 1 (2013) 1992.[31] W. Gao, L.B. Alemany, L. Ci, P.M. Ajayan, Nat. Chem. 1 (2009) 403.[32] D.R. Dreyer, S. Park, C.W. Bielawski, R.S. Ruoff, Chem. Soc. Rev. 39 (2010) 228.[33] W. Wei, C. Yu, Q. Zhao, X. Qian, G. Li, Y. Wan, Appl. Catal. B 146 (2014) 151.[34] J.S. Valente, F. Tzompantzi, J. Prince, Appl. Catal. B 102 (2011) 276.[35] J. Xu, F. Wang, W. Liu, W. Cao, Int. J. Photoenergy 2013 (2013) 7.[36] L. Xiong, L. Zheng, J. Xu, D. Zheng, J. Li, X. Li, J. Sun, Q. Liu, L. Niu, S. Yang, J. Xia,
Environ. Chem. Lett. 9 (2011) 251.[37] L. Liu, H. Liu, Y.-P. Zhao, Y. Wang, Y. Duan, G. Gao, M. Ge, W. Chen, Environ. Sci.
Technol. 42 (2008) 2342.[38] Y.-B. Tang, C.-S. Lee, J. Xu, Z.-T. Liu, Z.-H. Chen, Z. He, Y.-L. Cao, G. Yuan, H. Song,
L. Chen, L. Luo, H.-M. Cheng, W.-J. Zhang, I. Bello, S.-T. Lee, ACS Nano 4 (2010)3482.