Chemical composition and physical properties of … · ORIGINAL RESEARCH Chemical composition and...
12
ORIGINAL RESEARCH Chemical composition and physical properties of salted shrimp paste (Kapi) produced in Thailand Jaksuma Pongsetkul • Soottawat Benjakul • Punnanee Sampavapol • Kazufumi Osako • Nandhsha Faithong Received: 7 June 2014 / Accepted: 13 August 2014 / Published online: 17 September 2014 Ó The Author(s) 2014. This article is published with open access at Springerlink.com Abstract Chemical composition and physical properties of 11 salted shrimp pastes (Kapi) obtained from various places of Thailand were determined. Based on proximate composition, protein constituted the major component (29.44–53.27 %, dry wt. basis). All samples contained 22.77–35.47 % NaCl with A w of 0.695– 0.774. Various formal nitrogen contents (11.96–22.87 mg N/g sample) were in agreement with different degrees of hydrolysis (12.68–20.76 %), suggesting the varying cleavage of peptides among the samples. From electrophoretic study, salted shrimp paste contained a large amount of small molecular weight proteins and peptides. Different samples had different colors with DE of 47.10–60.43 and DC of 9.46–20.76. The samples had total carotenoid content of 0.54–1.97 mg/g sample. Free astaxanthin, astaxanthin diester and cantha- xanthin were the major carotenoids in salted shrimp paste. Thus, salted shrimp paste is a good source of protein and serves as the nutritious condiment. Keywords Salted shrimp paste Fermented food Kapi Nutrition Introduction Fermented fishery products are extensively consumed in Southeast Asian countries since the fifteenth century, and consumed as staples, side dishes or condiments/seasonings in daily foods. The widespread consumption of fishery fermented products over a wide geographical area throughout Southeast Asia is due to the simplicity of the processing techniques and uniformity of the final fermented products (Hajeb and Jinap 2013). Those products impart delicacy and have high nutritional value (Faithong et al. 2010). During fermentation, raw materials are converted into products through activities of endogenous enzymes or microorganisms (bacteria, yeasts and molds). The process can be a natural process, in which desirable microorganisms grow preferentially, or a controlled process, in which isolated and characterized fermentative microorganisms (starter culture) are added to the raw material under controlled conditions (Tamang and Kailasapathy 2010). Fermentation of fishery products does not play a role in preserving them, and smaller peptides and amino acids generated can serve as nutrients for as microorganisms. Therefore, fermentation is J. Pongsetkul S. Benjakul (&) P. Sampavapol N. Faithong Department of Food Technology, Faculty of Agro-Industry, Prince of Songkla University, Hat Yai, Songkhla 90112, Thailand e-mail: [email protected] K. Osako Department of Food Science and Technology, Tokyo University of Marine Science and Technology, 5-7 Konan 4, Minato- ku, Tokyo 108-8477, Japan 123 Int Aquat Res (2014) 6:155–166 DOI 10.1007/s40071-014-0076-4
Transcript of Chemical composition and physical properties of … · ORIGINAL RESEARCH Chemical composition and...
ORIGINAL RESEARCH
Chemical composition and physical properties of saltedshrimp paste (Kapi) produced in Thailand
Jaksuma Pongsetkul • Soottawat Benjakul •
Punnanee Sampavapol • Kazufumi Osako •
Nandhsha Faithong
Received: 7 June 2014 / Accepted: 13 August 2014 / Published online: 17 September 2014
� The Author(s) 2014. This article is published with open access at Springerlink.com
Abstract Chemical composition and physical properties of 11 salted shrimp pastes (Kapi) obtained from
various places of Thailand were determined. Based on proximate composition, protein constituted the major
component (29.44–53.27 %, dry wt. basis). All samples contained 22.77–35.47 % NaCl with Aw of 0.695–
0.774. Various formal nitrogen contents (11.96–22.87 mg N/g sample) were in agreement with different
degrees of hydrolysis (12.68–20.76 %), suggesting the varying cleavage of peptides among the samples. From
electrophoretic study, salted shrimp paste contained a large amount of small molecular weight proteins and
peptides. Different samples had different colors with DE� of 47.10–60.43 and DC� of 9.46–20.76. The samples
had total carotenoid content of 0.54–1.97 mg/g sample. Free astaxanthin, astaxanthin diester and cantha-
xanthin were the major carotenoids in salted shrimp paste. Thus, salted shrimp paste is a good source of
protein and serves as the nutritious condiment.
Keywords Salted shrimp paste � Fermented food � Kapi � Nutrition
Introduction
Fermented fishery products are extensively consumed in Southeast Asian countries since the fifteenth century,
and consumed as staples, side dishes or condiments/seasonings in daily foods. The widespread consumption of
fishery fermented products over a wide geographical area throughout Southeast Asia is due to the simplicity of
the processing techniques and uniformity of the final fermented products (Hajeb and Jinap 2013). Those
products impart delicacy and have high nutritional value (Faithong et al. 2010).
During fermentation, raw materials are converted into products through activities of endogenous enzymes
or microorganisms (bacteria, yeasts and molds). The process can be a natural process, in which desirable
microorganisms grow preferentially, or a controlled process, in which isolated and characterized fermentative
microorganisms (starter culture) are added to the raw material under controlled conditions (Tamang and
Kailasapathy 2010). Fermentation of fishery products does not play a role in preserving them, and smaller
peptides and amino acids generated can serve as nutrients for as microorganisms. Therefore, fermentation is
J. Pongsetkul � S. Benjakul (&) � P. Sampavapol � N. Faithong
Department of Food Technology, Faculty of Agro-Industry, Prince of Songkla University, Hat Yai, Songkhla 90112,
Thailand
e-mail: [email protected]
K. Osako
Department of Food Science and Technology, Tokyo University of Marine Science and Technology, 5-7 Konan 4, Minato-
ku, Tokyo 108-8477, Japan
123
Int Aquat Res (2014) 6:155–166
DOI 10.1007/s40071-014-0076-4
often combined with the addition of salt or drying to reduce water activity and eliminate proteolytic and
putrefying microorganisms (Chaveesak et al. 1993).
Fermentation process is also influenced by several variables including (1) the microflora present in the raw
material and salt, (2) proteolytic activity of raw material and microorganism, (3) condition of the product
entering the fermentation process, (4) presence or absence of oxygen, (5) nutritional state of the raw material,
(6) temperature, (7) pH of the fermentation mixture, (8) the presence of visceral enzymes, (9) the presence and
concentration of carbohydrates, and (10) the duration of the fermentation process (Phithakpol and Kasetsat
1995). Although some products have similar process, some ingredients used can be varied, leading to the
different characteristics, especially flavor and taste (Mizutani et al. 1987).
Kapi, a typical traditional salted shrimp paste, has been widely consumed in Thailand as a condiment.
Salted shrimp paste is generally prepared from the planktonous shrimp or krill (Acetes vulgaris or Meso-
podopsis orientalis). Traditionally, salted shrimp paste is produced by mixing one part of salt with three to five
parts of shrimp or krill. The mixture is salted, pounded and spread out on the ground to dry under sunlight. The
paste is compacted and allowed to ferment in anaerobic condition at ambient temperature (25–35 �C) for at
least 1 month or longer (Faithong et al. 2010). The color of salted shrimp paste varies from a pinkish or
purplish gray to a dark grayish brown. The consistency also varies, from soft and pasty to dry and hard. It
could be preserved for several months (Phithakpol 1993). However, raw material, shrimp or krill/salt ratio,
fermentation process and time can be varied, depending on regions or countries. This leads to different
characteristics and properties of the product (Peralta et al. 2008). However, a little information regarding the
chemical compositions and physical properties of salted shrimp paste (Kapi) produced in different places in
Thailand has been reported. Thus, the objective of this study was to determine the chemical composition and
physical properties of salted shrimp paste collected from various regions of Thailand.
Methods
Chemicals
Potassium persulfate, acrylamide, N,N,N0,N0-tetramethyl-ethylenediamine (TEMED) and bis-acrylamide were
procured from Fluka Chemical Co. (Buchs, Switzerland). Sodium sulfite and ammonium thiocyanate were
obtained from Riedel–de Haen (Seelze, Germany). Anhydrous sodium sulfate was obtained from Merck
(Darmstadt, Germany). Isopropanol, petroleum ether and hexane were purchased from Lab-Scan (Bangkok,
Thailand). Astaxanthin and b-carotene were obtained from Dr. Ehrenstorfer GmbH (Augsburg, Germany).
Samples
Salted shrimp paste samples were purchased from different provinces in Thailand, including Songkhla (2
samples), Ranong (2 samples), Krabi (2 samples), Sa-tun (1 sample), Samut Sakhon (1 sample), Rayong (1
sample), Chachoengsao (1 sample) and Samut Songkram (1 sample). Each sample was divided into several
portions (100 g each), placed in polyethylene bag and heat-sealed. The samples were kept at -20 �C and the
storage time was not longer than 2 months.
Proximate analysis
Moisture, ash, fat, protein and carbohydrate contents of salted shrimp paste were determined according to
AOAC methods (2000) with the analytical No. of 35.1.13, 35.1.14, 35.1.25, 35.1.15 and 35.1.16, respectively.
Determination of salt content
Salt content of salted shrimp paste was determined according to AOAC method (2000). Sample (0.5–1 g) was
mixed with 10–20 ml of 0.1 N AgNO3 and 10 ml of Conc. HNO3. The mixture was boiled on a hot plate for
10 min and then cooled under running water. The mixture was filtered through a filter paper (Whatman No. 1)
(Whatman International Ltd., Maidstone, UK). The filtrate was adjusted to the volume of 50 ml by distilled
123
156 Int Aquat Res (2014) 6:155–166

water and 5 ml of ferric alum indicator was added. The mixture was titrated with standardized 0.1 N KSCN
until the solution became permanent brownish-red. The salt content was then calculated and expressed as
%NaCl using the following equation:
NaCl ð%Þ ¼ ½ðml of AgNO3 � conc: of AgNO3Þ � ðml of KSCN � conc: of KSCNÞ�Weight of sample (g)
Water activity (Aw) and pH determination
Aw of salted shrimp paste was measured using a water activity analyzer (Thermoconstanter, Novasina,
Switzerland). The pH of samples was measured according to the method of Nirmal and Benjakul (2009) with a
slight modification. Salted shrimp paste (3 g) was homogenized thoroughly with 10 volumes of distilled water
(w/v). The homogenate was kept at room temperature for 5 min prior to measurement using a pH meter
(Sartorius, Gottingen, Germany).
Determination of formal nitrogen, ammonia nitrogen and amino nitrogen contents
Formal nitrogen content
Formal nitrogen content was determined by the titration method as described by Thai Industrial Standard
(1983) with a slight modification. Salted shrimp paste (2 g) was mixed with 10 ml of distilled water. Then, the
mixture was homogenized at a speed of 9,500 rpm for 2 min using an IKA Labortechnik homogenizer
(Selangor, Malaysia). Ten ml of formalin solution (38 %, v/v; pH 9) were added and mixed well. The mixture
was titrated with 0.1 N NaOH to obtain pH of 9.0. Formal nitrogen content was calculated and expressed as
mg formal nitrogen/g sample using the following equation:
Formal nitrogen content ðmg N=g) ¼ ml of NaOH pH7 � pH9ð Þ � 0:1 � 14
Weight of sample ðgÞ
Ammonia nitrogen content
Ammonia nitrogen content was determined by the titration method as described by Thai Industrial Standard
(1983) with a slight modification. Salted shrimp paste (2 g) was placed in 400 ml Kjeldahl flask containing
100 ml of distilled water and 3 g of MgO. The mixture was distilled and the distillate (approximately 8–
10 ml) was collected in 50 ml of 4 % (w/v) boric acid containing the mixed indicators (0.125 g methyl red
and 0.082 g bromocresol green in 95 % alcohol (100 ml): 0.1 % methylene blue in distilled water with ratio of
5:1). The solution was then titrated with 0.05 N H2SO4 to reach the end point. Ammonia nitrogen content was
calculated as follows:
Ammonia nitrogen content ðmg N=g) ¼ 5:6 � 0:05 � ml of H2SO4
Weight of sample ðgÞ
Amino nitrogen content
Amino nitrogen content was calculated based on the difference between formal and ammonia nitrogen
contents (Thai Industrial Standard 1983) as follows:
Amino nitrogen content ðmgN=gÞ ¼ Formal nitrogen content � Ammonia nitrogen content
Measurement of degree of hydrolysis (DH)
DH of salted shrimp paste was determined according to the method of Benjakul and Morrissey (1997). The
sample (1 g) was mixed with 9 ml of 5 % (w/v) SDS. The mixture was homogenized at a speed of 11,000 rpm
123
Int Aquat Res (2014) 6:155–166 157
for 1 min. The homogenate was heated at 85 �C for 30 min. The mixture was then subjected to centrifugation
at 10,000g for 15 min at room temperature (Model RC-B Plus centrifuge Newtown, CT, USA). Thereafter,
2.0 ml of 0.2 M phosphate buffer (pH 8.2) and 1.0 ml of 0.01 % (w/v) TNBS solution were added. The
solution was mixed thoroughly and placed in a temperature-controlled water bath (Memmert, Schwabach,
Germany) at 50 �C for 30 min in the dark. The reaction was terminated by adding 2.0 ml of 0.1 M sodium
sulfite. The mixture was then cooled at room temperature for 15 min. The absorbance was read at 420 nm and
free amino group content was expressed in terms of L-leucine.
DH was calculated following the method of Benjakul and Morrissey (1997) with a slight modification as
follows:
%DH ¼ L=Lmaxð Þ � 100
where L is the amount of free amino group in the product and Lmax is the total free amino group after acid
hydrolysis (6 M HCl at 100 �C for 24 h).
Sodium dodecyl sulfate-polyacrylamide gel electrophoresis (SDS-PAGE)
Protein patterns were determined by SDS-PAGE using 4 % stacking gel and 12.5 % running gel, according to
the method of Laemmli (1970). Samples (3 g) were solubilized in 27 ml of 5 % (w/v) SDS (85 �C). The
mixture was homogenized for 1 min at a speed of 13,000 rpm and incubated at 85 �C for 1 h to dissolve total
proteins. Samples (15 lg protein) determined by the Biuret method (Robinson and Hogden 1940) were loaded
onto the gel and subjected to electrophoresis at a constant current of 15 mA per gel using a Mini-Protean II
unit (Bio-Rad Laboratories, Inc., Richmond, CA, USA). After electrophoresis, the gels were stained with
0.05 % (w/v) Coomassie Blue R-250 in 50 % (v/v) methanol and 7.5 % (v/v) acetic acid for 30 min. Finally,
gels were destained with a mixture of 50 % (v/v) methanol and 7.5 % (v/v) acetic acid for 30 min and
destained again with a mixture of 5 % (v/v) methanol and 7.5 % (v/v) acetic acid for 1 h.
Analysis of carotenoid
Total carotenoid content in the samples was determined according to the method of Saito and Regier (1971)
with a slight modification. Sample (30 mg) was mixed with 10 ml of petroleum ether and homogenized at a
speed of 10,000 rpm for 1 min. The homogenate was allowed to stand for 30 min, followed by filtration using
a Whatman filter paper No. 4 (Whatman International Ltd., Maidstone, UK). The absorbance of the filtrate,
appropriately diluted, was read at 468 nm using a UV-1601 spectrophotometer (Shimadzu, Kyoto, Japan). The
concentration (C) of carotenoid in the sample was calculated using the equation given by Saito and Regier
(1971) with a slight modification as follows:
C ðmg=g lipids) ¼ A468 � volume of extract � dilution factor
0:2 � weight of sample ðg)
where 0.2 is the A468 of 1 lg/ml standard astaxanthin.
The filtrate containing carotenoid was subjected to thin-layer chromatography (TLC) using activated
20 9 20 cm silica gel plates (silica gel G type 60, Merck) following the modified procedure described by
Sanchez-Camargo et al. (2011). The sample was applied on the plates, and the separation was carried out using
a mixture of isopropanol and hexane (50:50, v/v) as mobile phase. b-carotene and astaxanthin were used as
standards.
Measurement of color
Color of salted shrimp paste was determined using a colorimeter (ColourFlex, Hunter Lab Reston, VA, USA)
and reported in the CIE system. L� (lightness), a� (redness/greenness), and b� (yellowness/blueness) were
reported. Additionally, DE� (total difference of color) and DC� (the difference in chroma) were calculated as
follows:
123
158 Int Aquat Res (2014) 6:155–166

DE� ¼ffiffiffiffiffiffiffiffiffiffiffiffiffiffiffiffiffiffiffiffiffiffiffiffiffiffiffiffiffiffiffiffiffiffiffiffiffiffiffiffiffiffiffiffiffiffiffiffiffiffiffiffi
ðDL�Þ2 þ ðDa�Þ2 þ Db�ð Þ2q
where DL�;Da� and Db� are the differentials between color parameters of the samples and those of the white
standard (L� ¼ 93:55; a� ¼ �0:84 and b� ¼ 0:37).
DC� ¼ C�sample�C�
standard
where C� ¼ffiffiffiffiffiffiffiffiffiffiffiffiffiffiffiffiffiffiffiffiffiffiffiffiffiffi
ða�Þ2 þ ðb�Þ2q
.
Statistical analysis
All analyses were conducted in triplicate. Statistical analysis was performed using one-way analysis of
variance (ANOVA). Mean comparison was carried out using Duncan’s multiple range test (Steel et al. 1980).
Results and discussion
Proximate compositions, Aw, pH and salt content
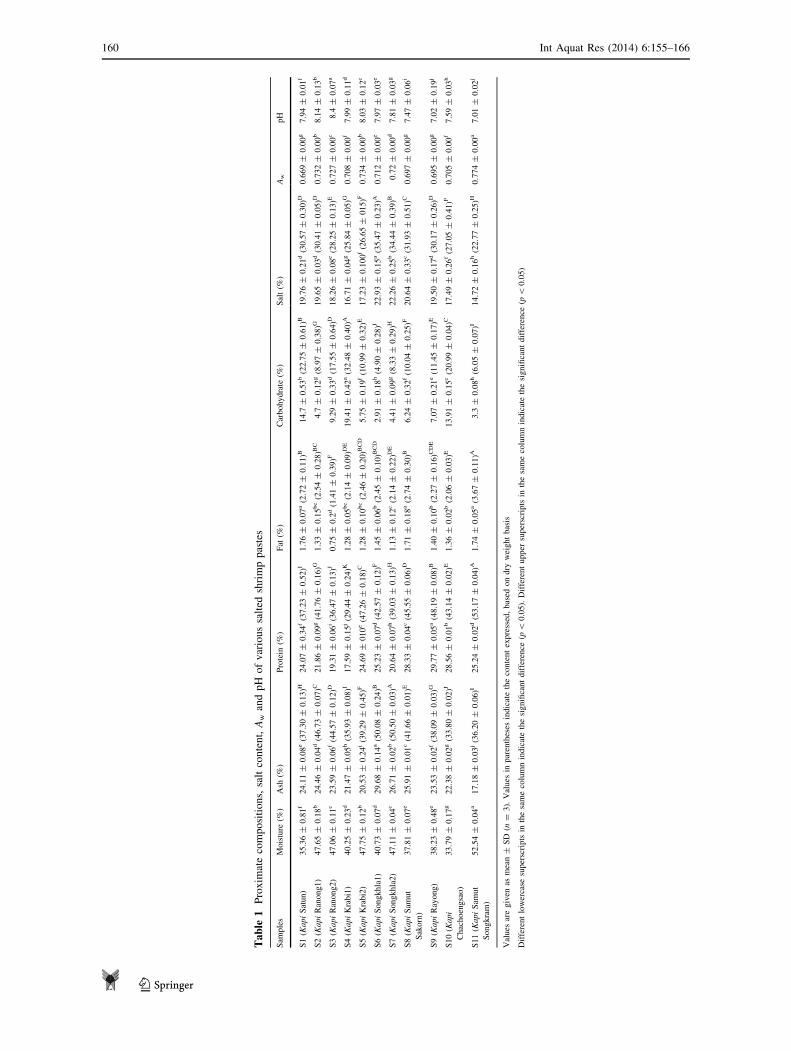
Proximate compositions of different salted shrimp paste samples are shown in Table 1. Moisture content of
salted shrimp paste samples varied from 33.79 to 52.54 %. Based on dry matter, protein constituted the major
component (29.44–53.17 %), indicating that salted shrimp paste could be the good source of proteins. S11
(Kapi Samut Songkram) showed the highest protein content (53.17 %) followed by S9 (Kapi Rayong)
(48.19 %). All samples contained salt, which is needed for preservation. Salt content was in the range of
22.77–35.47 %. This contributed to high ash content of all samples (33.80–50.50 %). S6 (Kapi Songkhla1)
and S7 (Kapi Songkhla2) had the highest salt contents (35.47 and 34.44 %, respectively). This was in
agreement with the highest ash contents (50.08 and 50.50 %, respectively). Slightly higher ash content, in
comparison with salt content, was more likely attributed to the presence of inorganic substances in the shell of
shrimp or krill used as raw material. Shell has been known to have CaCO3 as the component (Stevenson
1985). Fat contents of salted shrimp paste ranged from 1.41 to 3.67 %. Shrimp oil was reported to be rich in
polyunsaturated fatty acid. Linoleic acid (C18:2(n-6)) was the dominant fatty acid in shrimp oil from Pacific
white shrimp (Takeungwongtrakul et al. 2012b). This made shrimp oil susceptible to lipid oxidation (Take-
ungwongtrakul and Benjakul 2013). Moreover, a wide range of carbohydrate content (4.90–32.48 %) was
noticeable. S4 (Kapi Krabi1) had the highest carbohydrate content (32.48 %). S1 (Kapi Satun) and S10 (Kapi
Chachoengsao) also contained a high amount of carbohydrate (20.99 and 22.75 %, respectively). The dif-
ference in carbohydrate content could be obtained among the samples, dependent on the addition of poly-
saccharides by processors. They add the root crops, flour or sugar to increase the yield or improve the flavor
and taste of shrimp paste (Faithong et al. 2010). Those components had the impact on quality attribute and
nutritive value of salted shrimp paste. Faithong et al. (2010) reported that pH, moisture, protein, fat, ash, salt
and carbohydrate content of shrimp paste produced in the south of Thailand were 7.44–7.66, 36.78–49.93,
31.85–43.12, 2.42–4.10, 41.04–50.93, 19.29–24.73 and 4.58–24.70 % (dry weight basis), respectively.
Water activity (Aw) of shrimp paste was in the range of 0.669–0.774, with corresponding low moisture
content (Table 1). Aw can be related to the consistency of salted shrimp paste, which varied from soft and
pasty to dry and hard. Aw of the final product would depend on how long the sample was allowed to dry under
the sun. Furthermore, high salt level directly lowered Aw of products. Salted shrimp paste can be classified as
an intermediate moisture food, with an Aw of about 0.7 (Fennema 1996). Lowered Aw could be associated with
the prolonged shelf-life of salted shrimp paste (Goulas and Kontominas 2005). The samples had a pH range of
7.01–8.4. The slightly basic pH might have been caused by the degradation products generated during
fermentation or the formation of volatile base compounds such as ammonia. When the hydrolysis proceeded,
the small proteins or peptides might undergo decomposition, e.g., via deamination with ease. This could favor
the formation of low-molecular weight basic compounds.
123
Int Aquat Res (2014) 6:155–166 159
Ta
ble
1P
rox
imat
eco
mp
osi
tio
ns,
salt
con
ten
t,A
wan
dp
Ho
fv
ario
us
salt
edsh
rim
pp
aste
s
Sam
ple
sM
ois
ture
(%)
Ash
(%)
Pro
tein
(%)
Fat
(%)
Car
bohydra
te(%
)S
alt
(%)
Aw
pH
S1
(Kapi
Sat
un)
35.3
6±
0.8
1f
24.1
1±
0.0
8e
(37.3
0±
0.1
3)H
24.0
7±
0.3
4f
(37.2
3±
0.5
2)I
1.7
6±
0.0
7a
(2.7
2±
0.1
1)B
14.7
±0.5
3b
(22.7
5±
0.6
1)B
19.7
6±
0.2
1d
(30.5
7±
0.3
0)D
0.6
69
±0.0
0g
7.9
4±
0.0
1f
S2
(Kapi
Ran
ong1)
47.6
5±
0.1
8b
24.4
6±
0.0
4d
(46.7
3±
0.0
7)C
21.8
6±
0.0
9g
(41.7
6±
0.1
6)G
1.3
3±
0.1
5b
c(2
.54
±0.2
8)B
C4.7
±0.1
2g
(8.9
7±
0.3
8)G
19.6
5±
0.0
3d
(30.4
1±
0.0
5)D
0.7
32
±0.0
0b
8.1
4±
0.1
3b
S3
(Kapi
Ran
ong2)
47.0
6±
0.1
1c
23.5
9±
0.0
6f
(44.5
7±
0.1
2)D
19.3
1±
0.0
6i
(36.4
7±
0.1
3)J
0.7
5±
0.2
d(1
.41
±0.3
9)F
9.2
9±
0.3
3d
(17.5
5±
0.6
4)D
18.2
6±
0.0
8e
(28.2
5±
0.1
3)E
0.7
27
±0.0
0c
8.4
±0.0
7a
S4
(Kapi
Kra
bi1
)40.2
5±
0.2
3d
21.4
7±
0.0
5h
(35.9
3±
0.0
8)I
17.5
9±
0.1
5j
(29.4
4±
0.2
4)K
1.2
8±
0.0
5b
c(2
.14
±0.0
9)D
E19.4
1±
0.4
2a
(32.4
8±
0.4
0)A
16.7
1±
0.0
4g
(25.8
4±
0.0
5)G
0.7
08
±0.0
0f
7.9
9±
0.1
1d
S5
(Kapi
Kra
bi2
)47.7
5±
0.1
2b
20.5
3±
0.2
4i
(39.2
9±
0.4
5)F
24.6
9±
010
e(4
7.2
6±
0.1
8)C
1.2
8±
0.1
0b
c(2
.46
±0.2
0)B
CD
5.7
5±
0.1
9f
(10.9
9±
0.3
2)E
17.2
3±
0.1
00
f(2
6.6
5±
015)F
0.7
34
±0.0
0b
8.0
3±
0.1
2c
S6
(Kapi
Songkhla
1)
40.7
3±
0.0
7d
29.6
8±
0.1
4a
(50.0
8±
0.2
4)B
25.2
3±
0.0
7d
(42.5
7±
0.1
2)F
1.4
5±
0.0
6b
(2.4
5±
0.1
0)B
CD
2.9
1±
0.1
8h
(4.9
0±
0.2
8)J
22.9
3±
0.1
5a
(35.4
7±
0.2
3)A
0.7
12
±0.0
0e
7.9
7±
0.0
3e
S7
(Kapi
Songkhla
2)
47.1
1±
0.0
4c
26.7
1±
0.0
2b
(50.5
0±
0.0
3)A
20.6
4±
0.0
7h
(39.0
3±
0.1
3)H
1.1
3±
0.1
2c
(2.1
4±
0.2
2)D
E4.4
1±
0.0
9g
(8.3
3±
0.2
9)H
22.2
6±
0.2
5b
(34.4
4±
0.3
9)B
0.7
2±
0.0
0d
7.8
1±
0.0
3g
S8
(Kapi
Sam
ut
Sak
orn
)
37.8
1±
0.0
7e
25.9
1±
0.0
1c
(41.6
6±
0.0
1)E
28.3
3±
0.0
4c
(45.5
5±
0.0
6)D
1.7
1±
0.1
8a
(2.7
4±
0.3
0)B
6.2
4±
0.3
2f
(10.0
4±
0.2
5)F
20.6
4±
0.3
3c
(31.9
3±
0.5
1)C
0.6
97
±0.0
0g
7.4
7±
0.0
6i
S9
(Kapi
Ray
ong)
38.2
3±
0.4
8e
23.5
3±
0.0
2f
(38.0
9±
0.0
3)G
29.7
7±
0.0
5a
(48.1
9±
0.0
8)B
1.4
0±
0.1
0b
(2.2
7±
0.1
6)C
DE
7.0
7±
0.2
1e
(11.4
5±
0.1
7)E
19.5
0±
0.1
7d
(30.1
7±
0.2
6)D
0.6
95
±0.0
0g
7.0
2±
0.1
9j
S10
(Kapi
Chac
hoen
gsa
o)
33.7
9±
0.1
7g
22.3
8±
0.0
2g
(33.8
0±
0.0
2)J
28.5
6±
0.0
1b
(43.1
4±
0.0
2)E
1.3
6±
0.0
2b
(2.0
6±
0.0
3)E
13.9
1±
0.1
5c
(20.9
9±
0.0
4)C
17.4
9±
0.2
6f
(27.0
5±
0.4
1)F
0.7
05
±0.0
0f
7.5
9±
0.0
3h
S11
(Kapi
Sam
ut
Songkra
m)
52.5
4±
0.0
4a
17.1
8±
0.0
3j
(36.2
0±
0.0
6)I
25.2
4±
0.0
2d
(53.1
7±
0.0
4)A
1.7
4±
0.0
5a
(3.6
7±
0.1
1)A
3.3
±0.0
8h
(6.0
5±
0.0
7)I
14.7
2±
0.1
6h
(22.7
7±
0.2
5)H
0.7
74
±0.0
0a
7.0
1±
0.0
2j
Val
ues
are
giv
enas
mea
n±
SD
(n=
3).
Val
ues
inpar
enth
eses
indic
ate
the
conte
nt
expre
ssed
,bas
edon
dry
wei
ght
bas
is
Dif
fere
nt
low
erca
sesu
per
scri
pts
inth
esa
me
colu
mn
indic
ate
the
signifi
cant
dif
fere
nce
(p\
0.0
5).
Dif
fere
nt
upper
super
scri
pts
inth
esa
me
colu
mn
indic
ate
the
signifi
cant
dif
fere
nce
(p\
0.0
5)
123
160 Int Aquat Res (2014) 6:155–166

Formal nitrogen, ammonia nitrogen and amino nitrogen contents
Formal nitrogen contents of different salted shrimp pastes are shown in Table 2. Formal nitrogen content
varied from 11.96 to 22.87 mg N/g sample. Generally, the formal nitrogen content has been used to indicate
the degree of protein hydrolysis (Chaveesak et al. 1993). Formaldehyde can react with alpha amino group and
ammonia, releasing the proton which can be titrated with alkaline solution. Thus, formal nitrogen content can
be the indicator for the level of the cleavage of peptides (Angeles and Garcia-Carreno 2002). The highest
formal nitrogen contents were found in S6 (Kapi Songkhla1) and S8 (Kapi Samut Sakorn) (p \ 0.05). The
lowest value was found in S10 (Kapi Chachoengsao) and S11 (Kapi Samut Songkram) (p \ 0.05).
Ammonia nitrogen contents of all samples were in the range of 0.56–0.99 mg N/g sample (Table 2). The
ammonia nitrogen content indicates the breakdown of protein and peptides into free amino acid and volatile
nitrogen (Lopetcharat et al. 2001; Binsan et al. 2008). Therefore, the differences in ammonia nitrogen contents
among samples might be related with different proteolytic activity, both endogenous proteinase and microbial
proteinase, during fermentation. The volatile nitrogenous compounds might contribute to different charac-
teristics of the products, especially flavor. S11 (Kapi Samut Songkram) had the highest ammonia nitrogen
content (p \ 0.05).
Amino nitrogen contents of salted shrimp pastes from different provinces of Thailand are shown in Table 2.
Amino nitrogen content was calculated based on the differences between formal nitrogen content and
ammonia nitrogen content. The amino nitrogen content represents the amount of primary amino group of the
sample. An increase in amino nitrogen content is related to the degradation of polypeptide (Lopetcharat et al.
2001; Binsan et al. 2008). Generally, amino nitrogen content was in agreement with the formal nitrogen
content. The result reconfirmed that higher cleavage of peptides was obtained in S6 (Kapi Songkhla1) and S8
(Kapi Samut Sakorn).
Degree of hydrolysis
Degree of hydrolysis (DH) of all samples varied (Table 2). DH is the measure of the extent of cleavage of
peptide linkages. DH close to 100 % means that all proteins in the sample are completely hydrolyzed to free
amino acids (Panyam and Kilara 1996). DH of the samples was from 12.68 to 20.76 %. DH was in agreement
with formal nitrogen content and amino nitrogen content. S6 (Kapi Songkhla1) and S8 (Kapi Samut Sakorn)
showed the highest DH (20.76 %) and S10 (Kapi Chachoengsao) and S11 (Kapi Samut Songkram) had the
lowest DH (12.68 and 12.81 %, respectively). Due to different raw materials, processing condition and time of
fermentation as well as different types or levels of proteolytic enzymes, varying degrees of cleavage were
presumed. Products with different DH might possess different characteristics, taste, flavor, color and other
Table 2 Formal nitrogen, ammonia nitrogen, amino nitrogen contents and degree of hydrolysis of various salted shrimp pastes
Samples Formal nitrogen content
(mg N/g sample)
Ammonia nitrogen content
(mg N/g sample)
Amino nitrogen content
(mg N/g sample)
Degree of
hydrolysis (%)
S1 (Kapi Satun) 15.42 ± 0.35f 0.56 ± 0.01f 14.85 ± 0.35f 16.61 ± 0.03d
S2 (Kapi Ranong1) 17.62 ± 0.15e 0.67 ± 0.03e 16.95 ± 0.24e 19.18 ± 0.60c
S3 (Kapi Ranong2) 21.03 ± 0.97c 0.59 ± 0.01f 20.44 ± 0.97c 20.08 ± 0.29b
S4 (Kapi Krabi1) 21.89 ± 0.22b 0.71 ± 0.02de 21.18 ± 0.20b 20.22 ± 0.04b
S5 (Kapi Krabi2) 19.43 ± 0.58d 0.60 ± 0.03f 18.83 ± 0.58d 19.29 ± 0.15c
S6 (Kapi Songkhla1) 22.87 ± 0.27a 0.88 ± 0.02b 21.99 ± 0.26a 20.76 ± 0.15a
S7 (Kapi Songkhla2) 21.40 ± 0.33bc 0.81 ± 0.06c 20.59 ± 0.34bc 20.1 ± 0.08b
S8 (Kapi Samut Sakorn) 22.78 ± 0.28a 0.69 ± 0.02de 22.08 ± 0.24a 20.76 ± 0.21a
S9 (Kapi Rayong) 14.73 ± 0.17f 0.81 ± 0.01c 13.93 ± 0.17g 16.49 ± 0.09d
S10 (Kapi Chachoengsao) 12.09 ± 0.01g 0.74 ± 0.02d 11.35 ± 0.01h 12.68 ± 0.24e
S11 (Kapi Samut Songkram) 11.96 ± 0.31g 0.99 ± 0.01a 10.97 ± 0.33h 12.81 ± 0.16e
Values are given as mean ± SD (n = 3)
Different lowercase superscripts in the same column indicate the significant difference (p \ 0.05)
123
Int Aquat Res (2014) 6:155–166 161

attributes. Free amino groups available were able to undergo several reactions, e.g., Maillard reaction, thereby
affecting the color or browning of products.
Protein patterns
Protein patterns of different salted shrimp pastes are shown in Fig. 1. All samples had proteins or peptides
with molecular weight lower than 100 kDa. Major proteins were found in the range of 10–15 kDa. It was
noted that Kapi Samut Songkram (S11) had the proteins with MW of 65 and 30 kDa. This coincided with the
lowest DH of those samples. The results indicated the differences in protein pattern in individual sample. For
all samples, there were no myosin heavy chain (MHC) and actin bands retained. This suggested that MHC and
actin underwent degradation completely through proteolysis during fermentation in all samples. It has been
reported that MHC was the most susceptible muscle proteins (Benjakul et al. 1997). When MHC was not
available, actin can be hydrolyzed (Riebroy et al. 2008). It was also found that troponin and tropomyosin also
disappeared in all samples. Krill and shrimp were found to contain serine protease and metalloprotease
(Garcia-Carreno et al. 1994). Those proteases along with proteases from halophilic bacteria more likely played
a role in hydrolysis of proteins in raw material. With intensive degradation, free amino acids or low-molecular
weight peptides can be produced. The formation of low-molecular weight peptides or proteins was in
accordance with the increasing DH, formal nitrogen and amino nitrogen contents (Table 2).
Carotenoid
Carotenoid content
Total carotenoid contents in different salted shrimp pastes are shown in Table 3. Carotenoids, especially
astaxanthin, provide the desirable reddish-orange color in crustaceans (Higuera-Ciapara et al. 2006). Carot-
enoid content of salted shrimp pastes varied from 0.54 to 1.97 mg/g lipid. Among all samples, S7 (Kapi
Songkhla2) had the highest total carotenoid content (1.97 mg/g lipid) (p \ 0.05), whereas S11 (Kapi Samut
Songkram) (0.54 mg/g lipid) and S6 (Kapi Songkhla1) (0.69 mg/g lipid) had the lowest carotenoid content
(p \ 0.05). The differences in carotenoid content could plausibly be to the different raw materials used.
Shrimp with different species and feed used showed varying carotenoid content (Shahidi and Brown 1998).
Supplementation of carotenoids in red porgy (Pagrus pagrus) could increase redness, yellowness and chroma
of their skin (Manganaro et al. 2012). Additionally, stability of carotenoid in different samples could be varied,
depending on the process or other factors involved. Carotenoid content of hepatopancreas of Pacific white
LM S1 S2 S3 S4 S5 S6 S7 S8 S9 S10 S11
97
66
45
30
21
14.4
MW (kDa)
Fig. 1 Protein patterns of various salted shrimp pastes, LM low-molecular weight marker, key: see Table 1 caption
123
162 Int Aquat Res (2014) 6:155–166

shrimp was 336.40 mg/kg sample (Takeungwongtrakul et al. 2012a). Sachindra et al. (2006) reported the
highest carotenoid content (43.9 mg/kg sample) from head and carapace of Penaeus indicus when 50:50 (v/v)
mixture of hexane and isopropanol was used as extracting medium. The variation in carotenoids in crustaceans
is caused by various factors such as species, feed, parts of body, environmental condition and other variables
(Mezzomo et al. 2011; Takeungwongtrakul et al. 2012b). Apart from protein, carotenoids have paid increasing
interest as the important source of antioxidants from crustaceans (De Holanda and Netto 2006). The presence
of carotenoids in salted shrimp pastes indicated that carotenoids were stable during fermentation under the
high salt environment. In general, carotenoids were associated with protein as carotenoprotein (Armenta-
Lopez et al. 2002). When proteins were degraded, free carotenoids were released and might undergo oxidation
to some extent. These carotenoids more likely contributed to color of salted shrimp paste to some degree.
Carotenoid in shrimp was reported to possess antioxidative activity (Bustos et al. 2003; Sowmya and Sa-
chindra 2012).
Thin-layer chromatography (TLC)
Carotenoids in salted shrimp paste were separated by TLC (Fig. 2). Similar TLC chromatograms were
observed among different samples. The major bands with Rf of 0.33, 0.40 and 0.75 were observed, corre-
sponding to free astaxanthin, canthaxanthin and astaxanthin diester, respectively. The Rf of cantaxanthin was
in agreement with that reported by Todd (1998), in which Rf of 0.40 was obtained. Kobayashi and Sakamoto
(1999) reported that astaxanthin diester had Rf in range of 0.75–0.85. Shahidi and Brown (1998) and Sachindra
et al. (2001) also reported that astaxanthin and its esters are the major carotenoids in the marine crustaceans. It
was noted that carotenoid in different samples varied in terms of components. No canthaxanthin was found in
S11 (Kapi Samut Songkram). Also, proportion of those components varied with samples. The results sug-
gested that raw materials used for production of salted shrimp paste were different. As a result, carotenoids in
the resulting products varied in composition. This might affect physical properties and bioactivity of products.
Color
The different salted shrimp pastes had different colors. L� (lightness), a� (redness), b� (yellowness), DE� (total
difference in color) and DC� (difference in chroma) were in the range of 34.13–51.84, 5.24–15.39, 4.56–17.59,
47.10–60.43 and 9.46–20.76, respectively. S8 (Kapi Samut Sakorn) had the lowest L� and the highest DE�.The lowest DC� was also noticeable in this sample. This sample was brown in color. On the other hand, S1
(Kapi Satun) had the highest a� value, whereas S3 (Kapi Ranong2) showed the highest b� value (p \ 0.05). S3
Table 3 Carotenoid content and colors of various salted shrimp pastes
Samples Carotenoid
content
(mg/g sample)
L� a� b� DE� DC�
S1 (Kapi Satun) 1.41 ± 0.04c 42.37 ± 0.05e 15.39 ± 0.07a 13.49 ± 0.17b 55.27 ± 0.07d 19.55 ± 0.11b
S2 (Kapi Ranong1) 1.19 ± 0.03e 46.74 ± 0.04b 12.13 ± 0.17c 11.86 ± 0.21d 49.92 ± 0.03h 16.05 ± 0.04d
S3 (Kapi Ranong2) 1.32 ± 0.08d 51.84 ± 0.04a 12.68 ± 0.03b 17.59 ± 0.07a 47.10 ± 0.01i 20.76 ± 0.06a
S4 (Kapi Krabi1) 1.35 ± 0.06d 38.5 ± 0.07i 11.3 ± 0.02d 10.87 ± 0.10e 57.35 ± 0.06b 14.76 ± 0.04e
S5 (Kapi Krabi2) 1.95 ± 0.03a 43.37 ± 0.05d 9.7 ± 0.17e 12.03 ± 0.19d 52.58 ± 0.03f 14.54 ± 0.08e
S6 (Kapi Songkhla1) 0.69 ± 0.02f 39.34 ± 0.08h 5.24 ± 0.06h 9.91 ± 0.24f 55.38 ± 0.11c 10.29 ± 0.20g
S7 (Kapi Songkhla2) 1.97 ± 0.02a 44.65 ± 0.06c 11.81 ± 0.07c 12.92 ± 0.17c 52.05 ± 0.03g 16.59 ± 0.17c
S8 (Kapi Samut Sakorn) 1.53 ± 0.03b 34.13 ± 0.06j 8.34 ± 0.07f 6.39 ± 0.20i 60.43 ± 0.08a 9.59 ± 0.10h
S9 (Kapi Rayong) 1.51 ± 0.01b 39.91 ± 0.05f 9.75 ± 0.58e 7.6 ± 0.14g 55.16 ± 0.08e 11.45 ± 0.40f
S10 (Kapi Chachoengsao) 1.43 ± 0.02c 39.36 ± 0.08h 7.46 ± 0.04g 7.21 ± 0.23h 55.24 ± 0.08de 9.46 ± 0.13h
S11 (Kapi Samut
Songkram)
0.54 ± 0.01g 39.53 ± 0.03g 9.43 ± 0.11e 4.56 ± 0.09j 55.15 ± 0.02e 9.56 ± 0.07h
Values are given as mean ± SD (n = 3)
Different lowercase superscripts in the same column indicate the significant difference (p \ 0.05)
123
Int Aquat Res (2014) 6:155–166 163

(Kapi Ranong2) also exhibited the highest DC� value (p \ 0.05). The difference in color might be caused by
the different pigment contents, as determined by raw materials, process as well as ingredients added. Highest
a� value for Kapi Satun was in agreement with the highest total carotenoid content (Table 3). Generally, lipid
oxidation was associated with browning mediated by Maillard reaction (Yarnpakdee et al. 2012). The carbonyl
groups of aldehydes and ketone, the oxidation products, could react with amino groups of free amino acids or
peptides generated during hydrolysis, leading to yellow or brown color development (Yarnpakdee et al. 2014).
DH in each product might, therefore, be related with different colors.
Conclusion
Different salted shrimp pastes had varying compositions. However, protein constituted the major component
in all samples. Hydrolysis of proteins took place at different degrees, leading to varying protein or peptide.
Carotenoids were also found as the components, which partially contributed to color. Studies on sensory
properties, and flavor profile of salted shrimp pastes are ongoing, in which desirable characteristic for this
product can be gained.
Acknowledgments This research was supported by Prince of Songkla University and the Grant-in-Aid for dissertation from
Graduate School, Prince of Songkla University, Thailand. The TRF senior research scholar program was also acknowledged for
the financial support.
Conflict of interest The authors declare that they have no competing interests.
Author’s contributions SB developed the initial idea and designed the study. SB and JP carried out the analytical work. JP
wrote the manuscript with assistance from SB. SB, OK and NF read and approved the final manuscript.
Open Access This article is distributed under the terms of the Creative Commons Attribution License which permits any use,
distribution, and reproduction in any medium, provided the original author(s) and the source are credited.
References
Angeles Navarrete del Toro M, Garcia-Carreno FL (2002) Evaluation of the progress of protein hydrolysis. In: Wrolstad RE et al
(eds) Current protocols in food analytical chemistry. Wiley, New York
AOAC (2000) Official method of analysis. Association of official chemists, Gaithersburg
A S1 S2 S3 S4 S5 S6 S7 S8 S9 S10 S11B
0.96
0.75
0.40
0.33
Rf
Fig. 2 Thin-layer chromatogram of carotenoids from various salted shrimp pastes (A b-carotene, B astaxanthin. Key: see Table 1
caption
123
164 Int Aquat Res (2014) 6:155–166
Armenta-Lopez R, Guerrero IL, Huerta S (2002) Astaxanthin extraction from shrimp waste by lactic fermentation and enzymatic
hydrolysis of the carotenoprotein complex. J Food Sci 67:1002–1006
Benjakul S, Morrissey MT (1997) Protein hydrolysates from Pacific whiting solid wastes. J Agric Food Chem 45:3423–3430
Benjakul S, Seymour TA, Morissey MT, An H (1997) Physicochemical changes in Pacific whiting muscle proteins during iced
storage. J Food Sci 62:729–733
Binsan W, Benjakul S, Visessanguan W, Roytrakul S, Tanaka M, Kishimura H (2008) Antioxidative activity of Mungoong, an
extract paste, from the cephalothorax of white shrimp (Litopenaeus vannamei). Food Chem 106:185–193
Bustos R, Romo L, Yanez K, Diaz G, Romo C (2003) Oxidative stability of carotenoid pigments and polyunsaturated fatty acids
in microparticulate diets containing krill oil for nutrition of marine fish larvae. J Food Eng 56:289–293
Chaveesak R, Smith JP, Simpson BK (1993) Production of fish sauce and acceleration of sauce fermentation using proteolytic
enzymes. J Aquat Food Prod Technol 2(3):59–77
De Holanda HD, Netto FM (2006) Recovery of components from shrimp (Xiphopenaeus kroyeri) processing waste by enzymatic
hydrolysis. J Food Sci 71:298–303
Faithong N, Benjakul S, Phatcharat S, Binson W (2010) Chemical composition and antioxidative activity of Thai traditional
fermented shrimp and krill products. Food Chem 119:133–140
Fennema OR (1996) Water and ice. In: Fennema OR (ed) Food chem. Marcel Dekker, New York, pp 17–94
Garcia-Carreno FL, Patricia Hernandez-Cortes M, Haard NF (1994) Enzymes with peptidase and proteinase activity from the
digestive systems of a freshwater and a marine decapod. J Agric Food Chem 42:1456–1461
Goulas AE, Kontominas MG (2005) Effect of salting and smoking-method on the keeping quality of chub mackerel (Scomber
japonicus): biochemical and sensory attributes. Food Chem 93:511–520
Hajeb P, Jinap S (2013) Umami taste components and their sources in Asian foods. Crit Rev Food Sci 8:1102–1115
Higuera-Ciapara I, Felix-Valenzuela L, Goycoolea FM (2006) Astaxanthin: a review of its chemistry and applications. Crit Rev
Food Sci Nutr 46:185–196
Kobayashi M, Sakamoto Y (1999) Singlet oxygen quenching ability of astaxanthin esters from the green alga Haematococcus
pluvialis. Biotechnol Lett 21:265–269
Laemmli UK (1970) Cleavage of structural proteins during the assembly of the head of bacteriophage T4. Food Microbiol
227:680–685
Lopetcharat K, Choi YJ, Park JW, Daeschel MA (2001) Fish sauce products and manufacturing: a review. Food Rev Int 17:65–88
Manganaro A, Sanfilippo M, Fortino G, Dapra F, Palmegiano GB, Gai F (2012) Artificial pigmentation and flesh quality in red
porgy (Pagrus pagrus). Int Aquat Res 4:1–12
Mezzomo N, Maestri B, Dos Santos RL, Maraschin M, Ferreira SRS (2011) Pink shrimp (P. brasiliensis and P. paulensis)
residue: influence of extraction method on carotenoid concentration. Talanta 85:1383–1391
Mizutani T, Kimizuka A, Ruddle K, Ishige N (1987) A chemical analysis of fermented fish products and discussion of fermented
flavors in Asian cuisines. In: Atsushi N (ed) Bulletin of the national museum of ethnology, vol 12. Osaka, Japan, pp 801–864
Nirmal NP, Benjakul S (2009) Effect of ferulic acid on inhibition of polyphenoloxidase and quality changes of Pacific white
shrimp (Litopenaeus vannamei) during iced storage. Food Chem 116:323–331
Panyam D, Kilara A (1996) Enhancing the functionality of food proteins by enzymatic modification. Trends Food Sci Techol
7:120–125
Peralta EM, Hatate H, Kawabe D, Kuwahara R, Wakamatsu S, Yuki T, Murata H (2008) Improving antioxidant activity and
nutritional components of Philippine salt-fermented shrimp paste through prolonged fermentation. Food Chem 111:72–77
Phithakpol B (1993) Fish fermentation technology in Thailand. In: Steinkraus KH, Reilly PJ (eds) Fish fermentation technology.
United Nation University Press, Tokyo, pp 155–166
Phithakpol B, Kasetsat M (1995) The traditional fermented foods of Thailand. Institute of food research and product development,
Kasetsart University, Bangkok
Riebroy S, Benjakul S, Visessanguan W (2008) Properties and acceptability of Som-fug, a Thai fermented fish mince, inoculated
with lactic acid bacteria starters. LWT-Food Sci Technol 41:569–580
Robinson HW, Hogden CG (1940) The biuret reaction in the determination of serum proteins: measurements made by a Duboscq
colorimeter compared with values obtained by the Kjeldahl procedure. J Biol Chem 135:727–731
Sachindra NM, Bhaskar N, Sakhare PZ, Mahendrakar NS, Narasimha Rao D (2001) An improved process for recovery of
carotenoids from crustacean waste. Indian Patent 95/DEL/2001, 31 Jan 2001
Sachindra NM, Bhaskar N, Mahendrakar NS (2006) Recovery of carotenoids from shrimp waste in organic solvents. Waste
Manag 26:1092–1098
Saito A, Regier L (1971) Pigmentation of brook trout (Salvelinus fontinalis) by feeding dried crustacean waste. J Fish Res Board
Can 28:509–512
Sanchez-Camargo AP, Almeida-Meireles MA, B-Lopes LF, Cabral FA (2011) Proximate composition and extraction of
carotenoids and lipids from Brazilian redspotted shrimp waste (Farfantepenaeus paulensis). J Food Eng 102:87–93
Shahidi F, Brown JA (1998) Carotenoid pigments in seafoods and aquaculture. Crit Rev Food Sci Nutr 38:1–67
Sowmya R, Sachindra NM (2012) Evaluation of antioxidant activity of carotenoid extract from shrimp processing by products by
in vitro assays and in membrane model system. Food Chem 134:308–314
Steel RGD, Torrie JH, Dickey DA (1980) In: Steel RGD (ed) Principle and procedure of statistics. McGraw-Hill, New York,
pp 457–490
Stevenson JR (1985) Integument, pigments and hormonal processes. In: Bliss DE, Mantel LH (eds) The biology of Crustacea, vol
9. Academic Press, New York, p 1
Takeungwongtrakul S, Benjakul S (2013) Oxidative stability of shrimp oil-in-water emulsions as affected by antioxidant
incorporation. Int Aquat Res 5:1–12
123
Int Aquat Res (2014) 6:155–166 165

Takeungwongtrakul S, Benjakul S, Santoso J, Trilaksani W, Nurilmala M (2012a) Extraction and stability of carotenoid-
containing lipids from Hepatopancreas of Pacific white shrimp (Litopenaeus vannamei). J Food Process Preserv 71:1–9
Takeungwongtrakul S, Benjakul S, H-Kittikun A (2012b) Lipids from cephalothorax and hepatopancreas of Pacific white shrimp
(Litopenaeus vannamei): compositions and deterioration as affected by iced storage. Food Chem 134:2066–2074
Tamang JP, Kailasapathy K (2010) Fermented foods and beverages of the world. CRC Press Inc, New York
Thai Industrial Standard (1983) Local fish sauce standard. Department of Industry, Bangkok
Todd L (1998) Thin layer chromatography (TLC) system for Natu Rose carotenoids. Natu Rose Tech Bull 3:1–3
Yarnpakdee S, Benjakul S, Kristinsson HG, Maqsood S (2012) Effect of pretreatment on lipid oxidation and fishy odour
development in protein hydrolysates from the muscle of Indian mackerel. Food Chem 135:2474–2482
Yarnpakdee S, Benjakul S, Penjamrus P, Kristinsson HG (2014) Chemical compositions and muddy flavour/odour of protein
hydrolysate from Nile tilapia and broadhead catfish mince and protein isolate. Food Chem 142:210–216
123
166 Int Aquat Res (2014) 6:155–166


![Effects of chemical composition, water and temperature … · Effects of chemical composition, water and temperature on physical properties of continental crust ... 2009], based on](https://static.fdocuments.us/doc/165x107/5b2e98587f8b9a594c8d6f4f/effects-of-chemical-composition-water-and-temperature-effects-of-chemical-composition.jpg)