Chemical, biochemical and electrochemical assays to ... · 1 Chemical, biochemical and...
43
1 Chemical, biochemical and electrochemical assays to evaluate phytochemicals and antioxidant activity of wild plants Lillian Barros, Luis Cabrita, Miguel Vilas Boas, Ana Maria Carvalho, Isabel C.F.R. Ferreira* a CIMO / Escola Superior Agrária, Instituto Politécnico de Bragança, Campus de Santa Apolónia, Apartado 1 172, 5301-855 Bragança, Portugal. * Author to whom correspondence should be addressed (e-mail: [email protected]; telephone +351-273-303219; fax +351-273-325405).
Transcript of Chemical, biochemical and electrochemical assays to ... · 1 Chemical, biochemical and...

1
Chemical, biochemical and electrochemical assays to evaluate
phytochemicals and antioxidant activity of wild plants
Lillian Barros, Luis Cabrita, Miguel Vilas Boas, Ana Maria Carvalho,
Isabel C.F.R. Ferreira*
a CIMO / Escola Superior Agrária, Instituto Politécnico de Bragança, Campus de Santa
Apolónia, Apartado 1 172, 5301-855 Bragança, Portugal.
* Author to whom correspondence should be addressed (e-mail: [email protected];
telephone +351-273-303219; fax +351-273-325405).

2
ABSTRACT
Plants are a source of compounds that may be used as pharmacologically active
products. Cytisus multiflorus, Filipendula ulmaria and Sambucus nigra have been used
as important medicinal plants in the Iberian Peninsula since a long time ago, and are
claimed to have various health benefits. Herein, the phytochemical composition and
antioxidant activity of the mentioned wild medicinal plants were evaluated in vitro
based on chemical, biochemical and electrochemical methods. F. ulmaria was found to
be richest in antioxidant phytochemicals such as phenolics (228 mg GAE/g dw),
flavonoids (62 mg CE/g dw), ascorbic acid (2696 g/g dw) and tocopherols (497 g/g
dw). Accordingly, the antioxidant activity was found to vary in order F. ulmaria > S.
nigra > C. multiflorus irrespective of the analysis method. Electrochemical methods
have proven to be expedite and inexpensive techniques to characterize the antioxidant
activity of plant extracts. The studied wild medicinal flowers could be selected for
processing extracts with health-promoting properties or to be incorporate into functional
beverages or products with potential anti-inflammatory and other properties related to
oxidative stress.
Keywords: Cytisus multiflorus; Filipendula ulmaria; Sambucus nigra; Antioxidants;
Phytochemicals; Chromatography; Electrochemistry

3
1. Introduction
Reactive oxygen species (ROS) such as the superoxide anion, hydrogen peroxide,
hydroxyl, acyl and alkyloxy radicals are highly reactive species that are responsible for
many cell disorders through their action on proteins, lipids and DNA. Along with other
pro-oxidants, such as Cu and Fe ions, ROS act by modifying the oxidative balance
within cells and thus are important mediators of cell injuries. They are assumed to play
an important role in the development of many diseases such as atherosclerosis,
reperfusion injury, cataractogenesis, rheumatoid arthritis, inflammatory disorders,
cancer and the aging process itself (Halliwell, 1996; Gutteridge & Halliwell, 2000;
Valko et al., 2007). Natural antioxidants protect the human body from free radicals,
prevent oxidative stress and associated diseases (López et al., 2007; Ferreira, Barros, &
Abreu, 2009). For these reasons they play a very important role in health care. Plants are
a source of compounds with antioxidant activity such as phenolic acids, flavonoids
including anthocyanins and tannins, vitamins and carotenoids that may be used as
pharmacologically active products (López et al., 2007).
Widespread empirical use of wild plants demands for accurate and reliable information
on their phytochemicals and antioxidant activity, as well as on the potential benefits and
prospective products, such as nutraceutics and phytomedicines.
This is the case of three species that have long been used in the Iberian Peninsula as
important medicinal plants and less often as food or food additives. Cytisus multiflorus
(L'Hér.) Sweet (Fabaceae, white Spanish broom; port: giesta branca) which is native to
the Iberian Peninsula; Filipendula ulmaria (L.) Maxim. (Rosaceae, meadowsweet; port:
rainha-dos-prados) and Sambucus nigra L. (Adoxaceae, elder; port: sabugueiro), both
native throughout most of Europe and Asia. Besides the symbolic and aesthetic value of

4
their whitish flowers, they have been regarded as powerful ingredients for homemade
remedies mainly due to their anti-inflammatory, diuretic and diaphoretic properties,
traditionally recognized by healers and consumers. A sweet tea is made from the dried
flowers of meadowsweet; elderflowers are eaten raw or cooked and are used to prepare
syrup (Camejo-Rodrigues, Ascensão, Bonet, & Vallès, 2003; Carvalho, 2010; Pardo de
Santayana et al., 2007; Pardo de Santayana, 2008).
These plants represent a source of natural antioxidants that might serve as leads for the
development of novel drugs. In fact, several anti-inflammatory, digestive, antinecrotic,
neuroprotective, and hepatoprotective drugs have recently been shown to act through an
antioxidant and/or radical scavenging mechanism as part of their activity (Conforti et
al., 2008). Furthermore, some drugs have various and severe adverse effects. Therefore,
products of natural origin with none or very little side effects are desirable to substitute
chemical therapeutics.
Numerous tests have been developed for measuring the antioxidant capacity of food and
biological samples. However, there is no universal method that can measure the
antioxidant capacity of all samples accurately and quantitatively (Prior, Wu, & Schaich,
2005; Frankel & Finley, 2008). With respect to electrochemical methods, there is
considerable work done on characterizing the behavior of isolated natural products.
Voltammetric in particular methods represent an attractive option for rapid screening of
large numbers of plant samples in the search for novel antioxidants. However, the
technique has not yet found widespread use as compared to established methods such as
the DPPH and Folin–Ciocalteu assays. In fact, there are limited references on the
application of voltammetric techniques on plant or algae extracts, juices, tea and wine,

5
with the aim of assessing their total antioxidant activity (Chevion, Chevion, Chock, &
Beecher 1999; Litescu & Radu, 2000; Kilmartin, Zou, & Waterhouse, 2001).
Herein the antioxidant capacity of these three wild medicinal plants was evaluated by
radical scavenging activity and lipid peroxidation inhibition in vitro assays.
Electrochemical techniques such as cyclic voltammetry and differential pulse
voltammetry were also used to provide a further insight into redox-processes within
plant extracts. These techniques have been tested and developed as an alternative and/or
complementary tool for the evaluation of antioxidant activity, expressed in terms of
“antioxidant power”, due to their quickness, simplicity and low cost (Blasco, Rogerio,
González, & Escarpa, 2005; Cosio, Buratti, Mannino, & Benedetti, 2006; Barros et al.,
2008). The aim of this study was to obtain a complete characterization of the
antioxidant properties of flowers of Spanish broom, meadowsweet and elder and their
chemical composition in phytochemicals and antioxidants, such as vitamins, pigments,
sugars, fatty acids, phenolics and flavonoids.
2. Materials and Methods
2.1. Samples
Inflorescences with flowers fully open and functional of the three species were collected
in May 2009, in the Natural Park of Montesinho, Trás-os-Montes, North-eastern
Portugal, considering the Portuguese folk pharmacopeia and the local medicinal uses.
Voucher specimens are deposited in the Herbário da Escola Superior Agrária de
Bragança (BRESA). Samples were lyophilized (Ly-8-FM-ULE, Snijders, Holland) and
stored in the deep-freezer at -20ºC for subsequent analysis.
6
2.2. Standards and reagents
Acetonitrile 99.9%, n-hexane 95%, ethyl acetate 99.8% and methanol were of HPLC
grade from Lab-Scan (Lisbon, Portugal). The fatty acids methyl ester (FAME) reference
standard mixture 37 (standard 47885-U) was purchased from Sigma (St. Louis, MO,
USA), as also other individual fatty acid isomers, L-ascorbic acid, tocopherols and
sugars standards, trolox (6-hydroxy-2,5,7,8-tetramethylchroman-2-carboxylic acid),
gallic acid and (+)-catechin. Racemic tocol 50 mg/mL, was purchased from Matreya
(PA, USA). 2,2-Diphenyl-1-picrylhydrazyl (DPPH) was obtained from Alfa Aesar
(Ward Hill, MA, USA). Sodium perchlorate monohydrate dihydrate, purity grade, was
purchased from Fluka, and was dried overnight at 30ºC before use. All other chemicals
and solvents were of analytical grade and purchased from chemical suppliers. Ultra-pure
water was obtained from a Milli-Q water purification system (TGI Pure Water Systems,
USA).
2.3. Phytochemicals and antioxidants
2.3.1. Determination of tocopherols
BHT solution in hexane (10 mg/mL; 100 μl) and tocol solution in hexane (internal
standard- IS); 50 μg/mL; 400 μl) were added to the sample prior to the extraction
procedure. The samples (~500 mg) were homogenized with methanol (4 mL) by vortex
mixing (1 min). Subsequently, hexane (4 mL) was added and again vortex mixed for 1
min. After that, saturated NaCl aqueous solution (2 mL) was added, the mixture was
homogenized (1 min), centrifuged (Centorion K24OR- 2003 refrigerated centrifuge; 5
min, 4000g) and the clear upper layer was carefully transferred to a vial. The sample
was re-extracted twice with hexane. The combined extracts were taken to dryness under

7
a nitrogen stream, redissolved in 2 mL of n-hexane, dehydrated with anhydrous sodium
sulphate, filtered through 0.2 µm nylon filters from Whatman, transferred into a dark
injection vial and analysed by HPLC. The equipment consisted of an integrated system
with a pump (Knauer, Smartline system 1000), degasser system (Smartline manager
5000), auto-sampler (AS-2057 Jasco) and a fluorescence detector (FP-2020; Jasco) with
290 and 330 nm as excitation and emission wavelengths, respectively. Data were
analysed using Clarity 2.4 Software (DataApex). The chromatographic separation was
achieved with a Polyamide II (250 x 4.6 mm) normal-phase column from YMC Waters
operating at 30ºC. The mobile phase used was a mixture of n-hexane and ethyl acetate
(70:30, v/v) at a flow rate of 1 mL/min, and the injection volume was 20 µl. The
compounds were identified by chromatographic comparisons with authentic standards.
Quantification was based on the fluorescence signal response, using the internal
standard method. Tocopherol contents in the samples are expressed in µg per g of dry
sample (dw).
2.3.2. Determination of ascorbic acid
A fine powder (20 mesh) of sample (500 mg) was extracted with metaphosphoric acid
(1%, 10 mL) for 45 min at room temperature and filtered through Whatman Nº 4 filter
paper. The filtrate (1 mL) was mixed with 2,6-dichloroindophenol (9 mL) and the
absorbance was measured after 30 min at 515 nm against a blank (Analytikijena 200-
2004 spectrophotometer). Content of ascorbic acid was calculated on the basis of the
calibration curve of authentic L-ascorbic acid (6.0 10-3
-1.0 10-1
mg/mL), and the
results were expressed as mg per 100 g of dry weight.

8
2.3.3. Determination of lipo-soluble pigments
A fine dried powder (150 mg) was vigorously shaken with 10 mL of acetone–hexane
mixture (4:6) for 1 min and filtered through Whatman No. 4 filter paper. The
absorbance of the filtrate was measured at 453, 505, 645 and 663 nm. Content of -
carotene was calculated according to the following equation: -carotene (mg/100 mL) =
0.216 A663 – 1.220 A645 - 0.304 A505 + 0.452 A453; Lycopene (mg/100 mL) =
0.0458 A663 + 0.204 A645 - 0.304 A505 + 0.452 A453; Chlorophyll a (mg/100 mL)
= 0.999 A663 - 0.0989 A645; Chlorophyll b (mg/100 mL) = - 0.328 A663 + 1.77
A645, and further expressed in µg per g of dry weight (dw).
2.3.4. Determination of sugars
Dried sample powder (1.0 g) was spiked with melezitose (IS, 5 mg/mL), and was
extracted with 40 mL of 80% aqueous ethanol at 80 ºC for 30 min. The resulting
suspension was centrifuged at 15,000 g for 10 min. The supernatant was concentrated at
60 ºC under reduced pressure (rotary evaporator Büchi R-210) and defatted three times
with 10 mL of ethyl ether, successively. After concentration at 40 ºC, the solid residues
were dissolved in water to a final volume of 5 mL and filtered through 0.2 µm nylon
filters from Whatman. Soluble sugars were determined by HPLC coupled to a refraction
index (RI) detector (Knauer Smartline 2300). The chromatographic separation was
achieved with a Eurospher 100-5 NH2 column (4.6 x 250 mm, 5 µm, Knauer) operating
at 30ºC (7971 R Grace oven). The mobile phase was acetonitrile/deionized water, 7:3
(v/v) at a flow rate of 1.0 mL/min. Sugar identification was made by comparing the
relative retention times of sample peaks with standards. Quantification was made by

9
internal normalization of the chromatographic peak area and the results are expressed in
mg per g of dry weight (dw).
2.3.5. Determination of fatty acids
Fatty acids (obtained after Soxhlet extraction) were methylated with 5 mL of
methanol:sulphuric acid:toluene 2:1:1 (v:v), during at least 12 h in a bath at 50 ºC and
160 rpm; then 3 mL of deionised water were added, to obtain phase separation; the
FAME were recovered with 3 mL of diethyl ether by shaking in vortex, and the upper
phase was passed through a micro-column of sodium sulphate anhydrous, in order to
eliminate the water; the sample was recovered in a vial with Teflon, and before injection
the sample was filtered with 0.2 µm nylon filter from Whatman. The fatty acid profile
was analyzed with a DANI model GC 1000 instrument equipped with a split/splitless
injector, a flame ionization detector (FID) and a Macherey-Nagel column (30 m x 0.32
mm ID x 0.25 µm df). The oven temperature program was as follows: the initial
temperature of the column was 50 ºC, held for 2 min, then a 10ºC/min ramp to 240 ºC
and held for 11 min. The carrier gas (Hydrogen) flow-rate was 4.0 mL/min (0.61 bar),
measured at 50 ºC. Split injection (1:40) was carried out at 250 ºC. For each analysis 1
µl of the sample was injected in GC. Fatty acid identification was made by comparing
the relative retention times of FAME peaks from samples with standards. The results
were recorded and processed using CSW 1.7 software (DataApex 1.7) and expressed in
relative percentage of each fatty acid.
2.3.6. Determination of phenolics
A fine dried powder (20 mesh; ~1g) was stirred with 50 mL of methanol at 25 ºC at 150
10
rpm for 1 h and filtered through Whatman No. 4 paper. The residue was then extracted
with one additional 50 mL portion of methanol. The combined methanolic extracts were
evaporated at 35ºC under reduced pressure, re-dissolved in methanol at 20 mg/mL
(stock solution), and stored at 4 ºC for further use. For phenolics determination, an
aliquot of the extract solution (0.125 mg/mL; 1 mL) was mixed with Folin-Ciocalteu
reagent (5 mL, previously diluted with water 1:10 v/v) and sodium carbonate (75 g/L, 4
mL). The tubes were vortexed for 15 s and allowed to stand for 30 min at 40 °C for
colour development. Absorbance was then measured at 765 nm. Gallic acid was used to
calculate the standard curve (9.410-3
-1.510-1
mg/mL), and the results were expressed
as mg of gallic acid equivalents (GAE) per g of dry weight (dw).
2.3.7. Determination of flavonoids
For flavonoids, an aliquot of the extract solution (0.125 mg/mL; 0.5 mL) was mixed
with distilled water (2 mL) and subsequently with NaNO2 solution (5%, 0.15 mL). After
6 min, AlCl3 solution (10%, 0.15 mL) was added and allowed to stand further 6 min,
thereafter, NaOH solution (4%, 2 mL) was added to the mixture. Immediately, distilled
water was added to bring the final volume to 5 mL. Then the mixture was properly
mixed and allowed to stand for 15 min. The intensity of pink colour was measured at
510 nm. (+)-Catechin was used to calculate the standard curve (4.5 10-3
- 2.9 10-1
mg/mL) and the results were expressed as mg of (+)-catechin equivalents (CE) per g of
dry weight (dw).
2.4. Chemical and biochemical assays to evaluate antioxidant activity
2.4.1. DPPH radical-scavenging activity

11
The reaction mixture in each one of the 96-wells (ELX800 Microplate Reader (Bio-Tek
Instruments, Inc) consisted of one of the different concentrations of the extracts (0.03–
1.00 mg/mL; 30 μl) and aqueous methanolic solution (80:20 v/v, 270 μl) containing
DPPH radicals (6x10⁻⁵
mol/L). The mixture was left to stand for 60 min in the dark. The
reduction of the DPPH radical was determined by measuring the absorption at 515 nm.
The radical scavenging activity (RSA) was calculated as a percentage of DPPH
discolouration using the equation: % RSA = [(ADPPH-AS)/ADPPH] 100, where AS is the
absorbance of the solution when the sample extract has been added at a particular level,
and ADPPH is the absorbance of the DPPH solution. The extract concentration providing
50% of radicals scavenging activity (EC50) was calculated from the graph of RSA
percentage against extract concentration. Trolox was used as standard.
2.4.3. Reducing power
The different concentrations of the extracts (0.03–1.00 mg/mL; 0.5 mL) were mixed
with sodium phosphate buffer (200 mmol/l, pH 6.6, 0.5 mL) and potassium ferricyanide
(1% w/v, 0.5 mL). The mixture was incubated at 50 ºC for 20 min, and trichloroacetic
acid (10% w/v, 0.5 mL) was added. The mixture (0.8 mL) was transferred to 48-wells
plates, and deionised water (0.8 mL) and ferric chloride (0.1% w/v, 0.16 mL) were
added. The absorbance was measured at 690 nm in the Microplate Reader mentioned
above. The extract concentration providing 0.5 of absorbance (EC50) was calculated
from the graph of absorbance at 690 nm against extract concentration. Trolox was used
as standard.
2.4.4. Inhibition of -carotene bleaching

12
A solution of -carotene was prepared by dissolving -carotene (2 mg) in chloroform
(10 mL). Two millilitres of this solution were pipetted into a round-bottom flask. After
the chloroform was removed at 40ºC under vacuum, linoleic acid (40 mg), Tween 80
emulsifier (400 mg), and distilled water (100 mL) were added to the flask with vigorous
shaking. Aliquots (4.8 mL) of this emulsion were transferred into different test tubes
containing different concentrations of the extracts (0.03–1.00 mg/mL; 0.2 mL). The
tubes were shaken and incubated at 50ºC in a water bath. As soon as the emulsion was
added to each tube, the zero time absorbance was measured at 470 nm using a
spectrophotometer. A blank, devoid of -carotene, was prepared for background
subtraction. β-Carotene bleaching inhibition was calculated using the following
equation: (-carotene content after 2h of assay/initial -carotene content) 100. The
extract concentration providing 50% antioxidant activity (EC50) was calculated by
interpolation from the graph of β-carotene bleaching inhibition percentage against
extract concentration. Trolox was used as standard.
2.4.5. Inhibition of lipid peroxidation using thiobarbituric acid reactive substances
(TBARS)
Brains were obtained from pig (Sus scrofa) of body weight ~150 Kg, dissected and
homogenized with a Polytron in ice-cold Tris–HCl buffer (20 mM, pH 7.4) to produce a
1:2 (w/v) brain tissue homogenate which was centrifuged at 3000g for 10 min. An
aliquot (0.1 mL) of the supernatant was incubated with the different concentrations of
the extracts (0.03–1.00 mg/mL; 0.2 mL) in the presence of FeSO4 (10 M; 0.1 mL) and
ascorbic acid (0.1 mM; 0.1 mL) at 37ºC for 1 h. The reaction was stopped by the
addition of trichloroacetic acid (28% w/v, 0.5 mL), followed by thiobarbituric acid

13
(TBA, 2%, w/v, 0.38 mL), and the mixture was then heated at 80 ºC for 20 min. After
centrifugation at 3000g for 10 min to remove the precipitated protein, the colour
intensity of the malondialdehyde (MDA)-TBA complex in the supernatant was
measured by its absorbance at 532 nm. The inhibition ratio (%) was calculated using the
following formula: Inhibition ratio (%) = [(A – B)/A] x 100%, where A and B were the
absorbance of the control and the compound solution, respectively. The extract
concentration providing 50% lipid peroxidation inhibition (EC50) was calculated from
the graph of TBARS inhibition percentage against extract concentration. Trolox was
used as standard.
2.5. Electrochemical assays to evaluate antioxidant activity
2.5.1. Sample preparation
A fine lyophilized powder of plant flowers (20 mesh; 1g) was extracted with 50 mL
methanol in the refrigerator (~4 ºC) for 24 h, in the dark and without stirring. After
extraction, samples were filtered in a glass funnel through glass wool. For each sample,
an aliquot of 10 mL of filtered extract was transferred to a vial containing NaClO4 so
that the final concentration of support electrolyte was 0.1M. Solutions were
immediately analyzed.
2.5.2. Instrumentation
Cyclic voltammetry (CV) and differential pulse voltammetry (DPV) measurements
were performed on an Autolab PGSTAT 302 potentiostat/galvanostat using a closed
standard three electrode cell. A glassy carbon electrode (MF-2012, = 3.0 mm, BAS
Inc.) was used as working electrode and a Pt foil as counter electrode. All potentials

14
refer to an Ag/AgCl 3 M KCl (+207mV vs SHE) reference electrode (Metrohm). Prior
to use, the working electrode was cleaned through physical, chemical and
electrochemical treatment: i) it was polished against a Master-Tex (Beuhler) polishing
pad wetted with an aqueous suspension of 0.3 m alumina (Beuhler), ii) sonicated in
HCl 6 M during 1 minute, and then in methanol, and iii) submitted to an anodic current
at 2.0V for 60s. The electrode was thoroughly rinsed with deionised water and methanol
between every step, and dried blotted. This is important because polyphenolic
compounds tend to strongly adsorb at the surface of glassy carbon electrodes.
2.5.3. Procedure
All extracts and standard compound were studied in methanol 0.1 M NaClO4. All the
solutions were analysed immediately after preparation and the electrochemical
responses recorded after immersion of the glassy carbon electrode, to minimize
adsorption of species onto the electrode surface prior to run. Cyclic voltammetry (CV)
was used to characterize the electrochemical responses between 0.5 and +1.5 V, at 100
mV/s, whereas the antioxidant power was evaluated by differential pulse voltammetry
(DPV), using the following operating conditions: 60 mV pulse amplitude and 20 mV/s
scan rate.
2.5.4. Quantification
A calibration curve was prepared by plotting the concentration of ascorbic acid
solutions between 0.05 and 10.00 mg/mL against the current intensity of the respective
DPV signals measured at peak maxima. This curve was found to be linear in the range
0.05 – 1.32 mg/mL. The analytical signal of samples (current density) was measured

15
between peak maxima and the baseline, defined as the tangent between the lowest and
the highest potential valley. This current density was converted to equivalents of
ascorbic acid (mg/mL), and expressed in terms of equivalents of ascorbic acid (AA) per
gram of plant material (dw), assuming the total volume used in the extraction procedure
(50 mL) and the sample weight. The sum of the values calculated at peak maxima for
each electrochemical process was used to express the Total Electrochemical Antioxidant
Power (TEAP) of the plant material.
2.6. Statistical analysis
The results are expressed as mean values and standard deviation (SD). The results were
analyzed using one-way analysis of variance (ANOVA) followed by Tukey’s HSD Test
with α = 0.05. This treatment was carried out using SPSS v. 16.0 programm.
3. Results and discussion
3.1. Phytochemicals and antioxidants
The content in vitamins (tocopherols and ascorbic acid) and pigments (carotenoids and
chlorophylls) of the three studied medicinal plants are given in Table 1. Ascorbic acid
was the most abundant vitamin (> 1729 µg/g dw) and α-tocopherol was the major
tocopherol in all the samples (> 313 µg/g); F. ulmaria was the richest sample in α-
tocopherol; its tocopherols profile is shown in Figure 1. δ-Tocopherol was not detected
in S. nigra and was the minor compound in the other two plants. Flowers of F. ulmaria
and C. multiflorus presented the highest content of ascorbic acid (2696.26 µg/g and
2674.78 µg/g, respectively) and tocopherols (496.61 µg/g and 482.77 µg/g,
respectively), without significant differences, p<0.05, between them. Kaack & Austed

16
(1998) reported the quantification of ascorbic acid in fresh fruits of S. nigra (60 to 250
μg/g), but nothing is reported about the concentration of ascorbic acid or tocopherols in
the flowers of the three studied plants.
Vitamin E (tocopherols) and vitamin C (ascorbic acid) are naturally-occurring
antioxidant nutrients that play important roles in health by inactivating harmful free
radicals produced through normal cellular activity and from various stressors (Chew,
1995). Cooperative interactions exist among vitamin C and vitamin E; they interact
synergistically at the membrane-cytosol interface to regenerate membrane-bound
oxidized vitamin E. The interactions among these antioxidants are very important in
protecting cells because the concentration of each antioxidant alone may not be
adequate to effectively protect cells from lipid peroxidation (Chew, 1995; Nagaoka,
Kakiuchi, Ohara, & Mukai, 2007). The presence of both vitamins could explain the
empirical uses of the studied plants in oxidative stress-related diseases as previously
discussed.
Carotenoids and chlorophylls were found in all the studied medicinal plants, Table 1.
The concentrations of β-carotene (53.85 µg/g dw), lycopene (11.28 µg/g) and
chlorophyll b (51.61 µg/g) were higher in C. multiflorus flowers. F. ulmaria revealed
the highest levels of chlorophyll a (78.15 µg/g). Carotenoids are amongst nature’s most
widespread pigments and have also received substantial attention because of both their
provitamin and antioxidant roles. The peroxyl radicals (ROO•) formed from lipids
(especially polyunsaturated phospholipids) are very damaging to cells. The extensive
systems of double bonds make carotenoids susceptible to attack by peroxyl radicals,
resulting in the formation of inactive products (Rao & Rao, 2007). Chlorophyll and its

17
derivatives are also known to have antioxidant activity, being associated with reduced
risks of diseases induced by free radicals such as certain types of cancers. The function
of chlorophyll in animals is suggested to be inhibition of lipid peroxidation and
protection of mitochondria from oxidative damage induced by various free-radicals
(Lanfer-Marquez, Barros, & Sinnecker, 2005). Therefore, these pigments could be very
important antioxidants.
The three wild medicinal plants presented glucose, fructose, sucrose and trehalose as
main sugars (Table 1). Fructose predominates in C. multiflorus, trehalose was the most
abundant sugar in F. ulmaria and glucose predominates in S. nigra. C. multiflorus
flowers revealed the highest total sugars content (137.94 mg/g dw), with the highest
levels of glucose (42.73 mg/g) and fructose (69.27 mg/g), both of them reducing sugars.
The sugars profile of this sample is shown in Figure 2. Veberic et al. (2009) reported
the concentrations of individual sugars in fruits of S. nigra (68.53 to 104.16 mg/g fw)
with fructose, glucose and sucrose as main sugars. Other authors described the levels of
glucose (2.02 g/l) and sucrose (1.79 g/l) in concentrated juices of S. nigra fruits
(Sadilova, Stintzing, Kammerer, & Carle, 2009). Nonetheless, nothing is reported about
their concentrations in any of the flowers studied herein.
The results for fatty acid composition, total saturated fatty acids (SFA),
monounsaturated fatty acids (MUFA) and polyunsaturated fatty acids (PUFA) of the
three wild medicinal plants are shown in Table 2. Twenty four fatty acids were
identified and quantified. The major fatty acids found were α-linolenic acid (C18:3n3;
25 to 33%) followed by linoleic acid (C18:2n6; 18 to 25%) contributing to the
prevalence of PUFA in all the samples. Some authors showed that linoleic acid

18
(C18:2n6), conjugated linoleic acid, and linoleic methyl ester have antioxidative activity
and proposed this as a possible explanation for anticarcinogenic and antiatherogenic
effects. Nevertheless, additional studies are necessary to show their free radical
scavenging activity in different radical systems and under physiological conditions, and
to determine whether there is any link between their radical scavenging properties and
their biological effects (Fagali & Catalá, 2008).
Palmitic acid was the most abundant SFA in all samples (11 to 18%). This fatty acid
was the major compound found in pollen of S. nigra (35.69%), followed by C18:1n9
(14.26%), C18:2n6 (12.79%) and C18:3n3 (12.48%) (Stránský, Valterová, & Fiedler,
2001). Despite the similarities in the most abundant fatty acids in the pollen studied by
those authors and in the flowers used in the present work, there are some differences in
the levels found for each compound. The fatty acids profile of S. nigra flowers is shown
in Figure 3. As far as we know, this is the first report about the fatty acid composition
in flowers of C. multiflorus and F. ulmaria.
Phenolic compounds are also important antioxidants found in the studied plants (45.62-
92.73 mg GAE/g dw; Table 3); Filipendula ulmaria flowers revealed the highest
content in phenolics and flavonoids. This sample gave much higher total phenolic
content than methanolic extracts of leaves of meadowsweet from Greece (7.2 mg/g dw)
(Proestos, Boziaris, Kapsokefalou, & Komaitis, 2008) and aerial parts from Finland
(26.8 mg/g dw) (Kahkonen et al., 1999), and of aqueous extracts of aerial parts (flowers,
stems and leaves) from Ireland submitted to different drying treatments (110 to 119
mg/g) (Harbourne, Marete et al., 2009), temperatures (39 to 63 mg/g) and pH (43 to 57
mg/g) (Harbourne, Jacquier et al., 2009). Flavonoids have been extracted from

19
meadowsweet leaves using hot aqueous ethanol (70%) or methanol in a Soxhlet
apparatus, and from meadowsweet flowers using hydro-alcoholic solutions and these
extracts were found to contain up to 6% total flavonoids. Leaves and flowers of F.
ulmaria are known to contain phenolic acids (glycoside derivatives of salicylaldehyde
and methyl salicylate), flavonols (glycosides of kaempferol and quercetin) and
ellagitannins (rugosins and tellimagradins) (Scheer & Wichtl, 1987; Calliste, Trouillas,
Allais, Simon, & Duroux, 2001; Fecka, 2009; Harbourne, Marete, Jacquier, &
O’Riordan, 2009; Harbourne, Jacquier, & O’Riordan, 2009). Infusions of its flowers and
strained decoctions of its underground rhizomes are highly recommended to treat
pneumonia, flu, urinary tract infections, rheumatism and headache (Carvalho, 2010;
Pardo de Santayana, 2008). In fact,
meadowsweet has been traditionally used to treat
various ailments due to their antipyretic, diuretic, analgesic and anti-inflammatory
properties.
Elderberry, the berry of S. nigra (19.5 mg GAE/g fw) (Wu, Gu, Prior, & McKay, 2004)
and particularly elderberry wine has been found to contain higher concentrations of
phenolics than red wine (1753 mg GAE/L) (Rupasinghe & Clegg, 2007). The
anticancerogenic and antioxidative effect of elderberry juice was also attributed to the
high content of anthocyanins and other flavonoids (Kaack & Austed, 1998). A low-
calorie juice cocktail (including elderberry) rich in anthocyanins was successfully used
in a weight loss program in obese men (Chrubasik et al., 2008). Furthermore, the
consumption of an elderberry juice induces a significant rise in plasma antioxidant
capacity and a significant decrease in plasma malondialdehyde in vivo (Netzel et al.,
2002; Netzel et al., 2005).

20
Flowers of S. nigra have been found to contain hydroxycinamic acids, mono- and di-
caffeoylquinic acid derivatives, flavones and flavonol glycosides (Dawidowicz,
Wianowska, Gawdzik, & Smolarz, 2003; Christensen, Kaack, & Fretté, 2008; Rieder,
Müller, Guttenberger, & Bucar, 2008). Elderflower is recommended by the German
Commission E for upper respiratory tract infections for its secretolytic effect (Chrubasik
et al., 2008). Their pharmacological properties result, among other things, from the
presence of flavonoids (Dawidowicz, Wianowska, & Baraniak, 2006). Furthermore,
elderflower extracts are used as beverage and food flavourings (Veberic, Jakopic,
Stampar, & Schmitzer, 2009). Flu and other health related remedies were developed
using elderflowers (Kaack & Austed, 1998). Different European ethnobotanical surveys
document that elder can satisfy several traditional needs being the medicinal one of the
most important (Vallès, Bonet, & Agelet, 2004; Carvalho, 2010; Neves, Matosa,
Moutinho, Queiroz, & Gomes, 2009; Parada, Carrió, Bonet, & Vallès, 2009). The
flower heads are used in infusions to treat respiratory system affections, such as
bronchitis, cough, and cold infections; they are also a very good tonic for diabetes,
blood cleanser and stomachic. Externally, the decoctions are used in poultices to ease
pain and reduce inflammation or as an ointment to heal chilblains, burns and wounds.
Sometimes elder infusions are seen as a panacea (Carvalho, 2010).
Cytisus sp. pl. have been found to contain C-glycosyl flavones (6´´-O-acetyl scoparin),
flavonol glycosides (rutin, quercitin, kaempferol, isorhamnetin, quercitrin) and
isoflavones (genistein, sarothamnoside) (Brum-Bousquet, Lallemand, Tillequin,
Fougeras, & Delaveau 1981; Viscardi, Reynaud, & Raynaud,1984). The use Cytisus
multiflorus dried flowers’ infusion to control metabolic and endocrine system disorders

21
(such as cholesterol and diabetes), hypertension, rheumatism and headache is
widespread in Portugal (Carvalho, 2010; Pardo de Santayana et al., 2007).
3.2. Antioxidant activity
Due to the chemical diversity of antioxidant compounds present in natural samples, it is
unrealistic to separate each antioxidant component and study it individually. In addition,
levels of single antioxidants do not necessarily reflect their total antioxidant capacity
because of the possible synergistic interactions among the antioxidant compounds in a
food mixture (Magalhães, Segundo, Reis, & Lima, 2008). Therefore, we evaluated the
antioxidant properties of the entire extracts obtained from flowers of the three medicinal
plants.
All the samples showed antioxidant activity in the order of F. ulmaria > S. nigra > C.
multiflorus (Table 3). Flowers of F. ulmaria (meadowsweet) gave the lowest EC50
values in all the assays (lower than 0.1 mg/mL). Particularly for DPPH scavenging
activity assay, this studied sample showed better results (50% at 0.047 mg/mL) than
flowering tops of F. ulmaria from France (35.0% for water fraction and 59.4% for
methanol fraction at 0.1 mg/mL) (Calliste et al., 2001). Dawidowicz et al. (2006)
reported that flower extracts of S. nigra from Poland exhibited higher antioxidant
activity (measured by DPPH neutralizing activity and β-carotene bleaching inhibition
assays) than its berries and leaves extracts.
Significantly negative linear correlations were established between the phenolics and
flavonoids content, and EC50 values of DPPH scavenging activity (y = 0.0093x +
2.0152; R2 0.7348 for phenolics and y = 0.0327x + 1.9331; R
2 0.7941 for flavonoids;
p0.001), reducing power (y = 0.0028x + 0.6681; R2 0.8197 for phenolics and y =

22
0.0099x + 0.6398; R2 0.8681for flavonoids; p0.001), β-carotene bleaching inhibition
(y = 0.0012x + 0.3529; R2 0.7395 for phenolics and y = 0.0044x + 0.3419; R
2 0.8004
for flavonoids, p0.001) and TBARS inhibition (y = 0.0012x + 0.2971; R2 0.7145 for
phenolics and y = 0.0041x + 0.2874; R2 0.7771 for flavonoids, p0.001). This proves
that F. ulmaria with the highest phenols and flavonoids contents is the most efficient in
antioxidant activity (with the lowest EC50 values). The correlations were slightly more
significant for flavonoids than for phenolics, and the highest determination coefficients
were obtained for reducing power assay.
The cyclic voltammograms (CV) observed for the three flower extracts revealed two
regions in the potential window under study, Figure 4a. In the range between -0.5 and
+0.2V samples were electrochemically silent, with only S. nigra showing a low
intensity reduction process on the reverse scan at potentials below 0V. The oxidative
current density started then to rise at potentials near 0.2 V, showing maximum intensity
around 0.6 V, followed then by a second oxidation process around 1V. It is also
possible to observe some other minor oxidation processes leading to wave broadening
or shoulders. This seems to indicate the presence of several electroactive species in the
extracts. Peak potentials for the different samples are presented in Table 4. F. ulmaria
showed a first oxidation process (shoulder) at lower potentials than other samples. This
could be explained due to the presence of more easily oxidizable species in this extract.
Additionally, the second oxidation process, common to all samples, presents the highest
current density in this plant. In fact, F. ulmaria showed the highest content in phenolics,
flavonoids, total tocopherols and ascorbic acid (Tables 1, 2 and 3). Moreover, it
consistently showed stronger antioxidant activity as measured by DPPH, reducing

23
power, β-carotene bleaching and TBARS methods (Table 3). This is in agreement with
the expectation that samples with lower oxidation potentials and higher oxidative
currents densities should display higher antioxidant activities. Based on CV, the
electrochemical behaviour corroborated the greater antioxidant activity found for F.
ulmaria, however, the comparison for S. nigra and C. multiflorus, is somehow
ambiguous since the peak potential is slightly lower for the latter, but S. nigra present a
higher current density.
The differential pulse voltammogram (DPV), Figure 4b, follows a pattern similar to
that of CV: a first region between -0.5 and +0.2V with no significant electrochemical
activity, followed by an increase in oxidative current density with maxima around 0.6
and 1V. In this second region of DPV, however, it was possible to resolve more
oxidation processes compared to CV, with F. ulmaria displaying at least 6 distinct
oxidation waves, whereas C. multiflorus and S. nigra showed 5 and 3 processes,
respectively. Again, F. ulmaria showed a rise in current density at lower potentials than
other samples, with S. nigra being the last. In terms of intensity it is C. multiflorus that
show the lowest current density for the common oxidation process at 0.5 V, with the
other two samples presenting a similar maximum value. This profile is not standard for
the entire voltamogram, with the oxidative current density of C. multiflorus surpassed
that of F. ulmaria at potentials around 0.9V.
In order to quantify the electrochemical antioxidant activity of samples we compared
the current density of all oxidation peaks (peak height) with that of ascorbic acid (AA),
which shows an irreversible oxidation peak around 0.86V in methanol solutions
containing 0.1 M NaClO4. Figures 5a and 5b show the DPV voltammograms and the
variation of peak current density plotted against AA concentration, respectively, where

24
a linear correlation was found in the range 0.05 to 1.02 mg/mL. This allows expressing
the contribution of each oxidation process to the electrochemical antioxidant activity in
terms of equivalents of ascorbic acid.
Table 5 presents the quantitative results for all the resolved oxidation peaks obtained
from DPV for the three samples under study. F. ulmaria shows, at lower oxidation
potential, the most intense antioxidant processes, however, we cannot exclude the
possible contribution of other oxidation process to the antioxidant activity. In fact, the
capability for the sample to act as oxidative protector arises from the existence of easily
oxidise species (low oxidation potential) and their amount, but as well from the
presence of other less oxidisable species, providing that the substance to be protect have
an higher oxidation potential. To account the contributions of all species, we expressed
the sum of AA equivalents as “Total Electrochemical Antioxidant Power”, TEAP. The
calculated TEAP values were significantly lower for C. multiflorus, as found with the
other antioxidant assays, but similar for F. ulmaria and S. nigra, suggesting that, for this
species, the presence of the easily oxidise species mentioned above could make the
difference.
4. Conclusions
Flowers of F. ulmaria, S. nigra and C. multiflorus were analysed for their
phytochemical composition, and antioxidant activities were evaluated based of
chemical, biochemical and electrochemical assays. The overall antioxidant activity of
samples was found to vary in order F. ulmaria > S. nigra > C. multiflorus, irrespective
of the method employed. These results were found to be in agreement with their content
in antioxidants, especially total phenolics, flavonoids and ascorbic acid. This suggests

25
that the electrochemical methods such as CV and DPV employed in this study are
suitable for fast and inexpensive screening, profiling and quantification of antioxidant
activity in complex plant matrices. These methods may become portable and enable
rapid in-field analysis. Moreover, they are free from laborious sample preparation, use a
minimum of reagents because they are based on an intrinsic property of the analyte
(electroactive) and are applicable to non-transparent samples (Blasco et al., 2005).
These results also indicate there may be a basis for the ethnopharmacological use of
these wild medicinal plants related to their antioxidant and phytochemical composition.
As such, that the studied extracts could be suitable for incorporation into functional
beverages or products with potential anti-inflammatory and other health-promoting
properties related to oxidative stress.
Acknowledgements
The authors are grateful to the Foundation for Science and Technology (FCT, Portugal)
for financial support to the research centre CIMO. L. Barros thanks FCT, POPH-QREN
and FSE for her grant (SFRH/BPD/4609/2008). L. Cabrita thanks Soraia Falcão for
assistance with the electrochemical experiments.
References
Barros, L., Falcão, S., Baptista, P., Freire, C., Vilas-Boas, M., & Ferreira, I.C.F.R.
(2008). Antioxidant activity of Agaricus sp. mushrooms by chemical, biochemical
and electrochemical assays. Food Chemistry, 111, 61-66.

26
Blasco, A.J., Rogerio, M.C., González, M.C., & Escarpa, A. (2005). “Electrochemical
Index” as a screening method to determine “total polyphenolics” in foods: A
proposal. Analytical Chimica Acta, 539, 237-244.
Brum-Bousquet, M., Lallemand, J.Y., Tillequin, F., Fougeras, P., & Delaveau, P. (1981).
Isolation and properties of sarothamnoside, a novel isoflavone glycoside from
various Sarothamnus species. Planta Medica, 43, 367-374.
Calliste, C.-A., Trouillas, P., Allais, D.-P., Simon, A., & Duroux, J.L. (2001). Free
radical scavenging activities measured by electron spin resonance spectroscopy
and B16 cell antiproliferative behaviors of seven plants. Journal of Agricultural
and Food Chemistry, 49, 3321-3327.
Camejo-Rodrigues, Ascensão, L., Bonet, M.À., & Vallès, J. (2003). An ethnobotanical
study of medicinal and aromatic plants in the Natural Park of "Serra de São
Mamede" (Portugal). Journal of Ethnopharmacology, 89, 199–209.
Carvalho, A.M. (2010). Plantas y sabiduría popular del Parque Natural de Montesinho.
Un estudio etnobotánico en Portugal. Biblioteca de Ciencias 35. Madrid: Consejo
Superior de Investigaciones Científicas.
Chevion, S., Chevion, M., Chock, M.B., & Beecher, G.R. (1999). Antioxidant capacity
of edible plants: Extraction protocol and direct evaluation by cyclic voltammetry.
Journal of Medicinal Food, 2, 1-10.
Chew, B.P. (1995). Antioxidant vitamins affect food animal immunity and health.
Journal of Nutrition, 125, 1804S-1808S.
Chrubasik, C., Maier, T., Dawid, C., Torda, T., Schieber, A., Hofmann, T., & Chrubasik,
S. (2008). An observational study and quantification of the actives in a supplement

27
with Sambucus nigra and Asparagus officinalis used for weight reduction.
Phytotherapy Research, 22, 913–918.
Conforti, F., Sosa, S., Marrelli, M., Menichini, F., Statti, G.A., Uzunov, D., Tubaro, A.,
Menichini, F., & Loggia, RD. (2008). In vivo anti-inflammatory and in vitro
antioxidant activities of Mediterranean dietary plants. Journal of
Ethnopharmacology, 116, 144-151.
Cosio, M.S., Buratti, S., Mannino, S., & Benedetti, S. (2006). Use of an electrochemical
method to evaluate the antioxidant activity of herb extracts from the Labiatae
family. Food Chemistry, 97, 725-731.
Christensen, L.P., Kaack, K.V., & Fretté, X. (2008). Selection of elderberry (Sambucus
nigra L.) genotypes best suited for the preparation of elderflower extracts rich in
flavonoids and phenolic acids. Euopean Food Research and Technology, 27, 293-
305.
Dawidowicz, A.L., Wianowska, D., & Baraniak, B. (2006). The antioxidant properties of
alcoholic extracts from Sambucus nigra L. (antioxidant properties of extracts).
LWT, 39, 308-315.
Dawidowicz, A.L., Wianowska, D., Gawdzik, J., & Smolarz, D.H. (2003). Optimization
of ASE conditions for the HPLC determination of rutin and isoquercitrin in
Sambucus nigra L. Journal of Liquid Chromatography and Related Technologies,
26, 2381-2397.
Fagali, N., & Catalá, A. (2008). Antioxidant activity of conjugated linoleic acid isomers,
linoleic acid and its methyl ester determined by photoemission and DPPH•
techniques. Biophysical Chemistry, 137, 56-62.
28
Fecka, I. (2009). Qualitative and quantitative determination of hydrolysable tannins and
other polyphenols in herbal products from meadowsweet and dog rose.
Phytochemical Analysis, 20, 177-190.
Ferreira, I.C.F.R., Barros, L., & Abreu, R.M.V. (2009). Antioxidants in wild
mushrooms. Current Medicinal Chemistry, 16, 1543-1560.
Frankel, E.N., & Finley, J.W. (2008). How to standardize the multiplicity of methods to
evaluate natural antioxidants. Journal of Agricultural and Food Chemistry, 56,
4901-4908.
Gutteridge, J.M., & Halliwell, B. (2000). Free radicals and antioxidants in the year 2000.
A historical look to the future. Annuals of New York Academic Sciences, 899, 136-
147.
Halliwell, B. (1996). Antioxidants in human health and disease. Annual Reviews of
Nutrition, 16, 33-50.
Harbourne, N., Marete, E., Jacquier, J.C., & O’Riordan, D. (2009). Effect of drying
methods on the phenolic constituents of meadowsweet (Filipendula ulmaria) and
willow (Salix alba). LWT, 42, 1468-1473.
Harbourne, N., Jacquier, J.C., & O’Riordan, D. (2009). Optimisation of the aqueous
extraction conditions of phenols from meadowsweet (Filipendula ulmaria L.) for
incorporation into beverages. Food Chemistry, 116, 722–727.
Kaack, K., & Austed, T. (1998). Interaction of vitamin C and flavonoids in elderberry
(Sambucus nigra L.) during juice processing. Plant Foods for Human Nutrition,
52, 187–198.

29
Kahkonen, M.P., Hopia, A.I., Vuorela, H.J., Rauha, J.P., Pihlaja, K., Kujala, T.S., &
Heininen, M. (1999). Antioxidant activity of plant extracts containing phenolic
compounds. Journal of Agricultural and Food Chemistry, 47, 3954–3962.
Kilmartin, P.A., Zou, H., & Waterhouse, A.L. (2001). A cyclic voltammetry method
suitable for characterizing antioxidant properties of wine and wine phenolics.
Journal of Agricultural and Food Chemistry, 49, 1957-1965.
Lanfer-Marquez, U.M., Barros, R.M.C., & Sinnecker, P. (2005). Antioxidant activity of
chlorophylls and their derivatives. Food Research International, 38, 885-891.
Litescu, S.C., & Radu, GL. (2000). Estimation of the antioxidative properties of
tocopherols. European Food Research and Technology, 211, 218-221.
López, V., Akerreta, S., Casanova, E., García-Mina, J.M., Cavero, R.Y., & Calvo, M.I.
(2007). In vitro antioxidant and anti-rhizopus activities of Lamiaceae herbal
extracts. Plant Foods for Human Nutrition, 62, 151-155.
Magalhães, L.M., Segundo, M.A., Reis, S., & Lima, J.L.F.C. (2008). Methodological
aspects about in vitro evaluation of antioxidant properties. Anaytical Chimica Acta,
613, 1-19.
Nagaoka, S., Kakiuchi, T., Ohara, K., & Mukai, K. (2007). Kinetics of the reaction by
vitamin E is regenerated which natural by vitamin. Chemistry and Physics of
Lipids, 146, 26-32.
Netzel, M., Strass, G., Herbst, M., Dietrich, H., Bitsch, R., Bitsch, I., & Frank, T. (2005).
The excretion and biological antioxidant activity of elderberry antioxidants in
healthy humans. Food Research International, 38, 905-910.

30
Netzel, M., Strass, G., Kaul, C., Bitsch, I., Dietrich, H., & Bitsch, R. (2002). In vivo
antioxidative capacity of a composite berry juice. Food Research International, 35,
213-216.
Neves, J.M., Matosa, C., Moutinho, C., Queiroz, G., & Gomes, L.R. (2009).
Ethnopharmacological notes about ancient uses of medicinal plants in Trás-os-
Montes (northern of Portugal). Journal of Ethnopharmacology, 124, 270–283.
Parada, M., Carrió, E., Bonet, M.A., & Vallès, J. (2009). Ethnobotany of the Alt
Empordà region (Catalonia, Iberian Peninsula): Plants used in human traditional
medicine. Journal of Ethnopharmacology, 124, 609-618.
Pardo de Santayana, M. (2008). Estudios etnobotánicos en Campoo (Cantábria).
Biblioteca de Ciencias 33. Madrid, CSIC.
Pardo de Santayana, M., Tardio, J., Blanco, E., Carvalho, A.M., Lastra, J.J., San Miguel,
E., & Morales, R. (2007). Traditional knowledge of wild edible plants used in the
northwest of the Iberian Peninsula (Spain and Portugal): a comparative study.
Journal of Ethnobiology and Ethnomedicine, 3, 27-37.
Prior, R.L., Wu, X.L., & Schaich, K. (2005). Standardized methods for the determination
of antioxidant capacity and phenolics in foods and dietary supplements. Journal of
Agricultural and Food Chemistry, 53, 4290-4302.
Proestos, C., Boziaris, I.S., Kapsokefalou, M., & Komaitis, M. (2008). Natural
antioxidant constituents from selected aromatic plants and their antimicrobial
activity against selected pathogenic microorganisms. Food Technology and
Biotechnology, 46, 151–156.
Rao, A.V., & Rao, L.G. (2007). Carotenoids and human health. Pharmacological
Research, 55, 207–216.
31
Rieger, G., Müller, M., Guttenberger, H., & Bucar, F. (2008). Influence of altitudinal
variation on the content of phenolic compound in wild populations of Calluna
vulgaris, Sambucus nigra, and Vaccinium myrtillus. Journal of Agricultural and
Food Chemistry, 56, 9080-9086.
Rupasinghe, H.P.V., & Clegg, S. (2007). Total antioxidant capacity, total phenolic
content, mineral elements, and histamine concentrations in wines of different fruit
sources. Journal of Food Composition and Analysis, 20, 133-137.
Sadilova, E., Stintzing, F.C., Kammerer, D.R., & Carle, R. (2009). Matrix dependent
impact of sugar and ascorbic acid addition on color and anthocyanin stability of
black carrot, elderberry and strawberry single strength and from concentrate juices
upon thermal treatment. Food Research International, 42, 1023-1033.
Scheer, T., & Wichtl, M. (1987). On the occurrence of kaempferol-4'-O-beta-D-
glucopyranoside in Filipendula ulmaria and Allium cepa. Planta Medica, 53, 573-
574.
Stránský, K., Valterová, I., & Fiedler, P. (2001). Nonsaponifiable lipid components of
the pollen of elder (Sambucus nigra L.). Journal of Cromatography A, 936, 173-
181.
Valko, M., Leibfritz, D., Moncol, J., Cronin, M.T, Mazur, M., & Telser, J. (2007). Free
radicals and antioxidants in normal physiological functions and human disease.
International Journal of Biochemistry and Cell Biology, 39, 44-84.
Vallès, J., Bonet, M.A., & Agelet, A. (2004). Ethnobotany of Sambucus nigra L. in
Catalonia (Iberian peninsula): The integral exploitation of a natural resource in
mountain regions. Economic Botany, 58, 456–469.

32
Veberic, R., Jakopic, J., Stampar, F., & Schmitzer, V. (2009). European elderberry
(Sambucus nigra L.) rich in sugars, organic acids, anthocyanins and selected
polyphenols. Food Chemistry, 114, 511-515.
Viscardi, Reynaud, J., & Raynaud, J. (1984). A New isoflavone glycoside from the
flowers of Cytisus scoparius Link. (Leguminasae). Pharmazie, 39, 781.
Wu, X., Gu, L., Prior, R.L., & McKay, S. (2004). Characterization of anthocyanins and
proanthocyanidins in some Cultivars of Ribes, Aronia, and Sambucus and their
antioxidant capacity. Journal of Agricultural and Food Chemistry, 52, 7846-7856.

33
Table 1. Composition of the medicinal plants in vitamins (μg/g dw), pigments (μg/g
dw) and sugars (mg/g dw) (mean SD; n=9). In each row different letters mean
significant differences (p0.05).
nd- not detected
Compound Cytisus multiflorus Filipendula ulmaria Sambucus nigra
α-tocopherol 347.67 ± 17.51 b 425.09 ± 15.45 a 313.30 ± 4.08 c
β-tocopherol 34.82 ± 4.14 a 15.91 ± 0.13 b 8.12 ± 0.71 c
γ-tocopherol 92.64 ± 4.51 a 44.32 ± 1.66 b 2.89 ± 0.18 c
δ-tocopherol 7.63 ± 0.46 b 11.29 ± 0.92 a nd
Total tocopherols 482.77 ± 9.32 a 496.61 ± 16.06 a 324.31 ± 4.61 b
Ascorbic acid 2674.78 ± 12.57 a 2696.26 ± 27.02 a 1729.41 ± 4.79 b
β-carotene 53.85 ± 0.06 a 36.32 ± 0.17 b 18.43 ± 0.05 c
Lycopene 11.28 ± 0.04 a 6.18 ± 0.08 b 5.34 ± 0.04 c
Chlorophyll a 60.32 ± 0.05 b 78.15 ± 0.07 a 44.97 ± 0.02 c
Chlorophyll b 51.61 ± 0.10 a 46.73 ± 0.20 b 31.99 ± 0.06 c
Glucose 42.73 ± 1.40 a 13.09 ± 0.61 c 32.28 ± 0.66 b
Fructose 69.27 ± 2.71 a 19.84 ± 0.65 c 26.61 ± 0.96 b
Sucrose 18.32 ± 0.73 b 11.34 ± 0.44 c 24.71 ± 0.26 a
Trehalose 7.62 ± 0.98 b 20.85 ± 1.17 a nd
Total sugars 137.94 ± 5.82 a 65.12 ± 0.53 c 83.61 ± 0.92 b

34
Table 2. Composition (%) of the medicinal plants in fatty acids (mean SD; n=9). In
each column different letters mean significant differences (p0.05).
Fatty acid Cytisus multiflorus Filipendula ulmaria Sambucus nigra
C6:0 0.10 ± 0.01 2.16 ± 0.11 0.03 ± 0.00
C8:0 0.06 ± 0.00 0.19 ± 0.01 0.02 ± 0.00
C10:0 0.04 ± 0.00 0.06 ± 0.00 0.02 ± 0.00
C12:0 0.33 ± 0.00 0.73 ± 0.01 0.14 ± 0.00
C14:0 0.53 ± 0.02 10.05 ± 0.53 0.42 ± 0.03
C14:1 0.05 ± 0.00 0.11 ± 0.01 0.05 ± 0.00
C15:0 0.13 ± 0.01 0.12 ± 0.00 0.15 ± 0.00
C15:1 nd nd 2.07 ± 0.41
C16:0 11.14 ± 0.02 12.22 ± 0.03 18.06 ± 0.53
C16:1 0.60 ± 0.02 Nd 0.36 ± 0.04
C17:0 0.37 ± 0.02 0.37 ± 0.03 0.28 ± 0.02
C18:0 4.09 ± 0.02 3.93 ± 0.13 2.02 ± 0.17
C18:1n9c 6.59 ± 0.76 2.28 ± 0.10 11.93 ± 0.16
C18:2n6c 24.31 ± 0.28 18.02 ± 0.58 24.64 ± 0.49
C18:3n6 nd 0.11 ± 0.01 nd
C18:3n3 32.49 ± 1.11 32.89 ± 0.47 25.43 ± 1.73
C20:0 3.21 ± 0.08 3.48 ± 0.25 1.26 ± 0.10
C20:1c 0.47 ± 0.02 0.32 ± 0.05 0.81 ± 0.02
C20:2c 0.18 ± 0.02 0.06 ± 0.00 nd
C20:3n3+C21:0 0.36 ± 0.01 1.10 ± 0.05 0.21 ±0.01
C20:5n3 nd 0.85 ± 0.05 0.57 ± 0.03
C22:0 1.68 ± 0.05 2.53 ± 0.09 1.99 ± 0.20
C23:0 11.26 ± 0.29 4.35 ± 0.01 1.81 ± 0.26
C24:0 2.07 ± 0.04 4.06 ± 0.14 7.74 ± 1.21
Total SFA 34.98 ± 0.33 b 44.26 ± 0.67 a 33.92 ± 1.47 b
Total MUFA 7.71 ± 1.75 b 2.71 ± 0.16 c 15.23 ± 0.64 a
Total PUFA 57.34 ± 1.38 a 53.03 ± 0.83 b 50.85 ± 2.11 b
nd- not detected; Caproic acid (C6:0); Caprylic acid (C8:0); Capric acid (C10:0); Lauric
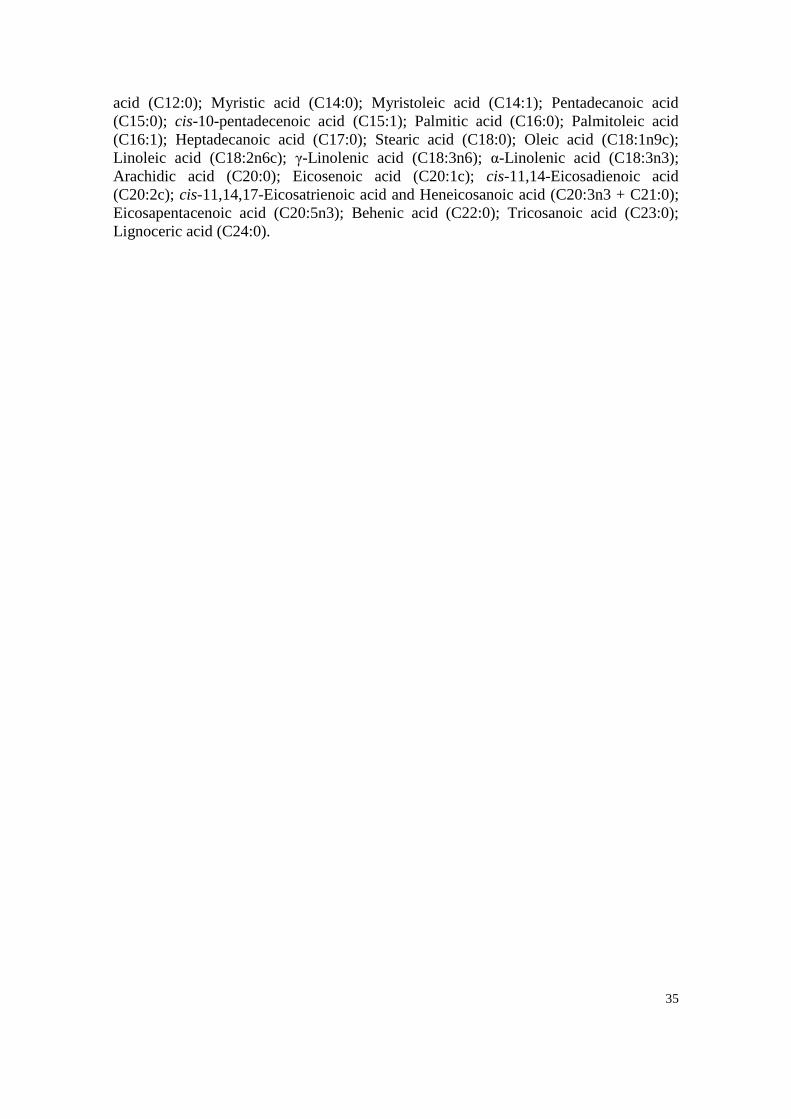
35
acid (C12:0); Myristic acid (C14:0); Myristoleic acid (C14:1); Pentadecanoic acid
(C15:0); cis-10-pentadecenoic acid (C15:1); Palmitic acid (C16:0); Palmitoleic acid
(C16:1); Heptadecanoic acid (C17:0); Stearic acid (C18:0); Oleic acid (C18:1n9c);
Linoleic acid (C18:2n6c); γ-Linolenic acid (C18:3n6); α-Linolenic acid (C18:3n3);
Arachidic acid (C20:0); Eicosenoic acid (C20:1c); cis-11,14-Eicosadienoic acid
(C20:2c); cis-11,14,17-Eicosatrienoic acid and Heneicosanoic acid (C20:3n3 + C21:0);
Eicosapentacenoic acid (C20:5n3); Behenic acid (C22:0); Tricosanoic acid (C23:0);
Lignoceric acid (C24:0).

36
Table 3. Extraction yields, content in phenolics and flavonoids, and antioxidant activity
(EC50 values, mg/mL) of the medicinal plants (mean SD; n=9). In each row different
letters mean significant differences (p0.05).
Cytisus multiflorus Filipendula ulmaria Sambucus nigra
Extraction yield (%) 36.30 ± 3.27 a 29.30 ± 2.03 b 37.74 ± 2.12 a
Phenolics (mg GAE/g dw) 45.62 ± 3.29 c 227.60 ± 0.53 a 92.73 ± 4.66 b
Flavonoids (mg CE/g dw) 7.86 ± 0.42 c 62.40 ± 4.83 a 26.18 ± 0.51 b
DPPH scavenging activity 2.02 ± 0.11 a 0.05 ± 0.01 c 0.57 ± 0.03 b
Reducing power 0.64 ± 0.02 a 0.06 ± 0.00 c 0.27 ± 0.01 b
β-carotene bleaching inhibition 0.35 ± 0.01 a 0.09 ± 0.01 c 0.16 ± 0.01 b
TBARS inhibition 0.30 ± 0.02 a 0.05 ± 0.00 c 0.12 ± 0.01 b

37
Table 4. Peak potentials obtained for the electrochemical oxidation processes of the
sample extracts (mean SD; n=6).
Cyclic Voltammetry (V) Differential Pulse Voltammetry (V)
C. multiflorus F. ulmaria S. nigra C. multiflorus F. ulmaria S. nigra
Ep1 - 0.25 ±0.03 - 0.35 ±0.02 0.28 ±0.01 -
Ep2 0.54 ±0.01 0.63 ±0.01 0.58 ±0.00 0.46 ±0.01 0.46 ±0.00 0.50 ±0.00
Ep3 0.99 ±0.01 1.23 ±0.02 1.01 ±0.01 - 0.58 ±0.01 -
Ep4 - - - 0.91 ±0.04 0.82 ±0.01 0.71 ±0.00
Ep5 - - - 1.02 ±0.01 1.11 ±0.04 1.06 ±0.00
Ep6 - - - 1.20 ±0.00 1.30 ±0.01 -

38
Table 5. Total Electrochemical Antioxidant Power (TEAP) expressed as ascorbic acid
equivalents per gram of sample (dw; mean SD; n=6), calculated from the DPV
experiments.
Electrochemical antioxidant power (expressed mgAA/g dw)
Cytisus multiflorus Filipendula ulmaria Sambucus nigra
Ep1 2.19 ±0.16 2.71 ±0.10 -
Ep2 2.13 ±0.65 4.37 ±1.02 6.71 ±0.53
Ep3 2.81 ±0.61 3.43 ±0.81 -
Ep4 - 1.60 ±0.72 3.48 ±0.42
Ep5 2.06 ±0.31 1.47 ±0.72 2.01 ±0.17
Ep6 0.46 ± 0.00 0.16 ±0.09 -
TEAP 9.64 ±2.73 13.74 ±4.48 12.19 ±1.65

39
Figure 1. Tocoferols profile of F. ulmaria. 1-α-Tocoferol; 2-β-tocoferol; 3-γ- tocoferol;
4- δ-tocoferol; 5-tocol (IS).
Time (min.)0 5 10 15 20 25
Vo
ltage
(V)
0.0
0.5
1.0
1.5
2.01
23 4
5
Time14 16 18
2
3
4

40
Figure 2. Sugars profile of C. multiflorus. 1-Fructose; 2-glucose; 3-sucrose; 4-
trehalose; 5-melezitose (IS).
Time (min.)0 2 4 6 8 10
Vo
ltag
e(m
V)
0
20
40
601
2
3
4
5
80
41
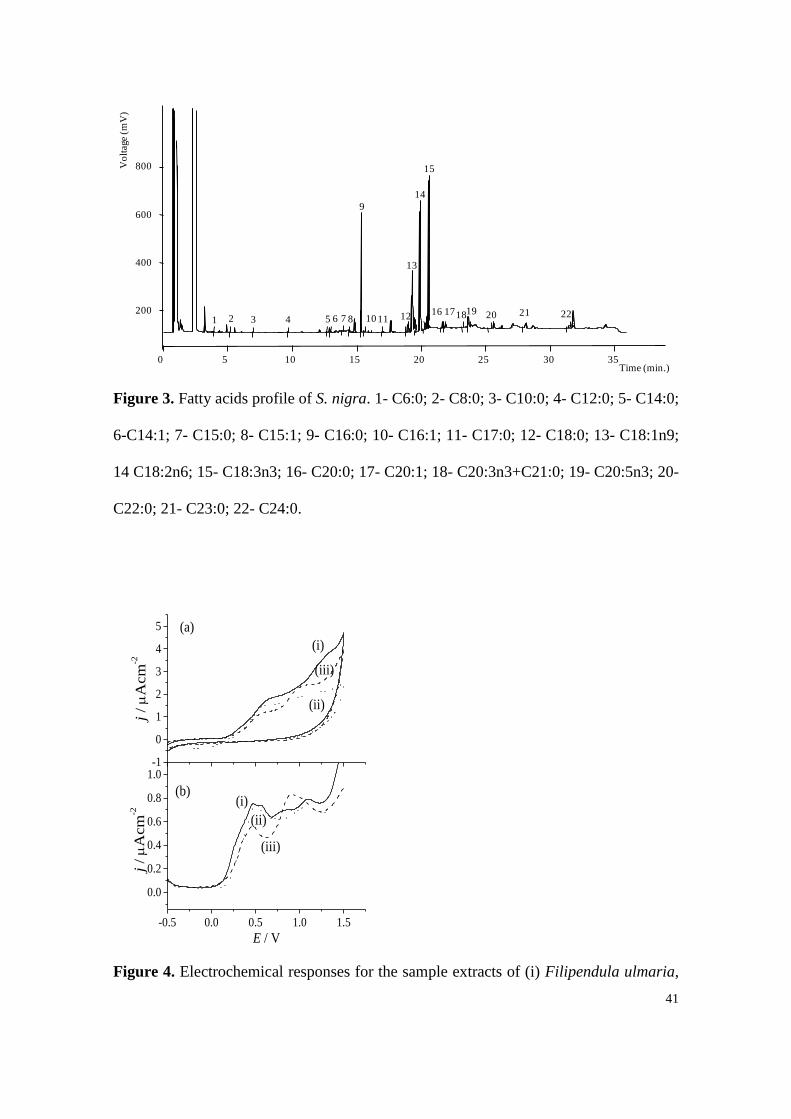
Figure 3. Fatty acids profile of S. nigra. 1- C6:0; 2- C8:0; 3- C10:0; 4- C12:0; 5- C14:0;
6-C14:1; 7- C15:0; 8- C15:1; 9- C16:0; 10- C16:1; 11- C17:0; 12- C18:0; 13- C18:1n9;
14 C18:2n6; 15- C18:3n3; 16- C20:0; 17- C20:1; 18- C20:3n3+C21:0; 19- C20:5n3; 20-
C22:0; 21- C23:0; 22- C24:0.
Figure 4. Electrochemical responses for the sample extracts of (i) Filipendula ulmaria,
0 5 10 15 20 25 30 35Time (min.)
200
400
600
800Vo
ltag
e(m
V)
1 2 3 4 5 6 7 8
9
10 11 12
13
14
15
16 171819 20 21 22
-0.5 0.0 0.5 1.0 1.5
0.0
0.2
0.4
0.6
0.8
1.0
(iii)
(ii)
(i)
j /
Acm
-2
E / V
-1
0
1
2
3
4
5
(b)
(a)
(iii)
(ii)
(i)
j /
Acm
-2

42
(ii) Sambucus nigra and (iii) Cytisus multiflorus in methanol/NaClO4 0.1M solutions,
obtained with a glassy carbon electrode collected between -0.5 and 1.5 V (a) Cyclic
voltammograms (first scan) at 100 mV.s-1
. (b) Differential pulse voltammograms
obtained with 60 mV pulse amplitude scanned at 20 mV.s-1
.

43
Figure 5. (a) Differential pulse voltammograms obtained for 0.05 to 1.02 mgmL-1
ascorbic acid in methanol/NaClO4 0.1M solutions, obtained with a glassy carbon
electrode between -0.5 and 1.5 V, with 60 mV pulse amplitude at 20 mV.s-1
. (b)
Variation of the oxidation peak height, obtained by DPV, with ascorbic acid
concentration.
0 2 4 6 8 10 12
0
2
4
6
8
10
(b)
j /
Acm
-2
[AA]/ mgmL-1
0.0 0.5 1.0 1.5
0
1
2
3
4
5
(a)
[AA]
j /
Acm
-2
E / V