Drives and controls, motors and mechanical power transmission ...

1
Chemical and Mechanical Controls on Reservoir Quality
Two quartz-rich fine sandstones. Pores are injected with blue-dyed medium. Thin section viewed in transmitted plane-polarized light.
150 µm 100 µm
Why is the porosity so different between these two samples? (and, in fact, also permeability, velocity, elastic moduli….)?
• Depositional environment? • Age? • Fluid flow? • Burial depth?
grain
pore
cement
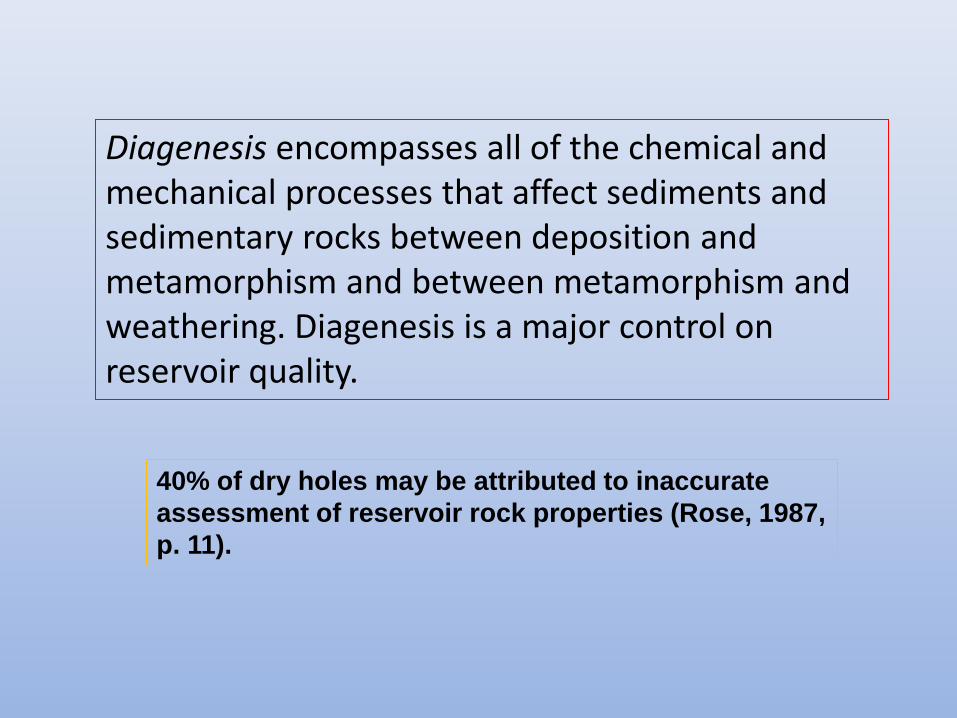
Diagenesis encompasses all of the chemical and mechanical processes that affect sediments and sedimentary rocks between deposition and metamorphism and between metamorphism and weathering. Diagenesis is a major control on reservoir quality.
40% of dry holes may be attributed to inaccurate
assessment of reservoir rock properties (Rose, 1987,
p. 11).

3 www.earth.ox.ac.uk/ ~tony/watts/MARGIN/MARGIN.HTM
The Realm of Diagenesis:
°C/km 20 30
140° 200°
320° 470°
6 km
15 km
The boundary between “diagenesis” and “metamorphism” is gradational and within reach of deep drilling.
Sedimentary basins constitute a significant portion of total crustal thickness.
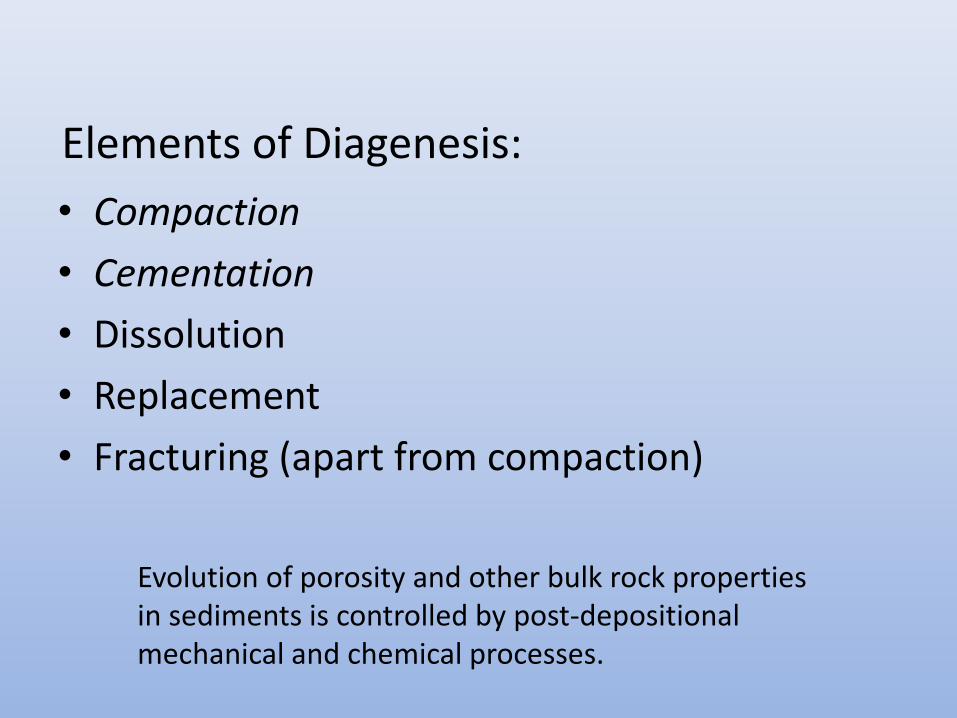
Evolution of porosity and other bulk rock properties in sediments is controlled by post-depositional mechanical and chemical processes.
• Compaction
• Cementation
• Dissolution
• Replacement
• Fracturing (apart from compaction)
Elements of Diagenesis:

“Schools” of reservoir quality prediction
• Empirical
• Chemical modeling
• Hybrid empirical-chemical/mechanical modeling
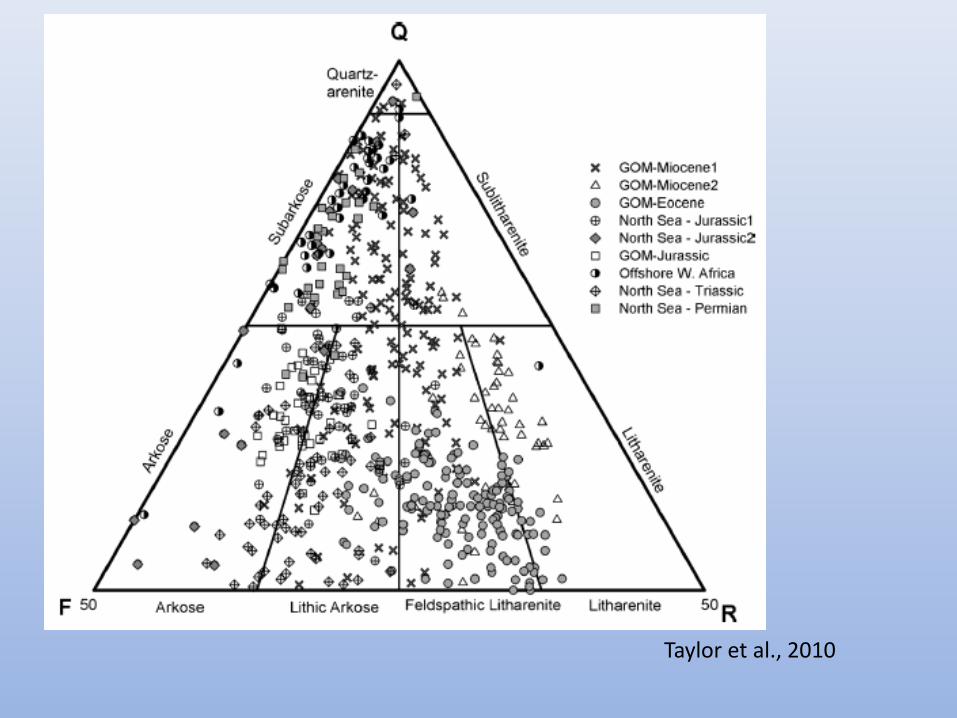
Taylor et al., 2010
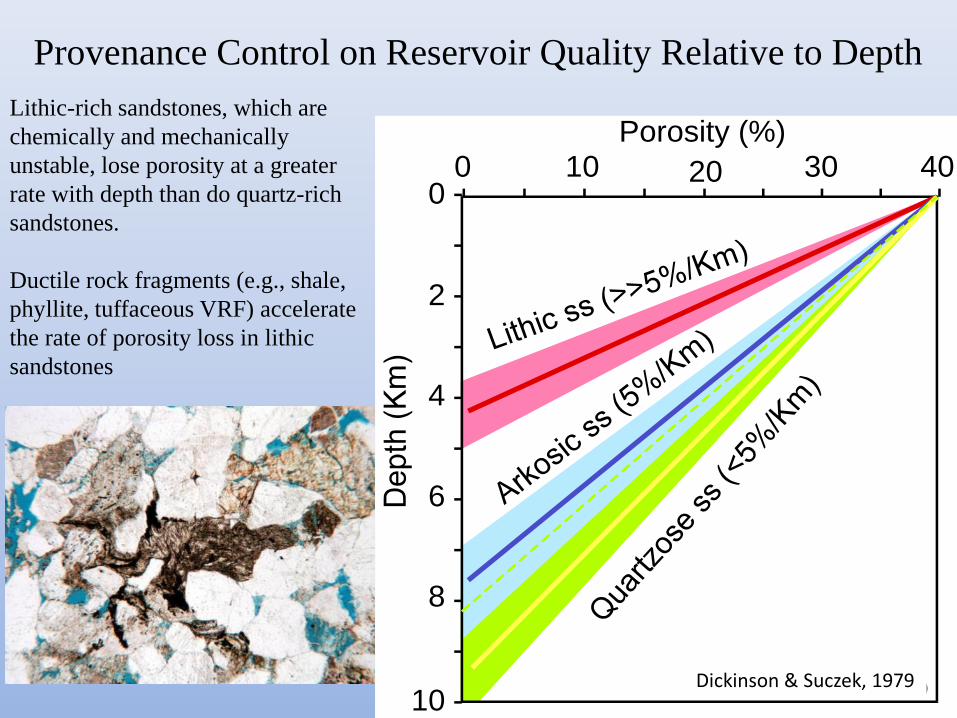
Provenance Control on Reservoir Quality Relative to Depth
4030201000
10
8
6
4
2
Dickinson and Sucsek, 1979)
Porosity (%)Lithic-rich sandstones, which are
chemically and mechanically
unstable, lose porosity at a greater
rate with depth than do quartz-rich
sandstones.
Ductile rock fragments (e.g., shale,
phyllite, tuffaceous VRF) accelerate
the rate of porosity loss in lithic
sandstones
Dickinson & Suczek, 1979
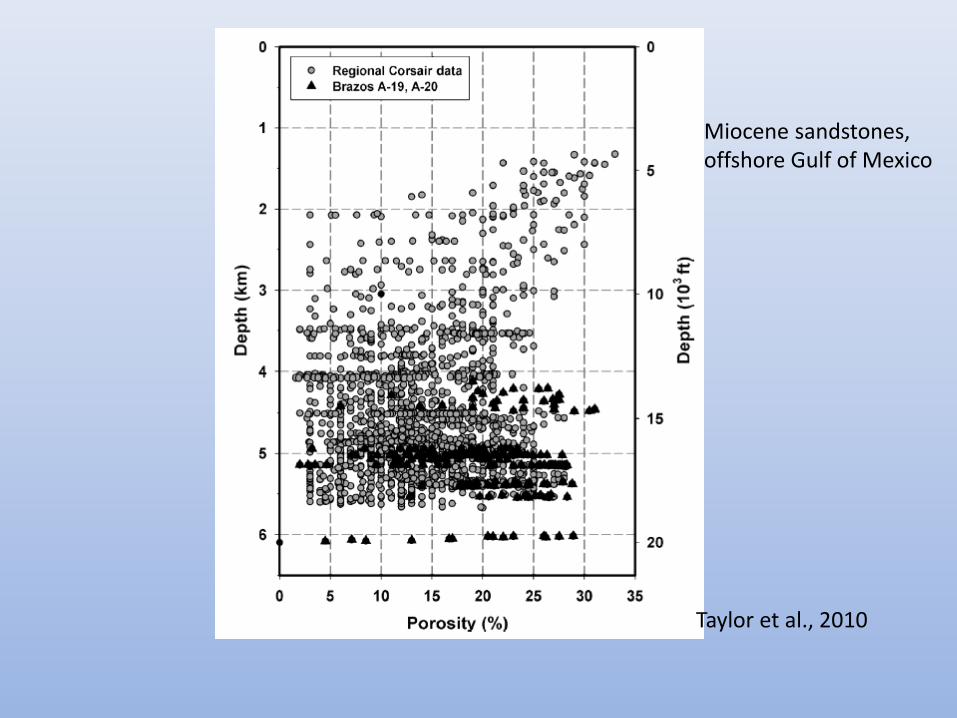
Taylor et al., 2010
Miocene sandstones, offshore Gulf of Mexico

Porosity (% Bulk volume)
Bu
rial
dep
th (
m)
Taylor et al., 2010
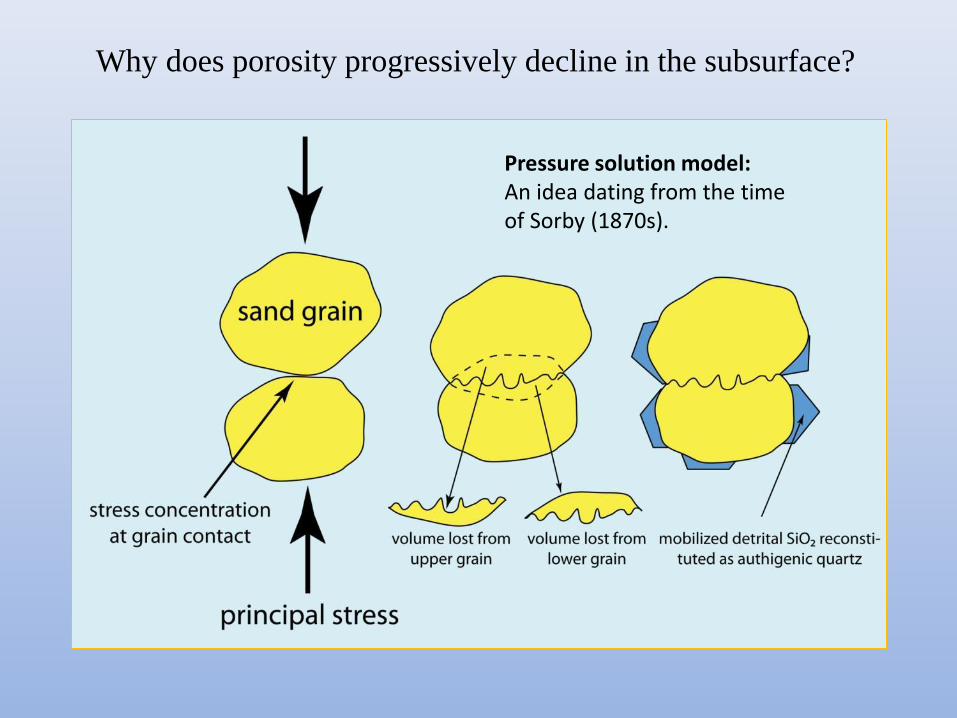
Why does porosity progressively decline in the subsurface?
The “pressure solution” model
Pressure solution model: An idea dating from the time of Sorby (1870s).

ConocoPhillips – Spring 2012 Lecture 6: Petrographic Methods Basic Mudrock Petrology for
Reservoir Characterization
ConocoPhillips – Spring 2012 Lecture 6: Petrographic Methods Basic Mudrock Petrology for
Reservoir Characterization

Marbles in blue epoxy;
pore space = 43%
The Intergranular Volume (IGV) Concept in Sandstones:
At deposition, in well-sorted sand, the intergranular space makes up
40-45% by volume. Grains make up 55-60%.
Compaction: IGV concept
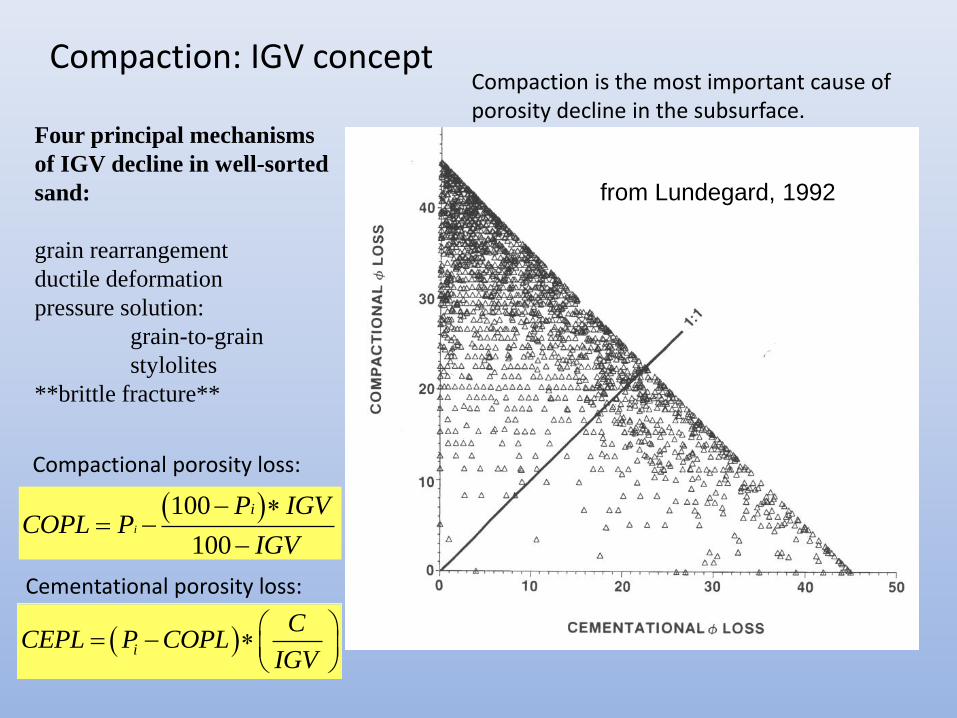
Four principal mechanisms
of IGV decline in well-sorted
sand:
grain rearrangement
ductile deformation
pressure solution:
grain-to-grain
stylolites
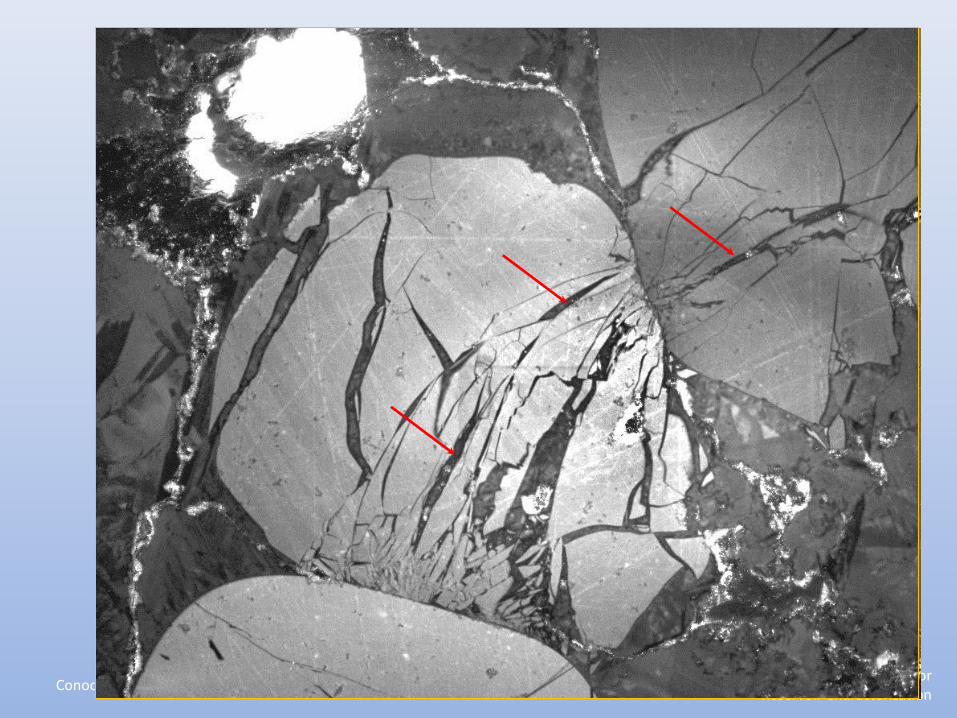
**brittle fracture**
from Lundegard, 1992
Compaction: IGV concept Compaction is the most important cause of porosity decline in the subsurface.
100
100i
iP IGVCOPL P
IGV
i
CCEPL P COPL
IGV
Compactional porosity loss:
Cementational porosity loss:

Based on 368 samples
from 23 units: all
quartzo-feldspathic
sandstones:
<5% cement
<5% detrital matrix
Paxton, et al., 2002
“The EXXON
Compaction Curve”
Compaction: IGV concept
x
cementation

IGV = measured IGV
IGVf= final IGV
Ø0 = depositional porosity
m0 = matrix content at deposition
ß = exponential rate of IGV decline
with effective stress (MPa-1); rate can
be adjusted to reality in analog data
set: this parameter allows empiricism
into model)
ses=maximum effective stress
IGV=IGVf + (Ø0 + m0 - IGVf) e-ßses
From Lander & Walderhaug, 1999

Diagenetic Evolution of the GOM
From Land et al., 1987
30°/km 40°/km 20°/km
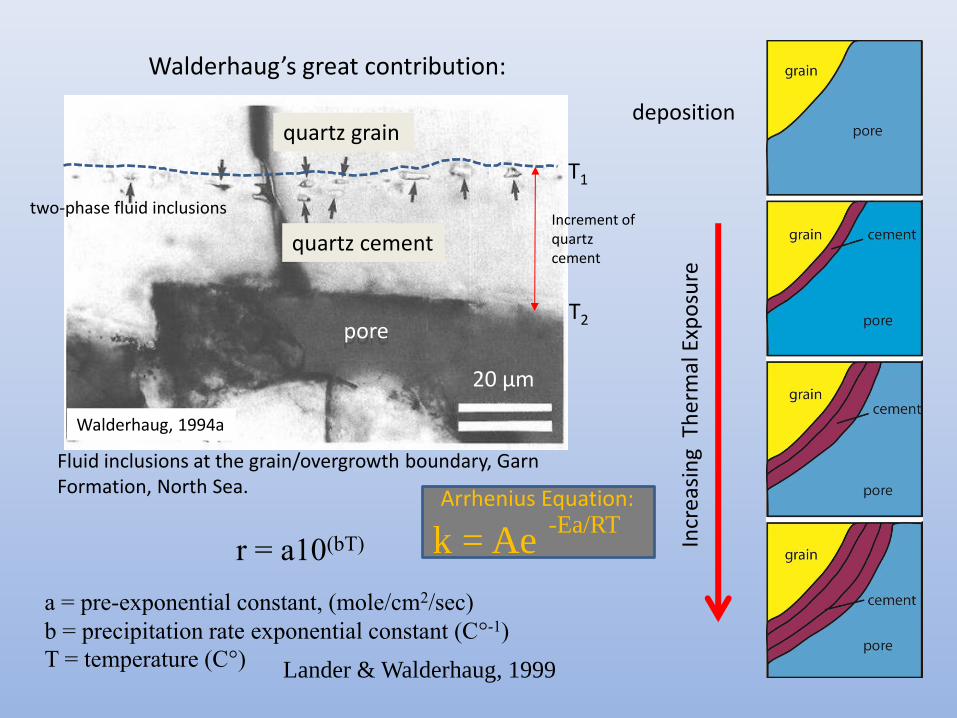
Walderhaug, 1994a
Fluid inclusions at the grain/overgrowth boundary, Garn Formation, North Sea.
deposition
Incr
easi
ng
Th
erm
al E
xpo
sure
r = a10(bT)
a = pre-exponential constant, (mole/cm2/sec)
b = precipitation rate exponential constant (C°-1)
T = temperature (C°) Lander & Walderhaug, 1999
Walderhaug’s great contribution:
T1
T2
k = Ae -Ea/RT
Arrhenius Equation:
quartz grain
quartz cement
pore
two-phase fluid inclusions
20 μm
Increment of quartz cement

qcv = m/r Aa 10b(cnt+dn) dt
qcv = quartz cement volume
m = molar weight of quartz (60.08 g/mole)
r = density of quartz (2.65 g/cm3)
A = quartz surface area (cm2)
a = quartz ppt pre-exponential rate constant (mole/cm2/sec)
b = quartz ppt rate exponential constant (1/°C)
t = duration of time step (sec)
cn = constant for time step, based on thermal history
dn = constant for time step, based on thermal history
From Lander & Walderhaug, 1999
Calculating quartz cement volume:

SiO2
SiO2
SiO2
ankerite SiO2

Assumes that quartz grains are spherical and of uniform size (and coated to some extent):
A = (1- coat)[6qgf0n0]Ø)
D (Ø0)
qgf0 = initial quartz grain fraction
D = average grain diameter
Ø = porosity at given time step
Ø0 = initial porosity
coat = fraction of surface that is coated and not available for quartz nucleation
From Lander & Walderhaug, 1999
Empirical quantities (red) are determined from point counts
of calibration samples.
Calculating Quartz Surface Area

Lander and Walderhaug, 1999
Calibrated to
data from
Jurassic of
North Sea
(Walderhaug,
1994)

0
5
10
15
20
25
0 5 10 15 20 25
Calc
ula
ted
Qu
art
z C
em
en
t, v
ol
%
Quartz CementQuartz Cement
Measured Quartz Cement, vol %
Touchstone®
Thermal history from apatite fission track study of Boettcher & Milliken, 1994.
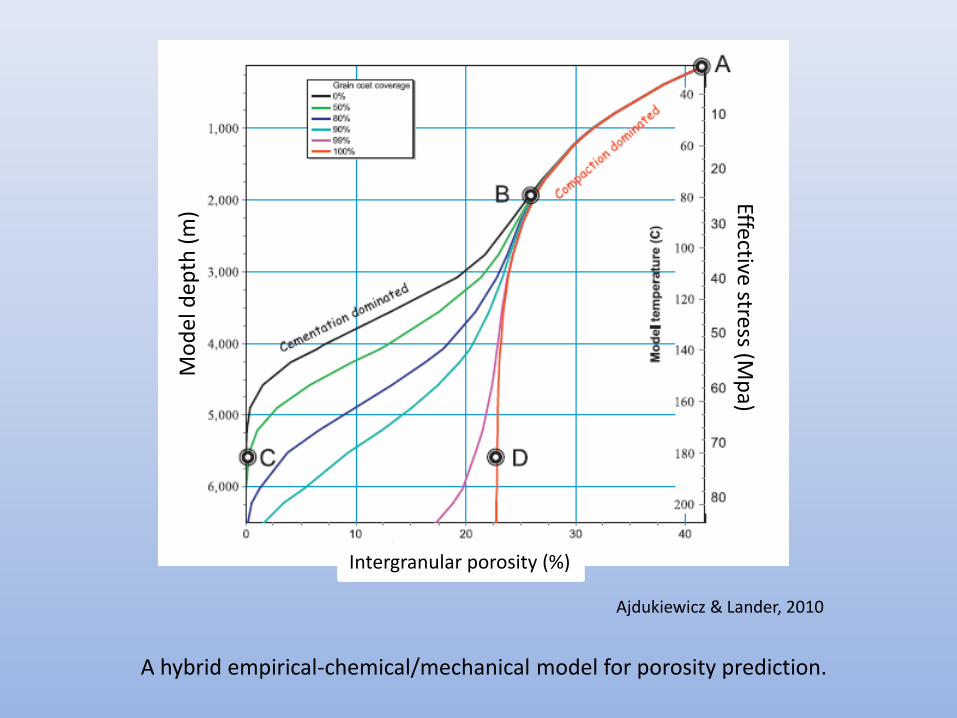
Ajdukiewicz & Lander, 2010
Effective stress (Mp
a) M
od
el d
ep
th (
m)
Intergranular porosity (%)
A hybrid empirical-chemical/mechanical model for porosity prediction.

25
Authigenic minerals with strong thermal controls:
Minerals that exhibit
strong thermal controls on
their distribution typically
manifest evidence of
particularly sluggish
reaction kinetics, for
example, the need for very
special nucleation surfaces
and supersaturation in
pore fluids.
Minerals that behave “like quartz” • albite • ankerite • illite
Quartz saturation
Land 1997

Cementation minerals that do not behave like quartz: “wild cards”
• Carbonate minerals • Kaolinite • Chlorite • Iron oxides Highly localized precipitation (concretions, bands); much evidence of microbial controls

Apparent homogeneity of shales (mudrocks, mudstones) as seen by visual inspection is misleading……
At high magnifications, we learn that most shales don’t look like this:
But rather, like: Barnett Shale Examples
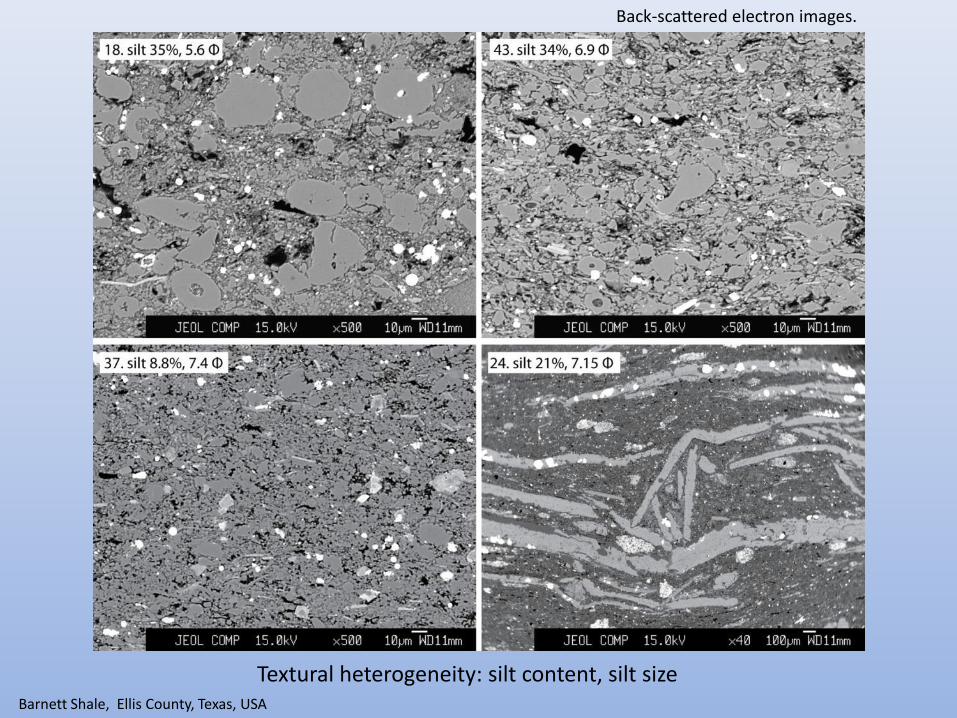
Textural heterogeneity: silt content, silt size
Back-scattered electron images.
Barnett Shale, Ellis County, Texas, USA

Productivity tiers of the Barnett Shale; Ikonnikova et al., in review.
http://www.beg.utexas.edu/info/sloan_barnett.php
“Sweet spots” : suggest potential for significant gains in efficiency by application of exploration models that address depositional environments, grain source mixing, and other basic causes of shale heterogeneity.
To guess is cheap; to guess wrongly is expensive.
Chinese proverb
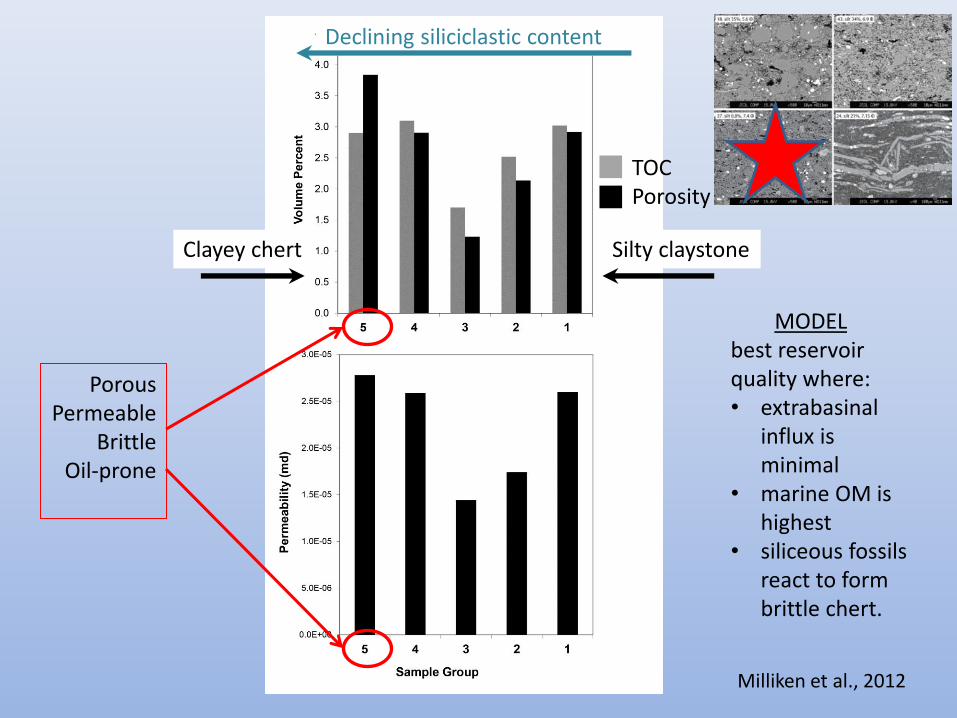
Declining siliciclastic content
Porous Permeable
Brittle Oil-prone
Milliken et al., 2012
Silty claystone Clayey chert
MODEL best reservoir quality where: • extrabasinal
influx is minimal
• marine OM is highest
• siliceous fossils react to form brittle chert.
TOC Porosity
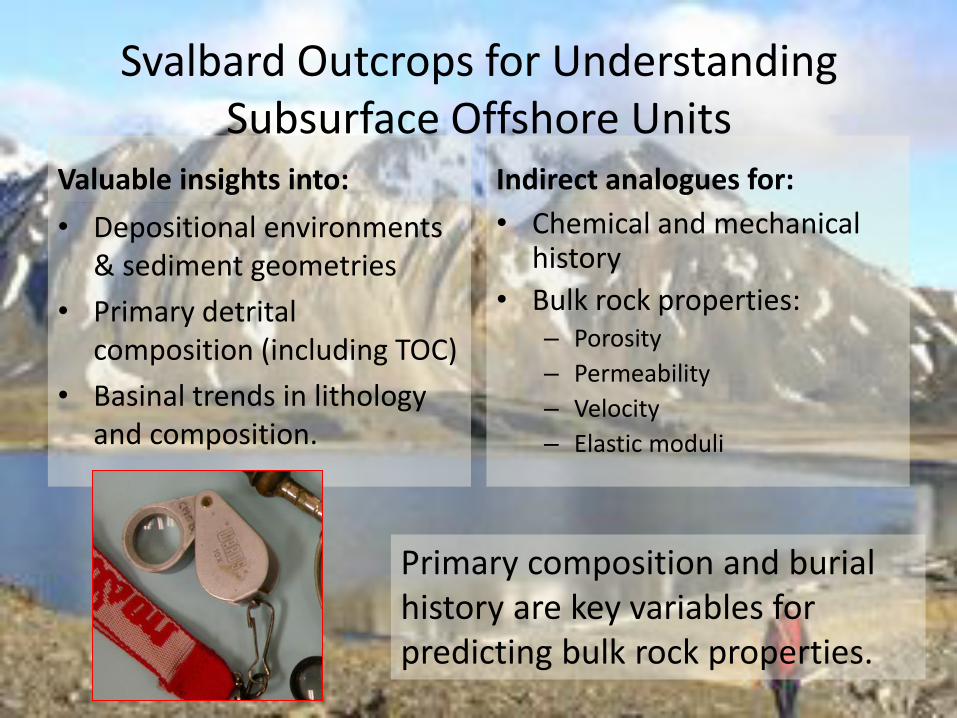
Svalbard Outcrops for Understanding Subsurface Offshore Units
Valuable insights into:
• Depositional environments & sediment geometries
• Primary detrital composition (including TOC)
• Basinal trends in lithology and composition.
Indirect analogues for:
• Chemical and mechanical history
• Bulk rock properties: – Porosity
– Permeability
– Velocity
– Elastic moduli
Primary composition and burial history are key variables for predicting bulk rock properties.