CHEMICAL AND ISOTOPIC COMPOSITION OF RAINWATER IN …
123
CHEMICAL AND ISOTOPIC COMPOSITION OF RAINWATER IN THE COASTAL, FOREST AND MOUNTAINOUS AREAS OF VOLTA REGION OF GHANA BY MARIAN SITSOFE KRETCHY (10397347) A THESIS SUBMITTED TO THE UNIVERSITY OF GHANA, LEGON IN PARTIAL FULFILMENT OF THE REQUIREMENT FOR THE AWARD MPHIL NUCLEAR AND RADIOCHEMISTRY DEGREE JULY, 2014 University of Ghana http://ugspace.ug.edu.gh University of Ghana http://ugspace.ug.edu.gh
Transcript of CHEMICAL AND ISOTOPIC COMPOSITION OF RAINWATER IN …

CHEMICAL AND ISOTOPIC COMPOSITION OF RAINWATER IN THE
COASTAL, FOREST AND MOUNTAINOUS AREAS OF VOLTA REGION
OF GHANA
BY
MARIAN SITSOFE KRETCHY
(10397347)
A THESIS SUBMITTED TO THE UNIVERSITY OF GHANA, LEGON IN
PARTIAL FULFILMENT OF THE REQUIREMENT FOR THE AWARD
MPHIL NUCLEAR AND RADIOCHEMISTRY DEGREE
JULY, 2014
University of Ghana http://ugspace.ug.edu.ghUniversity of Ghana http://ugspace.ug.edu.gh

i
DECLARATION
I hereby declare that this submission is my own work and that, to the best of my
knowledge, it contains no materials previously published by another person or
material which has been accepted for the award of any other degree, except where due
acknowledgement has been made in the text.
................................................... ...............................................
Marian Sitsofe Kretchy Date
.
(10397347)
................................................. .........................................
Dr. Thomas Tete Akiti Date
(Supervisor)
........................................... ........................................
Prof. Dickson Adomako Date
(Co-Supervisor)
University of Ghana http://ugspace.ug.edu.ghUniversity of Ghana http://ugspace.ug.edu.gh

ii
DEDICATION
This work is dedicated to my two lovely daughters, Princess-Audrey Seyram Djam
and Queensly-Hilary Selinam Djam for their patience and inspiration. I love you girls.
University of Ghana http://ugspace.ug.edu.ghUniversity of Ghana http://ugspace.ug.edu.gh
iii
ACKNOWLEDGEMENT
I am very grateful to God almighty for his strength, guidance and protection. Without
him this work would not be possible, thank you Jesus for materializing my dream.
I am of full gratitude to my supervisors, Dr Thomas Tete Akiti and Prof Dickson
Adomako for their good and helpful criticisms, insightful discussions, comments and
suggestions that has guided my thinking to the successful development of the ideas
featured in this work.
I am highly indebted to Mr Gibrilla Abass and his staffs of Isotope Hydrology
Laboratory (NNRI), Mr Nash and C. Crabbe at Inorganic Laboratory (NNRI) and Mr
Opata at Ghana Research Reactor 1,(GHARR1); all of Ghana Atomic Energy
Commission,(GAEC) for guiding me with analysis in the Labs. I thank the Head and
Students of Nuclear Science and Applications, Graduate School of Nuclear and Allied
Sciences Atomic, Legon.
I gratefully acknowledge a number of people without whom, the completion of this
thesis could not have been accomplished. My pastor, Rt. Rev Victor Zulakpla of CPC,
Fadama; The Human Resource Personnel at Ga- South District Education Office,
Madam Cynthia and Prof A.A Gollow of Graduate School of Nuclear and Allied
Sciences for their strong encouragement.
I am full of gratitude to my family, especially, Letitia, Esther, Richard, Casper and
Stella and my dear parents of blessed memory, Mr Emil K. Kretchy and Mrs Paulina
A. Ashiara-Kretchy, for their education, financial, material and emotional supports
given me.
University of Ghana http://ugspace.ug.edu.ghUniversity of Ghana http://ugspace.ug.edu.gh

iv
TABLE OF CONTENTS
Content Page
DECLARATION ............................................................................................................ i
DEDICATION ............................................................................................................ ii
ACKNOWLEDGEMENT ........................................................................................ ii
TABLE OF CONTENTS .............................................................................................. iii
LIST OF TABLES .................................................................................................. vii
LIST OF FIGURES ................................................................................................. ix
LIST OF ABBREVIATION .................................................................................. xi
ABSTRACT .............................................................................................................. xii
CHAPTER ONE .......................................................................................................... 1
1.0 INTRODUCTION .................................................................................................. 1
1.1 Objectives ................................................................................................................ 5
1.2 Statements Of The Problem ..................................................................................... 5
1.3 Justification .............................................................................................................. 6
CHAPTER TWO ......................................................................................................... 8
2.0 LITERATURE REVIEW ..................................................................................... 8
2.1 Water Supply In The Volta Region Of Ghana ......................................................... 8
2.1.1 Groundwater And Surface Water .......................................................................... 9
2.1.2Rainwater ............................................................................................................. 12
2.1.2.1 Formation Of Rainwater .................................................................................. 13
2.1.2.2 Rainwater Harvesting And Storage.................................................................. 14
2.1.2.3 Rainwater Quality ............................................................................................ 16
2.1.2.4 Rainwater Quality Studies In Ghana ................................................................ 19
2.2 Physical Paramaters ............................................................................................... 20
University of Ghana http://ugspace.ug.edu.ghUniversity of Ghana http://ugspace.ug.edu.gh

v
2.2.1 pH ........................................................................................................................ 20
2.2.2 Conductivity (μS/cm) .......................................................................................... 21
2.2.3 Salinity ................................................................................................................ 23
2.2.4 Hardness .............................................................................................................. 23
2.2.5 Alkalinity ............................................................................................................ 24
2.3 Stable Isotope Studies In Hydrology ..................................................................... 25
2.4 Hydrogeological Cycle .......................................................................................... 28
2.5. Recharge-Discharge Conditions ........................................................................... 30
2.6 Stable Isotopes Studies In Ghana ........................................................................... 31
CHAPTER THREE ................................................................................................... 33
3.0 MATERIALS AND METHODOLOGY ............................................................ 33
3.1 The Study Area ...................................................................................................... 33
3.2 Vegetation And Climate ........................................................................................ 35
3.3 Data Collection And Analysis ............................................................................... 37
3.3.1 Desk Study .......................................................................................................... 37
3.3.2 Field Work .......................................................................................................... 38
3.3.3. Sample Collection, Analysis And Quality Assurance ....................................... 38
3.3.4 Measurement Of Field Parameters ...................................................................... 39
3.3.5 Laboratory Analysis ............................................................................................ 40
3.3.5.1 Flame Photometry ............................................................................................ 40
3.3.5.2 Ion Chromatograph Spectrophotometry .......................................................... 41
3.3.5.3 Atomic Absorption Spectrometry .................................................................... 42
3.3.5.4 Instrumental Neutron Activation Analysis (Inaa) ............................................ 42
3.3.5.4.1 Expected Trace Metals Normally Found In Water ....................................... 43
3.3.5.4.2 Neutron-Gamma Reaction For The Trace .................................................... 44
3.3.6 Stable Isotope Analysis ....................................................................................... 44
University of Ghana http://ugspace.ug.edu.ghUniversity of Ghana http://ugspace.ug.edu.gh

vi
CHAPTER FOUR ...................................................................................................... 46
4.0 RESULT AND DISCUSSION ............................................................................ 46
4.1 Hydrochemistry Of Rainwater In The Study Area ................................................ 46
4.1.1 pH ....................................................................................................................... 48
4.1.2 Electrical Conductivity ....................................................................................... 49
4.1.3 Temperature ........................................................................................................ 50
4.1.4 Colour ................................................................................................................. 50
4.2 Major Ions .............................................................................................................. 51
4.2.1 Nitrate ................................................................................................................. 51
4.2.2 Sulphate ............................................................................................................... 52
4.2.3 Chloride ............................................................................................................... 53
4.2.4 Alkalinity And Bicarbonate ................................................................................ 53
4.2.5 Sodium ................................................................................................................ 54
4.2.6 Potassium ............................................................................................................ 54
4.2.7 Calcium And Magnesium ................................................................................... 55
4.2.8 Cation Order Of Dominance In The Study Area ................................................ 56
4.2.9 Anion Order Of Dominance In The Study Area ................................................. 57
4.3 Trace Elements Analysis In The Rainwater ........................................................... 57
4.3.1 Copper, Manganese, Vanadium And Aluminium ............................................... 57
4.3.2 Cadmium, Arsenic, And Mercury ....................................................................... 58
4.4 Stable Isotopes Variation Of Rainfall In The Three Stations ................................ 58
4.4.1 Altitude Effect On The Stable Isotopes .............................................................. 64
4.4.2 Temperature And Amount Effect On The Stable Isotopes Of Rainfall ............. 68
4.5 Groundwater Chemistry ......................................................................................... 73
4.5.1 Physical Parameters ............................................................................................ 73
4.5.2 Chemical Parameters........................................................................................... 74
4.6 Stable Isotopes Composition Of Groundwater ...................................................... 78
University of Ghana http://ugspace.ug.edu.ghUniversity of Ghana http://ugspace.ug.edu.gh

vii
4.7 Sources Of Ions In The Rainwater And Groundwater ........................................... 81
CHAPTER FIVE ....................................................................................................... 84
5.0 CONCLUSION AND RECOMMENDATION ................................................. 84
5.1 Conclusion ............................................................................................................. 84
5.2 Recommendation ................................................................................................... 85
REFERENCES ........................................................................................................... 86
Appendices ................................................................................................................... 98
Apendix A: Physico-Chemical Paramerts Of Rainwater At Kpando .......................... 98
Apendix B. Physico-Chemical Paramerts Of Rainwater At Akatsi ........................... 100
Apendix C. Physico-Chemical Paramerts Of Rainwater At Amedzofe..................... 101
Appendix D. Physico-Chemical Parameters Of Groundwater At Amedzofe, Kpando
And Akatsi ................................................................................................................. 103
Appendix E. Rainfall Amount And δ 18
O And δ2H At Kpando. .............................. 104
Appendix F. Rainfall Amount And δ 18
O And δ 2H At Akatsi .................................. 105
Appendix G. Rainfall Amount And δ 18
O And δ 2H At Amedzofe ........................... 106
Apendix H. δ¹⁸O‰ And δ2H‰ In Groundwater In Akatsi, Amedzofe And Kpando
.................................................................................................................................... 108
Appendix I: δ18
O And δ2H Standard Reference Material .......................................... 109
University of Ghana http://ugspace.ug.edu.ghUniversity of Ghana http://ugspace.ug.edu.gh

viii
LIST OF TABLES
Table 1 Classification of water......................................................... 23
Table 2 Relative Abundance of O and H Isotopes.......................... 26
Table 3 Nuclear data of elements determined in this work............... 43
Table 4 Statistical summary of the physico-chemical parameters.... 47
Table 5 Summary of trace elements analysed................................... 58
Table 6 Statistical summary of rainfall, δ18
O, δ2H and d-excess
at the three stations............................................................. 59
Table 7 Statistical summary of the groundwater δ18
O and δ2H in
Akatsi, Amedzofe and Kpando.......................................... 78
University of Ghana http://ugspace.ug.edu.ghUniversity of Ghana http://ugspace.ug.edu.gh

ix
LIST OF FIGURES
Figure 1 Hydrological Cycle Source US EPA (2000h)......................................... 29
Figure 2 Map of the Study Area........................................................................... 34
Figure 3 Monthly minimum and maximum temperature distributions
and rainfall amount throughout the year in Kpando............................... 35
Figure 4 Monthly minimum and maximum temperature distributions
and rainfall amount throughout the year in Amedzofe............................... 36
Figure 5 Monthly minimum and maximum temperature distributions
and rainfall amount throughout the year in the Akatsi............................ 36
Figure 6 Variation of physical parameters................................................................. 46
Figure 7 Variation of chemical parameters............................................................... 56
Figure 8 Relationship between δ2H and δ
18O in rainfall at Akatsi.......................... 60
Figure 9 Relationship between δ2H and δ
18O in rainfall at Amedzofe................... 61
Figure 10 Relationship between δ2H and δ
18O in rainfall at Kpando...................... 61
Figure 11Relationship between δ2H and δ
18O in rainfall at Kpando,
Amedzofe and Akatsi............................................................................. 64
Figure 12 The relationship between altitude (m) and δ18
O‰ VSMOW in
Akatsi - Amedzofe .................................................................................. 66
Figure 13 relationship between altitude (m) and δ18
O‰ VSMOW in
Amedzofe – Kpando ............................................................................... 66
Figure 14 The relationship between altitude (m) and δ2H‰ VSMOW in Akatsi -
Amedzofe................................................................................................... 67
Figure 15 The relationship between altitude (m) and δ2H‰ VSMOW in
Amedzofe – Kpando................................................................................ 67
University of Ghana http://ugspace.ug.edu.ghUniversity of Ghana http://ugspace.ug.edu.gh

x
Figure 16 The relationship between monthly temperature and monthly
weighted mean δ 18
O ‰ VSMOW in Akatsi....................................... 69
Figure 17 The relationship between monthly temperature and monthly
weighted mean δ 18
O ‰ VSMOW in Amedzofe................................. 69
Figure 18 The relationship between monthly temperature and monthly
weighted mean δ 18
O ‰ VSMOW in Kpando..................................... 70
Figure 19 Relationship between monthly rainfall and monthly
weighted mean δ 18
O ‰ VSMOW in Akatsi......................................... 71
Figure 20 Relationship between monthly rainfall and monthly
weighted mean δ 18
O ‰ VSMOW in Amedzofe.................................. 72
Figure 21 Relationship between monthly rainfall and monthly
weighted mean δ 18
O ‰ VSMOW in Kpando..................................... 72
Figure 22 Relationship between δ 2H and δ
18O in groundwater
in Akatsi............................................................................................... 79
Figure 23 Relationship between δ 2H and δ
18O in groundwater
in Amedzofe........................................................................................... 80
Figure 24 Relationship between δ 2H and δ
18O in groundwater
in Kpando............................................................................................... 80
Figure 25 Relationship between rainwater δ18
O ‰ VSMOW and
Conductivity in the three stations........................................................... 82
Figure 26 Relationship between groundwater δ18
O ‰ VSMOW
Conductivity in the three................................................ .................... .. 83
University of Ghana http://ugspace.ug.edu.ghUniversity of Ghana http://ugspace.ug.edu.gh

xi
LIST OF ABBREVIATION
AAS…………………. Atomic Absorption Spectrophotometer
Akiti Line..................... δ²H=7.86 δ¹⁸O+13.61
DRWH......................... Domestic Rainwater Harvesting
EC…………………… Electrical conductivity
EPA………………….. Environmental Protection Agency
GAEC.......................... Ghana Atomic Energy Commission
GHARR 1..................... Ghana Research Reactor 1
GMWL......................... Global Meteoric Water Line
HPGe........................... High Power Germanium
IAEA............................. International Atomic Energy Agency
LMWL.......................... Local Meteoric Water Line
LVMWL....................... Lower Volta Meteoric Water Line
MCA............................ Multichannel Analyser
MDG............................ Millennium Development Goal
NAA............................. Neutron Activation Analysis
NGO............................. Non Governmental organization
NNRI............................ National Nuclear Research Institute
OA-ICOS..................... Off-axis Integrated Cavity Output Spectroscopy
TDS………………….. Total dissolved solids
TSS…………………... Total suspended solids
TWDB.......................... Texas Water Development Board
VSMOW…………….. Vienna Standard Mean Ocean Water
WHO………………… World Health Organization
WQI………………… Water Quality Index
University of Ghana http://ugspace.ug.edu.ghUniversity of Ghana http://ugspace.ug.edu.gh

xii
ABSTRACT
Harvesting rainwater for domestic use is one of the oldest technologies developed by
man. In Ghana, groundwater utilization challenges posed by dry wells and high levels
of contaminants such as iron, fluoride and other minerals in some geological
formations makes harnessing of rainwater for household use inevitable. Whiles
researchers are looking for efficient ways of dealing with contaminants associated
with these water sources, focus is gradually shifting to the development of enhanced
methods for rainwater harvesting. In this study, rainwater samples were collected
from Akatsi ( a coastal zone), Amedzofe (high altitude zone) and Kpando ( a forest
zone) in the Volta region of Ghana and analyzed for the physico-chemical parameters
such as pH, electrical conductivity (EC), total dissolved solids (TDS), colour,
turbidity, alkalinity, Ca2+
, K+, Na
+, Mg
2+, NO3
-, NH4
+, pH, Cl
-, and SO4
2-. The results
showed that, pH values of the Akatsi, Amedzofe and Kpando rainfall ranges from 5.40
to 6.85, 4.3 to 6.3 and 4.76 to 6.00 respectively. Amedzofe showed a relatively low
pH with 13.70% ranging from 4 to 5, 82.40% of the rainfall events fell within pH of 5
to 6 and 3.90% had pH less than 7 but greater than 6. About 96.10% of the total
rainfall events had pH less than 6. EC, TDS, turbidity and colour were generally low
with higher values recorded at Akatsi while Amedzofe recorded the lowest values.
The concentration of major ions and element-to-sodium ratios showed clear variations
with higher levels found in Akatsi (coastal zone) and lower levels found in Amedzofe.
Anion order of dominance in Akatsi, Kpando and Amedzofe are HCO3- >SO4
2- >Cl
-
>NO3-, HCO3
- >SO4
2- >Cl
->NO3
-and HCO3
- >Cl
-> SO4
2- >NO3
- respectively, while
cation order of dominance are Na+>Mg
2+>Ca
2+, Ca
2+> Na
+>Mg
2+and Na
+> Ca
2+>Mg
2+
for Akatsi, Amedzofe and Kpando respectively. Isotopic composition of rainwater was
also determined for the three areas. Akatsi (coastal zone) presents high values of δ18O
University of Ghana http://ugspace.ug.edu.ghUniversity of Ghana http://ugspace.ug.edu.gh

xiii
and δ2H, whereas rainwater in Amedzofe was characterized by low values of δ18O
and δ2H, Kpando on the other hand was intermediately high. The Local Meteoric
Water Line for the study area using rainfall greater than 20mm was defined as δ2H
=7.453 δ18
O + 8.621 (n=45; R2=0.907, rain > 20mm). Isotope fractionation in
precipitation, including depletion in both δ18
O and δ2H is primarily due to the rainout
and the altitude effects with temperature effect being insignificant. The calculated
altitude effect shows a gradual lapse rate of δ18
O and δ 2H of about -0.2‰/100 m and
-1.5 ‰/100 m for Akatsi and Amezofe respectively. Amedzofe and Kpando showed
an altitude effect of -0.15‰ /100 m. and -2 ‰/100 m for δ18
O and δ2H respectively.
The groundwater in the study area is mainly of meteoric origin with different months
of recharge. The plot of δ18
O and EC shows that, mineral dissolution is the main factor
controlling the groundwater salinization in Akatsi while Amedzofe and Kpando
groundwater chemistry are mainly controlled by evaporation.
University of Ghana http://ugspace.ug.edu.ghUniversity of Ghana http://ugspace.ug.edu.gh

1
CHAPTER ONE
1.0 INTRODUCTION
Water is one of the most important commodities for the sustenance of life;
consequently, clean and fresh water is vital for the wellbeing of the human society.
Many living organisms use water as their habitat.
In Ghana, as in many areas, surface water and groundwater constitute the main source
of water for domestic, industrial and agricultural uses. Water scarcity and pollution
problems have generated public discussions and concerns by both policy makers and
researchers. This has lead to several studies on the quality of groundwater and surface
water in Ghana using conventional methods (Kortatsi, 1998, Fianko et al., 2008,
Adomako et al., 2010 etc).
In recent years, however, stable isotopes were used as complementary tools to study
the origin and mixing pattern of groundwater (Akiti, 1980; Acheampong and Hess,
2000; Adomako et al., 2010, Gibrilla et al., 2010), groundwater recharge (Adomako et
al., 2010). However, these studies did not have enough information on the input
function (oxygen-18 and deuterium), which were scarce on precipitation composition.
Ghana records about 40 billion cubic meters of rainfall annually which is equal to nine
trillion gallons of water (Ministry of Water Resources, Works and
Housing).http://www.ghanabusinessnews.com/2011/07/19/.
Ghana therefore, has a great potential for rainwater harvesting for domestic use.
Several households in urban and peri-urban communities harvest and store rainwater
in small water storage containers. The technology has developed further to include
construction of large concrete reservoirs for schools, health centers, churches and
agricultural purposes.
University of Ghana http://ugspace.ug.edu.ghUniversity of Ghana http://ugspace.ug.edu.gh

2
Atmospheric precipitation is one important part of the natural water cycle that plays a
significant role in carrying chemical pollutants from the atmosphere to the earth‘s
surface. Water-soluble inorganic ions (Mg2+
, K+, Ca
2+, Na
+, Cl
-, NO3
-, etc) constitute a
significant portion of total particulate matter and precipitation samples and thus have
direct and indirect impacts on air quality, climate and ecosystems. To address various
issues related to these ions, their concentrations in air and in precipitation, the sources
and chemical mechanisms producing those ions need to be understood at local,
regional, and global scales.
To date, many studies around the world have revealed the source types, formation
mechanisms, chemical and physical characteristics, and dry and wet deposition of the
major water-soluble inorganic ions (Zhang et al.,2007), Chemical characteristics of
precipitation and Sulfate formation in atmospheric ultrafine particles, (Tu et al.,2005).
However, studies in the area are still limited. Volta Region has countless number of
migrants from its neighbouring countries, Togo and Nigeria to the East which has an
increase effect in the population.
Increased aerosol concentrations (sea and fumes from vehicle and industries) have a
strong impact on air/water quality. Removal of gases and aerosol by clouds and
precipitation, as in-cloud (rainout) and below-cloud (washout) processes, play an
important role in determining the distribution and concentration of pollutants in the
atmosphere (Feng et al.,2001; Tang et al., 2005). The formation of clouds relies on the
presence of aerosol particles, which act as cloud condensation nuclei, and
heterogeneous nucleation of water vapour leads to dissolution of the soluble materials
contained within the cloud condensation nuclei. These soluble materials comprise
with the initial chemical compositions of newly formed cloud droplets, rainfall.
University of Ghana http://ugspace.ug.edu.ghUniversity of Ghana http://ugspace.ug.edu.gh

3
Precipitation geochemistry results from a complex series of interactions between
cloud dynamics, microphysical processes, and a series of rainout and washout
chemical reactions in the atmosphere (Desboeufs et al., 2010).
Even though in Ghana, stable isotopes of rain water (δ18
O, δ2H) have been fairly
assessed (Akiti, 1980), data on rain water quality and chemical composition in Ghana
is scarce. Most studies involving stable isotopes of water are based to a large extent on
groundwater and surface water resources. Akiti (1980) and Armah (2000) employed
δ18
O and δ2H to study the salinization of groundwater in parts of southern Ghana
(Accra plains). Stable isotope results showed no relationship between the groundwater
system and possible seawater intrusion. Kortatsi (2006) employed chemical and
isotopic tools to characterize and identify the origin of salinity in the Accra plains of
Ghana. Acheampong and Hess (2000) used stable and radioactive isotopes to
investigate the source of recharge and the age of the shallow groundwater system
within the southern Voltaian sedimentary basin of Ghana. Generally, low tritium
concentrations in the groundwater samples were found in the range less than 1 to 7.2
TU and useful in the identification of modern recharge. JØrgensen and Banoeng-
Yakubo (2001) applied environmental isotopes (18
O, 2H, and
87Sr/
86Sr) in groundwater
with emphasis on saline groundwater aquifers in the Keta basin of Ghana and
discovered that ground waters from deep and dug wells in coastal aquifers are
characterized by relatively high chloride contents, and marine influence is evidenced
by well-defined mixing line for strontium isotopes, hydrogen and oxygen stable
isotopes with similar isotopic compositions of seawater.
Stable isotopes of water have also been used to investigate wetlands, to understand
their hydrological processes notably recharge and origin in the White Volta River
Basin, Densu Delta and Sakumono wetlands, under International Atomic Energy
University of Ghana http://ugspace.ug.edu.ghUniversity of Ghana http://ugspace.ug.edu.gh

4
Agency (IAEA) Coordinated Research Projects (Adomako et al., 2010) used δ18
O and
δ2H to estimate mean recharge rates into the groundwater system of the Densu river
basin as 110 to 250mm/year representing about 8% of annual rainfall.
The combination of chemical data with stable isotope (δ18
O and δ²H) data in
precipitation has proven to be a useful tool for; exploring the relationship between the
origins of air masses, precipitation characteristics (Craig, 1961; IAEA, 1980;
Prathibha et al., 2009), distinguishing the different sources that contribute to rainwater
chemistry (Tuncel and Ungor, 1996; Yamanaka et al., 2007).
This work, therefore, seeks to explore the relationship between chemical and isotopic
data of rainwater in Akatsi (coastal), Amedzofe (Mountainous) and Kpando (forest) in
the Volta region of Ghana.
Trace elements in the rainwater samples were also analysed using instrumental
neutron activation analysis with the objective of identifying the essential trace
elements for life or health and to investigate the migration of chemical species and the
distribution of these trace elements derived from pollution.
Rainwater is the natural primary input or natural recharge of groundwater and surface
water (Ganyaglo 2009). The process of recharge is very complicated, thus one of the
most important factors is the time delay between the time when the meteoric water
enters the soil profile, and the time when it is manifested as an effectively exploitable
groundwater source.
The actual recharge rate is control by several factors including the amount and the rate
of rainfall not lost to surface runoff and evapotranspiration, (Leap,1999).
University of Ghana http://ugspace.ug.edu.ghUniversity of Ghana http://ugspace.ug.edu.gh

5
This therefore implies that there is a need to investigate the interaction of rainwater–
groundwater in the study area; hence, this study will also attempt to explore the
relationship between the groundwater and rainwater in the study area.
1.1 OBJECTIVES
The aim of this study is to understand the chemical composition of rain water
collected from three (3) zones in the Volta Region and also to identify the severity of
threats due to expanding industries on the physical, chemical and stable isotope
composition of the rainwater.
Other specific objectives include;
To identify the origin of solutes in rainwater and determine the rainwater
quality.
To characterize the rainwater cycle by comparing my data with isotopic
results from surrounding areas
To investigate the partial pattern of rainfall changes and possible causes
thereof and the seasonal variation of stable isotopes (δ1⁸O and δ²H) in the three
major areas.
To investigate continental effect, amount effect and altitude effect.
To investigate the interaction between rainwater and groundwater.
1.2 STATEMENTS OF THE PROBLEM
In Ghana and the Volta region in particular, most of the agricultural activities, about
90-98% depend on rainwater. Small and peri-urban communities are increasingly
accepting rainwater harvesting as a technology choice capable of meeting their water
University of Ghana http://ugspace.ug.edu.ghUniversity of Ghana http://ugspace.ug.edu.gh

6
demands for domestic activities. However, little knowledge of the rainwater quality,
chemical composition and sources of solute deposits in the rainwater of the area are
known. Hence, the spatial and temporal variations in the rainfall chemistry of these
regions are not clearly understood.
The stable oxygen (δ18
O) and hydrogen (δ2H) isotopic compositions of water are
widely used as tracers to study the global hydrological cycle. Various researchers have
observed that heavy isotopes in rainfall and snow vary widely and predictably across
the globe, providing a finger print or label incorporated in climate archives such as ice
cores, lake sediments, corals, tree rings, limestone caves and groundwater, (Ichiyanagi
2007; Wooller 2007; Clark and Fritz, 1997).
The patterns of isotopes in precipitation are the result of global and local
meteorological processes. These isotopes therefore serve as ideal hydrological tracers
and have been applied to study past climate, paleohydrology, wildlife migration,
archaeology and forensics. Ichiyanagi (2007) stated that stable isotopes in
precipitation (δ18
O, δ2H) contain information on both the origins of precipitation and
its transport because heavy and light isotope species undergo different fractionation
during phase changes.
1.3 JUSTIFICATION
As a vital natural resource, water is fundamental for the sustainable development of
the economy, the ecosystem, and biodiversity. Therefore, water security and related
implications for ecosystem and river diversity, especially the variability and
availability of regional water resources under the influence of climatic change and
human activities are warmly discussed in recent years (Xu and Singh, 2004).
University of Ghana http://ugspace.ug.edu.ghUniversity of Ghana http://ugspace.ug.edu.gh

7
Nevertheless, it is being increasingly recognized that water resources are deteriorating
in many parts of the world. While researchers are looking for efficient ways of dealing
with contaminants associated with these water sources, challenges posed by dry wells,
as well as excessive levels of contamination especially minerals in the groundwater
resources of some geological formations makes harnessing of rainwater for household
use unavoidable.
If rainwater resources are managed well, emerging phenomena like flooding and
erosion in our communities could be contained. The resource if properly harnessed
has benefits, which would contribute to meeting our millennium development goals
(MDG) on water and environmental sanitation by year 2015.
Precipitation being the primary input to surface water and groundwater systems; most
of the studies provide little information on the chemical and stable isotope
composition of rainwater in Ghana ( Apraku A and Adu-Kumi M, 2014; Cobbina et
al.,2013; Akoto et al., 2011).
The study area shares boundary in the coast with the heavy industrial city of Ghana,
Tema and there might be severe threats these expanding industries may have on
rainwater with accompanying chemical deposits. Therefore for sustainable water
resource planning and management, adequate hydrological data and information on
rainfall patterns, availability of water within the catchment area should be
investigated. There is therefore the need for a comprehensive study of rainwater in this
region that will combine chemical and isotopic indicators.
University of Ghana http://ugspace.ug.edu.ghUniversity of Ghana http://ugspace.ug.edu.gh

8
CHAPTER TWO
2.0 LITERATURE REVIEW
In this Chapter an extensive literature has been reviewed in the areas of; water supply
in the Volta region of Ghana, rainwater harvesting and storage, rainwater quality
including stable isotopes in hydrology and hydrological cycle.
2.1 WATER SUPPLY IN THE VOLTA REGION OF GHANA
Water as a valuable natural resource, sustains the environment and supports
livelihood. However, access to potable water is still a challenge to many developing
countries. WHO (1997) estimated about 1.2 billion people in developing countries are
without access to ―safe water‖ and a further 2 billion lack adequate sanitation. Many
rural communities in Ghana depend on rivers, streams, hand dug-wells, boreholes and
rainwater for their water needs (Zakaria Issaka, 2011). Most of these water supply
sources especially the surface waters are increasing under threat of pollution and serve
as the main sources of water-borne and water-related diseases (Gyau-Boakye and
Dapaah-Siakwan, 1999). About 70 % of diseases in Ghana are currently linked to
insufficient water supply and sanitation issues (IFFM, 2002).
In the Volta region of Ghana, several efforts by the government and other Non-
governmental organizations were made to provide potable water to the communities,
(Danida, 2003). Following water resources sector studies that were commissioned by
the Government of Ghana in 1969–1970, it became the official policy that for the
supply of potable water, communities below 500 inhabitants are to be helped in the
construction of hand-dug wells, (Mensah, 1998). Communities between 500 and 2,000
in population are supplied by hand-dug wells or boreholes fitted with hand pumps,
whereas communities of population between 2,000 and 5,000 are supplied with pipe-
University of Ghana http://ugspace.ug.edu.ghUniversity of Ghana http://ugspace.ug.edu.gh

9
borne systems. While some of these pipe-borne systems have surface water sources,
most of them are based on groundwater resources. Where these technologies are not
feasible, rain catchment, spring sources, and surface water from dams are used. Those
communities that have not yet benefited from these policies still rely on the traditional
sources for their water supply needs. These sources include dug wells, ponds, dugouts,
springs, ephemeral streams, and rainwater harvesting.
2.1.1 GROUNDWATER AND SURFACE WATER
Groundwater occurs almost everywhere beneath the earth surface not in a single
widespread aquifer but in thousands of local aquifer systems and compartments that
have similar characters (Moore, 2002; Banoeng-Yakubo, 2007). Knowledge of the
occurrence, replenishment, and recovery of groundwater has special significance in
arid and semi-arid regions due to discrepancy in monsoonal rainfall, insufficient
surface waters and over drafting of groundwater resources (De Vries and Simmers,
2002).
The quality of groundwater depends on the quality of recharged water, atmospheric
precipitation, inland surface water, and on sub-surface geochemical processes,
(Appelo and Postma, 1993). Temporal changes in the origin and constitution of the
recharged water, hydrologic and human factors, may cause periodic changes in
groundwater quality.
Several studies on groundwater in the coastal area of the Volta region especially the
Keta basin exist in literature. Kortatsi et al., (2006) studied potential impact of large-
scale groundwater abstraction on the shallow groundwater and on crop production
University of Ghana http://ugspace.ug.edu.ghUniversity of Ghana http://ugspace.ug.edu.gh

10
within the Keta Strip using geophysical and hydrochemical data. The study revealed
that, shallow groundwater can support only medium to high salt tolerant crops such as
shallot and onions. The study further postulated that, abstraction of large volume of
water from the shallow aquifer will result in the lowering of water table by
approximately 1.0 m per year. The consequence of this will be the up coning of the
fresh/saline water interface probably by as much as 4.7 m, resulting in salinisation of
the fresh water lenses particularly around the lagoon end where most of the shallot
farms are situated. The author further stated that, even though, post irrigation rainfall
will be adequate to nullify the water table depression, once the fresh water is
contaminated, it is extremely difficult to decontaminate. Consequently, the shallow
groundwater will evolve from medium through high to very high salinity hazard to
crops. Specific ions toxicity will also increase due to increment in the concentrations
of individual ions. Thus, the previously freshwater system will become unsuitable for
the production of even high salt tolerance crops. This will effectively halt the lucrative
shallot and other vegetable farming in the Keta Strip and thus signify socio-economic
disaster for the Keta Strip in particular and Ghana in general.
Yidana et al., (2007) also studied groundwater in the Keta basin and concluded that,
despite the threat of sea water intrusion, the groundwater is suitable for irrigation
without adverse effect on soil hydraulic properties. Later in 2010, studies by Yidana et
al., (2010) on the quality of groundwater in the Keta basin using Water Quality Index
(WQI) categorized the groundwater as good, fair and marginal.
Earlier studies on the origin of groundwater in the Keta basin using stable isotopes by
Akiti (1977), Bannerman (1994), Nerquaye-Tetteh (1993) postulated a hydraulic
connectivity between limestone aquifer and Mono River. A much later study by
Helstrup (2006) using δ2H and δ
18O composition of groundwater from the limestone
University of Ghana http://ugspace.ug.edu.ghUniversity of Ghana http://ugspace.ug.edu.gh

11
aquifer in the Coastal Sedimentary Basin of Togo does not show any influence of
evaporation, which excludes the hypothesis, suggested in previous studies (Akiti,
1977; Bannerman, 1994; Nerquaye-Tetteh, 1993). However, all these studies
confirmed the existence of old groundwater in the basin of up to 15000 years.
However, in the Akatsi district which forms part of the study area, only few studies on
groundwater exist. Tay (2006) studied the chemical characteristics of groundwater in
the Akatsi districts by collecting water samples from 34 boreholes. The results
revealed that groundwater in the district are soft but slightly acidic with pH values
ranging from 5.75 –7.39. Groundwater in the district was also found to be mineralized
with conductivity ranging from 170 – 6440 μS/cm. He concluded that, NO3-N, SO42-
and Cl- ion concentrations in some boreholes in the district was at such elevated levels
that serious health effects and risks might arise after prolonged and continuous use.
This establish the fact that groundwater in the study area has high contamination level
due to agricultural practices and improper sanitation.
The results of these analyses point to a future threat to groundwater supply in the area
due to increasing water quality deterioration. This is shown by the high electrical
conductivity (EC) values. However, groundwater studies and data in the forest
(Kpando) and mountainous (Amedzofe) are scarce.
Rivers, streams, springs, lakes and ponds mainly constitute surface water in the study
area. The forest area is mainly dominated by the River Volta, the mountainous areas
by network of springs while the coastal area is dominated by rivers and some
ephemeral streams. These water sources are heavily polluted with faecal matter from
University of Ghana http://ugspace.ug.edu.ghUniversity of Ghana http://ugspace.ug.edu.gh

12
the communities along the water sources and chemical deposits from agricultural
practices.
2.1.2 RAINWATER
Rain is liquid water in the form of droplets that have condensed from atmospheric
water vapour and then precipitated (become heavy enough to fall under gravity). Rain
is a major component of the water cycle and is responsible for depositing most of the
freshwater on the Earth. It provides suitable conditions for many types of ecosystems,
as well as water for hydroelectric power plants and crop irrigation (Vörösmarty et al.,
2010).
The major cause of rain production is moisture moving along three-dimensional zones
of temperature and moisture contrasts known as weather fronts. If enough moisture
and upward motion is present, precipitation falls from convective clouds (those with
strong upward vertical motion) such as cumulonimbus (thunder clouds) which can
organize into narrow rain bands. In mountainous areas, heavy rainfall is possible
where upslope flow is maximized within windward sides of the terrain at elevation
which forces moist air to condense and fall out as rainfall along the sides of
mountains. On the leeward side of mountains, desert climates can exist due to the dry
air caused by down slope flow which causes heating and drying of the air mass (Dai,
2006). The movement of the monsoon trough, or intertropical convergence zone,
brings rainy seasons to savannah climes.
The urban heat effect leads to increased rainfall, both in amounts and intensity,
downwind of cities. Global warming causes change in the precipitation pattern
globally, including wetter conditions across Eastern North America and drier
University of Ghana http://ugspace.ug.edu.ghUniversity of Ghana http://ugspace.ug.edu.gh

13
conditions in the tropics with Antarctica being the driest continent (Arnell, 1999; Alan
et al., 2003). The globally averaged annual precipitation over land is 715 mm
(28.1 in), but over the whole Earth it is much higher at 990 mm/ 39in (Kottek et al.
2006). Climate classification systems such as the Köppen-Geiger climate
classification system use average annual rainfall to help differentiate between
differing climate regimes. Rainfall is measured using rain gauges. Rainfall amounts
can be estimated by weather radar.
2.1.2.1 FORMATION OF RAINWATER
Air contains water vapour and the amount of water in a given mass of dry air, known
as the mixing ratio, is measured in grams of water per kilogram of dry air (g/kg)
(Kempler 2009). The amount of moisture in air is also commonly reported as relative
humidity; which is the percentage of the total water vapour air can hold at a particular
air temperature. How much water vapour a parcel of air can contain before it becomes
saturated (100% relative humidity) and forms into a cloud (a group of visible and tiny
water and ice particles suspended above the Earth's surface) depends on its
temperature (Glossary of Meteorology, June 2000). Warmer air can contain more
water vapour than cooler air before becoming saturated. Therefore, one way to
saturate a parcel of air is to cool it.
There are four main mechanisms for cooling the air to its dew point (this is the
temperature to which a parcel must be cooled in order to become saturated): adiabatic
cooling, conductive cooling, radiational cooling, and evaporative cooling (Mark,
2005).
Adiabatic cooling occurs when air rises and expands. The air can rise due
to convection, large-scale atmospheric motions, or a physical barrier such as a
University of Ghana http://ugspace.ug.edu.ghUniversity of Ghana http://ugspace.ug.edu.gh

14
mountain (orographic lift). Conductive cooling occurs when the air comes into contact
with a colder surface, usually by being blown from one surface to another, for
example from a liquid water surface to colder land. Radiational cooling occurs due to
the emission of infrared radiation, either by the air or by the surface
underneath. Evaporative cooling occurs when moisture is added to the air through
evaporation, which forces the air temperature to cool to its wet-bulb temperature, or
until it reaches saturation (Fovell, 2004).
The main ways water vapour is added to the air are: wind convergence into areas of
upward motion, precipitation or virga falling from above, daytime heating evaporating
water from the surface of oceans, water bodies or wet land, transpiration from
plants, cool or dry air moving over warmer water, and lifting air over
mountains. Water vapour normally begins to condense on condensation nuclei such as
dust, ice, and salt in order to form clouds. Elevated portions of weather fronts (which
are three-dimensional in nature) force broad areas of upward motion within the Earth's
atmosphere which form clouds decks such as altostratus or cirrostratus (Pidwirny
2007; FMI (2007).
2.1.2.2 RAINWATER HARVESTING AND STORAGE
Rainwater harvesting is considered as the oldest technology developed by man to
provide potable water for domestic use (Boers and Ben-Asher,1982). In Africa,
rainwater harvesting projects have increased in recent years due to the increased
number of polluted or dried-out boreholes and wells or neglected water supplies in
rural communities (Gould and Nissen-Petersen, 1999). Although rainwater harvesting
is gaining popularity in sub-Saharan Africa, it faces some challenges. First, rapid
population growth in urban areas accompanied by increase in industrialization leading
University of Ghana http://ugspace.ug.edu.ghUniversity of Ghana http://ugspace.ug.edu.gh

15
to release of pollutants into the atmosphere such as chemical contaminants may
dissolve during rainfall and also microbial risks can be introduced through bird
droppings. Second, the roof types and sizes of many rural houses are not suitable for
rainwater harvesting and can compromise the system‘s efficiency and even the quality
of water. Lastly, due to high installation and storage costs, low income households are
more likely to invest in materials that are within their budgets and not those that are
optimum for the system (Thomas, 1998).
The technique was later developed to cover the collection of run off for agricultural
purposes and installation of large reservoirs that are used to regulate flooding, in some
developed countries such as Japan, (Mooyoung, 2004).
In Ghana, rainwater harvesting started at the household level where small water
storage containers are used to collect and store rainwater during storms. Currently, the
technology has developed further to include construction of large concrete reservoirs
for schools, health centers and churches. Storage tanks are the most expensive part of
Domestic Rainwater Harvesting System and may be located above or below the
ground (Lundgren and Akerberg, 2006). Storage tanks are installed to make for later
use of water and aid self-sufficiency. The size of rainwater tank is dictated by the
rainwater supply, water demand, and length of dry spell, the roof surface area,
aesthetics, personal preference, and budget (TWDB, 2005). The cost of rainwater
tanks depends on size, make, installation, additional fittings and supplies. There are
many types of rainwater storage containers in different geographical regions.
Earthenware cisterns, large pots, metal and plastic drums.
University of Ghana http://ugspace.ug.edu.ghUniversity of Ghana http://ugspace.ug.edu.gh

16
Polyethylene tanks are relatively inexpensive and durable, lightweight, and long
lasting. Polyethylene tanks are available in capacities from 50 - 15,000 gallons.
Rainwater collected and stored in plastic water tanks remains naturally acidic and can
react with the copper pipes that carry the water to household taps (TWDB, 2005). The
naturally acidic rainwater can corrode the copper pipe which causes gastric problems
and headaches, and in severe cases cirrhosis of the liver. A bag of limestone chips are
added to a plastic tank to make the water alkaline.
Metal tanks are also available in sizes from 150 - 2,500 gallons, and are lightweight
and easy to relocate (TWDB, 2005). Most metal tanks are corrugated galvanized steel
dipped in hot zinc for corrosion resistance. They can be lined with polyethylene or
coated inside with epoxy paint.
The other most commonly used storage tank is the concrete tanks. The Concrete is a
composite material consisting of a cement binder in which an inert aggregate is
embedded. One advantage of concrete tanks is their ability to decrease the
corrosiveness of rainwater by allowing the dissolution of calcium carbonate from the
walls (Lundgren and Akerberg, 2006). Cement is subject to deterioration on prolonged
exposure to aggressive water, due to the dissolution of lime or chemical attack by
aggressive ions such as chloride or sulfate, and this may result in structural failure.
2.1.2.3 RAINWATER QUALITY
Rainwater is relatively free from impurities except those scavenged by rain from the
atmosphere, but the quality of rainwater may deteriorate during harvesting, storage
and household use (Polkowska et al., 2001). Wind-blown dirt, leaves, faecal droppings
University of Ghana http://ugspace.ug.edu.ghUniversity of Ghana http://ugspace.ug.edu.gh

17
from birds and animals, insects and contaminated litter on the catchment areas can be
sources of contamination of rainwater, leading to health risks from the consumption of
contaminated water from storage tanks. Poor hygiene in storing water in and
abstracting water from tanks or at the point of use can also represent a health concern.
However, risks from these hazards can be minimized by good design and practice.
Well designed rainwater harvesting systems with clean catchments and storage tanks
supported by good hygiene at point of use can offer drinking-water with very low
health risk, whereas a poorly designed and managed system can pose high health
risks.
Microbial contamination of collected rainwater indicated by E. coli (or, alternatively,
thermotolerants coliforms) is quite common, particularly in samples collected shortly
after rainfall. Pathogens such as Cryptosporidium, Giardia, Campylobacter, Vibrio,
Salmonella, Shigella and Pseudomonas have also been detected in rainwater (Brodie
et al 2006). However, the occurrence of pathogens is generally lower in rainwater than
in unprotected surface waters, and the presence of non-bacterial pathogens, in
particular, can be minimized (Chang and Crowley, 1993).
Higher microbial concentrations are generally found in the first flush of rainwater, and
the level of contamination reduces as the rain continues (Kingett Mitchell, 2003). A
significant reduction of microbial contamination can be found in rainy seasons when
catchments are frequently washed with fresh rainwater. Storage tanks can present
breeding sites for mosquitoes, including species that transmit dengue virus.
Rainwater is slightly acidic and very low in dissolved minerals; as such, it is relatively
aggressive. Rainwater can dissolve heavy metals and other impurities from materials
University of Ghana http://ugspace.ug.edu.ghUniversity of Ghana http://ugspace.ug.edu.gh

18
of the catchment and storage tank. In most cases, chemical concentrations in rainwater
are within acceptable limits; however, elevated levels of zinc and lead have sometimes
been reported (Quek and Förster, 1993). This could be from leaching from metallic
roofs and storage tanks or from atmospheric pollution.
Rainwater lacks minerals, but some minerals, such as calcium, magnesium, iron and
fluoride, in appropriate concentrations are considered very essential for health.
Although most essential nutrients are derived from food, the lack of minerals,
including calcium and magnesium, in rainwater may represent a concern for those on
a mineral-deficient diet. In this circumstance, the implications of using rainwater as
the primary source of drinking-water should be considered. The absence of minerals
also means that rainwater has a particular taste or lack of taste that may not be
acceptable to people used to, drinking other mineral-rich natural waters.
Hydrochemistry study of rainwater is an important aspect for drinking, irrigation and
industrial purposes. Hydrochemistry application has been used to help define the
chemistry of waters in areas all over the world. The chemical composition of
rainwater has a direct linkage on the quality which also has important implications on
health and environment (Peterson et al, 1971).
The importance of water quality in human health has recently attracted a great deal of
interest. In the developing world, 80% of all diseases are directly related to poor
drinking water and unsanitary conditions (Olajire & Imeokparia, 2001). Rainwater
contains many chemicals and each has its importance and for that matter the
acceptable concentration levels. The chemical composition of rainwater has a direct
bearing on the quality and the factors that influence the quality of groundwater in a
particular basin and can be diverse and varied. Physical parameters such as pH, TDS,
University of Ghana http://ugspace.ug.edu.ghUniversity of Ghana http://ugspace.ug.edu.gh

19
Salinity and Conductivity and chemical parameters such as Cl-, NO3
-, SO4
2-, HCO3
-,
Ca2+
, Mg2+
, Na+, K
+, are normally used to ascertain the quality of the water.
2.1.2.4 RAINWATER QUALITY STUDIES IN GHANA
Despite the over emphasis on groundwater and surface water studies in Ghana, few
studies exist for rainwater quality. Bhavananda (2010) studied the potential of rain
water harvesting in Ayigya a suburb of Kumasi. The studies focused on the techno-
financial feasibility of adopting rain water harvesting in the most cost-effective way at
household level. The work revealed that rooftop rain water harvesting is a techno-
financially viable option considering the perception of the various stakeholders and
the availability of various building components suitable for adopting the system at
household level.
Osei Asare (2004) worked on Household Water Security and Water Demand in the
Volta Basin of Ghana. Barnes (2009) assessed the current state of rainwater harvesting
in the Northern Region of Ghana and makes recommendations regarding it and how
rainwater harvesting could be used to address Pure Home Water‘s goal of reaching 1
million people in the next five years with safe drinking water. Anna et al., (2006)
researched on rainwater harvesting in the peri-urban areas of Accra: It‘s status and
prospects and concluded that the peri-urban areas of Accra are appropriate for
Domestic Rainwater Harvesting (DRWH), but only as a complementary source of
water supply.
Issaka, (2011) studied appropriate rainwater harvesting and domestic water quality a
case study of central Gonja district and recommended rainwater generally for
drinking, cooking, bathing and washing for the people of Central Gonja district.
University of Ghana http://ugspace.ug.edu.ghUniversity of Ghana http://ugspace.ug.edu.gh

20
Apraku and Adu-Kumi, (2013) assessed the physico-chemical and bacteriological
parameters of rain water in Adukrom-Akwapim where heavy rain falls were
experienced during the wet season. Direct rainfall, stored rainwater and roof
catchment rainwater were sampled and studied. The result showed a significant
increase in physico-chemical and bacteriological parameter from the direct rainfall to
roof catchment and the stored rainwater. They suggest a form of treatment before use
for drinking.
Akoto et al., (2011) carried out a comprehensive study on the chemical composition of
rainwater in Obuasi a mining community in Ghana. The rain water in Obuasi was
found to be acidic (4.0 to 5.6). The rainwater chemistry in the area was found to be
strongly influenced by the local anthropogenic activities in the area (mining) with
Lead (Pb) found to be above the WHO permissible limit of 0.01mg/l for drinking
water.
2.2 PHYSICAL PARAMATERS
2.2.1 pH
The pH is an important variable in water quality assessment as it influences many
chemical and biological processes within a water body and all processes associated
with water supply and treatment. The pH is a measure of the acid balance of a solution
and is defined as the negative of the logarithm to the base 10 of the hydrogen ion
concentration (Butler, 1964). The pH scale runs from 0 to 14 (i.e. very acidic to very
basic), with pH 7 representing a neutral condition. At a given temperature, pH (or the
hydrogen ion activity) indicates the intensity of the acidic or basic character of a
solution and is controlled by the dissolved chemical compounds and biochemical
processes in the solution (Chapman, 1996). Water undergoes slight dissociation into
University of Ghana http://ugspace.ug.edu.ghUniversity of Ghana http://ugspace.ug.edu.gh

21
hydrogen ions (H+) and hydroxyl ions (OH
-). When the concentrations of these two
ions are equal, the solution is considered neutral. If the concentration of hydrogen ions
is larger than the concentration of hydroxyl ions, the solution is acidic. If hydroxyl
ions are in greater concentration, the solution is considered basic.
The acidity of water is generally expressed by concentration of hydrogen and
hydroxyl ions in solution, (in moles per litre). Knobel et al., (1988) observed that pH
can be affected by the presence of other species that controls the water types, for
instant predominantly calcium-magnesium bicarbonate water have low dissolved
solids content and low pH near outcrop recharge areas while predominantly sodium
bicarbonate water types have high dissolved solids content and high pH, down
gradient. A high aluminium concentration also has the propensity of reducing the
acidity level because the Al can undergo hydrolysis to give excess hydroxonium ions
(OH-). Kortatsi (2006) observed that boreholes with pH in the basic region are
associated with high Al, As, Mn, Fe, and Hg with concentrations significantly above
their respective detection limits in the Ankobra Basin. Low pH values of rainwater
might also be as a result of other factors that are anthropogenic or extreme natural
conditions. Driscoll (1995) stated that waters with pH lower than 4.5 probably contain
free mineral acids from volcanic gases or contamination from certain industrial
wastes. Rainwater quality can be influenced by the pH level. A low pH level could
induce the dissolution of trace and toxic elements into the rainwater.
2.2.2 CONDUCTIVITY (μS/cm)
Total dissolved solids (TDS) comprise inorganic salts (principally calcium,
magnesium, potassium, sodium, bicarbonates, chlorides and sulphates) and some
small amounts of organic matter that are dissolved in water (Hayes, 2004). Electrical
University of Ghana http://ugspace.ug.edu.ghUniversity of Ghana http://ugspace.ug.edu.gh

22
conductivity (EC) is related to the amount of total dissolved salts (TDS), or the total
amount of dissolved ions in water (Freeze and Cherry, 1979). Electrical conductivity
is the ability of a substance to conduct an electrical current. The more salts are
dissolved in water the higher is the value of the electrical conductivity. Pure water has
a very low electrical conductivity because it contains only H2O without salts or
minerals. Conductivity changes with storage time and temperature. Measurement is
therefore made in situ or in the field directly after sampling. Since each ion has its
own specific ability to conduct current, EC is only an estimate of the total ion
concentration. The water temperature affects the electrical conductivity so that its
value increases from 2 up to 3% per 1 degree Celsius (Moore, 1989).The ability of
rainwater to conduct an electrical current is it‘s conductivity. The electrical
conductivity of rainwater is a function of temperature, type of ions present, and
concentration of various ions. Conductivity readings are usually adjusted to 250C so
that variations in conductivity are a function only of the concentration and types of
dissolved constituents present (Freeze and Cherry, 1979). Thus in the absence of
adequate data on total dissolved solids (i.e. all solid material in solution, whether
ionised or not) electrical conductivity values could be used to express the total content
of dissolved substances in the rainwater. The relationship between TDS (mg/L) and
EC (μS/cm) is often described by a constant that varies according to chemical
composition:
TDS = A x EC (1)
Where;
A is in the range of 0.55 to 0.75
Typically the constant is high for chloride-rich waters and low for sulphate-rich
waters. Chapman (1996). Freeze and Cherry (1979) and Davies and Dewiest (1996)
University of Ghana http://ugspace.ug.edu.ghUniversity of Ghana http://ugspace.ug.edu.gh
23
classified waters into the following categories based on TDS; Freshwater (0-
1000mg/L), Brackish water (1000-10000mg/L), Saline water (10000- 100000mg/L),
Brine water (more than 100000mg/L). Low TDS values are normally associated with
recharge areas and referred to as young waters while high TDS values are associated
with discharge areas and referred to as old waters.
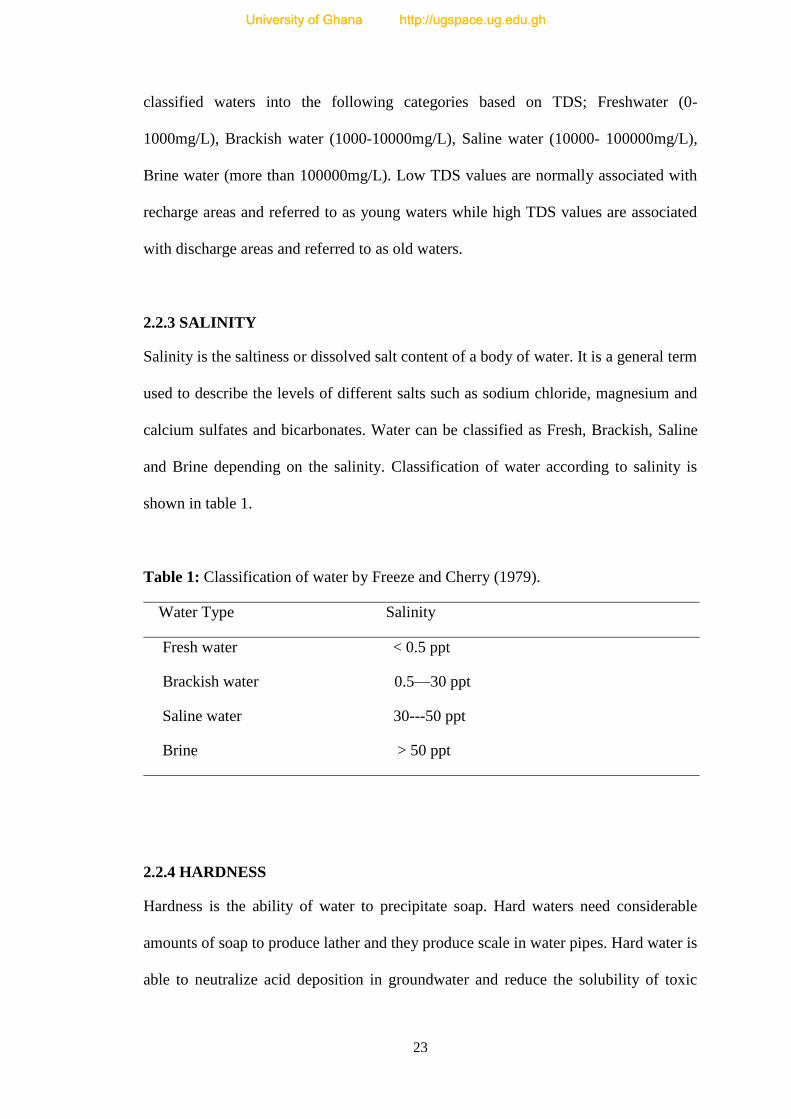
2.2.3 SALINITY
Salinity is the saltiness or dissolved salt content of a body of water. It is a general term
used to describe the levels of different salts such as sodium chloride, magnesium and
calcium sulfates and bicarbonates. Water can be classified as Fresh, Brackish, Saline
and Brine depending on the salinity. Classification of water according to salinity is
shown in table 1.
Table 1: Classification of water by Freeze and Cherry (1979).
Water Type Salinity
Fresh water < 0.5 ppt
Brackish water 0.5—30 ppt
Saline water 30---50 ppt
Brine > 50 ppt
2.2.4 HARDNESS
Hardness is the ability of water to precipitate soap. Hard waters need considerable
amounts of soap to produce lather and they produce scale in water pipes. Hard water is
able to neutralize acid deposition in groundwater and reduce the solubility of toxic
University of Ghana http://ugspace.ug.edu.ghUniversity of Ghana http://ugspace.ug.edu.gh

24
metals (Radojevic and Bashkin, 1999). The major contributors to water hardness are
dissolved calcium and magnesium ions. These ions combine with soap to form
insoluble precipitates.
2.2.5 ALKALINITY
Alkalinity is the capacity to neutralize acid. In water chemistry it is the capacity to
accept protons (De Zuane, 1990). The primary sources of alkalinity in rainwater are
carbonate ions (CO32-
), bicarbonate ions (HCO3-), and hydroxyl ions (OH
-); of these
three, carbonate and bicarbonate are the most common. Total alkalinity is the sum of
all three kinds of alkalinity.
CO2 + H2O ↔ H2CO3 (2)
H2CO3 ↔ H+ + HCO3
-……..pH 4.5 (3)
H2CO3 ↔ 2H+ + CO3
2-……. pH 8.3 (4)
Measurements must be made in the field at the time of sampling since alkalinity is
controlled by dissolution or degassing of CO2 which can shift the source of alkalinity.
The alkalinity value gives an estimate of non-acid constituents of water. When the
―basic‖ constituents are limited to salts of calcium and magnesium, alkalinity equals
hardness. When alkalinity is greater than hardness, basic salts, such as those of sodium
and potassium, may also be present. When alkalinity is less than hardness, the
presence of salts of calcium and magnesium are more likely to be sulphates instead of
carbonates (De Zuane, 1990).
Radaideh et al., (2009) studied the quality of harvested rain water for domestic use.
Their work focused on the quality of the rain water in different storage containers.
University of Ghana http://ugspace.ug.edu.ghUniversity of Ghana http://ugspace.ug.edu.gh

25
They concluded that rain water harvesting is an attractive option for increasing
available water resources. However, the water in some of the storage containers were
found to be heavily contaminated with microbes hence unsuitable for drinking. The
study also found a significant variation in the quality of the stored water from different
locations and recommended the following:
Cleaning of rooftops or catchments before harvesting
Locating cesspools far away from storage tanks
Regular monitoring of the water quality
Addition of disinfectants
Despins et al., (2009), studied rain water quality from rain water harvesting systems
around the city of Guelph in Ontario, Canada. The study revealed about 31% and 13%
of the samples were contaminated with total and faecal coliforms respectively. The
study also observed a significant change in the quality of the rain water due to
environmental conditions and a consistent high quality of the rain water through the
selection of appropriate catchment and storage materials.
2.3 STABLE ISOTOPE STUDIES IN HYDROLOGY
Hydrological chemistry and stable isotopes in surface water have been used to
examine the dynamics of river and lake mixing (Zhu et al., 2008; Yang et al., 2010,
2011), and to investigate groundwater recharge and evolution (Ma et al., 2005, 2009).
Oxygen and hydrogen isotopes have also been used as a dating tool to identify the age
of ground waters that are recharged under the colder-than-current climates of the late
Pleistocene (Edmunds et al., 2006; Su et al., 2009)
In recent times, stable isotopes have contributed immensely to studies and
investigations in hydrogeology. Many hydrogeological studies use the stable isotopes
University of Ghana http://ugspace.ug.edu.ghUniversity of Ghana http://ugspace.ug.edu.gh

26
of water molecules to determine groundwater origin, recharge mechanism and rock
water interaction (Fontes 1980).
Stable isotopes are those isotopes that do not undergo radioactive decay so their nuclei
are stable and their mass numbers remain the same.
In hydrological studies, the stable isotope of most interest to hydrologist/
hydrogeologists are hydrogen and oxygen. Hydrogen has three isotopes of which two
are stable; 1H and
2H and the unstable or radioactive
3H. Oxygen also has three stable
isotopes 16
O, 17
O and 18
O. The stable isotopes of oxygen-18 and deuterium are used in
this study to provide information on hydrological processes. The relative abundance of
these stable isotopes of hydrogen and oxygen are given in table 2.
Table 2: Relative Abundance of O and H Isotopes
Hydrogen Oxygen
Isotope Abundance Isotope Abundance 1H 0.99985
16O 0.9975
2H
17O 0.00038
18
O 0.00205
It is analytically difficulty to determine absolute isotope abundance but relative
measurements based on the comparisms of the samples with a standard can be done
easily and economically. For 18
O and 2H the reference is Vienna Standard Mean
Ocean Water (VSMOW) and results are expressed as parts per thousand (per mil, ‰),
difference from the reference (Kendall and McDonnell, 1998).The isotopic ratios are
expressed in delta units (δ) differences relative to an arbitrary standard.
δ = (R/RSTD - 1)1000. (5)
Where, R and Rstd are the isotopes ratio of the samples and the standard respectively.
The process by which the isotope content of water changes as a result of evaporation,
condensation, freezing, melting, chemical reactions or biological processes is known
University of Ghana http://ugspace.ug.edu.ghUniversity of Ghana http://ugspace.ug.edu.gh

27
as isotope fractionation (Fonte 1980). Evaporation of water results in isotope
fractionation of hydrogen and oxygen such that 16
O and 1H preferentially enter the
vapour phase, while 18
O and 2H are concentrated in the liquid phase (Freeze and
Cherry, 1979).
Precipitation geochemistry results from an intricate series of interactions between
cloud dynamics, microphysical processes and a series of rainout and washout
chemical reactions in the atmosphere (Desboeufs et al., 2010). The combination of
chemical data with stable isotope (δ18
O and δ2H) data in precipitation has proven to be
a useful tool for exploring the relationship between the origins of air masses and the
resulting precipitation characteristics (Craig, 1961; IAEA, 1980; Quereda et al., 1996;
Ulrich et al.,1998; Balestrini et al., 2000; Celle-Jeanton et al., 2008; Prathibha et al.,
2009); it has also been used to distinguish the different sources (i.e., natural inputs
versus anthropogenic emissions) that contribute to rainwater chemistry (Tuncel and
Ungor, 1996; Kulshrestha et al., 2003; Demirak et al., 2006; Yamanaka et al., 2007)
and their potential impacts on eco-hydrosystems through deposition.
Several authors including; Harvey et al.,(2000) use stable oxygen and hydrogen
isotopes to investigate the stable isotope composition of precipitation in the semi-arid
north-central portion of US great plains, leading to the determination of the local
meteoric water line for the site as δ²H=7.66δ18
O+4.96. The oxygen and hydrogen
stable isotope compositions of precipitation have also been used to investigate the
origins of moisture in the Qilian Mountains (Zhou et al., 2007; Zhao et al., 2011), and
the results indicated that regional precipitation is controlled by the Southeast Asian
Monsoon in summer and by westerly and polar air masses in winter. Rainwater
chemistry across the United States was studied by Root et al., (2004). Warrier et al.,
University of Ghana http://ugspace.ug.edu.ghUniversity of Ghana http://ugspace.ug.edu.gh

28
(2011), worked on isotopic composition of precipitation in wet tropic and semi-arid
stations across southern India.
Understanding rainwater chemistry and its isotopic composition entails broad
understanding of various parameters in relation to precipitation occurrences,
movement and distribution in the prevailing hydrogeological cycle. This includes
identification and characterization of hydrogeologic units, recharge-discharge
conditions, aqueous geochemistry applications, and stable isotopes in hydrogeology.
2.4 HYDROGEOLOGICAL CYCLE
The continuous movement of water above, on, and below the surface of the Earth is
called ―hydrogeologic cycle‖ Figure 1. The cycle demonstrates three basic types of
activity: inflows, outflows, and storage. An inflow is an increase in water to a part of
the hydrologic cycle, while an outflow is a removal of water. The term ―storage‖
refers to retention of water by a particular part of the system. If inflows to an aquifer
exceed outflows, then the amount of water stored in the aquifer will increase, if
outflows exceed inflows the amount of water held by the aquifer will decrease
(Schlesinger, 1991). There are six major components to this cycle: evapotranspiration,
condensation, precipitation, infiltration, percolation, and runoff.
Evapotranspiration refers to the combined effect of evaporation and transpiration.
Evaporation is the process by which water is returned to the atmosphere; water on
various surfaces (such as ponds, rivers, and oceans) is heated by the sun until it
vaporizes and rises into the atmosphere. Transpiration refers to the return of moisture
from parts of plants to the atmosphere.
University of Ghana http://ugspace.ug.edu.ghUniversity of Ghana http://ugspace.ug.edu.gh

29
Figure 1: Hydrological Cycle Source US EPA (2000h)
As this moisture collects in the atmosphere, clouds form, eventually, the moisture falls
as some form of precipitation such as rain.
The form, amount, and intensity of this precipitation vary by season and geographic
location, and these variables determine whether or not water will flow into streams or
infiltrate into the ground. As water begins to seep into the ground, it enters what is
referred to as the unsaturated or vadose zone. This zone contains both water and air.
The upper part of the zone, called the root or soil zone, supports plant growth and
contains living roots, holes left by decayed roots, as well as animal and worm burrows
(Hendrick and Flury, 2001). Beneath the root zone lays the intermediate zone,
followed by the saturated capillary fringe. The saturated capillary fringe results from
the attraction between water and rocks (Hendrick and Flury, 2001). This attraction
causes water to cling as a film on the surface of rock particles. Water passes through
the unsaturated zone to the saturated zone, where all the interconnected openings
University of Ghana http://ugspace.ug.edu.ghUniversity of Ghana http://ugspace.ug.edu.gh

30
between rock particles are filled with water. It is within this saturated zone that we
find ―groundwater‖. Infiltration also plays a role in maintaining the groundwater
supply to wells, springs and streams. Physical characteristics of the soil, soil cover,
water content of the soil, soil temperature and rainfall intensity all influence the rate of
infiltration (Markus et al. 2004). The movement of water through soil and rock is
referred to as ―percolation‖; the terms ―infiltration‖ and ―percolation‖ are frequently
used interchangeably. The term ―runoff‖ refers to the movement of water (typically
from precipitation) across the earth‘s surface to streams, lakes, oceans, and
depressions in the surface; rainfall duration and intensity, slope of the ground, soil
type, and ground cover may all influence the rate of such runoff (US EPA, 2000h).
2.5. RECHARGE-DISCHARGE CONDITIONS
Rainfall serve as one of the natural recharge of groundwater and it is an important part
of the hydrologic cycle in which precipitation replenishes groundwater supplies.
The recharge rate is controlled by,
(i) the d-excess defined by the equation, (δ=δ2H-8δ
18O) is used to identify the
origin and vapour source of rainfall (precipitation).
(ii) the saturation ratio of the atmosphere.
(iii) man‘s activities such as emission of green house gasses and destruction of
vegetation to impede transpiration, as the main factors that influence rainfall
are transpiration and evaporation (Dunne et al.1991; Mcginty et al. 1979).
Rainwater is discharged in the form of precipitation. The intensity of precipitation
varies by season and geographic location which in turn determines whether water will
flow into surface waters or infiltrate into the ground. When discharge of rainwater is
abstracted in the system, several adverse effects can occur. Most surface waters dry up
University of Ghana http://ugspace.ug.edu.ghUniversity of Ghana http://ugspace.ug.edu.gh

31
and groundwater table level lowers resulting in springs and wells drying up.
Rainwater should be considered as a non-renewable natural resource.
Chemical composition of water, as such rainwater determines the suitability as a
source of water for consumption and other purposes. The quality of rainfall therefore
reflects the inputs from the atmosphere, pollutant sources as in agriculture, mining,
acid precipitation (rain), road users and industrial wastes (Appelo and Postma, 1993).
Factors that influence rainwater quality in a particular area can be put as
anthropogenic activities.
One of the most unusual characteristics of water is its ability to dissolve greater range
of substances than any other liquid. The quality (chemical composition) of rainwater
is it‘s suitability as a source of water for human consumption and other purposes, and
also influences ecosystem health function, (Appelo and Postma, 1993).
2.6 STABLE ISOTOPES STUDIES IN GHANA
In Ghana, several researchers had worked extensively on most surface and
groundwater using isotopic studies; (Akiti, 1980 and 1986). Environmental isotope
study of groundwater in crystalline rocks of the Accra Plains (Acheampong and Hess,
2000), origin of the shallow groundwater system in the Southern Voltaian sedimentary
basin, Ghana.(Adomako et al., 2010a), geochemical and isotopic studies of
groundwater conditions in the Densu River Basin of Ghana.(Adomako et al., 2010b),
estimating groundwater recharge from water isotope (δ 2H, δ
18O) depth profiles in the
Densu River basin, Ghana.(Gibrilla et al., 2010b), origin of dissolved ions in ground
waters in the northern Densu River Basin of Ghana using stable isotopes of 18
O and
2H. (Akiti, 1980), worked so much in isotopic studies on both groundwater and
University of Ghana http://ugspace.ug.edu.ghUniversity of Ghana http://ugspace.ug.edu.gh

32
rainwater from Aburi and Accra, south of Ghana to the north of Ghana leading to
development of local meteoric water line for Ghana as, δ2H= 7.86δ
18O+13.62.
In view of the studies that have been carried out on rainwater in Ghana, issues yet to
addressed are
There is little information on the combination of rainwater chemistry and
stable isotopes in the Volta region
The variation of rainwater chemistry in coastal, forest and mountainous areas
in the Volta region
The variation of rainwater stable isotopes in coastal, forest and mountainous
areas of the Volta region
The altitude effect on δ 18
O and δ 2H in the lower parts of the Volta region
Local Meteoric Water Line for the Lower Volta region.
University of Ghana http://ugspace.ug.edu.ghUniversity of Ghana http://ugspace.ug.edu.gh

33
CHAPTER THREE
3.0 MATERIALS AND METHODOLOGY
This chapter deals with the geography of the study area and the methods employed in
analysing the various parameters in the rainwater.
3.1 THE STUDY AREA
The location consists of three main distinctive areas viz, coastal (Akatsi), mountainous
(Amedzofe), and forest (Kpando) with four (4) administrative districts namely Akatsi
District, Ho West District, Kpando District and Dayi District in Volta Region of
Ghana. The Volta Lake stretches over and passes through two of the districts,
precisely the forest area.
The coastal area lie between latitudes 02o57‘10.2‘‘N to 02
o64‘20.8‘‘N of the equator
and longitudes 06o73‘05.7‘‘E to 06
o77‘17.4‘E‘ of the Greenwish Meridian with
altitude range of about 29m to 56m above mean sea level. The altitude of the
mountainous area ranges from 523m to737m above mean sea level, located in
latitudes 06o51‘09.9‘‘N to 06
o49‘32.0‘‘N of the equator and longitudes 00
o26‘06.3‘‘E
to 00o25‘33.4‘‘E of the Greenwish Meridian. The altitude of the forest area ranged
from 112m to 244m above mean sea level, latitudes 07o00‘22.7‘‘N to 06
o55‘21.1‘‘N
of the equator and longitudes 00o17′05.9‘‘E to 00
o20‘23.9‘‘E of the Greenwish
Meridian.
University of Ghana http://ugspace.ug.edu.ghUniversity of Ghana http://ugspace.ug.edu.gh

34
Figure 2: Map of the Study Area
University of Ghana http://ugspace.ug.edu.ghUniversity of Ghana http://ugspace.ug.edu.gh

35
3.2 VEGETATION AND CLIMATE
The vegetation is characterised by dense forest around Kpando, the forest area, moist
semi-deciduous forest at Amedzofe, mountainous area and Akatsi the coastal area, is
characterised by a mixture of open grassland and low bush.
The climate of the three areas is characterised by prevailing high temperatures marked
with variations in the duration, high intensity and seasonal distribution of rainfall
resulting in uniform moderately high temperatures throughout the year. The mean
annual temperature of the three areas is about 270C, with February/March being the
hottest (32 0C) and August being the coolest month (23
0C).
Figure 3: Monthly minimum and maximum temperature distributions
and rainfall amount throughout the year in Kpando
0
5
10
15
20
25
30
35
40
0
50
100
150
200
250
Mo
nth
ly a
ver
ag
e T
emp
era
ture
(o
C)
Ra
infa
ll A
mo
un
t (m
m)
Months
Kpando
rainfall amount Min Temp (oC) Max Temp (oC)
University of Ghana http://ugspace.ug.edu.ghUniversity of Ghana http://ugspace.ug.edu.gh
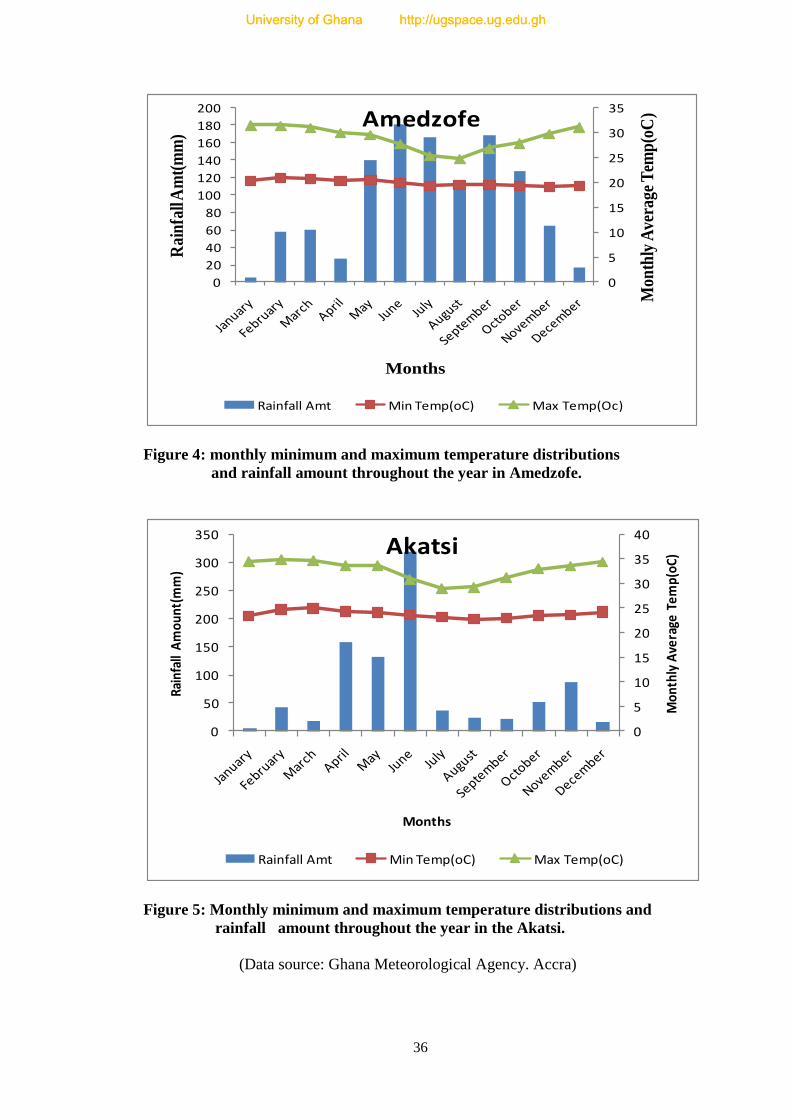
36
Figure 4: monthly minimum and maximum temperature distributions
and rainfall amount throughout the year in Amedzofe.
Figure 5: Monthly minimum and maximum temperature distributions and
rainfall amount throughout the year in the Akatsi.
(Data source: Ghana Meteorological Agency. Accra)
0
5
10
15
20
25
30
35
0
20
40
60
80
100
120
140
160
180
200
Mon
thly
Ave
rage
Tem
p(o
C)
Rai
nfa
ll A
mt(
mm
)
Months
Amedzofe
Rainfall Amt Min Temp(oC) Max Temp(Oc)
0
5
10
15
20
25
30
35
40
0
50
100
150
200
250
300
350
Mon
thly
Ave
rage
Tem
p(oC
)
Rain
fall
Am
ount
(mm
)
Months
Akatsi
Rainfall Amt Min Temp(oC) Max Temp(oC)
University of Ghana http://ugspace.ug.edu.ghUniversity of Ghana http://ugspace.ug.edu.gh

37
The areas fall under two distinct climatic zones: the dry equatorial climate of the
South East coastal plains, and the wet semi-equatorial climate further North from the
coast. Both climatic zones are characterised by two rainfall periods with different
intensities (Dickson & Benneh, 1998). The major rainy season extends from
April/May to July and attains a peak in June which is seen in Akatsi and Amedzofe
(Figures 4 and 5), when the maritime instability causes a surge of the moist south-
westerly air stream resulting in the intensification of the monsoon rain.
The second rainfall period is a minor one that occurs between September and
November, accompanied with several local thunder activities, especially in the forest
and mountainous areas which are covered with moist semi-deciduous forest. This is
then followed by the dry season. The annual rainfall ranges from 1700mm in the wet
interior forest area through the mountainous to 800 mm in the dry equatorial zone near
the coastal area.
3.3 DATA COLLECTION AND ANALYSIS
3.3.1 DESK STUDY
In order to achieve the set objectives, a desk study was carried out to assess the
general hydrological and hydrochemical conditions prevailing in the study areas. It
involved a review of literature, collection of topographical maps, collection of
consistent five years rainfall and humidity data of the areas from Ghana
Meteorological Agency, assessment of available equipments to carry out the analysis
on the samples from Ghana Atomic Energy Commission-Chemistry department,
Geological Survey Department and available literature from University of Ghana
Library.
University of Ghana http://ugspace.ug.edu.ghUniversity of Ghana http://ugspace.ug.edu.gh
38
3.3.2 FIELD WORK
The procedure for fieldwork involved rainwater sampling from Akatsi(coastal),
Amedzofe(mountainous), and Kpando (forest). Water sampling from few boreholes,
hand-dug wells and springs and measurement of field parameters-pH, Electrical
Conductivity (EC), Total dissolved solids (TDS), Salinity and Temperature (oC) and
HCO3- were involved. The sampling was carried out in a period of one year, from
January 2013 to December 2013.
3.3.3. SAMPLE COLLECTION, ANALYSIS AND QUALITY ASSURANCE
One hundred and nine 330mL bottles of rainwater were sampled from Akatsi,
Amedzofe and Kpando in a period of one year starting from January 2013 to
December 2013, on an event basis, thus 23 rainfall events at Akatsi, 51 rainfall events
at Amedzofe and 35 rainfall events at Kpando . A total of 21 groundwater samples
were collected from the three areas comprising of 6 boreholes from Kpando, 6
boreholes from Akatsi and 6 boreholes, 3 springs from Amedzofe. The sampling
points for the groundwater are shown in Figure 2.0. The groundwater samples were
taken after evacuating several volumes of water using pumps installed in these wells.
This was done to purge the aquifer of stagnant water and to acquire fresh aquifer
samples for analysis. All the water samples were collected in 330mL high density
polyethylene bottles. The bottles were conditioned by washing with five (5%) percent
nitric acid, and then rinsed several times with distilled water. This was carried out to
ensure that the sample bottles were free from contaminants. The samples were
analysed for anions, cations, trace metals and isotopes. Rainwater and groundwater
were collected directly in a preconditioned 60mL bottles with poly-sealed lids and
University of Ghana http://ugspace.ug.edu.ghUniversity of Ghana http://ugspace.ug.edu.gh

39
tightly capped to prevent evaporation for stable isotopes of oxygen-18 and deuterium
analysis.
Each sample bottle was provided with an identification labelled with the following
information legibly and indelibly written:
Sample identification number
Date and time of sampling
Record of any stability treatment
Prevailing weather condition at the time of sampling
Only the groundwater samples were kept in an ice chest to maintain the temperature of
the samples and then transported to the laboratory.
3.3.4 MEASUREMENT OF FIELD PARAMETERS
Temperature, electrical conductivity (EC) and total dissolved solids (TDS)
measurements were conducted in situ, on the field by the HACH conductivity and pH
metre. The pH meter was calibrated with standard pH buffers 4 and 7 and the
conductivity meter calibrated with a 2191 μS/cm standard. The pH, EC, TDS,
Temperature and salinity were then measured; about 100mL of water was placed in a
beaker. Then the pH and conductivity meters placed simultaneously into the beaker of
water and the readings taken when the meter stabilized.
Bicarbonate (HCO3 -
) concentration was done at the wellhead with a HACH field
digital titrator by titrating 25mL aliquot of the sample with 0.02M hydrochloric acid
University of Ghana http://ugspace.ug.edu.ghUniversity of Ghana http://ugspace.ug.edu.gh

40
(HCl) cartridge using methyl orange as indicator. A change in colour, from orange to
yellow indicates the endpoint and the volume of acid used recorded as titre value. The
procedure was repeated three times and the average titre value calculated.
The reaction equation is as follows;
HCl(aq) + HCO3-(aq) → CO2(g) + H2O(l) (6)
From the above equations, 1 mol of HCl reacts with 1 mol of HCO3- hence the
concentration of HCO3- in millimol/L is calculated from the equation,
[HCO3-] = (7)
Where,
VT(HCl) = total volume of HCl needed for the titration
M(HCl) = Molarity of HCl
a = aliquot of sample in ml
The Molar Mass of HCO3- = 61
3.3.5 LABORATORY ANALYSIS
Various analytical methods have been employed in the determination of chemical
composition of water (thus both rainwater and groundwater). This work involved the
use of Flame Photometry, Atomic Absorption Spectrophotometry (AAS), UV
Spectrophotometry, Ion Chromatography and Neutron activation analysis (NAA).
3.3.5.1 FLAME PHOTOMETRY
Sodium and potassium concentrations were determined using the flame emission
photometer (Sherwood model 420). The photometer was calibrated as follows: 5mL of
diluents was measured into a test tube and 2mL of 100ppm Li standard added. It was
mixed well and aspirated. The blank knob was pressed. When channel 1 and channel 2
University of Ghana http://ugspace.ug.edu.ghUniversity of Ghana http://ugspace.ug.edu.gh

41
read 0.0 and 100.0 respectively 5mL of 100ppm Na/K standard was measured and
2mL of 100ppm Li standard was added. This was also aspirated and the set knob
pressed from top to down so the reading on both channels read 100.0. After the
calibration 5mL of each sample was measured and 2mL of 100ppm Li standard was
added, mixed well and aspirated to measure both Na and K. The readings were read
off the screen of the flame photometer and then recorded and where the readings
exceeded the range, samples were diluted using de-ionized water and measured.
3.3.5.2 ION CHROMATOGRAPHY
The anions (Cl-, NO3
-, SO4
2-) were analysed using the Dionex ICS-90 ion
chromatograph system at the laboratory of the National Nuclear Research Institute,
NNRI, of the Ghana Atomic Energy Commission .The Dionex ICS-90 ion
chromatograph system performs isocratic ion analysis. An ICS-90 typically consists of
a liquid eluent, a high pressure pump, a sample injector, a separator column, a
chemical suppressor and a conductivity cell. Before the samples were analysed, the
ICS-90 was calibrated using a standard anion solution (seven anion standard II).The
samples were filtered with a 0.45μm size pore filter paper. Samples with salinity
above 0.1ppm were diluted. Each sample mixes with nitrogen gas and the eluent in the
injection valve. The mixture then passes through the column guard and gets to the
analytical column which is made up of resins. Here the anions are separated based on
their weight with each retention time; (that is Cl-, NO3
-, SO4
2-).
The standards were read first. With each retention time, a calibration curve was drawn
with the peak height or area. The sample peak was then extrapolated in the calibration
curve to get the concentration. A detector detects the anions and interprets their
concentrations in the form of peaks. A computer running chromatograph software
University of Ghana http://ugspace.ug.edu.ghUniversity of Ghana http://ugspace.ug.edu.gh

42
automatically converts each peak in a chromatograph to a sample concentration and
produces a tabulated print of the results.
3.3.5.3 ATOMIC ABSORPTION SPECTROMETRY
Samples were analysed for Mg2+
at NNRI laboratory GAEC, using a Varian AA240
Fast Sequential Atomic Absorption Spectrometer Samples were previously acid
digested using HCl, HNO3 and H2O2.
3.3.5.4 INSTRUMENTAL NEUTRON ACTIVATION ANALYSIS (INAA)
For Instrumental neutron activation analysis, trace elements were analyzed in water
samples at GHARR-1, GAEC.
The PC–based gamma ray spectroscopy system was used for the measurement. The
spectroscopic system consists of an n-type HPGe detector model GR 2518 and HV
power supply model 3103, a spectroscopy amplifier model 2020 and 74 ACCUSPEC
Multichannel Analyser (MCA) emulation software (all manufactured by Canberra
Industries Inc.). The relative efficiency of the detector is 25%.
0.50ml of 12 water samples, comprising of 2 rainwater, 2 groundwater from Akatsi; 2
rainwater, 2 groundwater from Kpando and 2 rainwater, 2 groundwater from
Amedzofe (weighing 0.50gram) were pipette using a calibrated Eppendorf tip ejector
pipette (Brinkmann Ins., Inc., Westbury, NY) into clean pre-weighed 1.5mL
polyethylene vials, and fitted with polyethylene snap caps and heat-sealed. Four of
these samples vials were placed into a 7.0mL volume polyethylene vial and heat-
sealed for medium lived radionuclide for irradiations. Two replicates were prepared
for each sample. However, for short lived radionuclide, only one sample was put into
the 7.0ml vial.
University of Ghana http://ugspace.ug.edu.ghUniversity of Ghana http://ugspace.ug.edu.gh

43
The samples were irradiated using the GHARR-1 reactor operating at half full power
of 15kW and at a neutron flux of 5.0x10¹¹
neutrons/cm2s. The scheme for irradiation
was chosen according to the half lives of the elements of interest. For the short-lived
elements with half-lives up to 20min, irradiation time of 120sec was chosen. For
medium –lived elements, that is, those with half-lives between 20min and 3days, the
irradiation times were limited to 10-60min. The water samples and the elemental
comparator standards were sent into the reactor by means of a pneumatic transfer
system operating at a pressure of 1.723 bars. At the end of the irradiation, the capsules
were returned from the reactor and allowed to cool down until the level of activity was
within the 2.5-10% of the dead time of the detector. The samples were placed on the
detector at counting geometry of 7 and counts were accumulated for a preselected
time to obtain the spectra intensities. For short and medium irradiations, 600sec
counting time was chosen.
3.3.5.4.1 EXPECTED TRACE METALS NORMALLY FOUND IN WATER
SAMPLES
Table 3: Nuclear data of elements determined in this work
Elements Target
Isotope
Formed
Isotope
Half life Gamma ray Energy
Kev
Cu 65
Cu 66
Cu 5.10min 1039.2
Al 27
Al 28
Al 2.24min 1778.9
V 51
V 52
V 3.75min 1434
Mn 55
Mn 56
Mn 2.58h 2113
Hg 196
Hg 197
Hg 64.1h 77.4
Cd 114Cd
115Cd 53.46h 527.9
As 75As
76As 26.32h 559.1
University of Ghana http://ugspace.ug.edu.ghUniversity of Ghana http://ugspace.ug.edu.gh

44
3.3.5.4.2 NEUTRON-GAMMA REACTION FOR THE TRACE
ELEMENTS/METALS
The targets elements will undergo neutron-gamma reaction where by thermal neutrons
will interact with target nucleus in radiative capture reaction to produce isotopes.
That is;
27Al(n, γ)
28Al (8)
114Cd(n, γ)
115Cd (9)
75As(n, γ)
76As (10)
65Cu(n, γ)
66Cu (11)
51V(n, γ)
52V (12)
55Mn(n, γ)
56Mn (13)
201Hg(n,γ)
202Hg (14)
3.3.6 STABLE ISOTOPE ANALYSIS
All samples were analysed for oxygen-18 and deuterium in the Isotope Hydrology
Laboratory of the Nuclear Chemistry and Environmental Research Centre, Ghana
Atomic Energy Commission. The samples were analysed using the off-axis integrated
cavity output spectroscopy (OA-ICOS) Los Gatos Research DT-100 Liquid-Water
Isotope Analyser (Model 908-008-2000).
This equipment also called the Liquid Water Isotope Analyser (LWIA) measures
absorption around a wavelength of 1390 nm to calculate molecular concentrations of
2HHO, HH
18O and HHO. Molecular concentrations are converted into atomic ratios,
2H/
1H and
18O/
16O and a post-processing procedure was used to calculate delta-scale
(δ) values with respect to Vienna Standard Mean Ocean Water (VSMOW) (Coplen,
1996) as stated in equation 5.
University of Ghana http://ugspace.ug.edu.ghUniversity of Ghana http://ugspace.ug.edu.gh

45
The instrument contains the laser analysis system and an internal computer, a CTC
LC-PAL liquid autosampler, a small membrane vacuum pump, and a room air intake
line that passes air through a Drierite column for moisture removal. The autosampler
and the DLT-100 are connected by a ~1 m long polytetrafluoroethylene(PTFE)
transfer line. A Hamilton microlitre syringe (model 7701.2N) was used to inject 0.75
litre of sample through a PTFE septum in the autosampler. The injection port of the
autosampler was heated to 80°C to help vaporize the sample under vacuum
immediately upon injection. The vapor then travels down the transfer line into the pre-
evacuated mirrored chamber for analysis. The instrument has a precision of
approximately 1‰ for δ2H and 0.2‰ for δ
18O.
To improve the quality of the results, randomly selected samples and some of the
external standards were also re-analysed as controls. All samples were analysed in
duplicate. Large standard deviations from re-analysed samples or duplicates were
evidence of poor analysis. Acceptable values were within 0.01–0.05‰ vs. V-SMOW
for 18
O and 0.1–0.5‰ vs. V-SMOW for 2H.
University of Ghana http://ugspace.ug.edu.ghUniversity of Ghana http://ugspace.ug.edu.gh

46
CHAPTER FOUR
4.0 RESULT AND DISCUSSION
This chapter deals with the general interpretation of the rainwater parameters such as
temperature, pH, electrical conductivity, major ions such as Na+, Mg
2+, HCO3
-, Cl
-,
K+, Ca
2+, SO4
2-, and NO3
- which will be discussed under hydrochemistry of rainwater.
Trace metals in the rainwater will also be discussed and the last section will deal with
the groundwater chemistry and the isotope data.
4.1 HYDROCHEMISTRY OF RAINWATER IN THE STUDY AREA
The quality of the rainwater at Akatsi, Amedzofe and Kpando was determined by
analyzing the physico-chemical parameters. Table 4, shows the result of the physical
and chemical parameters in the study area and Figure 6 indicates the variation of
physical parameters.
Figure 6: Variation of physical parameters
0.00
10.00
20.00
30.00
40.00
50.00
60.00
Am
ou
nt/
Con
cen
trati
on
Parameter
Kpando
Akatsi
Amedzofe
University of Ghana http://ugspace.ug.edu.ghUniversity of Ghana http://ugspace.ug.edu.gh

47
Table 4: Statistical summary of the physico-chemical parameters from the study areas.
Kpando
Akatsi
Amedzofe
Parameter Units Min Max Mean Min Max Mean Min Max Mean
RAINFALL mm 2.20 71.80 16.55 3.40 83.00 24.21 4.20 72.00 22.98
pH pH units 4.79 6.00 5.60 5.40 6.85 6.19 4.30 6.30 5.38
EC us/cm 7.98 92.20 25.27 8.74 173.60 52.78 2.43 50.30 11.98
TDS mg/L 4.30 46.80 12.94 4.80 86.83 26.55 1.20 25.20 5.99
SAL. ppt 0.00 0.10 0.00 0.00 0.70 0.13 0.00 0.10 0.00
TSS mg/L 0.00 9.00 2.71 0.00 24.00 4.26 0.00 5.00 1.45
TEMP. oC 23.70 24.20 24.00 23.80 25.00 24.28 23.80 25.00 24.67
TURB. NTU 0.00 9.00 2.51 0.00 16.00 2.65 0.00 3.00 0.29
COLOUR Pt/Co 0.00 24.00 9.66 0.00 67.00 12.04 0.00 10.00 0.31
Na⁺ mg/L 1.40 24.50 4.46 2.30 17.50 6.75 0.00 5.60 0.88
K⁺ mg/L 0.00 5.30 1.24 0.30 13.60 3.86 0.00 2.60 0.25
Ca²⁺ mg/L 0.64 5.12 2.31 0.64 19.84 3.13 0.80 3.52 1.87
Cl¯ mg/L 7.99 20.49 14.31 15.49 95.97 28.51 1.19 17.99 7.98
OH¯ mg/L 8.00 40.00 18.74 10.00 104.00 34.52 8.00 24.00 12.59
HCO₃ mg/L 9.75 48.76 22.85 12.19 126.79 42.06 9.75 29.26 15.35
SO₄²¯ mg/L 1.17 73.20 17.44 10.68 73.10 38.69 -3.98 21.36 6.11
NO₃¯ mg/L 0.05 0.61 0.29 0.01 0.89 0.29 0.00 0.74 0.23
Mg²⁺ mg/L 0.09 1.54 0.75 0.00 1.16 0.65 0.00 0.98 0.21
University of Ghana http://ugspace.ug.edu.ghUniversity of Ghana http://ugspace.ug.edu.gh

48
4.1.1 pH
The pH values of individual rainfall ranged from 5.40 to 6.85 at Akatsi (coastal). The
mean value of the pH is 6.19, of which 26.1% of the rainfall event had pH range of 5.0
to 6.0. No event recorded pH in the range of 4.0 to 5.0. Majority of the rainfall events,
about 73.9% fell in the range of 6.0 to 7.0 pH. This indicates that the rainwater
samples from Akatsi are slightly acidic to neutral and this could result from industrial
activities and vehicular emissions. The values are within the WHO standards (6.50 to
8.50).
Amedzofe (mountainous) samples had the mean pH value of all the individual rainfall
to be 5.38, of which 13.70% of the rainfall event had pH ranging from 4 to 5. 82.40%
of the rainfall event fall within pH of 5 to 6 and 3.90% had pH range of 6 to 7. About
96.10% of the total rainfall event had pH less than 6. These low pH values
consequently reflect a significant impact of anthropogenic activities on rainwater
quality in the study area. This may be due to carbon monoxide and carbon dioxide
produced from bush burning in the area.
On the other hand, the pH values of the individual rainfall ranges from 4.76 to 6.00 at
Kpando (forest) with a mean value of 5.60. Of the entire rainfall event at Kpando,
2.9% had pH ranges between 4.0 to 5.0, and 6.0 to 7.0, while 94.2% had pH range of
5.0 to 6.0. From the data, it could be deduced that majority, over 90% of the rainfall
events had pH less than 6.0 which is the pH value of unpolluted water at equilibrium
with atmospheric CO2 (Seinfeld, 1986; Charlson and Rodhe,1982).
Low pH values can be attributed to wet atmospheric deposition of CO2, SO2 and NO2
produced by vehicular emissions and the ‗‗cut and burn‘‘ method of land preparation
for farming in the study communities. Kohler et al. (1997) in their study of the
University of Ghana http://ugspace.ug.edu.ghUniversity of Ghana http://ugspace.ug.edu.gh

49
contribution of aircraft emission to atmospheric nitrogen content states that rainwater
acquires slight acidity as it dissolves CO2 and NO2 gases in the atmosphere.
In all the three stations, Amedzofe recorded the lowest mean pH, and this could be
due to the movement of air masses.
4.1.2 ELECTRICAL CONDUCTIVITY
From the results presented, conductivity values of all the rainfall events from the three
areas were lower than the standard value presented by WHO as 1000 μS/cm. Thus at
Akatsi a range of 8.7 to 173.6μS/cm was recorded with a mean value of 52.8 μS/cm.
Range of 2.4 to 50.3μS/cm was recorded at Amedzofe with a mean of 12.0 μS/cm and
a range of 8.0 to 92.2 μS/cm was recorded at Kpando with a mean of 25.3 μS/cm. The
results indicate the low electrical current conductivity of water. EC is affected by the
presence of inorganic dissolved solids such as chloride, nitrate, and sulphate anions
(ions that carry negative charge) or sodium, magnesium, and calcium cations [ions
carrying positive charges] (Igwo-Ezikpe et al.,2010) .
Moreover, the total dissolved solids values are also generally low as compared to the
WHO values obtained. Subramanian, (2004) observed that rainwater contain low
minerals and has very little dissolved substances.
The low mean values of turbidity 2.65NTU recorded at Akatsi, 0.29 NTU at
Amedzofe and 2.51NTU at Kpando, indicate the absence of suspended particles or if
any, little. This is probably due to low levels of particulates such as smoke, dust, and
soot suspended in the atmosphere which dissolved in the rain droplets as it fell from
University of Ghana http://ugspace.ug.edu.ghUniversity of Ghana http://ugspace.ug.edu.gh

50
the cloud. This may also be related to the presence of particles of clay, organic
components and other microscopic substances (Ovrawah and Hymone, 2001). In
addition, the low turbidity in the rainwater can be associated with frequent rainfalls
during the sampling period. Appiah (2008) in the study of physicochemical analysis of
roof run-off observed that turbidity is affected by dry spell, and the longer the span of
continuous rainfalls, the lower is the turbidity. Hence there will be no problems during
purification, no possibility of micro-biological contamination, no low dissolved
oxygen, and no decrease in the rate of photosynthesis in the study area.
4.1.3 TEMPERATURE
The temperature of the study area ranges from 23.8oC to 25.0
oC at Akatsi (coastal),
with the mean temperature of 24.3oC. Temperature range of 22.8
oC to 24.9
oC, and a
mean of 24.5oC were recorded at Amedzofe (mountainous) and temperature, ranging
from 23.7oC to 24.2
oC was recorded at Kpando (forest) with the mean value of
24.0oC. Temperature has great impact on the microbiological quality of rainwater,
and from the temperature values obtained, there was not much variation in the study
area, as such temperature would not have much effect on other parameters.
4.1.4 COLOUR
The colour levels of rainwater recorded ranged from 0.0 to 67 Hz with a mean value
of 12.04 Hz at Akatsi, 0.0 to 10.0 Hz with a mean of 0.31 Hz at Amedzofe and .0 to
24.0 Hz with a mean of 9.66 Hz at Kpando, compared with WHO guidelines of 15 Hz
for drinking water. Colour is strongly influenced by the presence of iron and other
metals, either as natural impurities or as corrosion products.
University of Ghana http://ugspace.ug.edu.ghUniversity of Ghana http://ugspace.ug.edu.gh

51
4.2 MAJOR IONS
The concentration of major ionic species in the rainfall sampled at the three zones in
the study areas had the following order; HCO3->SO42->OH->Cl-
>Na+>K
+>Ca
2+>Mg
2+>NO3
-, for Akatsi (coastal); HCO3
->OH
->Cl
->SO4
2-
>Ca2+
>Na+>K
+>NO3
->Mg
2+, for Amedzofe (mountainous) and HCO3
->OH
->SO4
2-
>Cl->Na
+>Ca
2+>K
+>Mg
2+>NO3
-,for Kpando (forest);. The alkaline components
namely, Ca2+
, Mg2+
, Na+, and K
+ contribute about 9.10% of the total ionic strength for
Akatsi rainfall; 7.10% for Amedzofe rainfall and 10.62% for Kpando rainfall,
whereas the acidic components comprising of SO42-
,Cl-,HCO3
- and NO3
- made up
90.90% for Akatsi rainfall, 92.90% for Amedzofe rainfall and 89.38% for Kpando
rainfall.
4.2.1 NITRATE
Nitrates and nitrites are naturally occurring ions that are left after breakdown or
decomposition of animal or human waste, Camilli, L. (2000). The data obtained from
the three areas show very low level of this ion as 0.29mg/L, 0.23mg/L and 0.29mg/L,
for Akatsi, Amedzofe and Kpando respectively. This means that, the occurrence of
methaemoglobinaemia (blue-baby syndrome, thus showing lack of movement of
oxygen in organic tissues) may not be experienced in the study area. However, low
levels of the element in the human system may result in the inability to break down
methaemoglobin rapidly with associated health implication.
The presence of nitrates in the rainwater samples may be due to direct dissolution and
oxidation of NO2 to NO3- resulting from the use of nitrogen fertilizers for crop
cultivation in the study area. This observation is buttressed by Thomas and Grenne,
(1993) in their study of rainwater quality from different roof catchments in
University of Ghana http://ugspace.ug.edu.ghUniversity of Ghana http://ugspace.ug.edu.gh

52
agricultural areas, rainwater could have higher concentration of nitrate due to fertilizer
residue in the atmosphere. As observed during the survey, residence at the study areas
are engaged in farming, this might have introduced nitrates in the rainwater.
4.2.2 SULPHATE
The levels of sulphates were also found to be lower than the recommended WHO
standard (200mg/L). In Akatsi the sulphate in rainfall ranged from 10.68mg/L to
73.10mg/L with a mean value of 38.69mg/L. Amedzofe ranged from -3.98mg/L to
21.36mg/L with a mean of 6.11mg/L, whilst Kpando had a minimum sulphate value
of 1.17mg/L and maximum value of 73.20mg/L with a mean of 17.44mg/L.
Sulphate contributes to the sour taste and strong ‗rotten-egg‘ odour and contributes to
corrosion of metal pipes in delivery systems. It can therefore be said that, the water
will not taste sour and will have a pleasant smell because the values recorded from the
three areas were lower than the guidelines value, even though Akatsi seems to be the
highest among the areas, which could be attributed to the fact that it is situated closer
to a heavy industrial area of Ghana, (Tema) hence wind trajectory might had brought
about the high value.
Generally, it is established that sulphate is formed in the atmosphere by chemical
conversion from SO2, which is discharged into the atmosphere from natural and
anthropogenic sources. SO2 is gradually converted to aerosols by oxidation as it is
carried by moisture laden air currents downwind from its sources. However, the study
recorded low sulphate concentrations that suggest that SO2 discharged into the
atmosphere from human activities in the study area could be moderate or insignificant.
University of Ghana http://ugspace.ug.edu.ghUniversity of Ghana http://ugspace.ug.edu.gh

53
4.2.3 CHLORIDE
Chloride concentration of rainfall in Akatsi ranged from 15.49 to 95.97mg/L with a
mean of 28.51mg/L, compared to WHO limit of 250 mg/L for portable water.
Amedzofe rainfall chloride concentration ranged from 1.19 to 17.99mg/L with a mean
value of 7.98mg/L. Kpando rainfall ranged from 7.99 to 20.49mg/L with a mean value
of 14.31mg/L. The main source of Chloride in rain is sea aerosol spray. However
human activities and industrial activities can produce HCl in gas phase which could
dissolve in the rain (Younos et al., 1998). The low chloride concentration of the
rainfall recorded during the study period might also be attributed to the low industrial
emissions in the study area.
4.2.4 ALKALINITY AND BICARBONATE
The total alkalinity of the rainfall at Akatsi during the study ranged from 10 to 104
mg/L with a mean value of 34.52 mg/L compared with WHO limit of 1000 mg/l for
drinking water. Amedzofe rainfall ranged from 8 to 24 mg/L with a mean value of
12.59 mg/L and Kpando from 8 to 40 mg/L with a mean of 18.74 mg/L. These are
very low concentrations.
The bicarbonate concentration of the rainfall ranged from 12.19 to 126.79 mg/L with a
mean of 42.06 mg/L at Akatsi. Amedzofe ranged from 9.75 to 29.26 mg/L with a
mean of 15.35 mg/L and 9.75 to 48.76 mg/L with a mean of 22.85 mg/L at Kpando.
Water can dissolve carbon dioxide from the air, forming carbonic acid (H2CO3). The
concentration is as a result of the high presence of CO2 in the atmosphere due to bush
burning in the study area and its environs.
University of Ghana http://ugspace.ug.edu.ghUniversity of Ghana http://ugspace.ug.edu.gh

54
4.2.5 SODIUM
Sodium concentration in Akatsi rainfall ranged from 2.3 to 17.5mg/L with a mean of
6.75mg/L, Amedzofe ranged from 0 to 5.6mg/L with a mean of 0.88mg/L and Kpando
rainfall ranged from 1.4 to 11.3 mg/L with a mean of 3.89 mg/L. The values are far
lower than the standard for drinking water. Sodium is generally taken as the best
reference element for marine sources. Nevertheless, it is reported that for individuals
suffering from health problems such as heart disease or high blood pressure the
maximum recommended sodium concentration in drinking water is 20 mg/L (Younos
et al., 1998).This implies that rainwater from the study area will not pose any health
problem to such people.
4.2.6 POTASSIUM
The potassium concentration ranged from 0.3mg/L to 13.6mg/L with a mean value of
3.86mg/L in Akatsi rainfall, Amedzofe ranged from 0.0mg/L to 2.6mg/L with a mean
concentration of 0.25mg and 0.0 to 5.3mg/L potassium concentration with a mean of
1.24mg/L was recorded at Kpando. Comparing these values to WHO limit of 30 mg/L
for drinking water it could be deduced that potassium concentration in rainfall from
the study area is very low. K+ has been suggested as a chemical signature of biomass
burning (Khare, et al., 2004). This therefore revealed that the ongoing annual bush
burning activity in the study area contributes to potassium concentration in the
rainwater. So from the values obtained, it could be said that there was not much such
activity in the study area.
University of Ghana http://ugspace.ug.edu.ghUniversity of Ghana http://ugspace.ug.edu.gh

55
4.2.7 CALCIUM AND MAGNESIUM
Calcium concentration ranged from 0.64mg/L to 19.84mg/L with a mean of 3.13mg/L
at Akatsi, Amedzofe ranged from 0.80mg/L to 3.52mg/L with a mean of 1.87mg/L
and 0.64mg/L to 5.12mg/L at Kpando with a mean value of 2.31mg/L.
The Magnesium concentration of the rainwater ranged from 0.00 to 1.16mg/L with a
mean of 0.65mg/L at Akatsi, 0.00 to 0.09mg/L with a mean value of 0.21mg/L at
Amedzofe and 0.09 to 1.54mg/L with a mean of 0.75mg/L at Kpando.
However, the low concentrations of these minerals in rainwater have the tendency of
causing health problems since water scarcity is compelling large number of the
populace in the study area to patronize rainwater highly. Soft water (that is water low
in calcium and magnesium), is associated with increased morbidity and mortality from
cardiovascular diseases (CVDs) compared to hard water and water high in magnesium
(Donato et al., 2003). Recent studies also suggest that the intake of soft water may be
associated with high risk of fracture in children, (Verd et al., 1992). A few months
exposure may be sufficient consumption time effects from water that is low in
magnesium and/or calcium.
University of Ghana http://ugspace.ug.edu.ghUniversity of Ghana http://ugspace.ug.edu.gh

56
Figure 7: Variation of chemical parameters of rainwater.
4.2.8 CATION ORDER OF DOMINANCE IN THE STUDY AREA
Akatsi; Na+
> K+ > Mg
2+ >Ca
2+
Amedzofe; Ca2+
> Na+
> K+ >Mg
2+
Kpando; Na+
>Ca2+
>K+
>Mg2+
0.00
5.00
10.00
15.00
20.00
25.00
30.00
35.00
40.00
45.00
Na⁺ K⁺ Ca²⁺ Cl¯ OH¯ HCO₃ SO₄²¯ NO₃¯ Mg²⁺
Con
cen
trati
on
Parameter
Kpando
Akatsi
Amedzofe
University of Ghana http://ugspace.ug.edu.ghUniversity of Ghana http://ugspace.ug.edu.gh

57
4.2.9 ANION ORDER OF DOMINANCE IN THE STUDY AREA
Akatsi; HCO3- > SO4
2- > OH
- > Cl
- >NO3
-
Amedzofe; HCO3- > OH
- > Cl
- > SO4
2- >NO3
-
Kpando; HCO3- > OH
- > SO4
2- > Cl
- >NO3
-
4.3 TRACE ELEMENTS ANALYSIS IN THE RAINWATER
Table 5: Summary of trace elements analyzed
Trace Elements Min Max
Cu <0.001 7.92
V <0.01 0.43
Mn 0.26 1.43
Cd <0.01 <0.01
Hg <0.01 <0.01
As <0.001 <0.001
Al 0.18 0.93
4.3.1 COPPER, MANGANESE, VANADIUM AND ALUMINIUM
These four trace metals are short-lived radionuclides with irradiation time of
10minutes.
The concentration of Copper ranges from below the detection limit of 0.001 to 7.92 ±
1.12 mg/L. The concentration of Manganese ranges from 0.26 ± 0.04 to 1.43 ± 0.21
mg/L. The concentration of Vanadium within the entire study area ranged from below
the detection limit of 0.01 to 0.43±0.06 mg /L. Aluminium concentration of the entire
samples ranged from 0.18±0.25 to 0.93±0.16 mg/L. The permissible limit of these
University of Ghana http://ugspace.ug.edu.ghUniversity of Ghana http://ugspace.ug.edu.gh

58
metals in water by WHO are; Cu 2.0 mg/L, Mn 0.4 mg/L, V 0.2 mg/L and Al 0.03
mg/L. It could be seen that some rainwater samples have concentrations of these
metals beyond the limit especially rainwater samples from Amedzofe, which could be
due to movement of wind direction from the coast.
4.3.2 CADMIUM, ARSENIC, AND MERCURY
The concentration of cadmium in the rainwater fell below the detection limit of
0.01mg/L. Arsenic concentration in the entire samples was below the detection limit
of 0.001mg/L. Mercury concentration in the rainwater samples is below detection
limit of 0.01mg/L. These are medium- lived radionuclides with irradiation time of 60
minutes.The recommended level of these metals are: Cd 0.003mg/L, As 0.01mg/L and
Hg 0.001mg/L. The values obtained for these metals are far below the
recommendation, so they will not pose any health problem.
4.4 STABLE ISOTOPES VARIATION OF RAINFALL IN THE THREE
STATIONS
The statistical summary of the stable isotope and the rainfall amount for the study
period at the three locations are given in Table 6 while the detailed results are
presented in appendix B.
The δ18
O values for Akatsi, Amedzofe and Kpando ranged from -5.57to +0.26 ‰ vs
VSMOW, -6.54 to +2.73 ‰ vs VSMOW, -5.52 to +2.39 ‰ vs VSMOW and with
respective mean values of -1.82 ‰ vs VSMOW, -2.93 ‰ vs VSMOW, -2.07 ‰ vs
VSMOW.
University of Ghana http://ugspace.ug.edu.ghUniversity of Ghana http://ugspace.ug.edu.gh

59
The δ2H values also, ranged from -30.16 to +7.12 ‰ vs VSMOW for Akatsi, -41.38 to
+14.72 ‰ vs VSMOW for Amedzofe, and -29.57 to +22.99 ‰ vs VSMOW for
Kpando with mean values of -6.55 ‰ vs VSMOW, -14.12 ‰ vs VSMOW and -6.44
‰ vs VSMOW respectively. Stable isotope content of precipitation at the three
stations showed significant variations with the mean δ18
O value of Akatsi (coastal)
being enriched. The isotopic composition of local precipitation is primarily controlled
by regional scale processes like the trajectories of the water vapour transport over the
continent and the average rainout history of the air masses giving precipitation at a
particular place (Rozanski et al., 1982)
Table 6: Statistical summary of rainfall, δ18
O and δ2H at the three stations
Amedzofe Kpando Akatsi
Min Max Mean Min Max Mean Min Max Mean
Rainfall 4.20 72.00 22.98 2.20 71.80 16.55 3.40 83.00 24.21
δ18
O -6.54 +2.73 -2.93 -5.52 +2.39 -2.07 -5.57 +0.26 -1.82
δ2H -41.38 +14.72 -14.12 -29.57 +22.99 -6.44 -30.16 +7.12 -6.55
Rainfall in mm,
The plot δ18
O and δ2H of Akatsi, Amedzofe and Kpando together with Global
Meteoric Water Line (GMWL) define by δ2H =8 δ
18O + 10 and Local Meteoric
Water Line (LMWL) defined by δ2H =7.86 δ
18O + 13.61 (Akiti et al.,1980) are shown
in Figure 8, Figure 9 and Figure 10 respectively. The plots define a linear correlation
with regression line of
Akatsi: δ2H =7.177 δ
18O + 6.94 (n=23; R
2=0.864) (15)
University of Ghana http://ugspace.ug.edu.ghUniversity of Ghana http://ugspace.ug.edu.gh

60
Amedzofe: δ2H =7.212 δ
18O + 7.07 (n=51; R
2=0.921) (16)
Kpando: δ2H =7.187 δ
18O + 8.96 (n=35; R
2=0.965) (17)
The physical basis for this correlation lies in the fractionation of isotopes during
evaporation-condensation processes (Gourcey et al., 2005).
Fig 8: The relationship between δ2H and δ
18O in rainfall at Akatsi
y = 7.177x + 6.936R² = 0.864
-40
-30
-20
-10
0
10
20
-6 -5 -4 -3 -2 -1 0 1
δ2H
‰
δ18O‰
Akatsi
Rainwater
Linear (Rainwater)
Linear (GMWL)
Linear (Akiti Line)
University of Ghana http://ugspace.ug.edu.ghUniversity of Ghana http://ugspace.ug.edu.gh

61
Fig 9: The relationship between δ2H and δ
18O in rainfall at Amedzofe
Fig 10: The relationship between δ2H and δ
18O in rainfall at Kpando
y = 7.212x + 7.065R² = 0.921
-50.00
-40.00
-30.00
-20.00
-10.00
0.00
10.00
20.00
30.00
-7.00 -6.00 -5.00 -4.00 -3.00 -2.00 -1.00 0.00 1.00 2.00
δ2H
‰
δ18O‰
Amedzofe
Rainwater
GMWL
Akiti Line
Linear (Rainwater)
Linear (GMWL)
Linear (Akiti Line)
y = 7.187x + 8.906R² = 0.965
-40
-30
-20
-10
0
10
20
30
-6 -5 -4 -3 -2 -1 0 1 2
δ2H
‰
δ18O ‰
Kpando
Rainwater
Linear (Rainwater)
Linear (GMWL)
Linear (Akiti Line)
University of Ghana http://ugspace.ug.edu.ghUniversity of Ghana http://ugspace.ug.edu.gh

62
Comparing the LMWL developed by Akiti (1980) with the Akatsi, Amedzofe and
Kpando, the slope of the three stations are slightly lower. The stable isotopes of a
given area is controlled by local climatic factors, and may differ from the GMWL, δD
=8 δ18
O+10, developed by Craig (1961) and LMWL δD =7.86 δ18
O+13.62 developed
by Akiti (1980). The GMWL and LMWL is actually an average of many LMWLs
controlled by local climatic parameters, including the origin of the vapour mass, re-
evaporation during rainfall and the seasonality of precipitation (Clark and Fritz, 1997).
The three sampling points are located in the coastal, mountainous and forest
environments and are characterized by intense rainfall and evaporation, therefore
secondary evaporation during rainfall is expected. When it is raining through a dry air
column, some will evaporate leading to the shift of the stable isotopes away from the
GMWL (Friedman et al (1962). This phenomenon has been observed in several areas
especially in arid regions (Clark, 1987; Dansgaard, 1964).
Compared with the LMWL, the slope of the Akatsi, Amedzofe and Kpando, are
lower, which indicates the occurrence of secondary evaporation during rainfall. This
effect is greatest for light rains. Once the air column is water-saturated, such
secondary evaporation is diminished. Therefore, the slope of the meteoric water lines
for heavy rainfall will be close to that of the LMWL. Thus, meteoric water lines were
developed for heavy rainfall events greater than 10 mm.
Akatsi: δ2H =6.783 δ
18O + 6.208 (n=17; R
2=0.953), Rain>10mm (18)
Amedzofe: δ2H =7.944 δ
18O + 9.856 (n=36; R
2=0.906). Rain>10mm (19)
Kpando: δ2H =7.538 δ
18O + 10.45 (n=21; R
2=0.943), Rain>10mm (20)
University of Ghana http://ugspace.ug.edu.ghUniversity of Ghana http://ugspace.ug.edu.gh

63
The results show that the slope of the meteoric water line for Akatsi, Amedzofe and
Kpando are 6.78, 7.94 and 7.54 respectively for rainfall greater than 10 mm.
Additionally, with the exception of Akatsi, the slope of Kpando and Amedzofe are
closer to the slope of 7.86 obtained by Akiti (1980) and 8 obtained by Craig (1960)
with the increase of the intensity of rainfall. A further consideration of rainfall greater
than 20mm yields the following equations
Akatsi: δ2H =6.715 δ
18O + 5.730 (n=11; R
2=0.933), Rain>20mm (21)
Amedzofe: δ2H =8.213 δ
18O + 11.26 (n=24; R
2=0.924). Rain>20mm (22)
Kpando: δ2H =8.09 δ
18O + 13.28 (n=8; R
2=0.7). Rain>20mm (23)
The Amedzofe and Kpando yield slopes of 8.21 and 8.09 respectively. These slopes
are approximately equal to slope of 8 (Craig, 1960).
The plot of δ18
O and δ2H for all the rainfall events at Akatsi, Amedzofe and Kpando
are shown in Figure 11. The plots define a linear correlation with regression line of,
δ2H =7.258 δ
18O + 7.79 (n=109; R
2=0.932) (24)
This equation (24) represents the Lower Volta Meteoric Water Line (LVMWL).
Meteoric water lines were developed for heavy rainfall events greater than 10 mm and
greater than 20 mm.
δ2H =7.395 δ
18O + 8.34 (n=77; R
2=0.920). Rain > 10mm (25)
δ2H =7.453 δ
18O + 8.621 (n=45; R
2=0.907). Rain > 20mm (26)
University of Ghana http://ugspace.ug.edu.ghUniversity of Ghana http://ugspace.ug.edu.gh

64
As observed earlier, elimination of rainfall amount less 10 mm and 20 mm yields
slope closer to 8. Mook (2006) stated that the threshold of precipitation for the
secondary evaporation to have an effect is 20 mm/month. Similarly, Clark (1987)
found that, excluding rainfall events less than 20 mm yields the slope of the LMWL
around 7.8, similar to the equilibrium value of 8. This study indicates that the
threshold of 20 mm is a good estimate and applicable in the study area, hence, in the
lower Volta, data for rainfall events greater than 20 mm orients the slope closer to 8.
Figure 11: The relationship between δ2H and δ
18O in rainfall at Kpando,
Amedzofe and Akatsi.
4.4.1 ALTITUDE EFFECT ON THE STABLE ISOTOPES
The altitude effect, as likelihood for a systematic decrease of stable isotope
composition (with increasing altitude), is theoretically associated with the concept that
it is a function of the cooling of air masses as they rise to higher elevation. This effect
has been largely used by several authors around the world as a tool to determine
y = 7.258x + 7.790R² = 0.932
-50
-40
-30
-20
-10
0
10
20
30
-7 -6 -5 -4 -3 -2 -1 0 1 2
δ2H
‰
δ18O‰
Kpando, Amedzofe and Akatsi
Rainwater
Linear (Rainwater)
Linear (GMWL)
Linear (Akiti Line)
University of Ghana http://ugspace.ug.edu.ghUniversity of Ghana http://ugspace.ug.edu.gh

65
groundwater-recharge zones (Payne and Yurtsever, 1974; Fontes and Olivry, 1976;
Gonfiantini et al., 1976, 2001; Yurtsever and Gat, 1981; Gasparini et al., 1990; Kattan,
1997b). Based on the correlations between the weighted means of both δ18
O and δ2H
and the corresponding altitude for all the meteoric stations, the least-squares
regression lines were calculated for Akatsi - Amedzofe and Amedzofe - Kpando.
The calculated altitude effect shows a gradual lapse rate of δ18
O and δ 2H of about -
0.2‰/100 m and -1.5 ‰/100 m for Akatsi and Amezofe respectively. Amedzofe and
Kpando showed an altitude effect of -0.15‰ /100 m. and -2 ‰/100 m for δ 18
O and δ
2H respectively, (Figures 12, 13, 14 and 15). This effect varies slightly with the value
of -0.13‰ obtained by Akiti (1980) from rainfall in Accra (35m) and Aburi (427m)
above mean sea level. Studies by Fonte and Olivry, 1977 on the Cameroon mountains
yielded an altitude effect of -0.16‰ per 100m for δ18
O. Other studies around the globe
by Yurtsever and Gat (1981) gave a δ18
O laps rate of between -0.15 and -0.5 ‰ per
100 m and δ2H lapse rate of between -1.5 and -4‰ per 100 m. Kattan (1997) studied
stable isotopes in precipitation over Syria and estimated an altitude effect of about -
0.23 and -1.6‰ per 100 m, for δ 18
O and the δ 2H, respectively. Prizgonov et al.
(1988) also provides an estimate of δ 18
O gradient of -0.19‰ per 100 m.
University of Ghana http://ugspace.ug.edu.ghUniversity of Ghana http://ugspace.ug.edu.gh

66
Figure 12: The relationship between altitude (m) and δ18
O‰ VSMOW in
Akatsi - Amedzofe
Figure 13: The relationship between altitude (m) and δ18
O‰ VSMOW in
Amedzofe – Kpando
-4.5
-4
-3.5
-3
-2.5
-2
0 100 200 300 400 500 600 700 800
δ18O
‰V
SM
OW
Altitude (m)
Slope = (-2.7--2.5)(190 - 90)
-0.2‰ /100m
-4.5
-4
-3.5
-3
-2.5
-2
0 100 200 300 400 500 600 700 800
δ1
8O
‰ V
SM
OW
Altitude (m)
Slope = (-3.7--3.55)(700 - 600)
-0.15‰ /100m
University of Ghana http://ugspace.ug.edu.ghUniversity of Ghana http://ugspace.ug.edu.gh

67
Figure 14: The relationship between altitude (m) and δ2H‰ VSMOW in Akatsi -
Amedzofe.
Figure 15: The relationship between altitude (m) and δ2H‰ VSMOW in
Amedzofe – Kpando.
-25
-20
-15
-10
-5
0
0 100 200 300 400 500 600 700 800
δ2 H ‰
VS
MO
W
Altitude (m)
Slope = ( -13.5 - - 12)( 300 - 200)
= -1.5 ‰ /100 m
-25
-20
-15
-10
-5
0
0 100 200 300 400 500 600 700 800
δ2H
‰ V
SM
OW
Altitude (m)
Slope = ( -9 - - 7)( 200 - 100)
= -2 ‰ /100 m
University of Ghana http://ugspace.ug.edu.ghUniversity of Ghana http://ugspace.ug.edu.gh

68
Despite the high agreement of the results obtained with these studies, there is a slight
variation with the values obtained by Akiti (1980) in Ghana especially with Akatsi -
Amedzofe. The possible explanation to this anomaly is that, Akiti‘s (1980) estimate
was based on a narrow range of altitude of about 394 m amsl (Accra coastal area with
altitude of 35m and Aburi a mountainous area with altitude of 427m) while Akatsi (a
coastal area with altitude of 56 m amsl and Amedzofe a mountainous area of 731 m
amsl has a range of 675 m amsl . However, Amedzofe and Kpando with an altitude
difference of 487 m amsl has an altitude effect of -0.15 ‰/100m close to the value of -
0.13 ‰/100m obtained by Akiti (1980).
4.4.2 TEMPERATURE AND AMOUNT EFFECT ON THE STABLE
ISOTOPES OF RAINFALL
Temperature is inversely related to the isotopic fractionation that occurs during
condensation and evaporation (Mazor, 2004; Mook, 2006). As a result, precipitation
normally has high isotopic values during warmer summers and low during cooler
winters. The monthly weighted average of δ18
O, rainfall and mean temperature from
the Akatsi, Amedzofe and Kpando are shown in Figure 16, Figure 17 and Figure 18.
The three stations exhibit these typical seasonal variations in isotopic composition.
University of Ghana http://ugspace.ug.edu.ghUniversity of Ghana http://ugspace.ug.edu.gh

69
Figure 16: Temperature and amount effects on δ18
O of precipitation in the
Akatsi.
Figure 17: Temperature and amount effects on δ18
O of precipitation in the
Amedzofe
-5.00
-4.00
-3.00
-2.00
-1.00
0.00
1.00
2.00
0
50
100
150
200
250
300
Oxy
gen
-18
Rai
nfa
ll (m
m)
Months
Amedzofe
Rainfall Temp (oC)O-18
University of Ghana http://ugspace.ug.edu.ghUniversity of Ghana http://ugspace.ug.edu.gh

70
Figure 18: Temperature and amount effects on δ18
O of precipitation in the
Kpando
It is interesting to note that, the most enriched and depleted samples are not associated
with highest and lowest temperature in all the stations. There is a linear relationship
between mean monthly surface temperatures (T) and δ18
O at each of the stations. A
relationship can be described by the following least-squares-fit linear regression.
δ18
O = -0.052Tmontly-0.976‰ (R2=0.006) Akatsi (27)
δ18
O = -0.058Tmontly-2.361‰ (R2=0.009) Amedzofe (28)
δ18
O = 0.304Tmontly-11.45‰ (R2=0.073) Kpando (29)
The variation pattern of isotope composition is inconsistent with the temperature. This
could be due to narrow range in temperature (about ~4oC) in all the stations. The weak
correlation of δ18
O and temperature suggest that, temperature may not be the only
factor controlling the isotope fractionation.
-4.50
-4.00
-3.50
-3.00
-2.50
-2.00
-1.50
-1.00
-0.50
0.00
0
20
40
60
80
100
120
140
160
180
200
Ox
yg
en
-18
Ra
infa
ll (m
m)
Months
Kpando
Rainfall Temp (oC)O-18
University of Ghana http://ugspace.ug.edu.ghUniversity of Ghana http://ugspace.ug.edu.gh

71
For this reason, the relation between δ18
O and rainfall amount for the three stations
was also examined and shown in Figures 19, 20 and 21.
Figure 19: The relationship between monthly rainfall and monthly weighted
mean δ 18
O ‰ VSMOW in Akatsi
y = -0.010x - 1.459R² = 0.593
-4
-3.5
-3
-2.5
-2
-1.5
-1
-0.5
0
0 50 100 150 200
Mo
nth
ly W
eigh
ted
mea
n δ
18O
‰
Monthly Rainfall (mm)
Akatsi
University of Ghana http://ugspace.ug.edu.ghUniversity of Ghana http://ugspace.ug.edu.gh

72
Figure 20: The relationship between monthly rainfall and monthly weighted
mean δ 18
O ‰ VSMOW in Amedzofe
Figure 21: The relationship between monthly rainfall and monthly weighted
mean δ 18
O ‰ VSMOW in Kpando
y = -0.001x - 3.532R² = 0.018
-6
-5
-4
-3
-2
-1
0
0 50 100 150 200 250 300
Mon
thly
Wei
ghte
d m
ean
δ 1
8O
‰
Monthly Rainfall (mm)
Amedzofe
y = -0.017x - 1.805R² = 0.436
-6
-5
-4
-3
-2
-1
0
0 50 100 150 200Mon
thly
Wei
ghte
d m
ean
δ 1
8O
‰
Monthly Rainfall (mm)
Kpando
University of Ghana http://ugspace.ug.edu.ghUniversity of Ghana http://ugspace.ug.edu.gh

73
There is a very good correlation between the average monthly precipitation (P) and
δ18
O at Kpando and Akatsi, while Amedzofe showed a weak correlation. The three
stations define the best fit equations as:
δ18
O = -0.017Pmontly-1.804‰ (R2=0.436) Kpando (30)
δ18
O = -0.010Pmontly-1.459‰ (R2=0.593) Akatsi (31)
δ18
O = -0.001Pmontly-3.532‰ (R2=0.018) Amedzofe (32)
This indicates that the amount effect is the dominant process controlling the rain
stable isotopes in Akatsi and Kpando while Amedzofe is primarily controlled by the
altitude effect.
4.5 GROUNDWATER CHEMISTRY
4.5.1 PHYSICAL PARAMETERS IN GROUNDWATER
The pH of the groundwater at Akatsi ranged from 5.13 to 6.37 with a mean of 5.83.
Amedzofe ranged from 5.07 to 96.94 with a mean of 6.07. Kpando ranged from 5.95
to 6.94 with a mean of 6.42. The conductivitiy and TDS recorded at Akatsi ranged
from 103 to 726 μS/cm with a mean of 280.2 μS/cm and 55.5 to 363 mg/L with a
mean of 224.9 mg/L. Amedzofe on the other hand had Conductivity and TDS ranging
from 44.9 to 822 μS/cm with a mean of 280.2 μS/cm and 23 to 408 mg/L with a mean
of 140 mg/L. Kpando had both the conductivity and TDS ranging from 318 to 1163
μS/cm with a mean of 683.5 μS/cm and 159 to 581 mg/L with a mean of 341 mg/L.
University of Ghana http://ugspace.ug.edu.ghUniversity of Ghana http://ugspace.ug.edu.gh

74
4.5.2 CHEMICAL PARAMETERS IN GROUNDWATER
Na+ and K
+ concentrations in Akatsi varied between 100.8 to 292.0mg/L with a mean
of 187.3mg/L and 2.0 to 50 mg/L with a mean of 11.8mg/L respectively. Amedzofe
had Na+ and K
+ concentrations ranging from 12.7 to110.7mg/L with a mean of
45.0mg/L and 0.1 to 60.2mg/L with a mean of 21.6mg/L respectively. Kpando also
had respective Na+ and K
+ concentrations ranging from 94.2 to 360.7mg/L with a
mean of 162.7mg/L and 3.0 to 36.4 mg/L with a mean of 11.2mg/L.
Ca2+
and Mg2+
concentrations recorded at Akatsi ranged from 12 to 4081mg/L with a
mean of 692.9mg/L and 0.51 to 1.21mg/L with a mean of 0.87mg/L respectively. In
Amedzofe they ranged from 2.4 to 15.2mg/L with a mean of 5.2mg/L and 0.07 to
1.3mg/L with a mean of 0.51mg/L respectively. Kpando had concentrations ranging
from 4.81 to 24.05mg/L with a mean of 10.82mg/L and 0.37 to 1.2mg/L with a mean
of 0.88mg/L respectively.
Chloride (Cl-) in groundwater mostly originates from ancient seawater entrapped in
sediments, halite dissolution and related minerals in evaporite deposits. Chlorides in
groundwater can also be as a result of concentration by evaporation of chloride
contributed by precipitation and fallout from the atmosphere as aerosol sprays (Davies
and Dewiest, 1996). Very high chloride content may impart saline taste to
groundwater, which may affect its suitability for drinking purposes. High chloride
values in surface water can be attributed to the presence of faecal matter.
Another important source of chloride may be from volcanic waters in hot springs
system. Mazor (1997) suggested that seawater intrusion a few meters from the coast is
a possible source of chloride in groundwater. White (1974) outlined that Cl- in
University of Ghana http://ugspace.ug.edu.ghUniversity of Ghana http://ugspace.ug.edu.gh

75
groundwater can be used as good tracer to follow processes of groundwater
contamination/salinisation, especially during initial stage to monitor
seawater/freshwater interface movements. The maximum permissible level of chloride
in drinking water is 250mg/L (WHO, 1984).
In Akatsi the Cl-
concentration ranged from 81.97 to 173.95mg/L with a mean of
145.07mg/L. Amedzofe ranged from 13.99 to 117.96mg/L with a mean of 38.94mg/L.
Kpando ranged from 25.99 to 73.98mg/L with a mean of 56.02mg/L.
Nitrate (NO3-) is a widespread contaminant in ground and surface waters. High
concentrations in groundwater are of major concern in many parts of the world.
In Ghana, nitrate concentrations have been rising in many locations over recent
decades, but the current rising trends have been attributed primarily to diffuse
pollution from intensive farming by application of nitrate fertilizers. Mallari, (1959)
did a pioneering work in the Upper East Region and compiled a list of nitrate levels in
the region prior to 1959 and found that only one well in his selected samples had
nitrate concentration above 9mg/L, this he attribute to local pollution.
Akiti (1982) later investigated the level of nitrates in the Upper West Region of Ghana
and concluded that the high concentrations were due to the following factors,
Animal excrement resulting from cattle rearing.
Fixation of nitrogen by certain plants.
Agricultural fertilizer application.
Ganyaglo (2006) observed that high nitrate concentrations in some ground waters in
parts of Eastern region of Ghana may be due to well-head pollution as a result of poor
sanitations around the wells.
University of Ghana http://ugspace.ug.edu.ghUniversity of Ghana http://ugspace.ug.edu.gh
76
Direct application of nitrate to land as an agricultural fertilizer is not the only source.
Atmospheric deposition, discharge from septic tanks and leaking sewers, the
spreading of sewage sludge to land and seepage from landfills can all contribute to the
pollutant load (Wakida and Lerner, 2005). Upper limit of nitrate in drinking water in
the USA, Canada and Australia is 10 mg/L. Excess nitrate concentrations can also
cause eutrophication, which enriches water body by increasing levels of nutrients such
as nitrogen and phosphorus (Mason, 2002). High nutrient levels in water affect
biodiversity by favouring plants which need or can survive in nutrient-rich
environments, and can lead to excessive plant growth (WHO, 1999), typical example
is the algae.
The NO3- concentration recorded in Akatsi groundwater ranged from 0.17 to
1.05mg/L with a mean value of 0.54mg/L. Amedzofe ranged from 0.03 to 0.96mg/L
with a mean of 0.35mg/L and Kpando ranged from 0.11 to 1.05mg/L with a mean of
0.43mg/L.
Sulphur is an essential nutrient for vegetation. It is also an essential element for
seawater and marine sediments. Its four main oxidation states raging from +IV to –II
making it both electron acceptor and donor in redox reaction. The major forms of
sulphur in subsurface water include sulphate and sulphide minerals, dissolved sulphate
(SO42-
) dissolved sulphide (HS-) and hydrogen sulphide gas (H2S). Organic sulphur is
a component of organic compounds such as humic substances, kerogen and
hydrocarbons. Its oxidation and recycling in soil produces ‗‘terrestrial‘‘ sulphate
found in semi-arid regions. Atmospheric sulphur sources include natural and
‗‘technogenic‘‘ or industrial SO2, particulate sulphur and aerosol (Chapman, 1992)
Sulphur compounds from these various sources contribute in the geochemical
University of Ghana http://ugspace.ug.edu.ghUniversity of Ghana http://ugspace.ug.edu.gh

77
evolution of groundwater. They also add to groundwater salinisation. The maximum
permissible limit of sulphate in drinking water is 400mg/L (WHO, 1984).
SO42-
concentration recorded at Akatsi varied between 7.28 and 50.68mg/L with a
mean of 31.77mg/L. Amedzofe ranged from 9.81 to 55.34mg/L with a mean of
18.85mg/L whilst Kpando ranged from 1.55 to 49.71mg/L with a mean of 20.69mg/L.
Decay of organic matter in the root zone produce CO2 which when reacted with water
can produce carbonic acid. Furthermore, atmospheric CO2 can react with water in the
atmosphere to produce carbonic acid. In natural conditions, carbonic acid (H2CO3)
formed from interaction of atmospheric CO2 with water (H2O) reacts with CaCO3
present in soil to form Ca2+
and HCO3- ions, as shown in the equation 33 and 34 below
CO2 + H2O → H2CO3 (33)
CaCO3 + H2CO3 → Ca2+
+ 2HCO3- (34)
The H2CO3 can also dissolve the minerals present in the flow path of groundwater.
The solution products of silicate weathering are more difficult to quantify, because the
degradation of silicates is dissimilar, generating a variety of solid products, such as
clays (Davies and Dewiest, 1966). A general reaction for weathering of silicate rocks
with H2CO3 can be written as:
(Na+ ; Mg
2+ ; Ca
2+ ;K
+ ) silicates + H2CO3 → H4SiO4 + HCO3 + Na
+ + Mg
2+ + Ca
2+ +
K+ + Clays (35)
Bicarbonate in groundwater can also be obtained from dissociation of sodium
bicarbonate (NaHCO3) and calcium bicarbonate (CaHCO3) formed from weathering
of plagioclase feldspars. This dissociation normally occurs in the presence of weak
carbonic acid from rain as shown in equation 36
NaHCO3 + H2CO3 → Na+ + HCO3
- (36)
University of Ghana http://ugspace.ug.edu.ghUniversity of Ghana http://ugspace.ug.edu.gh

78
HCO3- concentration recorded at Akatsi ranged from 58.52 to 204.82mg/L with a mean of
126.79mg/L. Amedzofe ranged from 29.26 to 360.88mg/L with a mean of 136.55mg/L
and Kpando ranged from126.79 to 604.71mg/L with a mean of 344.62mg/L.
4.6 STABLE ISOTOPES COMPOSITION OF GROUNDWATER
Taking into account all data, the statistical summary of the groundwater stable
isotopes are presented in Table 7. The distribution of δ18
O ranges from -3.66 to -
2.03‰, -3.59 to -3.45 and -3.14 to -2.07 while δ2H ranges from -13.89 to -8.02‰, -
16.47 to -15.20 and -6.53 to -8.24 for Amedzofe, Akatsi and Kpando respectively.
The respective mean values of δ18
O are -3.02, -3.43 and -2.68 while δ2H are -10.86, -
16.07 and -8.24. The values of δ18
O and δ2H in Akatsi are very narrow suggesting a
homogeneous system while that of Kpando are isotopically enriched and have a
broader distribution. The Amedzofe samples are generally depleted.
Table 7. Statistical summary of the groundwater δ18
O and δ2H in Akatsi,
Amedzofe and Kpando
Figures 22, 23 and 24 show the relation between δ18
O and δ2H in the three stations.
Included in the graph are the monthly weighted mean of δ18
O and δ2H, Akiti line and
LVMWL for all the stations. The δ2H is linearly and positively correlated to the δ
18O.
The groundwater in the three sampling areas plotted on or between the LVMWL and
Amedzofe
Akatsi
Kpando
Min Max Mean Min Max Mean Min Max Mean
δ18
O -3.66 -2.03 -3.03 -3.59 -3.24 -3.43 -3.14 -2.07 -2.68
δ2H -13.89 -8.02 -10.86 -16.47 -15.20 -16.07 -10.25 -6.54 -8.24
University of Ghana http://ugspace.ug.edu.ghUniversity of Ghana http://ugspace.ug.edu.gh

79
Akiti line. This suggests that the ground waters in the areas are of meteoric origin. The
Amedzofe samples comprises of five spring waters and four ground waters. Three of
the ground waters were samples at Matse-Dzokpe, Dzolo-Gbogame and Dzolokpuita,
these communities show distinct stable isotopes from the spring water. However, the
Avatime-Biakpa groundwater plot with the spring waters sampled at Avatime-Vane
and Amedzofe. This observation indicates that, the groundwater in Avatime-Biakpa
which is at the foot of the Amedzofe Mountain is receiving significant amount of
recharge from the springs.
Figure 22: The relationship between δ2H and δ
18O in groundwater in Akatsi
March
April
May
JuneSeptember
October
-30.00
-25.00
-20.00
-15.00
-10.00
-5.00
0.00
5.00
10.00
15.00
20.00
-4.50 -3.50 -2.50 -1.50 -0.50 0.50
δ2H
‰
δ 18O‰
Akatsi
Akatsi Borehole
Akatsi Monthly Weighted Mean
University of Ghana http://ugspace.ug.edu.ghUniversity of Ghana http://ugspace.ug.edu.gh

80
Figure 23: The relationship between δ 2H and δ
18O in groundwater in Amedzofe.
Figure 24: The relationship between δ2H and δ
18O in groundwater in Kpando
The weighted monthly mean of rainwater when plotted with groundwater stable
isotopes can provide a fair estimate of monthly recharge to groundwater. On the basis
February
March
AprilMay
June
July
August
September
October
-35.00
-25.00
-15.00
-5.00
5.00
15.00
25.00
-5.00 -4.50 -4.00 -3.50 -3.00 -2.50 -2.00 -1.50
δ2H
‰
δ 18O‰
Amedzofe
Amedzofe Spring
Amedzofe Monthly Weighted Mean
Amedzofe Borehole
February
March
AprilMay
June
July
September
October
-40.00
-30.00
-20.00
-10.00
0.00
10.00
20.00
-5.00 -4.00 -3.00 -2.00 -1.00 0.00 1.00
δ2H
‰
δ 18O ‰
Kpando
Kpando Borehole
Kpando Monthly Weighted Mean
University of Ghana http://ugspace.ug.edu.ghUniversity of Ghana http://ugspace.ug.edu.gh

81
of this assumption, Akatsi with a limited data of five months rainwater isotopes only
May contributes to groundwater recharge. In Amedzofe however, the month of
groundwater recharge are March, April, August and October. The groundwater in
Kpando receive significant recharge in the month of February, April, May and
September while March, May and October rains do not contribute to recharge
4.7 SOURCES OF IONS IN THE RAINWATER AND GROUNDWATER
Conventionally, the sources of dissolved ions in water bodies could be deduced from
the variation of the characteristic solute-concentration ratios such as Na+/Cl
-,
Ca2+/Mg
2+, SO4
2-/Cl
-, Br
-/Cl
- etc. However, in certain situations water chemistry may
undergo secondary changes such as ion exchange, oxidation and reduction,
precipitation, evaporation etc, which make it very difficult to use the ion-ratio
approach to identify the sources of these ions.
Stable isotopes of water (2H and
18O) being relatively invariant over time, are
therefore, well suited to study the complexities of groundwater hydrology in an area.
Groundwater undergoing evaporation will have a positive correlation between δ18
O
and conductivity while groundwater undergoing dissolution will have an increase in
conductivity without a simultaneous increase or enrichment of δ18
O.
Figure 25 shows the relationship between δ18
O and Conductivity in the Akatsi,
Kpando and Amedzofe. The plot shows no correlation for the points suggesting
evaporation is not the main source of ions in the rainwater. The Akatsi rainwater
showed higher EC as compared to the rainwater in Kpando and Amedzofe. This EC in
Akatsi rainwater could be due to;
(i) Akatsi is close to the sea, hence sea aerosols could be responsible for the high
EC
University of Ghana http://ugspace.ug.edu.ghUniversity of Ghana http://ugspace.ug.edu.gh

82
(ii) Akatsi is sandwich between Tema and Lome. These are industrial towns in
Ghana and Togo which release lots of pollutants in the atmosphere; hence the
high EC could be due to the dissolution of these pollutants in the rain.
These effects however diminish as one moves away from the coast with Amedzofe
showing little of this effect.
Figure 25: Relationship between rainwater δ18
O ‰ VSMOW and Conductivity
in the three stations.
Similar plot of δ18
O ‰ VSMOW and Conductivity was made for the groundwater in
the areas to determine their source of salinity. This is shown by Figure 26. The
Kpando groundwater shows a weak correlation (R2=0.02) suggesting evaporation is
not the dominant factor controlling the groundwater in the area. Amedzofe on the
other hand shows a positive strong correlation (R2=0.86) between δ
18O ‰ VSMOW
-8.00
-6.00
-4.00
-2.00
0.00
2.00
4.00
0.00 50.00 100.00 150.00 200.00
δ1
8O
‰
EC µs/cm
Kpando
Akatsi
Amedzofe
University of Ghana http://ugspace.ug.edu.ghUniversity of Ghana http://ugspace.ug.edu.gh

83
and Conductivity. This observation is due to the fact that, most samples from
Amedzofe are spring waters, hence are exposed to the atmosphere thereby subject to
evaporation. In the Akatsi, the groundwater shows an increase in conductivity without
a simultaneous increase or enrichment of δ18
O. It has already been established that, the
Akatsi rainwater contains sea aerosols (NaCl), hence the soils in the area contains salts
(NaCl). It follows from this thought that, the groundwater salinization is as a result of
dissolution.
Figure 26: Relationship between groundwater δ18
O ‰ VSMOW and
Conductivity in the three stations.
y = 0.001x - 3.524R² = 0.858
y = 3E-05x - 3.440R² = 0.004
y = 0.000x - 2.78R² = 0.018
-4.00
-3.50
-3.00
-2.50
-2.00
-1.50
0 200 400 600 800 1000 1200 1400
δ18
O ‰
EC µS/cm
Amedzofe
Akatsi
KpandoDissolution
Evaporation
University of Ghana http://ugspace.ug.edu.ghUniversity of Ghana http://ugspace.ug.edu.gh

84
CHAPTER FIVE
5.0 CONCLUSION AND RECOMMENDATION
This chapter draws from the analysis and discussions made in terms of the results in
arriving at conclusions and recommendations for the study.
5.1 CONCLUSION
The chemical and isotopic composition of precipitation in Akatsi, Amedzofe and
Kpando in the Volta region of Ghana has been investigated. The chemistry of the
rainwater in the three stations shows some variations in both physical and chemical
parameters. The observed pH values of rainwater at Amedzofe have an average value
of 5.38 as compared to 6.19 and 5.6 for Akatsi and Kpando respectively. EC, TDS,
turbidity and colour are generally low with higher values recorded at Akatsi while
Amedzofe recorded the lowest values. Major ions concentrations and element-to-
sodium ratios show clear variations with higher levels found in Akatsi (coastal zone)
and lower levels found in Amedzofe. The chemical composition of rainfall in the
coastal area (Akatsi) is influenced by ocean deposit from the Atlantic Ocean. Isotopic
composition of rainwater in Akatsi (coastal area) presents high values of δ18O and δ
2H, whereas rainwater in the Amedzofe (mountainous area) was characterized by low
values of δ18O and δ2H. The Local Meteoric Water Line for the study area using
rainfall greater than 20mm was defined as δ2H =7.453 δ
18O + 8.621 (n=45; R
2=0.907,
rain > 20mm). The stable isotopes of the three sampling points were found to be
influenced by altitude and amount effect with temperature effect being insignificant.
The calculated altitude effect shows a gradual lapse rate of δ18
O and δ2H of about -
0.2‰/100 m and -1.5 ‰/100 m for Akatsi and Amezofe respectively. Amedzofe and
University of Ghana http://ugspace.ug.edu.ghUniversity of Ghana http://ugspace.ug.edu.gh

85
Kpando showed an altitude effect of -0.15‰ /100 m. and -2 ‰/100 m for δ 18
O and δ
2H respectively. The groundwater in the study area is mainly of meteoric origin with
different months of recharge. The plot of δ18
O and EC shows that, mineral dissolution
is the main factor controlling the groundwater salinization in Akatsi while Amedzofe
and Kpando groundwater chemistry are mainly controlled by evaporation.
The trace elements found in the rainwater from the study area are generally low with
the exception of Amedzofe rain which showed a high concentration of Cu.
5.2 RECOMMENDATION
Based on the study analysis carried out, the following recommendations are made
The rainwater quality with respect to physico-chemical parameters is good,
hence can be harvested and stored for domestic use.
Rainwater stable isotopes monitoring in the area should be continued so as to
obtain a larger data base for groundwater resources managements.
Rainwater stable isotopes of other parts of Ghana should be carried out,
preferably, Ghana should join the Global Network of Isotopes in Precipitation
(GNIP).
In the development of Local Meteoric water Line for Ghana, rainwater greater
than 20 mm should be considered.
University of Ghana http://ugspace.ug.edu.ghUniversity of Ghana http://ugspace.ug.edu.gh

86
REFERENCES
Acheampong, S. Y., & Hess, J. W. (2000). Origin of the shallow groundwater system
in the southern Voltaian Sedimentary Basin of Ghana: an isotopic approach.
Journal of Hydrology, 233(1), 37-53.
Adomako, D. Osae, S. Akiti, T.T, Faye, S. and Maloszewski, P. (2010). Geochemical
and isotopic studies of groundwater conditions in the Densu River Basin of
Ghana. Environ Earth Sci. doi:10.1007/ s12665-010-0595-2.
Akiti, T. T. (1986). Environmental isotope study of groundwater in crystalline rocks
of the Accra Plains, Ghana, 4th working meeting, isotopes in nature,
proceedings of an advisory group meeting pp.107-121, Leipzig.
Akiti, T.T. (1980). Geochemical and isotopic studies of groundwater in Upper West
Region of Ghana. Unpublished PhD Thesis, Universitié de Paris Sud,
Laboratoired‗hydrlogic et de geochemie isotopique.
Akoto, O., Darko, G. and Nkansah, M. A. (2011). Chemical composition of rainwater
over a mining area in Ghana. Int. J. Environ. Res., 5(4):847-854.
Alan, D.Z., Justin, S., Edwin, P.M., Bart, N., Eric, F.W, Dennis, P.L, 2003. Detection
of intensification in global-and continental-scale hydrological cycles:temporal
scale of evaluation. Journal of Climate 16, 535–547.
Anna Lundgren and Hanna Åkerberg, ( 2006). Rainwater harvesting in the peri-urban
areas of Accra: status and prospects. Master thesis, Royal Institute of Tech-
nology Stockholm, Sweden.
Appelo, C.A.J. and Postma, D. (2005). Geochemistry, groundwater and pollution, 2nd
edition, A.A Balkema, Rotterdam.
Appiah, F. (2008). Physicochemical Analysis of Roof Run-off in the Obuasi Area
[Master‘s thesis]. KNUST, Kumasi, Ghana. 31-35pp.
Apraku, A. and Adu-Kumi, M. (2013). Sustainable development: Rainwater quality
and safe use (A case study in Adukrom Akwapim), Eastern Ghana. Inter-
national Journal of Water Research ISSN 2348 – 2710.
Armah, T.E.K., (2000). Groundwater salination in parts of Southern Ghana.
Groundwater past achievements and future challenges, Sililo et (eds) © 2000
Balkema, Rotterdam.
Arnell, N.W. (1999). Climate change and global water resources. Global Environ-
mental Change 9, S31–S49.
Balestrini, R., Galli, L., Tartari, G., 2000. Wet and dry atmospheric deposition at
prealpine and alpine sites in northern Italy. Atmos. Environ. 34, 1455–1470.
Bannerman, R. R. (1994). Appraisal of the limestone aquifer of the Keta Basin,
Ghana.In: Soveri J., Suokko T. (eds.) Future groundwater resources at risk.
University of Ghana http://ugspace.ug.edu.ghUniversity of Ghana http://ugspace.ug.edu.gh

87
Publ. 222 International Association for Hydrological Sciences, Wallingford:
315-321.
Banoeng-Yakubu, K.B. (2000), Application of remote sensing and geographical
information system to hydrological studies in the Upper West Region of
Ghana.
Barnes, D. A. (2009). Assessment of rainwater harvesting in Northern Ghana
[Unpublished Master‘s thesis]. Massachusetts Institute of Technology 108
Basin, North West China. Appl. Geochem. 21 (12), 2148–2170.
Bhavananda, Mayengbam .(2010), The potential of rain water harvesting in Ayigya,
Kumasi, Ghana. Master‘s programme in urban management and develop-
ment.
Boers, T. M. and Ben-Asher, J (1982). A review of rainwater harvesting. Agricultural
Water Management, 5 (2), 145-158.
Brodie E.L., DeSantis T.Z., Moberg Parker J.P., Zubietta I.X., Piceno Y.M., and
Andersen G.L. 2006. ―Urban aerosols harbor diverse and dynamic bacterial
populations.‖ Proceedings of the National Academy of Sciences 104(1): 299-
304.
Butler, J.N. (1964). Ionic equilibrium: A mathematical approach, Addison-Wesley,
Reading, MA.
Camilli, L. (2000). Rainwater harvesting: Constructing a cistern and gutter using
village technologies and materials.
Celle-Jeanton, H., Travi, Y., Loye-Pilot, M.D., Huneau, F., Bertrand, G., 2008.
Rainwater chemistry at a Mediterranean inland station (Avignon, France):
local contribution versus long-range supply. Atmos. Res. 91 (1), 118–126.
Chang M. and Crowley C.M. 1993. ―Preliminary observations on water quality of
storm runoff from four selected residential roofs.‖ Water Resources Bulletin
29(5):777-783.
Chapman, D. (1992). Water quality assessment: A guide to the use of biota, sediments
and water in environmental monitoring. University Press, Cambridge.
Chapman, D. (1996). Water quality assessments - A guide to use of biota, sediments
and water in environmental monitoring– 2nd
Edition. UNESCO/WHO/UNEP
ISBN 0 419 21590 5 (HB) 0 41921600 6 (PB).
Charlson, R. J. and Rodhe, H. (1982). Factors controlling the acidity of natural
rainwater. Nature, 295, 683-685.
Clark, I.D., and P. Fritz. 1997. Environmental isotopes in hydrogeology. New York,
Lewis Publishers, 328 p.
University of Ghana http://ugspace.ug.edu.ghUniversity of Ghana http://ugspace.ug.edu.gh

88
Cobbina, S. J., Michael, K., Salifu, L., Duwiejua, A. B, (2013). Rainwater quality
assessment in the Tamale municipality. International journal of Scientific &
Technology Research Volume 2, Issue 5, Issn 227-8616.
Coleman, M.L., Shepherd, T.J., Durham, J.J., Rouse, J.E. and Moore, G.R.(1982).
Reduction of water with zinc for hydrogen isotope analysis, Anal Chem 54:
993-995 Coplen TB (1988) Normalization of oxygen and hydrogen isotope
data. Chem Geol 72: 293-297.
Coplen, T.B. (1988). Normalization of oxygen and hydrogen isotope data. Chem Geol
72: 293-297.
Craig,H (1961). Isotopic variation in meteoric waters, Science1, 33, 1702-1703. δ18
O
in precipitation/river water on the Tibetan Plateau. Chin. Sci. Bull. 2009.
Dai A (2006) Recent climatology, variability, and trends in global surface humidity. J
Clim 19:3589–3606.
Danida, Ministry of Foreign Affairs (2003). Government of Ghana, SPS document,
WSSPSII, Water and sanitation sector programme support Phase II, Ref.
No. 104. Gha.814.
Dansgaard, W. (1964). ―Stable isotopes in precipitation,‖ Tellus, 16: 436-468.
Dapaah-Siakwan, S., and Gyau-Boakye, P. (2000). Hydrogeologic framework and
borehole yields in Ghana. Hydrogeology Journal, 8(4), 405-416.
Daviest, S.N. and Dewiest, R.G.M. (1996). Hydrology New York, John Willey and
sons. 463pp.
Davis, S.N. and DeWiest, R.G.M. (1966). Hydrogeology New York. Willey,London,
p 463.
De Vries, J.J. and Simmers I. (2002). Groundwater recharge: an overview of processes
and challenges. Hydrogeology Journal 10:5-17.
De Zuane, J. (1990). Handbook of drinking water quality. Van Nostrand Reinhold,
2nd Edition, New York 29-30.
Demirak, A., Balci, A., Karaoglu, H. and Tosmur, B. (2006). Chemical characteristics
of rainwater at urban site of South Western Turkey. Environ. Monit. Assess.
123 (1– 3), 271–283.
Desboeufs, K., Journet, E., Rajot, J.L., Chevaillier, S., Triquet, S., Formenti, P. and
Zakou, A. (2010). Chemistry of rain events in West Africa: Evidence of dust
and biogenic. 112-115.
Despins, C., K. Farahbakhsh, and C. Leidl. 2009. Assessment of rainwater quality
from rainwater harvesting systems in Ontario, Canada. J. Water Supply Res.
Technol. AQUA 58:117–134.
University of Ghana http://ugspace.ug.edu.ghUniversity of Ghana http://ugspace.ug.edu.gh

89
Dickson, K.B and Benneh, G.(1998). A new geography of Ghana. Longman Group
UK limited. Longman House, Burnt Mill, Harlow, Essex, England Pg. 27-52.
Dickson, K.B and Benneh, G.(1985). A new geography of Ghana. Perason Education
Limited, Edinburg Gate, Harlow, Essex CM20 2JE, England.
Donato, F., Monarca, S., Premi, S. and Gelatti, U. (2003). Drinking water hardness
and chronic degenerative diseases. Part III. Tumors, urolithiasis, fetal
malformations, deterioration of the cognitive function in the aged and atopic
eczema. (In Italian.) Ann. Ig. 15, 57-70.
Driscoll, C.T. (1985). Aluminum in acidic surface waters: Chemistry, transport and
effects. Environ Health Perspect 66:93–104.
Dunne T, Zhang WH, Aubry BF (1991) Effects of rainfall, vegetation, and micro topo
graphy on infiltration and runoff. Water Resour Res 27:2271–2285.
Edmunds, W.M., Ma, J.Z., Aeschbach-Hertig, W., Kipfer, R., Darbyshire, F.( 2006).
Groundwater recharge history and hydrogeochemical evolution in the Minqin
Basin, North West China. Appl. Geochem. 21 (12), 2148–2170.
Epstein, S. and Mayeda, T.K. (1953). Variations of the 18
O/16
O ratio in natural water.
Geochim Cosmochim Acta 4:213–220.
Feng, Q., Liu, W., Su, Y.H., Zhang, Y.W., Si, J.H.(2004). Distribution and evolution
of water chemistry in Heihe River basin. Environ. Geol. 45, 947–956.
Feng, Z., Huang, Y., Feng, Y., Ogura, N. and Zhang, F. (2001). Chemical composition
of precipitation in Beijing area,Northern China. Water Air Soil Pollut., 125,
345-356.
Fianko, J.R., Osae, S., Adomako, D. and Achel, D.G. (2008). Relationship Between
Land Use and Groundwater Quality in Six Districts in the Eastern Region of
Ghana, Environ Monit Assess 153:139–146.
FMI (2007). "Fog And Stratus - Meteorological physical background". Zentralanstalt
für meteorologie und geodynamik. Retrieved 2009-02-07.
Fontes, J.C. (1980). Environmental isotopes in groundwater hydrology. In: Fritz P,
Fontes JC (eds) Handbook of environmental isotope geochemistry. Elsevier,
Amsterdam.
Fontes, J.C. and Olivry, J.C. (1976). Gradient isotopique Entre 0 et 4000 m dans les
pre´ - cipitations du Mont Cameroun. Re´sume, CR Reun Ann Sci Terre,
Paris, Soc. Ge´olo. Franc¸ ais, pp 1–171.
Fovell, R. G., 2004: Adjoint of a parameterized moisture convection model. Meteoro
logy and atmospheric physics,86, 173-194.
.
Freeze, R. A. and Cherry, J. A. (1979). Groundwater. Prentice Hall, Englewood Cliffs,
NJ, USA.
University of Ghana http://ugspace.ug.edu.ghUniversity of Ghana http://ugspace.ug.edu.gh

90
Friedman, O., Machta, L. and Soller, R., (1962). Water vapour exchange between a
water droplet and its environment. J Geophys Res 67:2761–2766.
Ganyaglo, S. Y. ―Hydrochemical and isotopic characterization of groundwater in
some rock types in the Eastern Region of Ghana,‖ Unpublish Mphil Thesis,
2009.
Gasparini, A., Custudio, E., Fontes, J.C., Jimenez, J., Nunez, J.A. (1990). Exemple
d‘e´tude ge`ochimique et isotopique de circulations aquife`res en terrain
volcanique sous climat semi-aride (Amurga, Gran Canaria, Iles Canaries). J
Hydrol 114:61–91.
Gat, J.R. (1981). Atmospheric Waters. In: Stable isotope hydrology, deuterium and
oxygen-18 in the water cycle. Technical reports series no. 210. IAEA,
Vienna.
Ghana MDG, (2006). Millennium Development Goals Report Ghana: 102-108.
Gibrilla, A., Osae, S., Akiti, T.T, Adomako, D., Ganyaglo, S.Y, Bam, E.P.K. and
Hadisu, A. (2010b) Origin of dissolved ions in groundwaters in the Northern
Densu River Basin of Ghana using stable isotopes of 18
O and 2H. J. Water
Resource Protection 2:1010–1019.
Gibrilla, A., Osae, S., Akiti, T.T., Adomako, D., Ganyaglo, S.Y., Bam, E.P.K. and
Hadisu, A. (2010). Hydrogeochemical and groundwater quality studies in the
northern part of the Densu River Basin of Ghana. J. Water Resource and
Protection, 2, 1071-1081.
Gibson, J.J., Edwards, T.W.D. and Bursey, G.G. (1993). Estimating evaporation using
stable isotopes: Quantitative results and sensitivity analysis for two
catchments in Northern Canada. Nord Hydrol 24:79–94.
Glossary of Meteorology (June, 2000)."Relative humidity". America meteorological
society. Retrieved 2010-01-29.
Gonfiantini, R., Roche, M.A., Olivry, J.C., Fontes, J.C. and Zuppi, G.M. (2001). The
altitude effect on the isotopic composition of tropical rains. Chem Geol
181:147– 167.
Gonfiantini, R., Gallo, G., Payne, B.R., Taylor, C.B. (1976). Environmental isotopes
and hydrochemistry in groundwater of Gran Canaria. In: Proceedings of a
group meeting on interpretation of environmental isotope and hydrochemical
data in groundwater hydrology, IAEA, Vienna.
Gould, J. E. and McPherson, H. J. (1987). Bacteriological quality of rainwater in roof
and groundwater catchment systems in Botswana. Water International
12:135-138pp
Gourcy, L.L., Groening, M. and Aggarwal, P.K. (2005). Stable oxygen and hydrogen
isotopes in precipitation. In: Aggarwal PK, Gat JR, Froehlich KFO (eds)
isotopes in the water cycle: past, present and future of a developing science.
Elsevier, Amsterdam, pp 39–51.
University of Ghana http://ugspace.ug.edu.ghUniversity of Ghana http://ugspace.ug.edu.gh

91
Gyau-Boakye, P. and Dapaah-Siakwan, S. (2000). Groundwater as source of rural
water supply in Ghana. Journal of applied science and technology (JAST),
vol. 5, Nos. 1 & 2 pp. 77 – 86.
Harvey, F.E., Welker, J.M.( 2000). Stable isotopic composition of precipitation in the
semi-arid north-central portion of the US Great Plains. J. Hydrol. 238,90-119.
Hayes, T. (2004). GasTIPS. The electrodialysis alternative for produced water
management. Retrieved February 27, 2011 from www.gastechnology.org.
Helsrup, T, Jørgensen, N.O. and Banoeng-Yakubo, B. (2007). Investigation of
hydrochemical characteristics of groundwater from cretaceous– Eocene
limestone aquifer in Southern Ghana and Togo using hierarchical cluster
analysis. Hydrogeol 15:977–989.
Hendrickx, J.M.H. and M. Flury. ( 2001). Uniform and preferential flow mechanisms
in the vadose zone. In conceptual models of flow and transport in the
fractured vadose zone, National Academy Press, Washington D.C. pp. 149-
187.
Hendrickx, J.M.H. and Walker, G.R. (1997). Recharge from precipitation. In:
Simmers I.(Ed), Recharge of phreatic aquifers in semi- arid areas. IAH,
Wallingford.
IAEA, (1980). Arid zone hydrology: Investigations with isotope techniques. In:
Proceedings of an advisory group meeting, IAEA, Vienna.
IFFM (International Fact-Finding Mission) (2002). Report of the international fact-
finding mission on water sector reform in Ghana.
Igwo-Ezikpe, M. N. and Awodele, O. (2010). Investigation of some physico-chemical
and microbiological parameters in rainwater collected from industrial areas
of Lagos State, Nigeria: African journal of pharmaceutical science and
pharmacy, AJPSP 1:1, 26-38. A pyramid pharmaceutical group inc., USA
Publication.
International Atomic Energy Agency (1981). Guidebook on Nuclear Techniques in
Hydrology; Technical report series Vienna.
Jørgensen, N. O., & Banoeng-Yakubo, B. K. (2001). Environmental isotopes (18
O, 2H,
and 87
Sr/86
Sr) as a tool in groundwater investigations in the Keta Basin,
Ghana. Hydrogeology Journal, 9(2), 190-201.
Kattan, Z. (1997). Chemical and environmental isotope study of precipitation in Syria.
Journal of Arid Environments, 35, 601-615.
Kempler,S.(2009)."Parameter information page". NASA Goddard space flight center.
Archived from the original on November 26, 2007. Retrieved 2008-12-27.
Kendall, C. and McDonnell, J.J. (1998). Isotope tracers in catchment hydrology.
Elsevier, Amsterdam.
University of Ghana http://ugspace.ug.edu.ghUniversity of Ghana http://ugspace.ug.edu.gh

92
Khare, P., Goel, A., Patel, D. and Behari, J. (2004). Chemical characterization of
rainwater at a developing urban habitat of Northern India. Atmos. Res. 69,
135–145.
Kimpei Ichiyanagi. (2007) Review: Studies and applications of stable isotopes in
precipitation. Journal of Japanese association of hydrological sciences
37:4,165-185. Online publication date: 1-Jan-2007.
Kingett Mitchell. 2003. ―A study of roof runoff quality in Auckland New Zealand,
Implications for Stormwater Management.‖ Prepared for Auckland Regional
Council.
Knobel, L.L., and Philips, S.W., (1988). Aqueous geochemistry of the Magothy
aquifer Maryland: U.S. Geological Survey Water- Suply Paper 2323,28p.
Kohler, I., Sausen, R. and Reinberger, R. (1997). Contribution of aircraft emission to
the atmospheric NOx content, Atmos. Environ., 31, 1810-1818.
Kottek, M., Grieser, J., Beck, C., Rudole, B., Rubel, F., 2006. World Map of Köppen-
Geiger climate classification updated. Meteor. Z. 15, 259–263.
Kortatsi, B.K. (2006). Concentration of trace metals in boreholes in the Ankobra
Basin, Ghana, West Africa, Journal of Applied Ecology vol. 10.
Kortatsi, B.K. (1994). Groundwater utilization in Ghana. Paper presented at the future
groundwater resources at risk (Proceedings of the Helsinki Conference, June
1994). IAHS Publ. no. 222, 1994.
Kulshrestha, U., Kulshrestha, M.T., Sekar, R., Sastry, G.S.R. and Vairamani, M.
(2003). Chemical characteristics of rainwater at an urban site of South
Central India. Atmos. Environ. 37, 3019-3026.
Leap, D.I. (1999). Geological occurrence of groundwater, p 40-43. In: J.Delleur (ed.)
The handbook of groundwater engineering. CRC Press LLC and Springer-
Verlag.
Ma, J.Z., Wang, X.S. and Edmunds, W.M. (2005). The characteristics of groundwater
resources and their changes under the impacts of human activity in the arid
Northwest China: a case study of the Shiyang River Basin. J. Arid Environ.
61, 277–295.
Mallari, B. (1959). Preliminary study of geology and groundwater resources of Ghana.
Ghana water and sewerage corporation report 200p.
Mark, S. (2005): Atmospheric thermodynamics. University of Washington, p.80.
Markus M, Tanny J, Li Y, Cohen S. (2004) Measuring and predicting evapotrans-
piration in an insect-proof screenhouse. Agr Forest Meteorol 127:35–51.
Mason, C.F., 2002. Biology of freshwater pollution, Fourth Edition. Prentice Hall,
Harlow, Essex.
University of Ghana http://ugspace.ug.edu.ghUniversity of Ghana http://ugspace.ug.edu.gh

93
Mazor, E. (2004). Chemical and isotopic groundwater hydrology. Dekker, New York.
Mazor, E. (1997). Groundwater and isotopic groundwater hydrology. Third Edition,
Marcel Decker, Inc. New York pp. 114-152.
Mcginty WA, Smeins FE, Merrill LB (1979) Influence of soil, vegetation, and grazing
management on infiltration rate and sediment production of edwards-plateau
rangeland. J Range Manage 32:33–37.
Mensah (1998) ―Restructuring the delivery of clean water to rural communities in
Ghana: the institutional and regulatory issues‖, water policy, Volume 1,
pages 383-395.
Mook, W.G. (2006). Introduction to isotope hydrology: Stable and radioactive
isotopes of hydrogen, oxygen and carbon. Taylor and Francis, London.
Moore, J.E. (2002). Field hydrogeology, a guide for site investigations and report
preparation, Lewis publishers.
Moore, M.L. (1989). NALMS management guide for lakes and reservoirs. North
American Lake Management Society, P.O. Box 5443, Madison, WI,
53705- 5443, USA.
Mooyoung H, (2004). Rainwater harvesting; A new paradigm to meet MDG and
sustainability.
Nerquaye-Tetteh B. H. (1993).Water, sanitation, environment and development water
resources appraisal in the Keta Basin. In: Proc. 19th WEDC Conference,
Accra, Ghana: 102-108.
Nyarko, K.B., (2008), Private Sector Involvement in Drinking Water Supply in Ghana:
International Journal of Water, Vol. 4, No. 3/4, pp. 197-215.
Odoi, J. O. (2010). Anthropogenic sources and environmentally relevant
concentrations of heavy metals in surface water of a mining district in Ghana:
a multivariate statistical approach. Journal of Environmental Science and
Health Part A, 45(13), 1804-1813.
Olajire, A. A., & Imeokparia, F. E. (2001). Water quality assessment of Osun river:
Studies on inorganic nutrients. Environmental Monitoring and Assessment,
69(1), 17–28.
Osei Asare YB (2004) Household water security and water demand in the Volta Basin
of Ghana, PhD thesis, University of Bonn, Germany.
Ovrawah, L. and Hymore, F.K. (2001). Quality of water from hand-dug wells in the
Warri environs of Niger Delta region; Afr. J, Environ. Studies, 2 (2), 169-
174.
Payne, B.R and Yurtsever, Y. (1974). Environmental isotopes as a hydrogeological
tool in Nicaragua. In: Proceedings of a symposium on isotope techniques in
groundwater hydrology, vol. 1, IAEA, Vienna.
University of Ghana http://ugspace.ug.edu.ghUniversity of Ghana http://ugspace.ug.edu.gh

94
Peterson, J. R., McCalla, T. M. and Smith, G. E (1971). Human and animal wastes as
fertilizers‗, Fertilizer Technology and Use, SSSA, Madisson, pp. 557–596.
Pidwirny, Michael.(2007)."Cloud formation processes". Encyclopedia of Earth, Editor
Cutler J. Cleveland. Topic Editor, Slanina, Sjaak. Environmental Information
Coalition (EIC) of the National Council for Science and the Environment
(NCSE), Washington D.C., USA.
Polkowska, Z., Grynkiewicz, M., Zabiegala, B. and Namiesnik, J. (2001). Levels of
pollutants in roof run-off water from roads with high traffic intensity in the
city of Gdansk, Poland, Pol. Journal of Env. Stud. 10-351pp.
Prathibha, P., Kothai, P., Saradhi, I.V., Pandit, G.G.and Puranik, V.D. (2009).
Chemical characterization of precipitation at a coastal site in Trombay,
Mumbai, India. Environ. Monit. Assess. 168 (1–4), 45–53.
Prizgonov, V., Nitashov, V. and Steriocovitch, P.V., (1988). Determination of
recharge zone of Damascus Basin by the use of oxygen- 18 in groundwater.
Nawca (edn in Russian), USSR Academy of Science, Moscow, pp. 169–174.
Quek U. and Förster J. 1993. ―Trace metals in roof runoff.‖ Water, Air, and Soil
Pollution 68(3-4): 373-389.
Quereda, S., Cantos, J.O. and Chiva, J.M.E. (1996). Red dust rain within the Spanish
Mediterranean area. Clim. Change 32, 215–228.report (1995).
Radaideh, J., Al-Zboon, K., Al-Harahsheh, A. & Al-Adamat, R. (2009),Quality
assessment of harvested rainwater for domestic uses. Jordan J. Earth Environ.
Sci.2,26–31.
Radojevic, M. and Bashkin, V.N. (1999). Practical environmental analysis. Royal
Society of Chemistry (Great Britain) p. 170-172.
Root, E, Jones, W., Schwarz, B., and Gibbons, J.. (2004). Rainwater chemistry across
the United States. Study, Carlton University. Accessed through <http://www.
people.carleton.edu/~bhaileab/environmentalgeology/RainWater.pdf>
Rozanski, K, Sonntag, G. and Munnich, K. O. (1982). Factors controlling the stable
isotopic composition of European Precipitation; Tellus 34 142–150.
Schlesinger, W.H. (1991). Climate, environment and ecology. pp. 371-378. In: J.Jager
and H.L. Ferguson (eds.). Climate change: Science, impacts and policy.
Proceedings of the second world climate conference. Cambridge
University Press.
Seinfeld, J. H. (1986). Atmospheric Chemistry and Physics of Air Pollution. Willey,
New York, pp. 738.
Su, Y.H., Zhu, G.F., Feng, Q., Li. Z.Z. and Zhang, F.P. (2009). Environmental
isotopic and hydrochemical study of groundwater in the Ejina Basin,
Northwest China. Environ Geol 58(3):601–614.
University of Ghana http://ugspace.ug.edu.ghUniversity of Ghana http://ugspace.ug.edu.gh

95
Subramanian, M. S. (2004). Environmental chemistry and analysis, Madras: Indian
Institute of Technology. India.
Tang, A., Zhuang, G., Wang, Y., Yuan, H. and Sun, Y. (2005). The chemistry of
precipitation and its relation to aerosol in Beijing. Atmos. Environ., 39, 3397-
3406.
Tay, C (2007). Chemical characteristics of groundwater in the Akatsi and Ketu
Districts of the Volta Region, Ghana. West African journal of applied
ecology.Vol.11: 1-23.
Thomas, T. (1998). Domestic water supply using rainwater harvesting‟ , Build. Res.
Inform. 26 (2), pp. 94–101.
Thomas, P.R. and Grenne, G.R. (1993). Rainwater quality from different roof
catchments. Water Science Technology (28):290-99pp.
Tuncel, S.G. and Ungor, S. (1996). Rain Water Chemistry in Ankara, Turkey. Atmos.
Environ. 30, 2721–2727.
TWDB (Texas Water Development Board) (2005). Water conservation best
managementPracticesguide,96101pp.[/www.twdb.state.tx.us/assistance/conse
rvation/TaskForceDocs/WCITFBMPGuide.pdf], (accessed 25/09/2010).
Ulrich, E., Lelong, N., Lanier, M. and Schneider, A. (1998). Regional differences in
the relation between monthly precipitation and bulk concentration in France
(Renecofor). Water Air Soil Pollut. 102, 239-257.
U.S. EPA, (2000h). "AP- 42: Compilation of air pollutant emission factors, volume II:
mobile sources". Office of transportation and air quality, office of air
radiation. Washington, DC. EPA AP-42, volume II internet: www:
epa.gov/otaq/ap/42.htm.
Verd, V. S., Domingues, S. J., Gonzales, Q. M., Vidal, M. M., Mariano, S. A. C., de
Roque, C. C. and Sevilla, M. J. M. (1992). Association between calcium
content of drinking water and fractures in children (in Spanish). An. Esp.
Pediatr. 37, 461-465.
Warrier C.U, Praveen Babu M, Manjula P, Velayudhan K.T, Shahul Hameed A, Vasu
K (2010). Isotopic characterization of dual monsoon precipitation - evidence
from Kerala, India. Curr. Sci., 98 (11) (2010), pp. 1487–1495.
White, A.F. and Brantley, S.L. (1995). Chemical weathering rates of silicate minerals,
p 1 – 22. In: White, A.F. and Brantley, S.L. (eds.) Reviews in mineralogy.
WHO (Word Health Organisation) 1997. Guidelines for drinking water quality. 2nd
edn. Vol. 1, 173p.
WHO. (1984). Guidelines for drinking water quality, vol. 1, World Health
Organization.
Wooller, M.J., Wang, Y., Axford, Y. (2008). A multiple stable isotope record of late
University of Ghana http://ugspace.ug.edu.ghUniversity of Ghana http://ugspace.ug.edu.gh

96
quaternary limnological changes and chironomid paleoecology from north
eastern Iceland. Journal of Paleolimnology, 40:63-77.
Xu, C.Y. and Singh, V.P., (2004). Review on regional water resources assessment
under stationary and changing climate. Water resources management 18 (6),
591– 612.
Yamanaka, T., Tsujimura, M., Oyunbaatar, D. and Davaa, G. (2007). Isotopic
variation of precipitation over Eastern Mongolia and its implication for the
atmospheric water cycle. J. Hydrol. 333, 21–34.
Yang, Q., Xiao, H.L., Zhao, L.J., Yang, Y.G., Li, C.Z., Zhao, L., Yin, L. (2010).
Hydrological and isotopic characterization of river water, groundwater, and
groundwater recharge in the Heihe River Basin, Northwestern China. Hydrol.
Process. 25,1271–1283.
Yao, T., Thompson, L. G., Thompson, E. M., Yang, Z., Zhang, X. and Ping, N. L.
(1996) Climatological significance of 18
O in North Tibetan cores. J. Geophys.
Res. 101 29531–29538.
Yidana, S. M. and Yidana, A. (2010). Assessing water quality using water quality
index and multivariate analysis. Environmental Earth Sciences, 59(7), 1461-
1473.
Yidana, S.M. (2010). Groundwater classification using multivariate statistical
methods: Southern Ghana, Journal of African Earth Sciences, 12.002 vol.1
recommendations, Geneva, Switzerland.
Yidana, S.M. (2008). The hydrochemical framework of surface water basins in
Southern Ghana, Environ Geol 57:789-796.
Younos, T., Bohdan, R., Anderson, E., Ramsey, K., Cook, N., Ross, B. and Dillaha, T.
(1998). Evaluation of rooftop rainfall collection cistern storage systems in
Southwest Virginia. Blacksburg, VA 24061. p23.
Yurtsever, Y. and Gat, J.R. (1981). Atmospheric Waters. In: Gat, J.R., Gonfiantini, R.
(Eds.), Stable isotope hydrology: Deuterium and oxygen-18 in the water
cycle 103– 139. Technical Report Series No. 210, IAEA, Vienna.
Zakaria,Issaka (2011). Appropriate rainwater harvesting and domestic water quality:
A case study of central Gonja district, Kwame Nkrumah University of Science
and Technology Msc thesis.
Zhang, M., Wang S., Wu F., Yuan, X. and Zhang Y. (2007). Chemical compositions
of wet precipitation and anthropogenic influences at a developing urban site
in Southeastern China. Atmos. Res., 84, 311-322.
Zhao, L.J., Lin, L., Xiao, H.L., Cheng, G.D., Zhou, M.X., Yang, Y.G., Li, C.Z. and
Zhou, J. (2011). Isotopic evidence for the moisture origin and composition of
surface runoff in the headwaters of the Heihe River Basin. Chin. Sci. Bull.
56 (4–5), 406–416.
University of Ghana http://ugspace.ug.edu.ghUniversity of Ghana http://ugspace.ug.edu.gh

97
Zhou, S. Nakawo, M. Sakai, A. Matsuda, Y. Duan, K. and Pu J. (2007). Water
isotope variations in the snow pack and summer precipitation at July 1
Glacier, Qilian Mountains in Northwest China. Chin Sci Bull 52(21):2963–
2972.
University of Ghana http://ugspace.ug.edu.ghUniversity of Ghana http://ugspace.ug.edu.gh

98
APPENDICES
Apendix A: Physico-chemical paramerts of rainwater at Kpando
DATE
Rainfall
Amount pH EC TDS SAL. TSS TEMP. TURB. COLOUR Na⁺ K⁺ Ca²⁺ Cl¯ OH¯ HCO₃ SO₄²¯ NO₃¯ Mg²⁺
21/02/2013 7.20 5.75 50.80 25.60 0.00 4.00 24.10 5.00 16.00 11.30 1.50 2.24 15.49 40.00 48.76 17.09 0.29 0.67
25/02/2013 32.70 5.25 22.70 11.30 0.00 6.00 24.10 4.00 22.00 5.10 1.20 1.60 10.99 20.00 24.38 18.44 0.25 0.54
13/03/2013 4.70 4.79 25.40 12.70 0.00 8.00 24.10 3.00 24.00 4.30 1.50 2.88 20.49 10.00 12.19 17.67 0.28 0.76
15/03/2013 3.30 5.44 26.80 14.70 0.00 0.00 24.10 0.00 3.00 7.70 0.90 2.24 14.99 20.00 24.38 13.69 0.45 0.92
20/03/2013 6.20 5.99 30.70 15.80 0.00 8.00 24.10 3.00 21.00 3.40 1.10 2.24 7.99 30.00 36.58 32.43 0.45 0.83
21/03/2013 14.70 5.84 38.90 19.70 0.00 1.00 24.10 6.00 8.00 3.70 1.50 3.84 9.49 20.00 24.38 6.99 0.47 1.43
31/03/2013 7.20 5.81 40.40 20.30 0.00 3.00 24.10 2.00 5.00 5.90 3.90 3.52 13.99 20.00 24.38 17.96 0.32 1.54
09/04/2013 3.40 5.19 43.00 21.40 0.00 9.00 24.10 1.00 6.00 5.30 2.10 3.52 17.59 20.00 24.38 8.64 0.44 0.61
13/04/2013 2.30 5.83 34.60 20.20 0.00 5.00 24.00 2.00 11.00 4.80 1.60 4.16 19.49 20.00 24.38 12.43 0.25 1.07
25/04/2013 19.70 5.34 17.26 8.70 0.00 0.00 23.90 0.00 15.00 2.50 0.00 1.28 16.99 20.00 24.38 1.65 0.09 0.72
01/05/2013 6.40 5.84 11.11 6.20 0.00 2.00 23.90 0.00 0.00 2.00 2.50 1.60 16.39 10.00 12.19 9.71 0.18 0.87
03/05/2013 2.20 5.27 61.70 31.60 0.00 5.00 24.00 0.00 0.00 6.30 3.90 4.48 15.49 10.00 12.19 15.83 0.19 0.80
08/05/2013 12.70 5.40 13.01 6.60 0.00 0.00 24.00 0.00 0.00 2.60 2.10 2.24 11.99 20.00 24.38 5.44 0.61 0.72
10/05/2013 10.80 5.46 20.40 11.00 0.00 4.00 24.00 3.00 12.00 3.50 0.50 1.28 19.99 10.00 12.19 7.96 0.34 0.73
17/05/2013 9.40 5.14 26.40 13.30 0.00 7.00 23.90 4.00 15.00 5.60 1.60 2.24 12.49 20.00 24.38 4.56 0.36 0.73
18/05/2013 71.80 5.69 7.98 4.30 0.00 0.00 23.90 0.00 2.00 2.10 0.00 0.64 17.99 20.00 24.38 18.64 0.35 0.67
22/05/2013 40.90 6.00 10.41 5.80 0.00 0.00 24.00 5.00 12.00 1.40 0.00 1.28 12.79 20.00 24.38 9.71 0.34 0.82
28/05/2013 16.80 5.27 9.46 4.80 0.00 0.00 24.10 0.00 7.00 2.60 0.20 1.60 18.49 10.00 12.19 4.27 0.18 0.72
30/05/2013 10.40 5.61 46.50 23.90 0.00 6.00 24.00 5.00 10.00 4.90 1.60 5.12 17.59 20.00 24.38 11.55 0.37 0.47
01/06/2013 34.60 5.37 10.93 5.90 0.00 0.00 24.00 0.00 0.00 3.10 0.50 0.96 14.79 30.00 36.58 50.49 0.07 0.73
02/06/2013 4.90 5.76 92.20 46.80 0.00 2.00 23.90 6.00 24.00 24.50 5.30 4.48 12.49 40.00 48.76 73.20 0.46 0.64
08/06/2013 18.30 5.58 12.74 6.80 0.00 2.00 23.80 2.00 14.00 2.40 0.70 3.52 11.59 10.00 12.19 55.63 0.45 0.83
02/07/2013 15.30 5.60 20.60 10.30 0.00 1.00 24.00 9.00 24.00 5.90 2.10 2.40 13.10 16.00 19.51 12.72 0.25 0.52
04/07/2013 10.90 5.70 16.04 8.02 0.00 2.00 23.90 1.00 15.00 2.60 0.60 1.60 15.07 16.00 19.51 9.52 0.06 0.65
09/07/2013 11.40 5.70 14.77 7.39 0.00 2.00 24.10 2.00 8.00 2.60 0.50 1.60 14.19 16.00 19.51 3.10 0.07 0.45
University of Ghana http://ugspace.ug.edu.ghUniversity of Ghana http://ugspace.ug.edu.gh

99
14/07/2013 15.90 5.60 24.71 12.36 0.00 0.00 24.10 3.00 4.00 4.50 1.00 1.60 7.99 16.00 19.51 6.12 0.30 0.09
08/09/2013 24.20 5.60 9.89 4.93 0.00 0.00 23.80 4.00 6.00 2.30 0.70 2.40 11.39 16.00 19.51 19.42 0.14 0.78
09/09/2013 11.30 5.80 19.03 9.51 0.00 3.00 23.80 2.00 7.00 2.30 0.90 1.60 13.09 16.00 19.51 41.75 0.17 0.85
10/09/2013 3.30 5.70 31.49 15.75 0.10 7.00 23.70 0.00 0.00 6.30 1.50 1.60 16.49 16.00 19.51 18.86 0.36 0.79
21/09/2013 12.80 5.90 10.09 5.04 0.00 2.00 24.10 5.00 14.00 2.30 0.50 0.80 15.15 16.00 19.51 1.17 0.24 0.56
22/09/2013 8.80 5.80 17.58 8.79 0.00 5.00 24.00 3.00 5.00 1.60 0.00 2.40 17.09 8.00 9.75 27.18 0.14 0.72
03/10/2013 42.60 5.80 13.47 6.74 0.00 0.00 24.20 5.00 14.00 3.70 0.60 1.60 16.59 16.00 19.51 15.53 0.05 0.67
04/10/2013 24.40 5.70 11.87 5.94 0.00 0.00 24.10 0.00 5.00 2.20 0.30 1.60 11.99 32.00 39.01 4.85 0.44 0.89
06/10/2013 31.10 5.80 26.21 13.11 0.00 1.00 24.00 1.00 2.00 2.20 0.00 2.40 8.67 16.00 19.51 22.33 0.50 0.66
13/10/2013 26.80 5.70 15.35 7.68 0.00 0.00 24.10 2.00 7.00 2.50 0.40 2.40 10.59 16.00 19.51 13.98 0.16 0.71
University of Ghana http://ugspace.ug.edu.ghUniversity of Ghana http://ugspace.ug.edu.gh

100
Apendix B. Physico-chemical paramerts of rainwater at Akatsi
DATE
Rainfall
Amount pH EC TDS SAL. TSS TEMP. TURB. Colour Na⁺ K⁺ Ca²⁺ Cl¯ OH¯ HCO₃ SO₄²¯ NO₃¯ Mg²⁺
05/03/2013 41.5 5.98 31.7 16 0 12 23.9 6 30 6 2.4 2.88 16.99 10 12.19 73.1 0.894 0.79
26/04/2013 45.1 6.57 132.2 66.3 0.7 3 23.8 2 19 10.2 5.9 19.84 16.49 60 73.15 58.252 0.101 0.97
30/04/2013 37.7 5.74 13.99 7.7 0 0 23.9 5 8 4.1 1 0.64 17.49 20 24.28 49.709 0.537 1.07
11/05/2013 34.8 5.55 8.74 4.8 0 1 23.8 0 6 3.5 0.5 1.92 18.49 20 24.28 45.146 0.249 0.91
22/05/2013 22.1 5.62 12.93 6.8 0 3 23.9 2 11 3.6 0.3 1.92 19.49 20 24.28 55.631 0.76 0.78
26/05/2013 83 5.61 11.91 6.2 0 24 23.8 16 67 4.4 0.6 1.28 15.49 20 24.28 58.544 0.443 1.16
30/05/2013 32.6 6.05 21.3 11.7 0 10 23.9 6 28 5.8 2.5 2.24 20.49 20 24.28 52.039 0.418 0.65
06/06/2013 33.2 6.85 152.5 76.8 0.7 0 23.9 0 0 13 8.9 9.6 95.97 80 97.53 51.845 0.364 0.49
09/06/2013 11.6 5.4 20.97 10.53 0 1 24.8 0 2 2.3 1.2 2.4 25.99 24 29.26 17.477 0.396 0
12/06/2013 11.2 6 40.01 20 0 3 24.9 1 2 2.8 1.6 1.6 62.39 24 29.26 54.368 0.014 1.1
20/06/2013 9 6.5 90.39 45.19 0.1 2 24.6 2 6 7 3.3 4.81 45.09 48 58.52 34.951 0.155 0
05/09/2013 28 6.6 49.76 24.87 0.2 11 25 5 30 7.9 4.9 1.6 21.69 24 29.26 10.68 0.259 0.31
22/09/2013 4.8 6.4 100.8 50.4 0.1 4 23.9 2 8 15.7 11.2 2.4 17.99 48 58.52 41.748 0.162 0.42
23/09/2013 3.4 6.5 173.6 86.83 0.2 1 24.8 0 2 17.5 13.6 2.89 20.69 104 126.79 24.272 0.007 0.26
24/09/2013 4.3 6.7 57.85 28.98 0.3 0 24.9 0 4 8.7 6.5 1.6 17.89 32 39.01 40.777 0.36 0.66
26/09/2013 5.4 6.4 58.1 29.03 0.1 1 24.9 1 3 12.6 7 2.4 19.37 32 39.01 15.534 0.162 1.05
28/09/2013 30.3 6.2 16.38 8.19 0.1 2 24.7 2 2 3.5 2 2.4 23.19 16 19.51 15.534 0.31 0.58
21/10/2013 51.3 6.1 54.05 27.04 0 14 23.8 8 32 7.8 6.4 1.6 53.19 32 39.01 11.65 0.151 0.95
24/10/2013 17.3 6.4 35.5 17.75 0.1 2 24.8 1 8 4.2 2.7 1.6 18.89 24 29.26 33.009 0.094 0.75
25/10/2013 18.1 6.4 34.08 17.05 0.1 1 23.8 0 0 4.2 3.6 1.6 25.99 40 48.77 68.932 0.058 0.53
26/10/2013 13.2 6.3 38.13 19.07 0.1 0 23.9 0 0 2.8 0.5 1.6 17.99 40 48.77 14.563 0.299 0
29/10/2013 13.8 6.3 38.74 19.37 0.1 1 24.2 1 4 4.3 1.3 1.6 45.09 32 39.01 47.573 0.252 0.97
31/10/2013 5.1 6.1 20.24 10.12 0 2 24.6 1 5 3.4 0.8 1.6 19.29 24 29.26 14.563 0.249 0.65
University of Ghana http://ugspace.ug.edu.ghUniversity of Ghana http://ugspace.ug.edu.gh

101
Apendix C. Physico-chemical paramerts of rainwater at Amedzofe
DATE
Rainfall
Amount pH EC TDS SAL. TSS Temp. TURB. Colour Na⁺ K⁺ Ca²⁺ Cl¯ OH¯ HCO¯₃ SO₄²¯ NO₃¯ Mg²⁺
20/02/2013 7.2 4.89 50.3 25.2 0 2 24.9 0 0 3.5 2.4 3.52 5.19 20 24.38 12.04 0.274 0.09
21/02/2013 51.7 5.24 8.48 4.2 0 0 25 0 0 1 0.2 3.52 6.19 20 24.38 7.282 0.256 0.08
24/02/2013 7 5.39 14.1 7.1 0 1 24.9 0 0 0.9 0.3 3.2 1.19 10 12.19 13.3 0.732 0.06
02/03/2013 21.6 5.88 40.6 20.3 0 2 24.9 0 0 3.6 2.6 1.6 5.99 10 12.19 1.359 0.249 0.06
04/03/2013 33.4 5.3 11.09 5.5 0 1 25 0 0 0.8 0.4 2.88 2.39 10 12.19 8.155 0.195 0.08
10/03/2013 34.5 5.79 12.02 6 0 0 25 0 0 0.4 0.1 1.28 6.39 20 24.38 -3.98 0.047 0.08
26/03/2013 13.4 5.07 16.67 8.3 0 2 25 0 0 0.6 0.2 1.6 8.39 10 12.19 -1.17 0.249 0.98
30/03/2013 8.5 4.87 23 11.5 0 1 24.8 0 0 1.1 0.6 0.96 4.99 10 12.19 0.388 0.497 0.87
01/04/2013 16.5 5.2 3.43 1.7 0 2 24.9 0 0 0.1 0 2.24 10.99 10 12.19 4.563 0.339 0.13
08/04/2013 13.8 5.45 18.37 9.2 0 1 24.9 0 6 0.6 0.3 1.6 8.39 10 12.19 11.26 0.133 0.23
13/04/2013 7.1 4.89 24 12.1 0 2 24.7 0 10 0 0.2 1.6 6.99 10 12.19 4.854 0.166 0.14
18/04/2013 21.2 5.04 7.56 3.8 0 2 24.8 0 0 0.3 0.1 1.6 9.49 10 12.19 -1.85 0 0.06
21/04/2013 36.4 4.94 4.32 2.2 0 3 24.8 0 0 0 0 1.6 9.99 20 24.38 5.825 0.086 0.08
22/04/2013 14.9 5.05 4.83 2.4 0 1 24.7 0 0 0 0 1.92 11.99 10 12.19 4.272 0.108 0.08
25/04/2013 27.8 5.09 2.43 1.2 0 0 24.7 0 0 0 0 2.24 8.99 10 12.19 -0.87 0 0.38
30/04/2013 31.5 5.09 8.87 4.4 0 1 24.8 0 0 0 0.1 1.92 9.99 10 12.19 -0.29 0.263 0.09
09/05/2013 15.3 5.41 6.96 3.5 0 0 24.7 0 0 0.1 0 1.92 8.39 10 12.19 0.874 0.032 0.09
10/05/2013 43.2 5.56 5.71 2.9 0 1 24.9 0 0 0 0 1.92 6.79 20 24.38 -1.94 0.357 0.07
17/05/2013 6.3 5.55 18.48 9.2 0 0 24.7 0 0 0 0.2 1.28 5.99 10 12.19 12.14 0.076 0.12
18/05/2013 11.5 5.28 7.62 3.8 0 1 24.7 0 0 0 0 0.96 7.39 10 12.19 13.2 0.249 0.1
22/05/2013 8.4 5.41 12.36 6.2 0 1 24.8 0 0 0 0.2 1.92 5.99 10 12.19 3.398 0.259 0.12
29/05/2013 27.2 5.38 4.29 2.1 0 1 24.8 0 0 0 0 2.56 9.99 10 12.19 4.66 0.119 0.09
30/05/2013 22.7 5.82 2.71 1.4 0 1 24.7 0 0 0 0 3.52 7.99 10 12.19 9.708 0 0.33
01/06/2013 22.3 5.4 8.98 4.5 0 1 24.9 0 0 0 0.2 1.28 15.99 10 12.19 13.3 0.054 0.45
05/06/2013 8 5.41 6.41 3.2 0 2 24.9 0 0 0 0 1.6 7.99 10 12.19 6.505 0 0.34
University of Ghana http://ugspace.ug.edu.ghUniversity of Ghana http://ugspace.ug.edu.gh

102
08/06/2013 5.4 5.64 9.51 4.8 0 0 24.7 0 0 0 0 2.24 17.99 10 12.19 11.55 0 0.08
29/06/2013 72 5.71 11.8 5.9 0 4 24.8 0 0 0 0 2.56 7.99 10 12.19 4.078 0.36 0.12
02/07/2013 9.2 5.42 9.68 4.8 0 2 24.8 0 0 0 0 1.6 6.79 10 12.19 9.32 0.169 0.09
04/07/2013 28.6 5.27 8.87 4.4 0 2 24.8 0 0 0 0.3 1.6 11.19 10 12.19 2.621 0.198 0.4
08/07/2013 21.7 5.08 28 14 0 5 24.9 3 0 1.3 0.4 1.92 10.19 10 12.19 10.29 0.259 0.38
10/07/2013 42.8 5.59 7.18 3.6 0 2 24.9 1 0 0 0 1.28 15.99 10 12.19 11.46 0.342 0.42
11/07/2013 31.4 4.78 6.77 3.4 0 3 24.8 2 0 0 0 2.24 15.99 10 12.19 21.36 0.144 0.43
12/07/2013 44.2 4.77 3.87 1.9 0 2 24.7 3 0 0 0 2.24 6.99 10 12.19 5.339 0.328 0.48
14/07/2013 24.6 5.57 5.51 2.8 0 3 24.7 1 0 0 0 2.24 4.99 10 12.19 2.33 0.086 0.62
18/07/2013 19.3 5.16 5.45 2.7 0 1 24.6 1 0 0 0 2.56 4.99 10 12.19 12.82 0.321 0.55
22/07/2013 16.4 5.09 41.8 20.9 0 1 24.9 1 0 5.6 0.3 1.6 5.99 10 12.19 16.6 0.443 0.52
28/08/2013 15.3 6.2 6.28 3.14 0 2 23.9 0 0 1.3 0.6 1.6 6.59 16 19.51 6.214 0.115 0
30/08/2013 7.3 6.3 10.86 5.44 0 1 24.5 0 0 1.1 1 0.8 8.19 16 19.51 1.845 0.505 0
08/09/2013 65.2 5.9 3.85 1.93 0 0 24.6 0 0 0.9 0 0.8 7.99 16 19.51 2.718 0.314 0
09/09/2013 4.2 4.3 43.38 21.68 0.1 0 24.2 0 0 1.7 0.3 0.8 5.09 16 19.51 12.3 0.126 0.02
10/09/2013 8.2 5.6 4.11 2.06 0 0 24.4 0 0 1.2 0.1 0.8 4.39 16 19.51 5.631 0.112 0.11
14/09/2013 9.4 5.4 11.39 5.69 0 3 24.7 0 0 1.9 0 2.4 5.39 16 19.51 1.553 0.115 0.31
19/09/2013 55.3 5.7 3.92 1.96 0 2 23.8 0 0 3.1 1.2 1.6 10.19 24 29.26 3.786 0.67 0.02
20/09/2013 7.6 5.6 11.94 5.97 0 1 24.5 0 0 2 0 2.4 11.29 8 9.75 4.854 0.029 0.37
21/09/2013 21.3 5.8 20.16 10.08 0 2 23.8 0 0 4.3 0.4 1.6 4.99 16 19.51 1.748 0.259 0.06
02/10/2013 18.4 5.9 4.14 2.07 0 2 24 2 0 1.1 0 1.6 7.29 16 19.51 1.748 0.432 0.25
03/10/2013 44.3 5.4 7.94 3.97 0 0 24.2 0 0 1.1 0 1.6 5.69 8 9.75 15.53 0.324 0.07
08/10/2013 56.4 5.5 3.62 1.81 0 2 24.8 0 0 1 0 2.4 4.99 16 19.51 2.913 0.162 0
10/10/2013 12.5 5.2 3.87 1.94 0 1 24.6 1 0 1.1 0 1.6 10.29 16 19.51 8.252 0.112 0.31
15/10/2013 5.4 5.5 10.08 5.04 0 3 24.6 0 0 2.2 0 1.6 6.39 16 19.51 5.728 0.314 0
16/10/2013 14.4 5.7 3.54 1.77 0 1 24.2 0 0 1.1 0 1.6 5.29 16 19.51 2.233 0.735 0.09
University of Ghana http://ugspace.ug.edu.ghUniversity of Ghana http://ugspace.ug.edu.gh

103
Appendix D. Physico-chemical parameters of groundwater at Amedzofe, Kpando and Akatsi
ID Sample type pH EC TDS SAL Eh Elevation TEMP Na⁺ K⁺ Ca²⁺ Cl¯ OH¯ HCO₃¯ SO₄²¯ NO₃¯ Mg²⁺
AS 1 Spring 6.67 339 170 0.1 11 199 28.2 44.4 6.1 3.53 25.99 224 273.1 10.39 0.187 0.93
AS 2 Spring 6.7 822 408 0.3 8.5 247 29.9 110.7 25.1 2.4 117.96 280 341.37 21.55 0.541 1.33
AS 3 Spring 6.24 49.1 25 0 40.6 523 25.4 16.3 0.1 4.01 13.99 40 48.77 9.81 0.299 0.78
AS 4 Spring 6.53 326 164 0.1 19.32 698 25.1 60.5 60.2 4.01 57.98 40 48.77 10.29 0.378 0.59
AS 5 Spring 5.41 257 129 0 84.9 682 23.6 54.9 52.7 2.4 17.99 40 48.77 12.04 0.959 0.11
AS 6 Spring 5.63 44.9 23 0 77.9 737 23.1 14.6 1.5 15.23 13.99 32 39.01 15.63 0.072 0.09
AS 7 Spring 5.07 47.7 24 0 105.3 723 24.1 12.7 1.7 2.4 14.59 24 29.26 55.34 0.537 0.23
AS 8 Spring 6.94 528 264 0.2 5.9 276 28.2 65.8 13.8 8.82 41.99 296 360.88 15.44 0.029 0.07
AS 9 Spring 5.43 108.4 54 0 84.2 454 26.3 25.2 33.4 4.01 45.99 32 39.01 19.13 0.191 0.47
AB 1 Borehole 6.37 480 240 0.2 86.7 46 30 282 6 4081 81.97 112 136.55 14.76 0.202 0.68
AB 2 Borehole 5.13 375 186 0.1 101.6 47 30.3 103.4 2.2 15.23 137.96 48 58.52 7.28 1.049 0.51
AB 3 Borehole 5.39 353 178 0.1 86 45 30.6 100.8 2.1 16.83 136.99 64 78.03 19.13 0.443 0.99
AB 4 Borehole 6.36 103 5.5 0.5 28.6 29 30.6 292 50 15.23 173.95 168 204.82 50.68 0.667 0.78
AB 5 Borehole 6.1 656 327 0.3 44.4 34 30.4 108.7 2 17.64 173.95 168 204.82 50.49 0.717 1.07
AB 6 Borehole 5.63 726 363 0.3 72.2 31 31.4 237 9 12.02 165.59 64 78.03 48.25 0.173 1.21
KB 1 Borehole 6.94 1163 581 0.5 5.2 112 29.6 360.9 7 11.22 73.98 496 604.71 47.77 0.649 0.93
KB 2 Borehole 5.95 1125 563 0.5 54.7 108 30.1 221 3 24.05 72.99 304 370.63 49.71 1.049 0.58
KB 3 Borehole 6.01 318 159 0.1 44.9 171 29.8 96 4 5.61 56.69 120 146.3 1.55 0.339 1.19
KB 4 Borehole 6.02 568 284 0.2 49.1 163 29.2 102 8.8 11.22 45.99 336 409.65 11.75 0.108 1.13
KB 5 Borehole 6.64 557 279 0.2 12.4 158 29.1 102.3 8 8.02 25.99 336 409.65 1.65 0.227 1.11
KB 6 Borehole 6.94 370 185 0.1 -5.8 158 31.4 94.2 36.4 4.81 61.98 104 126.79 11.75 0.195 0.37
University of Ghana http://ugspace.ug.edu.ghUniversity of Ghana http://ugspace.ug.edu.gh

104
Appendix E. Rainfall amount and δ 18
O and δ 2H at Kpando.
DATE Rainfall amount (mm) δ18
O‰ δ2H‰
21/02/2013 7.20 -0.41 6.61
25/02/2013 32.70 -3.85 -15.34
13/03/2013 4.70 0.08 16.35
15/03/2013 3.30 -0.39 8.99
20/03/2013 6.20 -0.22 10.70
21/03/2013 14.70 -0.50 9.27
31/03/2013 7.20 -0.46 3.14
09/04/2013 3.40 0.60 9.64
13/04/2013 2.30 0.83 13.65
25/04/2013 19.70 -3.93 -22.58
01/05/2013 6.40 -1.55 2.64
03/05/2013 2.20 -1.77 1.31
08/05/2013 12.70 -3.51 -17.01
10/05/2013 10.80 -3.26 -12.10
17/05/2013 9.40 -4.91 -27.27
18/05/2013 71.80 -5.52 -28.57
22/05/2013 40.90 -3.84 -17.24
28/05/2013 16.80 -3.28 -15.61
30/05/2013 10.40 -4.76 -22.30
01/06/2013 34.60 -3.75 -14.75
02/06/2013 4.90 -1.92 -6.31
08/06/2013 18.30 -3.85 -16.62
02/07/2013 15.30 -2.97 -16.10
04/07/2013 10.90 -0.66 5.30
09/07/2013 11.40 -1.13 4.43
14/07/2013 15.90 -2.65 -9.84
08/09/2013 24.20 -4.65 -27.36
09/09/2013 11.30 -4.61 -25.91
10/09/2013 3.30 -1.71 2.44
21/09/2013 12.80 -0.61 3.00
22/09/2013 8.80 -1.35 -4.15
03/10/2013 42.60 -5.08 -27.02
04/10/2013 24.40 -4.77 -24.24
06/10/2013 31.10 -4.42 -29.57
13/10/2013 26.80 -4.92 -25.23
University of Ghana http://ugspace.ug.edu.ghUniversity of Ghana http://ugspace.ug.edu.gh

105
Appendix F. Rainfall amount and δ 18
O and δ 2H at Akatsi
DATE Rainfall Amount (mm) δ¹⁸O‰ δ²H‰
05/03/2013 41.50 -2.24 -10.45
26/04/2013 45.10 -0.96 4.18
30/04/2013 37.70 -2.68 -12.89
11/05/2013 34.80 -2.34 -11.4
22/05/2013 22.10 -2.22 -10.45
26/05/2013 83.00 -5.57 -30.16
30/05/2013 32.60 -1.31 -4.1
06/06/2013 33.20 -3.37 -14.68
09/06/2013 11.60 -2.79 -9.97
12/06/2013 11.20 -1.23 -1.15
20/06/2013 9.00 -0.29 3.80
05/09/2013 28.00 -1.87 -7.66
22/09/2013 4.80 0.26 7.12
23/09/2013 3.40 -0.94 5.18
24/09/2013 4.30 -0.76 6.69
26/09/2013 5.40 -0.70 4.58
28/09/2013 30.30 -3.65 -22.92
21/10/2013 51.30 -4.28 -21.14
24/10/2013 17.30 -0.25 4.55
25/10/2013 18.10 -0.43 3.57
26/10/2013 13.20 -1.64 -5.49
29/10/2013 13.80 -1.50 -4.23
31/10/2013 5.10 -1.19 1.39
University of Ghana http://ugspace.ug.edu.ghUniversity of Ghana http://ugspace.ug.edu.gh

106
Appendix G. Rainfall amount and δ 18
O and δ 2H at Amedzofe
DATE Rainfall amount (mm) δ¹⁸O‰ δ²H‰
20/02/2013 7.20 -1.68 -6.40
21/02/2013 51.70 -6.24 -38.26
24/02/2013 7.00 2.73 14.72
02/03/2013 21.60 -2.51 -7.15
04/03/2013 33.40 -2.63 -9.02
10/03/2013 34.50 -1.79 -2.31
26/03/2013 13.40 -2.32 -12.87
30/03/2013 8.50 -3.17 -12.94
01/04/2013 16.50 -1.55 -4.18
08/04/2013 13.80 -4.24 -25.55
13/04/2013 7.10 -1.26 -2.44
18/04/2013 21.20 -3.71 -18.27
21/04/2013 36.40 -3.86 -22.95
22/04/2013 14.90 -4.24 -26.86
25/04/2013 27.80 -3.44 -14.20
30/04/2013 31.50 -4.16 -26.94
09/05/2013 15.30 -2.13 -6.08
10/05/2013 43.20 -4.76 -28.68
17/05/2013 6.30 -1.20 -1.26
18/05/2013 11.50 -3.07 -23.36
22/05/2013 8.40 -3.16 -8.39
29/05/2013 27.20 -4.31 -22.51
30/05/2013 22.70 -5.37 -29.45
01/06/2013 22.30 -1.74 -8.08
05/06/2013 8.00 -0.89 6.41
08/06/2013 5.40 -1.01 2.57
29/06/2013 72.00 -6.54 -38.51
02/07/2013 9.20 -1.81 -8.66
04/07/2013 28.60 -1.28 0.52
08/07/2013 21.70 -3.15 -19.69
10/07/2013 42.80 -4.60 -23.70
11/07/2013 31.40 -4.19 -24.93
12/07/2013 44.20 -5.25 -35.38
14/07/2013 24.60 -2.75 -11.39
18/07/2013 19.30 -4.93 -26.41
22/07/2013 16.40 -3.33 -14.02
28/08/2013 15.30 -2.74 -4.97
30/08/2013 7.30 -2.78 -3.62
08/09/2013 65.20 -5.67 -41.38
09/09/2013 4.20 1.00 11.45
10/09/2013 8.20 -3.74 -17.95
University of Ghana http://ugspace.ug.edu.ghUniversity of Ghana http://ugspace.ug.edu.gh

107
14/09/2013 9.4 -2.81 -17.39
19/09/2013 55.3 -5.11 -30.50
20/09/2013 7.6 -0.20 9.38
21/09/2013 21.3 -2.55 -2.74
02/10/2013 18.4 -2.29 -5.93
03/10/2013 44.3 -3.71 -15.68
08/10/2013 56.4 -4.29 -27.30
10/10/2013 12.5 -0.75 1.6
15/10/2013 5.4 -0.96 -1.36
16/10/2013 14.4 -3.63 -21.55
University of Ghana http://ugspace.ug.edu.ghUniversity of Ghana http://ugspace.ug.edu.gh

108
Apendix H. δ¹⁸O‰ and δ2H‰ in groundwater in Akatsi, Amedzofe and Kpando
Samples Sample type Elevation δ¹⁸O‰ δ²H‰
AS 1 Spring 199 -2.63 -10.86
AS 2 Spring 247 -2.03 -8.27
AS 3 Spring 523 -3.40 -10.65
AS 4 Spring 698 -3.21 -11.21
AS 5 Spring 682 -3.13 -12.27
AS 6 Spring 737 -3.66 -13.89
AS 7 Spring 723 -3.17 -10.27
AS 8 Spring 276 -2.64 -8.02
AS 9 Spring 454 -3.38 -12.29
AB 1 Borehole 46 -3.24 -16.33
AB 2 Borehole 47 -3.59 -15.84
AB 3 Borehole 45 -3.41 -15.19
AB 4 Borehole 29 -3.43 -16.47
AB 5 Borehole 34 -3.46 -16.27
AB 6 Borehole 31 -3.43 -16.28
KB 1 Borehole 112 -2.70 -9.33
KB 2 Borehole 108 -2.30 -6.76
KB 3 Borehole 171 -2.78 -7.04
KB 4 Borehole 163 -3.14 -10.25
KB 5 Borehole 158 -3.06 -9.55
KB 6 Borehole 158 -2.07 -6.53
University of Ghana http://ugspace.ug.edu.ghUniversity of Ghana http://ugspace.ug.edu.gh

109
Appendix I: δ18
O and δ2H standard reference material
Standards δD‰ vs VSMOW δ18
O ‰ vs VSMOW
This work Certified
value
This work Certified
value
LS 2 -68.7 -68.78 -9.65 -9.6
LS 1 +2.15 +2.1 +0.16 +0.24
LS 3 -43.75 -43.67 -7.21 -7.56
University of Ghana http://ugspace.ug.edu.ghUniversity of Ghana http://ugspace.ug.edu.gh