CHEMICAL AND BIOLOGICAL INDICATORS OF … AND BIOLOGICAL INDICAT… · Clarks Fork are presented in...
6
A water-quality investigation of the Yellowstone River was conducted during low-flow conditions in August 2000, under the U.S. Geological Survey's National Water-Quality Assessment (NAWQA) program. Samples for analysis of water chemistry (nutrients, field measurements, and other constituents) and biological communities (periphyton, phytoplankton, and macroinvertebrates) were collected at 11 sites on the main stem of the Yellowstone River between Corwin Springs and Sidney, Montana, as well as from tributaries including the Clarks Fork of the Yellowstone River, the Bighorn River, and theTongue River. Preliminary results of the investigation indicate concentrations of total nitrogen varied little throughout the length of the main stem of the Yellowstone River; total phosphorus concentrations increased slightly in the down- stream direction. In contrast, periphyton chlorophyll a and ash-free dry mass concentrations, and algal productivity rates, were highest in the middle sections of the Yellowstone River. At low to moderate concentrations, algae are an integral part of a healthy stream ecosystem. Algae are single- celled plants that contain chlorophyll and carry out photosynthesis. The periphyton (algae attached to rocks, logs and submerged objects) and phytoplankton (sus- pended or floating algae) are primary producers in the aquatic food chain, and provide food and habitat for invertebrates and other organisms. During daylight, algae produce oxygen that is essential for aquatic life, sometimes causing the water to be supersaturated with oxygen. During the night, excessive algal growths can deplete dissolved-oxygen concentrations to levels lethal to fish, particularly trout, due to algal respiration and consumption of oxygen through decay of dead algal cells and other organic matter in the water. Respiration and decay of organic matter consume oxygen throughout the day and night, but are offset by photosynthesis during the daylight hours. Excessive growths of algae also can be aestheti- cally displeasing, as well as a nuisance for anglers, irrigators, and other water users. In response to nuisance growths of the green algae and dissolved-oxygen concentra- tions less than State of Montana standards, voluntary nutrient criteria were adopted in the Clark Fork basin of western Montana (tributary to the Columbia River) (Watson and others, 2000). The nutrient criteria from the Clarks Fork are presented in this paper as a point of reference, as are the ambient water-quality recommenda- tions issued by the U.S. Environmental Protection Agency (2000a) to help the states establish nutrient criteria for control of nuisance algal conditions. The EPA recommen- dations for concentrations of two causal variables, Cladophora glomerata total U.S. Department of the Interior U.S. Geological Survey Water-Resources Investigations Report 01-4238 Cheyenne, Wyoming, 2001 View looking downstream in the Yellowstone River at Corwin Springs (site Y1) . (photo by Greg Boughton) CHEMICAL AND BIOLOGICAL INDICATORS OF NUTRIENT ENRICHMENT IN THE YELLOWSTONE RIVER BASIN, MONTANA AND WYOMING, AUGUST 2000: STUDY DESIGN AND PRELIMINARY RESULTS OVERVIEW Background 1
Transcript of CHEMICAL AND BIOLOGICAL INDICATORS OF … AND BIOLOGICAL INDICAT… · Clarks Fork are presented in...

A water-quality investigation of the Yellowstone Riverwas conducted during low-flow conditions in August 2000,under the U.S. Geological Survey's National Water-QualityAssessment (NAWQA) program. Samples for analysis ofwater chemistry (nutrients, field measurements, and otherconstituents) and biological communities (periphyton,phytoplankton, and macroinvertebrates) were collected at11 sites on the main stem of the Yellowstone Riverbetween Corwin Springs and Sidney, Montana, as well asfrom tributaries including the Clarks Fork of theYellowstone River, the Bighorn River, and the TongueRiver.
Preliminary results of the investigation indicateconcentrations of total nitrogen varied little throughout thelength of the main stem of the Yellowstone River; totalphosphorus concentrations increased slightly in the down-stream direction. In contrast, periphyton chlorophyll a andash-free dry mass concentrations, and algal productivityrates, were highest in the middle sections of theYellowstone River.
At low to moderate concentrations, algae are an integralpart of a healthy stream ecosystem. Algae are single-celled plants that contain chlorophyll and carry outphotosynthesis. The periphyton (algae attached to rocks,logs and submerged objects) and phytoplankton (sus-pended or floating algae) are primary producers in theaquatic food chain, and provide food and habitat forinvertebrates and other organisms. During daylight, algaeproduce oxygen that is essential for aquatic life, sometimescausing the water to be supersaturated with oxygen.During the night, excessive algal growths can depletedissolved-oxygen concentrations to levels lethal to fish,
particularly trout, due to algal respiration and consumptionof oxygen through decay of dead algal cells and otherorganic matter in the water. Respiration and decay oforganic matter consume oxygen throughout the day andnight, but are offset by photosynthesis during the daylighthours. Excessive growths of algae also can be aestheti-cally displeasing, as well as a nuisance for anglers,irrigators, and other water users.
In response to nuisance growths of the green algaeand dissolved-oxygen concentra-
tions less than State of Montana standards, voluntarynutrient criteria were adopted in the Clark Fork basin ofwestern Montana (tributary to the Columbia River)(Watson and others, 2000). The nutrient criteria from theClarks Fork are presented in this paper as a point ofreference, as are the ambient water-quality recommenda-tions issued by the U.S. Environmental Protection Agency(2000a) to help the states establish nutrient criteria forcontrol of nuisance algal conditions. The EPA recommen-dations for concentrations of two causal variables,
Cladophora glomerata
total
U.S. Department of the Interior
U.S. Geological Survey
Water-Resources Investigations Report 01-4238
Cheyenne, Wyoming, 2001
View looking downstream in the Yellowstone River at
Corwin Springs (site Y1) .(photo by Greg Boughton)
CHEMICAL AND BIOLOGICAL INDICATORS OF NUTRIENT ENRICHMENT IN THE
YELLOWSTONE RIVER BASIN, MONTANA AND WYOMING, AUGUST 2000:
STUDY DESIGN AND PRELIMINARY RESULTS
OVERVIEW
Background
1
nitrogen and total phosphorus, and two response variables,, are based on ecoregions
(Omernik, 1996) to account for natural variations in waterquality; ecoregions for the Yellowstone River Basin inMontana are shown in figure 1. Nitrogen and phosphorusare considered causal variables because limited supply ofeither phosphorus or nitrogen, or both, can hinder algalgrowth, and excess supply of either nutrient, or both, canresult in excessive algal growth. The response
chlorophyll a and turbidity
chlorophyll a and turbidityvariables
are considered potentialindicators of excessive algal growth. Chlorophyll a is ameasure of algal biomass or standing crop. Turbidity is ameasurement of light penetration through a water sample,and is influenced by phytoplankton, inorganic particlessuch as clay and silt, and other materials such as dissolvedorganic matter.
The U.S. Geological Survey is conducting variousstudies in the Yellowstone River basin under the NAWQA
program (Miller and Quinn, 1997, and. The purpose of
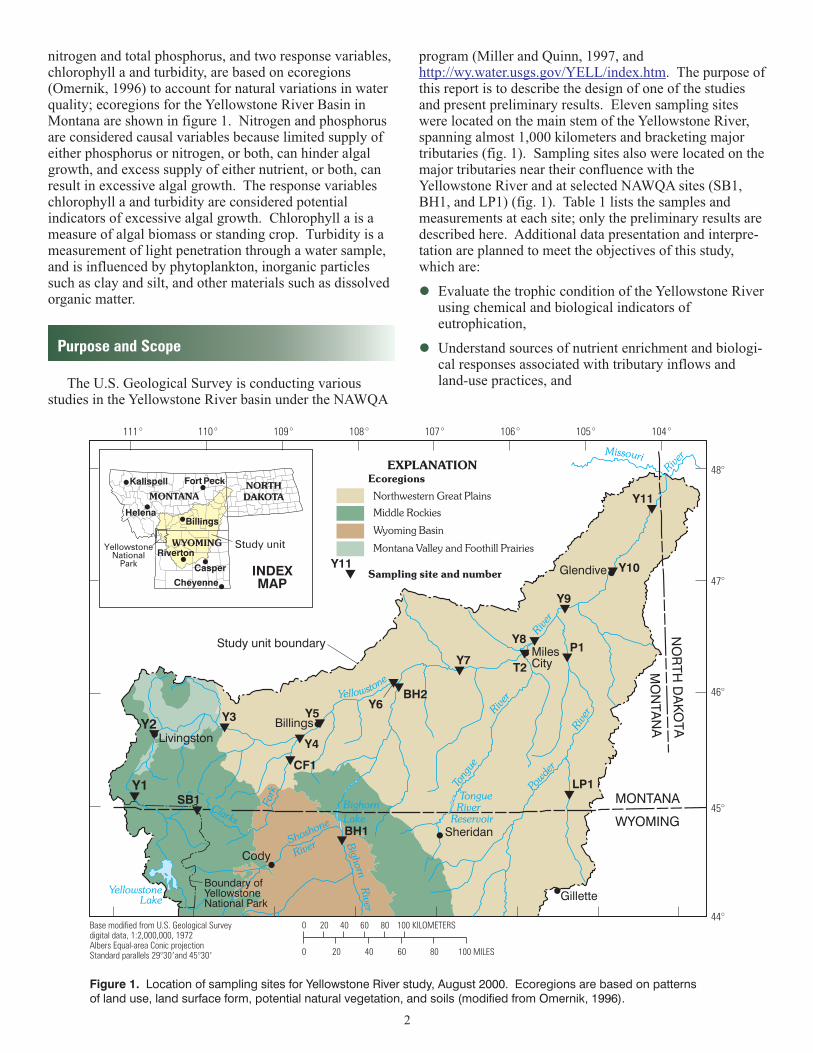
this report is to describe the design of one of the studiesand present preliminary results. Eleven sampling siteswere located on the main stem of the Yellowstone River,spanning almost 1,000 kilometers and bracketing majortributaries (fig. 1). Sampling sites also were located on themajor tributaries near their confluence with theYellowstone River and at selected NAWQA sites (SB1,BH1, and LP1) (fig. 1). Table 1 lists the samples andmeasurements at each site; only the preliminary results aredescribed here. Additional data presentation and interpre-tation are planned to meet the objectives of this study,which are:
Evaluate the trophic condition of the Yellowstone Riverusing chemical and biological indicators ofeutrophication,
Understand sources of nutrient enrichment and biologi-cal responses associated with tributary inflows andland-use practices, and
http://wy.water.usgs.gov/YELL/index.htm
�
�Purpose and Scope
Kalispell
Helena
Study unitYellowstoneNational
Park
Cheyenne
Riverton
Billings
Fort Peck
INDEXMAP
Casper
MONTANA
WYOMING
NORTH
DAKOTA
Sampling site and number
EXPLANATION
Northwestern Great Plains
Ecoregions
Middle Rockies
Wyoming Basin
Montana Valley and Foothill Prairies
111° 110° 109° 108° 107° 106° 105° 104°
48°
47°
46°
45°
44°
Figure 1. Location of sampling sites for Yellowstone River study, August 2000. Ecoregions are based on patterns
of land use, land surface form, potential natural vegetation, and soils (modified from Omernik, 1996).
100 MILES
20 40 60 80 100 KILOMETERS0
20 40 60 800
Base modified from U.S. Geological Surveydigital data, 1:2,000,000, 1972Albers Equal-area Conic projectionStandard parallels 29°30 and 45°30� �
Yellowstone
YellowstoneLake
Bighorn
Lake
TongueRiver
Reservoir
Riv
er
River
Missouri
Clarks
Riv
er
Bigh
orn
Tong
ue
Powde
r
River
Riv
er
Shoshone
River
Fork
Boundary ofYellowstoneNational Park
Study unit boundary
MONTANA
WYOMING
MO
NTA
NA
NO
RT
HD
AK
OTABillings
Glendive
Livingston
MilesCity
Sheridan
Cody
Gillette
Y11
Y11 Y10
Y9
Y7P1
Y8
T2
Y6BH2
Y5
Y4
BH1
LP1
CF1
SB1Y1
Y3Y2
2
� Compare biological indicators of river quality in 2000with those representing water-quality conditionspresent in the mid-1970s to determine whether anychanges have occurred in the trophic condition of theYellowstone River during the past few decades.
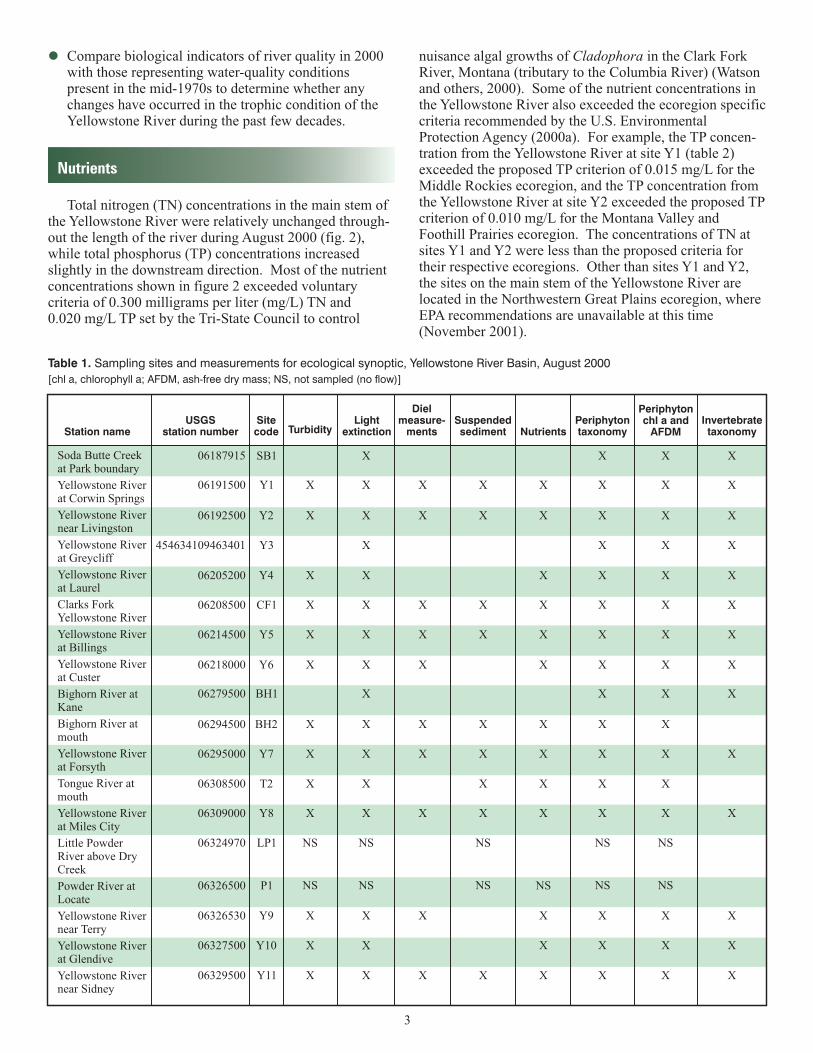
Total nitrogen (TN) concentrations in the main stem ofthe Yellowstone River were relatively unchanged through-out the length of the river during August 2000 (fig. 2),while total phosphorus (TP) concentrations increasedslightly in the downstream direction. Most of the nutrientconcentrations shown in figure 2 exceeded
of 0.300 milligrams per liter (mg/L) TN and0.020 mg/L TP set by the Tri-State Council to control
nuisance algal growths of in the Clark ForkRiver, Montana (tributary to the Columbia River) (Watsonand others, 2000). Some of the nutrient concentrations inthe Yellowstone River also exceeded the ecoregion specificcriteria recommended by the U.S. EnvironmentalProtection Agency (2000a). For example, the TP concen-tration from the Yellowstone River at site Y1 (table 2)exceeded the proposed TP criterion of 0.015 mg/L for theMiddle Rockies ecoregion, and the TP concentration fromthe Yellowstone River at site Y2 exceeded the proposed TPcriterion of 0.010 mg/L for the Montana Valley andFoothill Prairies ecoregion. The concentrations of TN atsites Y1 and Y2 were less than the proposed criteria fortheir respective ecoregions. Other than sites Y1 and Y2,the sites on the main stem of the Yellowstone River arelocated in the Northwestern Great Plains ecoregion, whereEPA recommendations are unavailable at this time(November 2001).
Cladophora
voluntarycriteria
3
Nutrients
Soda Butte Creekat Park boundary
Yellowstone Riverat Corwin Springs
Yellowstone Rivernear Livingston
Clarks ForkYellowstone River
Bighorn River atKane
Bighorn River atmouth
Tongue River atmouth
Little PowderRiver above DryCreek
Powder River atLocate
Yellowstone Riverat Greycliff
Yellowstone Riverat Laurel
Yellowstone Riverat Billings
Yellowstone Riverat Custer
Yellowstone Riverat Forsyth
Yellowstone Riverat Miles City
Yellowstone Rivernear Terry
Yellowstone Riverat Glendive
Yellowstone Rivernear Sidney
06187915
06191500
454634109463401
SB1
Y1
Y2
Y3
Y4
CF1
Y5
Y6
BH1
BH2
Y7
T2
Y8
LP1
P1
Y9
Y10
Y11
X
X
X
X
X
X
X
X
X
X
NS
NS
X
X
X
X
X
X
X
X
X
X
X
X
X
X
X
X
X
X
X
X
NS
NS
NS
NS
X
X
X
X
X
X
X
X
X
X
X
NS
X
X
X
X
X
X
X
X
X
X
X
X
X
X
X
X
X
X
X
X X
X
X
X
X
X
X
X
X X
X
X
X
X
NS
NS
X
X
X
X
X
X
X
X
X
X
X
X
X
X
X
X
X
X
X
X
X X
X
X
X
X
X
X
X
NS
NS
X
X
X
06205200
06208500
06214500
06218000
06279500
06294500
06295000
06308500
06309000
06324970
06326500
06326530
06327500
06329500
06192500
Table 1. Sampling sites and measurements for ecological synoptic, Yellowstone River Basin, August 2000
[chl a, chlorophyll a; AFDM, ash-free dry mass; NS, not sampled (no flow)]
Station nameUSGS
station numberSitecode Turbidity
Lightextinction
Suspendedsediment
Periphytontaxonomy
Invertebratetaxonomy
Periphytonchl a and
AFDMNutrients
Dielmeasure-
ments
Y1(CorwinSprings)
Y2 Y4 Y5(Billings)
Y6 Y7(Forsyth)
Y8 Y9 Y10 Y11(Sidney)
CF1 BH2 T2
Figure 2. Nutrient concentrations in the Yellowstone River and selected tributaries, August 2000. Voluntary criteria for control
of nuisance algal growths in the Clark Fork River, Montana (Watson and others, 2000) are shown for reference.
0
0.010
0.005
0.015
0.020
0.025
0.035
0.030
0.040
SITE
CO
NC
EN
TR
AT
ION
,IN
MIL
LG
RA
MS
PE
RLIT
ER
Total phosphorus
Total phosphorus
voluntary criterion
0
0.2
0.4
0.6
0.8
1.2
1.0
1.4
CO
NC
EN
TR
AT
ION
,IN
MIL
LG
RA
MS
PE
RLIT
ER
Total nitrogen
Total nitrogen voluntary criterion
Clarks ForkYellowstone River
enters
Bighorn Riverenters
0.305 0.016 1.5 1.4 25.0
1.23 0.095 66 18.3 50.9
0.260 0.020 2.8 38.6 18.9
MR
WB
Y1
MVFPY2
0.34 0.015 0.5 1.42 332
3320.30 0.010 1.0 21.08
0.368 0.022 4.2 1.782 43.92
1Proposed criteria from U.S. Environmental Protection Agency (2000a)Criterion for aggregate ecoregion is shown because specific criterion is not available.2
BH1
Table 2. Proposed algal-nutrient criteria for selected ecoregions in the Yellowstone River Basin
[mg/L, milligrams per liter; NTU, Nephelometric Turbidity Units; g/L, micrograms per liter; mg/m , milligrams per square meter;
MR, Middle Rockies; MVFP, Montana Valley and Foothill Prairies; WB, Wyoming Basin]
� 2
Site Ecoregion Aug. 2000 Aug. 2000 Aug. 2000 Aug. 2000 Aug. 2000
Total nitrogen (mg/L)Total phosphorus
(mg/L)Plankton
chlorophyll a ( g/L)�Periphyton
chlorophyll a (mg/m )2Turbidity (NTU)
Proposedcriterion
Proposedcriterion
Proposedcriterion
Proposedcriterion
Proposedcriterion
1 1 1 1 1
4

The standing crop of periphytonin the Yellowstone River, as indi-cated by chlorophyll a and ash-freedry mass (AFDM) concentrations(fig. 3), was highest in the middlesegments of the river near Billings(site Y5) and Forsyth (site Y7). Thepeaks in standing crop might be areflection of inflows from the ClarksFork Yellowstone River (site CF1),which joins the main stem betweensites Y4 and Y5, and the BighornRiver, which joins the main stembetween sites Y6 and Y7. Thefilamentous green algae
was noted during thesampling at many of the sites andwas particularly abundant at sites Y5,Y7, and CF1. The chlorophyllconcentration of 797 mg/m (milli-grams per square meter) in theYellowstone River at Billings(site Y5), 114 mg/m in the ClarksFork Yellowstone River (site CF1),and 164 mg/m in the Bighorn River(site BH2) were in the range of orexceeded the 100 to 200 mg/mchlorophyll a concentration sug-gested as an indicator of nuisancealgal conditions (U.S. EnvironmentalProtection Agency, 2000b).Periphyton chlorophyll a concentra-tions from sites Y1 and Y2 were lessthan the NutrientEcoregion II proposed criterion of33 mg/m (U.S. EnvironmentalProtection Agency, 2000a).
Nutrient Ecoregion II, theWestern Forested Mountains,contains the Middle Rockies, theMontana Valley and Foothill Prairies,and other level III ecoregions in thewestern United States.
minute intervals. The linear por-tions of the diel curves (for example,
Cladophoraglomerata
2
2
2
2
2
Aggregate
Aggregate
Algal productivity and respirationwere highest in the middle segmentsof the main stem Yellowstone River.Data sondes were deployed for about48 hours at selected sites to recorddissolved oxygen and pH at15-
Algal Productivity
Algal Standing Crop
Pmax
Rmax
Figure 5. Rates of dissolved oxygen production (P ) and respiration (R ),
August 2000.max max
-0.30
-0.10
-0.20
0.20
0.00
0.10
0.30
0.40
0.50
0.60
0.70
Y1(CorwinSprings)
Y2 Y5(Billings)
Y6 Y7(Forsyth)
Y8 Y9 Y11(Sidney)
SITE
CH
AN
GE
IND
ISS
OLV
ED
OX
YG
EN
,IN
GR
AM
SP
ER
CU
BIC
ME
TE
RP
ER
HO
UR
Pm
ax Rmax
Figure 4. Diel fluctuations in dissolved oxygen concentration and pH in the Yellowstone
River at Custer, site Y6, August 26-28, 2000 (P , dissolved oxygen production, R ,
respiration).max max
5
6
7
8
9
10
11
12
1600
1800
2400
1200
1800
2400
0600
1200
1800
2400
0600
TIME
DIS
SO
LV
ED
OX
YG
EN
,IN
MIL
LIG
RA
MS
PE
RLIT
ER
AN
Dp
H,
INS
TA
ND
AR
DU
NIT
S
pH
Aug. 26 Aug. 27 Aug. 28
Dissolved oxygen
Figure 3. Periphyton chlorophyll a (chl a) and ash-free dry mass (AFDM), August 2000.
1
10
100
1,000
Y1(CorwinSprings)
Y2 Y3 Y4 Y5(Billings)
Y6 Y7(Forsyth)
Y8 Y9 Y10 Y11(Sidney)
SITE
Clarks ForkYellowstone River
entersBighorn Riverenters
Ch
la,
INM
ILLIG
RA
MS
PE
RS
QU
AR
E
ME
TE
R,
AN
DA
FD
M,
ING
RA
MS
PE
R
SQ
UA
RE
ME
TE
RChl a
AFDM
5

fig. 4) were used to estimate P (the maximum rate ofproduction) and R (the maximum rate of respiration).The highest value for P in the Yellowstone River was0.61 grams O /cubic meter/hour at site Y5 in Billings(fig. 5). The R also was highest at site Y5 (fig. 5),consistent with the highest standing crop of periphyton.
Preliminary results indicate relatively high algalstanding crop and productivity in the middle segments ofthe Yellowstone River during August 2000. Those algalfactors appear to be uncorrelated to the total nitrogen andtotal phosphorus concentrations, indicating that the algalfactors provide a more sensitive measure of nutrient influxto the system than instantaneous sampling of total nutrientconcentrations in the water column, at least for thesnapshot provided by the August 2000 data. Additionalanalyses that may help to understand the trophic status andfunctioning of the river include evaluation of seasonalnutrient data, examination of algal and invertebratecommunity structure and autecology, and study of interre-lationships of those factors with other physical andchemical factors such as turbidity and suspended sediment.
max
max
max
2
max
Miller, Kirk, and Quinn, Tom, 1997, National Water-Quality Assessment Program, Yellowstone River Basin:U.S. Geological Survey, Fact Sheet 149-97, 4 p.
Omernik, J.M., 1996, Level III ecoregions of the continen-tal United States: Corvallis, Ore., U.S. EnvironmentalProtection Agency, digital map, scale 1:250,000.
U.S. Environmental Protection Agency, 2000a, NationalNutrient Criteria Development, accessed February2001, at URL
U.S. Environmental Protection Agency, 2000b, Nutrientcriteria technical guidance manual, rivers and streams:EPA-822-B-00-002, 152 p.
Watson, V. J., Ingman, Gary, and Anderson, Bruce, 2000,Clark Fork River: Scientific basis of a nutrient TMDLfor a river of the northern Rockies U.S.Environmental Protection Agency, 2000, Nutrientcriteria technical guidance manual, rivers and streams:EPA-822-B-00-002, p. A-19 to A-24.
in
.http://www.epa.gov/OST/standards/nutrient.html
By David A. Peterson, Stephen D. Porter,Layout and final illustrations by Suzanne C. Roberts
and S.M. Kinsey
U.S. Geological Survey, WRD2617 E. Lincolnway, Suite BCheyenne, Wyoming 82001-5662
Or visit our website at
For copies of this report or additional information, contact:
District Chief
Email:
http://wy.water.usgs.gov/ Printed on recycled paper
REFERENCES
Where Do We Go From Here?
Quiet water on the Yellowstone River below the mouth of the
Bighorn River.
6


![Untitled-1 [socialsecurity.gov.mt] · a letter (Social VLT indicat wate ... application pertaining to the energy benefit together with documentary evidence of income declarations](https://static.fdocuments.us/doc/165x107/5fa0b4bf2e5388030a4cd3f3/untitled-1-a-letter-social-vlt-indicat-wate-application-pertaining-to-the.jpg)