Chem. 231 – 2/11 Lecture
16
Chem. 231 – 2/11 Lecture
-
Upload
philana-candice -
Category
Documents
-
view
37 -
download
0
description
Chem. 231 – 2/11 Lecture. Announcements I. Return Homework Set 1 Quiz 1 Today (15 min.) New Homework Set (Set 2) Website Update Homework 1 Solutions Adding demonstration for HW2. Announcements II. Today’s Topics: Finish Extractions Quantitative calculations - PowerPoint PPT Presentation
Transcript of Chem. 231 – 2/11 Lecture
Chem. 231 – 2/11 Lecture

Announcements I
• Return Homework Set 1• Quiz 1 Today (15 min.)• New Homework Set (Set 2)• Website Update
– Homework 1 Solutions– Adding demonstration for HW2
Announcements II
• Today’s Topics:– Finish Extractions
• Quantitative calculations• How to determine if method is working and how to
improve methods
– Low Performance Chromatography• Lower pressure chromatography• Thin layer chromatography
– Quantitative Chromatography • Starting early• Focus today on integrating chromatograms

Simple ExtractionsCalculations for Liquid – Liquid
Extraction• For liquid-liquid extractions, partitioning between
two layers can be calculated:
– for unreactive compounds, Kp = [X]raffinate/[X]extractant
– k = nraf/nextr = Kp(Vraf/Vext)
– Q = fraction transferred to extractant phase– Q = 1/(1+k)– For weak acids/bases, we need to consider
that X can exist in two forms in aqueous layer (HA or A- for weak acids and B or BH+ for weak bases)
raffinate = original sample layer

Simple ExtractionsCalculations for Liquid – Liquid
Extraction• Sample Calculation for Butyric acid CH3(CH2)2CO2H with
KOW = 5.75 and Ka = 4.82.• Assuming an octanol raffinate phase, lets calculate
fraction extracted to an aqueous phase as a function of pH assuming 20 mL aqueous phase and 10 mL octanol
• KD = [HA]total aq/[HA]Octanol and Kp = 5.75• Ka = [H+][A-]/[HA] = 10-4.82 = 1.51 x 10⁻⁵
• Since Kp = [HA]Oct/[HA]aq and KD = [HA]Oct/([A-] + [HA])aq,KD/Kp = [HA]aq/([A-] + [HA]) = = nonionized fraction
= [HA]/([A-] + [HA]) = [HA]/(Ka[HA]/[H+]+ [HA]) = [H+]/(Ka+ [H+]) = f(pKa, pH) [note: different equation for weak bases]
• KD = Kp• k = Kp(Voct/Vaq)• Q = 1/(1 + k)• Go to Excel Demonstration

Simple ExtractionsCalculations for Liquid – Liquid
Extraction• For best separation, want high Q value for one
compound and low Q value for other compound• Go to 3-Mepyridine, 2-naphthaleneamine
separation
Simple ExtractionsCalculations for other methods (SPE)
• Not Quantitative (too many variables)• Can Make Predictions about Relative
Retention• Example: want to know if 2-
chlorophenol will be retained on SPE cartridge– If phenol has smaller KOW and has near
100% retention, 2-chlorophenol should also be retained

Simple ExtractionsTests
• Numerous losses are possible:– inefficient retention– inefficient sample transfers– inefficient removal of trapped
compounds
• Best strategy is to test recovery (and for each step if recovery is low)
• Small sample sizes and concentrations are challenging
Low Performance Chromatography
Lower Pressure Chromatography• Purpose of Separation
– Typically used for preparative chromatography– Commonly used when simple extractions don’t have sufficient
resolution (e.g. removal of desired product from reactants and distinctly different side reaction products)
• Equipment– packed columns (usually normal phase)– injection system or manual placement of sample– flow provided by low pressure pump, gravity or gas pressure
(Flash)– means for fraction collection more common than means for
detection
• Advantages/Disadvantages– better separation than simple methods and lower cost than HPLC– limited resolution is main disadvantage

Low Performance Chromatography
Thin Layer Chromatography• Purpose of Separation
– Typically used for fast qualitative analysis
– Can be used for initial method optimization or preparative separations
• Equipment– plate (typically normal
phase)– method to “spot” sample– solvent/container– visual detection or
fluorescent detection common
Chamber (solvent in base)
spots placed at base

Low Performance Chromatography
Thin Layer Chromatography• Advantages
– relatively fast (especially considering start up time)– low cost– simple detection– can run multiple samples in parallel– whole sample seen (whether doesn’t migrate or moves
with solvent)
• Disadvantages– not very quantitative– limited sample size– limited resolution– not as reproducible
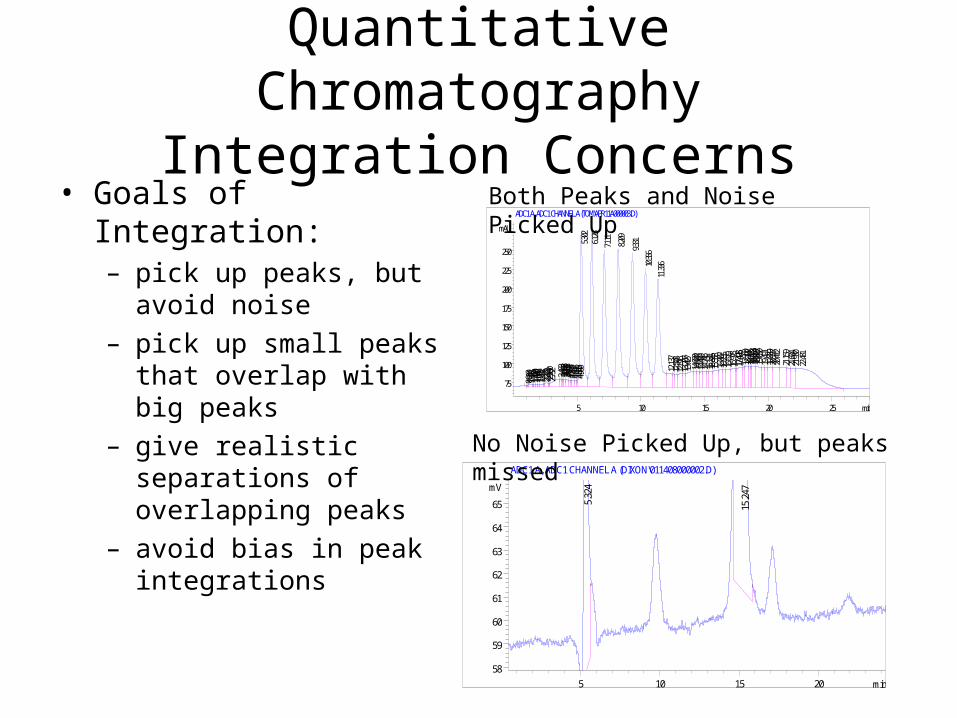
Quantitative ChromatographyIntegration Concerns
• Goals of Integration:– pick up peaks, but
avoid noise– pick up small peaks that
overlap with big peaks– give realistic
separations of overlapping peaks
– avoid bias in peak integrations
min5 10 15 20 25
mAU
75
100
125
150
175
200
225
250
ADC1 A, ADC1 CHANNEL A (TOM\APR11A000003.D)
0.91
0 1.
041
1.12
3 1.
410
1.49
0 1.
662
1.78
9 1.
951
2.27
3 2.
393
2.56
0 2.
752
3.48
3 3.
683
3.79
4 3.
881
3.95
5 4.
091
4.29
4 4.
457
4.59
6 4.
866
4.98
0 5.
302
6.12
6
7.11
1
8.20
9
9.33
1
10.35
6
11.33
6 12
.137
12.50
8 12
.816
13.20
7 13
.427
14.02
0 14
.183
14.48
9 14
.746
15.13
1 15
.315
15.55
8 16
.007
16.25
5 16
.619
16.97
8 17
.428
17.49
6 17
.968
18.12
7 18
.375
18.52
3 18
.654
18.82
2 19
.050
19.49
1 19
.889
20.13
7 20
.412
21.15
9 21
.604
21.93
0 22
.481
Both Peaks and Noise Picked Up
min5 10 15 20
mV
58
59
60
61
62
63
64
65
ADC1 A, ADC1 CHANNEL A (DIXON\011408000002.D)
5.3
24
15.
247
No Noise Picked Up, but peaks missed

Quantitative ChromatographyIntegration Concerns
• How to process collected chromatograms
• Shown for Agilent 1100 (Chemstation)
• Use Correct WindowView → Data Analysis
• Select your file– File → Load Signal
use “offline” version

Quantitative ChromatographyIntegration Concerns
• Picking up peaks vs. noise– Choose channel of interest and then go to Integration
Events to set “Slope Sensitivity” (may need to change peak width, peak area reject or peak height reject)
• Slope Sensitivity Set to 1• Slope Sensitivity Set to 15
min5 10 15 20 25
mAU
75
100
125
150
175
200
225
250
ADC1 A, ADC1 CHANNEL A (TOM\APR11A000003.D)
0.91
0 1.
041
1.12
3 1.
410
1.49
0 1.
662
1.78
9 1.
951
2.27
3 2.
393
2.56
0 2.
752
3.48
3 3.
683
3.79
4 3.
881
3.95
5 4.
091
4.29
4 4.
457
4.59
6 4.
866
4.98
0 5.
302
6.12
6
7.11
1
8.20
9
9.33
1
10.35
6
11.33
6 12
.137
12.50
8 12
.816
13.20
7 13
.427
14.02
0 14
.183
14.48
9 14
.746
15.13
1 15
.315
15.55
8 16
.007
16.25
5 16
.619
16.97
8 17
.428
17.49
6 17
.968
18.12
7 18
.375
18.52
3 18
.654
18.82
2 19
.050
19.49
1 19
.889
20.13
7 20
.412
21.15
9 21
.604
21.93
0 22
.481
min5 10 15 20 25
mAU
75
100
125
150
175
200
225
250
ADC1 A, ADC1 CHANNEL A (TOM\APR11A000003.D)
2.56
0
5.30
2 6.
126
7.11
1
8.20
9
9.33
1
10.35
6
11.33
6

Quantitative Chromatography
Integration Concerns• Picking up peaks vs. noise - more– May need to zoom in to “see” small peaks
• Slope Sensitivity too low• Improved Settings
– Last peak can be picked up, but at the expense of poor integration; better to just use manual integration
min5 10 15 20
mV
58
59
60
61
62
63
64
65
ADC1 A, ADC1 CHANNEL A (DIXON\011408000002.D)
5.3
24
15.
247
min2.5 5 7.5 10 12.5 15 17.5 20 22.5
mV
59
60
61
62
63
64
65
ADC1 A, ADC1 CHANNEL A (DIXON\011408000002.D)
5.32
4
9.76
4
15.24
7
17.09
2
min2.5 5 7.5 10 12.5 15 17.5 20 22.5
mV
59
60
61
62
63
64
65
66
ADC1 A, ADC1 CHANNEL A (DIXON\011408000002.D)
1.69
4 2.
150
2.35
4 2.
881
3.06
3 3.
287
3.83
0 4.
328
5.32
2
6.54
9 6.
702
6.94
9 7.
217
7.64
3
8.49
3 9.
034
9.77
0 10
.441
11.40
1 11
.613
11.82
0 12.36
4
13.23
6
15.24
4
16.41
8 17
.092
21.94
5
min12 14 16 18 20 22 24
mV
60
61
62
63
64
ADC1 A, ADC1 CHANNEL A (DIXON\011408000002.D)
15.24
7
17.08
6
Area:
33.14
71 21
.942
Area on diagonal indicates manual integration

Quantitative Chromatography
Integration Concerns• Other problems
– large solvent (especially GC) or unretained peaks– overlapping peaks
min2 4 6 8 10 12 14 16 18
mAU
200
250
300
350
400
ADC1 A, ADC1 CHANNEL A (TOM\AUG23A000001.D)
0.84
8 1.
046
1.50
0
2.22
4
3.33
4 3.
777
4.04
5 4.
329
4.69
1 5.
132
5.72
8 6.
185
6.80
0
7.46
2
8.21
8
9.06
6
10.02
6
11.09
6
12.36
0
13.58
5
18.71
8
Relatively good “auto” integration settings
however, some small peaks may have area overestimated
“Best” baseline between pink and black lines