
Cheesecake Factory Incorporated Annual Report 2020
90
Cheesecake Factory Annual Report 2020 Form 10-K (NASDAQ:CAKE) Published: March 12th, 2020 PDF generated by stocklight.com
Transcript of Cheesecake Factory Incorporated Annual Report 2020

Cheesecake Factory Annual Report 2020Form 10-K (NASDAQ:CAKE)
Published: March 12th, 2020
PDF generated by stocklight.com

UNITED STATES SECURITIES AND EXCHANGE COMMISSIONWashington, D.C. 20549
FORM 10-K☒ ANNUAL REPORT PURSUANT TO SECTION 13 OR 15(d) OF THE SECURITIES EXCHANGE ACT OF
1934For the fiscal year ended December 31, 2019
or
☐ TRANSITION REPORT PURSUANT TO SECTION 13 OR 15(d) OF THE SECURITIES EXCHANGE ACTOF 1934
Commission File Number 0-20574
THE CHEESECAKE FACTORY INCORPORATED(Exact name of registrant as specified in its charter)
Delaware 51-0340466(State or other jurisdiction (I.R.S. Employer
of incorporation or organization) Identification No.)
26901 Malibu Hills RoadCalabasas Hills, California 91301
(Address of principal executive offices) (Zip Code)Registrant’s telephone number, including area code: (818) 871-3000
Securities registered pursuant to Section 12(b) of the Act:
Title of each class Trading Symbol Name of each exchange on which registeredCommon Stock, par value $.01 per share CAKE The Nasdaq Stock Market LLC (NASDAQ Global Select
Market)
Securities registered pursuant to Section 12(g) of the Act: None
Indicate by check mark if the registrant is a well-known seasoned issuer, as defined in Rule 405 of the Securities Act. Yes ☒ No ☐Indicate by check mark if the registrant is not required to file reports pursuant to Section 13 or Section 15(d) of the Act. Yes ☐ No ☒Indicate by check mark whether the registrant (1) has filed all reports required to be filed by Section 13 or 15(d) of the Securities Exchange Act of1934 during the preceding 12 months (or for such shorter period that the registrant was required to file such reports), and (2) has been subject to such filing requirements for the past 90 days. Yes ☒ No ☐Indicate by check mark whether the registrant has submitted electronically every Interactive Data File required to be submitted pursuant toRule 405 of Regulation S-T (§232.405 of this chapter) during the preceding 12 months (or for such shorter period that the registrant was required to submit such files). Yes ☒ No ☐Indicate by check mark whether the registrant is a large accelerated filer, an accelerated filer, a non-accelerated filer, a smaller reporting company,or an emerging growth company. See the definitions of “large accelerated filer,” “accelerated filer," “smaller reporting company ," and “emerginggrowth company” in Rule 12b-2 of the Exchange Act.
Large accelerated filer ☒ Accelerated filer ☐Non-accelerated filer ☐ Smaller reporting company ☐
Emerging growth company ☐If an emerging growth company, indicate by check mark if the registrant has elected not to use the extended transition period for complying withany new or revised financial accounting standards provided pursuant to Section 13(a) of the Exchange Act. ☐Indicate by check mark whether the registrant is a shell company (as defined in Rule 12b-2 of the Act). Yes ☐ No ☒
The aggregate market value of the voting stock held by non-affiliates of the registrant as of the last business day of the second fiscal quarter, July2, 2019, was $1,787,355,740 (based on the last reported sales on The Nasdaq Stock Market on that date).
As of February 21, 2020, 44,961,694 shares of the registrant’s Common Stock, $.01 par value per share, were outstanding.
DOCUMENTS INCORPORATED BY REFERENCE
Part III of this Form 10-K incorporates by reference information from the registrant’s proxy statement for the annual meeting of stockholdersexpected to be held on May 28, 2020.

THE CHEESECAKE FACTORY INCORPORATEDINDEX
Page
PART IItem 1. Business 2Item 1A. Risk Factors 15Item 1B. Unresolved Staff Comments 29Item 2. Properties 29Item 3. Legal Proceedings 30Item 4. Mine Safety Disclosures 30
PART IIItem 5. Market for Registrant’s Common Equity, Related Stockholder Matters and Issuer Purchases of Equity Securities 31Item 6. Selected Financial Data 33Item 7. Management’s Discussion and Analysis of Financial Condition and Results of Operations 34Item 7A. Quantitative and Qualitative Disclosures About Market Risk 44Item 8. Financial Statements and Supplementary Data 45Item 9. Changes in and Disagreements with Accountants on Accounting and Financial Disclosure 45Item 9A. Controls and Procedures 45Item 9B. Other Information 46
PART IIIItem 10. Directors, Executive Officers and Corporate Governance 47Item 11. Executive Compensation 47Item 12. Security Ownership of Certain Beneficial Owners and Management and Related Stockholder Matters 47Item 13. Certain Relationships and Related Transactions, and Director Independence 47Item 14. Principal Accounting Fees and Services 47
PART IVItem 15. Exhibits, Financial Statement Schedules 48Item 16. Form 10-K Summary 48

1
PART I
Forward-Looking Statements
Certain information included in this Form 10-K and other materials filed or to be filed by us with the Securities and ExchangeCommission (“SEC”), as well as information included in oral or written statements made by us or on our behalf, may contain forward-looking statements about our current and presently expected performance trends, growth plans, business goals and other matters.
These statements may be contained in our filings with the SEC, in our press releases, in other written communications, and inoral statements made by or with the approval of one of our authorized officers. These statements are forward-looking statements withinthe meaning of the Private Securities Litigation Reform Act of 1995, as codified in Section 27A of the Securities Act of 1933, asamended (the “Securities Act”), and Section 21E of the Securities Exchange Act of 1934, as amended (together with the Securities Act,the “Acts”). This includes, without limitation, financial guidance and projections and statements with respect to the acquisition of NorthItalia and Fox Restaurant Concepts LLC ("FRC") and expectations regarding accelerated and diversified revenue growth as a result ofthe acquisition of North Italia and FRC, as well as expectations of our future financial condition, results of operations, cash flows, plans,targets, goals, objectives, performance, growth potential, competitive position and business; and our ability to: leverage our competitivestrengths, including investing in or acquiring new restaurant concepts and expanding The Cheesecake Factory® brand to other retailopportunities; deliver comparable sales growth; provide a differentiated experience to customers; outperform the casual dining industryand increase our market share; leverage sales increases and manage flow through; manage cost pressures, including increasing wagerates, insurance costs and legal expenses, and stabilize margins; grow earnings; remain relevant to consumers; attract and retainqualified management and other staff; manage risks associated with the magnitude and complexity of regulations in the jurisdictionswhere our restaurants are located; increase shareholder value; find suitable sites and manage increasing construction costs; profitablyexpand our concepts domestically and in Canada, and work with our licensees to expand our concept internationally; support thegrowth of North Italia and other FRC restaurants; operate Social Monk Asian Kitchen; and utilize our capital effectively and continue toincrease cash dividends and repurchase our shares. These forward-looking statements may be affected by factors outside of ourcontrol including: the ability to achieve projected financial results; economic and political conditions that impact consumer confidenceand spending; impact of recently enacted tax reform; acceptance and success of The Cheesecake Factory in international markets;acceptance and success of North Italia and the FRC concepts, Social Monk Asian Kitchen and other concepts; the risks of doingbusiness abroad through Company-owned restaurants and/or licensees; foreign exchange rates, tariffs and cross border taxation;changes in unemployment rates; changes in laws impacting our business, including increases in minimum wages and benefit costs; theeconomic health of our landlords and other tenants in retail centers in which our restaurants are located; the economic health ofsuppliers, licensees, vendors and other third parties providing goods or services to us; adverse weather conditions in regions in whichour restaurants are located; factors that are under the control of government agencies, landlords and other third parties; the risk, costsand uncertainties associated with opening new restaurants; and other risks and uncertainties detailed from time to time in our filingswith the SEC. Such forward-looking statements include all other statements that are not historical facts, as well as statements that arepreceded by, followed by or that include words or phrases such as “believe,” “plan,” “will likely result,” “expect,” “intend,” “will continue,”“is anticipated,” “estimate,” “project,” “may,” “could,” “would,” “should” and similar expressions. These statements are based on ourcurrent expectations and involve risks and uncertainties which may cause results to differ materially from those set forth in suchstatements.
In connection with the “safe harbor” provisions of the Acts, we have identified and are disclosing important factors, risks anduncertainties that could cause our actual results to differ materially from those projected in forward-looking statements made by us, oron our behalf. (See Item 1A — Risk Factors.) These cautionary statements are to be used as a reference in connection with anyforward-looking statements. The factors, risks and uncertainties identified in these cautionary statements are in addition to thosecontained in any other cautionary statements, written or oral, which may be made or otherwise addressed in connection with a forward-looking statement or contained in any of our subsequent filings with the SEC. Because of these factors, risks and uncertainties, wecaution against placing undue reliance on forward-looking statements. Although we believe that the assumptions underlying forward-looking statements are currently reasonable, any of the assumptions could be incorrect or incomplete, and there can be no assurancethat forward-looking statements will prove to be accurate. Forward-looking statements speak only as of the date on which they aremade, and we undertake no obligation to publicly update or revise any forward-looking statements or to make any other forward-lookingstatements, whether as a result of new information, future events or otherwise, unless required to do so by law.

2
ITEM 1. BUSINESS
General
The Cheesecake Factory Incorporated is a leader in experiential dining. We are culinary forward and relentlessly focused onhospitality. We currently own and operate 294 restaurants throughout the United States and Canada under brands including TheCheesecake Factory(R), North Italia(R) and a collection within the Fox Restaurant Concepts ("FRC") subsidiary. Internationally, 26 TheCheesecake Factory(R) restaurants operate under licensing agreements. Our bakery division operates two facilities that producequality cheesecakes and other baked products for our restaurants, international licensees and third-party bakery customers.
Our business originated in 1972 when Oscar and Evelyn Overton founded a small bakery in the Los Angeles area. In 1978,their son, David Overton, our Chairman of the Board and Chief Executive Officer, led the creation and opening of the first TheCheesecake Factory restaurant in Beverly Hills, California. In 1992, the Company was incorporated in Delaware as The CheesecakeFactory Incorporated (referred to herein as the “Company” or as “we,” “us” and “our”) to consolidate the restaurant and bakerybusinesses of its predecessors operating under The Cheesecake Factory® mark. Our executive offices are located at 26901 MalibuHills Road, Calabasas Hills, California 91301, and our telephone number is (818) 871-3000.
We maintain a general website at www.thecheesecakefactory.com, as well as websites for our bakery and other subsidiaries,including www.northitalia.com and www.foxrc.com. Our annual reports on Form 10-K, quarterly reports on Form 10-Q, current reportson Form 8-K, all amendments to those reports and our proxy statements are available on our general website at no charge, as soon asreasonably practicable after these materials are filed with or furnished to the SEC. Our filings are also available on the SEC’s website atwww.sec.gov. The content of our website is not incorporated by reference into this Form 10-K.
On October 2, 2019, we completed the acquistion of North Italia and the remaining business of Fox Restaurant Concepts LLC("FRC"), including Flower Child and all other FRC brands (the "Acquisition"). The results of operations, financial position and cash flowsof the acquired businesses are included in our consolidated financial statements as of the acquisition date.
We utilize a 52/53-week fiscal year ending on the Tuesday closest to December 31 for financial reportingpurposes. Fiscal years 2019, 2018 and 2017 each consisted of 52 weeks and fiscal year 2020 will also consist of 52 weeks.
The Cheesecake Factory
The Cheesecake Factory restaurants strive to provide a distinctive, high-quality dining experience at moderate prices byoffering an extensive, innovative and evolving menu in an upscale casual, high-energy setting with attentive, efficient and friendlyservice. As a result, The Cheesecake Factory restaurants appeal to a diverse customer base across a broad demographic range. Ourextensive menu and strategic selection of locations enable us to compete for substantially all dining preferences and occasions, fromthe key lunch and dinner day parts to the mid-afternoon and late-night day parts, which are traditionally weaker times for most casualdining restaurants, as well as special occasion dining. The Cheesecake Factory restaurants are generally open seven days a week forlunch and dinner, and we offer additional menu items for weekend brunch. Most of our locations are closed on Thanksgiving andChristmas. All items on our menu, except alcoholic beverages, are available for off-premise consumption, which representedapproximately 16% of our restaurant sales for fiscal year 2019. We work with a third party to provide delivery service, which is nowavailable at nearly all of our restaurants. In addition, we offer online ordering for to-go sales at all of our domestic locations. All of ourrestaurants offer a full-service bar where our entire menu is served. Alcoholic beverage sales represented 12% of The CheesecakeFactory restaurant sales for fiscal year 2019.
The Cheesecake Factory menu features approximately 250 items, including items presented on supplemental menus, such asour SkinnyLicious® menu that offers innovative items at 590 calories or less. Our core menu offerings include appetizers, pizza,seafood, steaks, chicken, burgers, small plates, pastas, salads, sandwiches and omelettes, including “Super” food choices and aselection of gluten-free items. Examples of menu offerings include Chicken Madeira, Cajun Jambalaya Pasta, Thai Lettuce Wraps,Avocado Eggrolls, California Guacamole Salad and our Bacon-Bacon Cheeseburger.
Our ability to create, promote and attractively display our unique line of desserts is also important to the competitive positioningand financial success of our restaurants. We offer approximately 45 varieties of proprietary cheesecake and other desserts in ourrestaurants. Our brand identity and reputation for offering premium desserts results in a significant level of dessert sales, representingapproximately 16% of The Cheesecake Factory restaurant sales for fiscal year 2019.

3
Competitive Positioning
The restaurant industry is comprised of multiple segments, including fine dining, casual dining, fast casual and quick-service.The Cheesecake Factory restaurants operate in the upscale casual dining segment, which is differentiated by freshly prepared andinnovative food, flavorful recipes with creative presentations, unique restaurant layouts, eye-catching design elements and morepersonalized service. Upscale casual dining is positioned above core casual dining, with standards that are closer to fine dining. Webelieve that we are a leader in upscale casual dining given the historically high average sales per square foot of our restaurants ascompared to others in this segment.
The restaurant industry is highly competitive with respect to menu and food quality, service, access to qualified operationspersonnel, location, decor and value. We compete directly and indirectly for customer traffic with national and regional casual diningrestaurant chains, as well as independently-owned restaurants. In addition, we face competition for customer traffic from fast casualand quick-service restaurants, home delivery services, mobile food service, grocery stores and meal kits that are increasing the qualityand variety of their food products in response to customer demand. This increased competition, coupled with an oversupply ofrestaurants, has driven declines in casual dining industry comparable traffic in recent years. This backdrop has made it even morechallenging to improve customer traffic. We also compete with other restaurants and retail establishments for quality sites and qualifiedstaff and managers to operate our restaurants. (See Item 1A — Risk Factors — “Our inability to grow comparable restaurant salescould materially adversely affect our financial performance.”)
The key elements that drive our total customer experience and help position us from a competitive standpoint include thefollowing:
Extensive and Innovative Menu, Made Fresh from Scratch. Our restaurants offer one of the broadest menus in casual diningand feature a wide array of flavors with portions designed for sharing. In contrast to many restaurant chains, substantially all of ourmenu items, except those desserts produced at our bakery facilities, are prepared from scratch daily at our restaurants with high-quality,fresh ingredients using innovative and proprietary recipes. One of our competitive strengths is our ability to anticipate customerpreferences and adapt our expansive menu to the latest trends. We regularly update our ingredients and cooking methods, as well ascreate new menu items and new categories of food offerings at our restaurants, such as our SkinnyLicious® menu, “Super” foodselections and gluten-free choices, further enhancing the variety, quality and price points offered and keep our menu relevant to ourcustomers. All new menu items are selected based on anticipated sales popularity and profitability. We also regularly introduce new andinnovative cheesecakes and other baked desserts. In 2019, we launched the Pineapple Upside-Down Cheesecake in conjunction withNational Cheesecake Day.
We generally update The Cheesecake Factory menus twice each year and our philosophy is to use price increases to helpoffset key operating cost increases in a manner that balances protecting both our margins and customer traffic levels. We plan tocontinue targeting menu price increases of approximately 2% to 3% annually, utilizing a market-based strategy to help mitigate costpressure in higher-wage geographies, and expect near-term increases to be at the higher end of this range.
Value Proposition. We believe our restaurants are recognized by customers for offering value with a large variety of freshlyprepared menu items across a broad array of price points and generous portions at moderate prices. The average check for eachcustomer, including beverages and desserts, was approximately $23.50, $22.60 and $21.85 for fiscal 2019, 2018 and 2017,respectively.
Commitment to Excellent Service and Hospitality through the Selection, Training and Retention of High-quality Staff Members.Our mission is to “create an environment where absolute guest satisfaction is our highest priority.” We strive to consistently exceed theexpectations of our customers in all aspects of their experiences in our restaurants. One of the most important aspects of delivering aconsistent and dependable level of service is having a team of experienced managers who can successfully operate our high-volume,complex restaurants. Our recruitment, selection, training, retention and internal promotion programs are among the mostcomprehensive in the restaurant industry, helping us to attract and retain qualified staff members who are motivated to consistentlyprovide excellence in restauranteuring and customer hospitality. By providing extensive training, our goal is to encourage our staffmembers to develop a sense of personal commitment to our core values and culture of excellence. (See “Restaurant Operations,Management and Staffing” below.) Our commitment to people-focused programs and creating a great workplace for all of our staff andmanagers contributed to The Cheesecake Factory being named to Fortune magazine’s list of “100 Best Companies to Work For®” inFebruary 2020, for the seventh year in a row.

4
High-quality, High-Profile Restaurant Locations and Flexible Site Layouts. We target restaurant sites in high-quality, high-profilelocations with a balanced mix of retail shopping, entertainment, residences, tourism and businesses. We have the flexibility to designour restaurants to accommodate a wide array of urban and suburban site layouts, including multi-level locations. Our restaurantsfeature large, open dining areas, high ceilings where available and a contemporary kitchen design. The layouts are flexible, permittingtables and seats to be easily rearranged to accommodate small and large parties, thus permitting more effective utilization of seatingcapacity. Interior and exterior patio seating, either or both of which are available at approximately 95% of our restaurants, allow foradditional customer capacity at a comparatively low occupancy cost per seat. Exterior patio seating is generally available as weatherpermits. (See “New Restaurant Site Selection and Development” below.)
Distinctive Restaurant Design and Decor. We place significant emphasis on the contemporary interior design and decor of ourrestaurants, which create a high-energy ambiance in a casual setting and contribute to the distinctive dining experience enjoyed by ourcustomers. We have evolved our restaurants’ design over time to remain current while retaining a similar look and feel to our earlierrestaurants. Our restaurants feature large, open dining areas, and where feasible, both exterior and interior patios. We apply highstandards to the maintenance of our restaurants to keep them in “like new” condition.
Integration of our Bakery Operations. The primary role of our bakery operations is to produce innovative, high-qualitycheesecakes and other baked desserts for sale at The Cheesecake Factory restaurants and those of our international licensees, whichis important to our competitive positioning. Integration of this vital part of our brand gives us control over the creativity and quality of ourdesserts and is also more profitable than buying from a third party.
New Restaurant Site Selection and Development
The Cheesecake Factory concept has demonstrated success in a variety of layouts (e.g., single or multi-level and varyinginterior square feet), site locations (e.g., urban or suburban shopping malls, lifestyle centers, retail strip centers, office complexes,entertainment centers and urban street locations — either freestanding or in-line) and trade areas. Accordingly, we intend to continuedeveloping The Cheesecake Factory restaurants in high-quality, high-profile locations that meet our rigorous site standards. Weregularly negotiate leases for potential future locations and plan to open as many locations in any given year as there are sites availablethat meet our site selection criteria. It is difficult for us to precisely predict the timing of our new restaurant openings due to many factorsthat are outside of our control. (See Item 1A — Risk Factors — “Our inability to secure an adequate number of high-quality sites forfuture restaurant openings could adversely affect our ability to grow our business.”) We have the flexibility in our restaurant designs topenetrate a wide variety of markets across varying population densities in both existing and new markets. We continue to targetapproximately 300 Company-owned and operated The Cheesecake Factory restaurants domestically over time, as well as the potentialfor an additional eight to ten locations in Canada.
The locations of our restaurants are critical to our long-term success, and we devote significant time and resources to analyzingeach prospective site. We consider many factors when assessing the suitability of a site, including the demographics of the trade areasuch as average household income, and historical and anticipated population growth. Since our restaurants can be successfullyexecuted within a variety of site locations and layouts, we are highly flexible in choosing suitable locations. While there are commondecor elements within each of our restaurant sites, the designs are customized for the specifics of each location, including the buildingtype, square footage and layout of available space. Our existing restaurants range from 5,000 to 21,000 interior square feet, and weexpect the majority of our new restaurants to vary between 7,500 and 10,000 interior square feet, generally with additional exteriorand/or interior patio seating, selected appropriately for each market and specific site.
The relatively high sales productivity of our restaurants provides opportunities to obtain competitive leasing terms fromlandlords. Due to the flexible and customized nature of our restaurant operations and the complex design, construction and preopeningprocesses for each new location, our lease negotiation and restaurant development time frames vary. The development and openingprocess usually ranges from six to eighteen months, depending largely on the availability of the leased space we intend to occupy, andcan be subject to delays either due to factors outside of our control or to our selective timing of restaurant openings.
Unit Economics
The operation of high-quality restaurants in premier locations fitting our criteria contributes to the continuing customer appeal ofThe Cheesecake Factory. This popularity is reflected in our average sales per restaurant and per square foot, which are among thehighest of any publicly-held restaurant company.
5
Average sales per location for The Cheesecake Factory restaurants open for the full year were approximately $10.7 million,$10.7 million and $10.6 million for fiscal 2019, 2018 and 2017, respectively. Since each of our restaurants has a customized layout anddiffers in size, an effective method to measure the unit economics of our sites is by square foot. Average sales per productive squarefoot (defined as all interior square footage plus seasonally adjusted exterior patio square footage) for restaurants open for the full yearwere approximately $986, $978 and $962 for fiscal 2019, 2018 and 2017, respectively. Fluctuations in both average sales per locationand average sales per productive square foot generally track with comparable restaurant sales trends. (See Part II, Item 7,Management’s Discussion and Analysis of Financial Condition and Results of Operations for further discussion on comparablerestaurant sales.)
We currently lease all of our restaurant locations and utilize capital for leasehold improvements and furnishings, fixtures andequipment (“FF&E”) to build out our restaurant premises. Total costs are targeted at approximately $900 to $1,000 per interior squarefoot for The Cheesecake Factory restaurants. Our distinctive design and decor requires a higher investment per square foot than istypical for the casual dining industry. However, our restaurants have historically generated annual sales per square foot that are alsotypically higher than our competitors. The construction costs to build our restaurant premises vary depending on a number of factors,including geography, the complexity of our build-out, site characteristics, governmental fees and permits, labor and material conditionsin the local market, weather and the amount, if any, of construction contributions obtained from our landlords for structural additions andother leasehold improvements. These costs have trended higher over the past several years due primarily to wage inflation and theavailability of trade labor in certain geographies.
In selecting sites for our restaurants, an important objective is to earn an appropriate return on investment. We measurereturns using a cash-on-cash return on investment calculated by dividing restaurant-level margin (earnings before interest, taxes,depreciation and amortization and preopening costs) by our cash investment.
Our new restaurants typically open with initial sales volumes well in excess of their future run-rate levels. This initial“honeymoon” effect usually results from grand opening publicity and other customer awareness activities that generate higher thanusual customer traffic, particularly in new markets. During the three to six months following the opening of new restaurants, customertraffic generally settles into its normal pattern, resulting in sales volumes that gradually adjust downward to their post-opening run-ratelevel. Additionally, our new restaurants usually require a period of time after reaching normal traffic levels to achieve their targetedrestaurant-level operating margins due to cost of sales and labor inefficiencies commonly associated with new, highly complexrestaurants such as ours.
Restaurant Operations, Management and Staffing
Our ability to consistently execute a complex menu offering items prepared daily with high-quality, fresh ingredients in anupscale casual, high-volume dining environment is critical to our overall success. We employ detailed operating procedures, standards,controls, food line management systems and cooking methods and processes to accommodate our extensive menu and to drive salesproductivity. However, the successful day-to-day operation of our restaurants remains critically dependent on the ability, dedication andengagement of our General Managers (“GMs”), Executive Kitchen Managers (“EKMs”) and all other management and hourly staffmembers working at our restaurants. Competition among restaurant companies for qualified management and staff remains very high.(See Item 1A — Risk Factors — “If we are unable to successfully recruit and retain qualified restaurant management and operatingpersonnel in an increasingly competitive market, we may be unable to effectively operate and grow our business and revenues, whichcould materially adversely affect our financial performance.”)
We believe that the high average sales volumes and popularity of our restaurants allow us to attract and retain high-quality,experienced restaurant-level management and other operational personnel. Each restaurant is generally staffed with one GM, one EKMand an average of six to ten additional kitchen and front-of-the-house managers, depending on the size and sales volume of eachrestaurant. Our GMs and EKMs possess an average of more than ten years of experience with the Company. This tenure andknowledge drives our high productivity and contributes to our ability to deliver an exceptional customer experience. All newly-recruitedrestaurant managers complete an extensive training program during which they receive both classroom and on-the-job instruction inareas such as food quality and safety, customer service, financial management, staff relations and safely serving alcohol. Managerscontinue their development by participating in and completing a variety of training and development activities to assess and furtherdevelop their skills and knowledge necessary for upward progression through our management levels. Our GMs regularly meet toreceive hands-on training, share best practices and celebrate Company successes, all of which help to foster the unique culture of ourbrand.

6
Each restaurant GM reports to an Area Director of Operations (“ADO”) who supervises the operations of six to eight restaurantswithin a geographic area. In turn, each ADO reports to one of four Regional Vice Presidents of Restaurant Operations. Our EKMs reportto their GMs, but are also supervised by an Area Kitchen Operations Manager responsible for between eight and ten restaurants. Ourrestaurant field supervision organization also includes our Senior Vice President of Operations, Chief Culinary Officer, an operationsservices team and our performance development department who are collectively responsible for day-to-day operations, managing newrestaurant openings and training for all operational managers and staff.
To enable us to more effectively compete for, and retain, the highest quality restaurant management personnel, we offer aninnovative and comprehensive compensation program for our restaurant GMs and EKMs. Each participant receives a competitive basesalary and has the opportunity to earn a cash bonus based on quantitative restaurant performance metrics. GMs are also eligible to usea Company-leased vehicle. In addition, we provide a longer-term, equity incentive program to our GMs and EKMs based on theirextended service with us in their respective positions and their achievement of certain performance objectives. We believe that theseawards encourage our GMs and EKMs to think and act as business owners, assist in retention of restaurant management and align ourmanagers’ interests with those of our stockholders.
Our restaurant GMs are responsible for selecting and training hourly staff members for their respective restaurants. Eachrestaurant is staffed, on average, with approximately 170 hourly staff members. We require each hourly staff member to participate in aformal training program for his or her respective position in the restaurant, under the supervision of other experienced staff membersand restaurant management. We strive to foster enthusiasm and commitment in our staff members, and respect for one another,through daily staff meetings and dedicated time for training. We solicit suggestions concerning restaurant operations and other aspectsof our business through an annual engagement survey, GM and workgroup meetings, a website dedicated to receiving staff memberinput and other means, fostering a highly-engaged workforce.
Our commitment to people-focused programs and creating a great workplace for all of our staff and managers contributed toThe Cheesecake Factory being named to Fortune magazine’s list of the “100 Best Companies to Work For®” in February 2020, for theseventh year in a row. The list is published annually based on a culture review and surveys of current staff members to identify andrecognize companies that create positive work environments with high employee morale and fulfillment. In 2019, we were also namedto the Fortune “100 Best Workplaces for Women®,” “100 Best Workplaces for Diversity ®,” and “100 Best Workplaces for Millennials ®.”In addition, in February 2020 we received the Workplace Legacy Award from Black Box Intelligence/People Report, which recognizesleaders in the restaurant industry who have demonstrated a commitment to balancing people and profits. This is the fifth year in a rowthat the company received an award from Black Box.
Preopening Costs for New Restaurants
Due to the highly customized and operationally complex nature of our upscale, high-volume concept and the investment wemake in properly training our staff to operate our restaurants, our preopening process is more extensive, time consuming and costlythan that of many restaurant chains. Preopening costs for a typical restaurant in an established market average approximately $1.7million to $2.0 million and include all costs to relocate and compensate restaurant management staff members during the preopeningperiod, costs to recruit and train hourly restaurant staff members, and wages, travel and lodging costs for our opening training team andother support staff members. Also included are expenses for maintaining a roster of trained managers for pending openings, theassociated temporary housing and other costs necessary to relocate managers in alignment with future restaurant opening andoperating needs, and corporate travel and support activities.
Preopening costs can fluctuate significantly from period to period, based on the number and timing of restaurant openings andthe specific preopening costs incurred for each restaurant. Preopening costs vary by location depending on a number of factors,including the proximity of our existing restaurants, the size and physical layout of each location, the number of management and hourlystaff members required to operate each restaurant, the availability of qualified restaurant staff members, the cost of travel and lodgingfor different metropolitan areas, the timing of the restaurant opening and the extent of unexpected delays, if any, in obtaining finallicenses and permits to open the restaurant, which may also depend on our landlords obtaining their licenses and permits andcompleting their construction activities. Preopening costs are generally higher for larger restaurants and initial entry into new marketsand lower when we relocate a restaurant within its local market. We usually incur the most significant portion of preopening costs withinthe two months immediately preceding and the month of a restaurant’s opening. Preopening costs per restaurant will also depend onour ability to leverage planned management growth expenses.

7
Expansion of Licensed Locations
We currently have licensing agreements with three restaurant operators to develop and operate The Cheesecake Factory ®
brand restaurants in selected international markets. Our licensees invest their capital to build and operate the restaurants, and wereceive initial development fees, site and design fees and ongoing royalties based on our licensees’ restaurant sales. In addition, theselicensees purchase bakery products branded under The Cheesecake Factory® mark from us. We project each international licensedlocation to contribute approximately $0.01 in annual earnings per share (“EPS”), on average, once the location has been in operationfor a full year. As of March 11, 2020, our international licensees operated the following The Cheesecake Factory restaurants:
Licensee Location Restaurant Location # of RestaurantsKuwait (1) Bahrain 1
Kingdom of Saudi Arabia 4 Kuwait 3 Qatar 3 United Arab Emirates 6
Mexico (2) Mexico 5Hong Kong (3) Beijing 1
Hong Kong 1Macau 1Shanghai 1
Total 26
(1) This licensee, or its affiliates, also has the right to develop restaurants in Egypt, with the opportunity to expand the agreementto include Algeria, Hungary, Iraq, Libya, Morocco, Poland, Russia, Slovakia, The Czech Republic, Tunisia, Turkey and Ukraine.
(2) This licensee, or its affiliates, also has the right to develop restaurants in Chile, with the opportunity to expand the agreementto include Argentina, Brazil, Colombia and Peru.
(3) This licensee, or its affiliates, also has the right to develop restaurants in Taiwan, with the opportunity to expand the agreementto include Japan, South Korea, Malaysia, Singapore and Thailand.
Our corporate infrastructure includes a dedicated global development team that works with our international licensees andcoordinates the initial training, ongoing quality control, product specifications and brand oversight at our licensed locations. Our internalaudit department also performs periodic reviews of our international licensees’ compliance with our licensing agreements.
As we evaluate other international markets, we will consider opportunities to directly operate certain locations and/or enter intolicensing, joint venture or partnership arrangements with established third-party companies. We are selective in our assessment ofpotential partners and licensees, focusing on well-capitalized companies that have established business infrastructures, expertise inmultiple countries, experience in operating upscale casual dining restaurants and sound governance practices. We look to associatewith companies who will protect The Cheesecake Factory® brand and operate the concept in a high-quality, consistent manner.
Due to the complexities of opening The Cheesecake Factory restaurants in other countries, including, but not limited to, theselection and design of appropriate sites, construction of our complex restaurant designs, training of licensees’ staff members, approvalof supply sources and exportation of our bakery products to new countries, the number and timing of new openings in foreign countriesmay vary from expectations. (See Item 1A — Risk Factors — “We face a variety of risks and challenges related to our internationaloperations and global brand development efforts, any of which could materially adversely affect our financial performance.”)
Consumer Packaged Goods
Given the strong affinity for The Cheesecake Factory(R) brand, in 2017 we began leveraging opportunities in the consumerpackaged goods channel. We now partner with third-party manufacturers to offer a variety of products marketed under TheCheesecake Factory At Home(R) mark. These offerings include our Famous "Brown Bread," baking mixes and refrigerated puddingsavailable in retail stores nationwide, as well as ice cream which was recently launched. We are actively evaluating other synergistic, on-brand licensing opportunities to add incremental revenue streams to our business.

8
North Italia and Fox Restaurant Concepts
On October 2, 2019, we completed the acquisition of North Italia and the remaining business of Fox Restaurant Concepts,including Flower Child and all other FRC brands, which we expect will accelerate and diversify our revenue growth. North Italia and theFRC concepts are highly-differentiated and deliver unique customer experiences. With our aligned cultures and philosophies, webelieve these transactions are consistent with our long-term strategy of being a leader in experiential dining and provide a significantaccretive unit growth opportunity.
North Italia is a modern interpretation of Italian cooking in the upscale casual dining segment. Dishes are handmade fromscratch daily. The menu features appetizers, salads, fresh pastas, pizzas and entrees. Examples of menu offerings include WhiteTruffle Garlic Bread, Tuscan Kale Salad, Bolognese, Burrata Tortelloni, Margherita Pizza, Tuscan Half Chicken, Chicken Parmesanand Braised Short Rib. North Italia offers an assortment of wines, beers and house-made cocktails. Alcoholic beverage salesrepresented approximately 30% of North Italia sales for fiscal year 2019. North Italia restaurants are generally open seven days a weekfor lunch, dinner and weekend brunch. We see a number of potential synergistic attributes, including operations and real estatedevelopment, as well as significant market opportunity for an on-trend Italian offering. North Italia's operations have been relocated tothe Company's corporate headquarters to help scale the concept nationally.
With Italian cuisine the number one ethnic food category in the United States, coupled with strong national reception of theNorth Italia concept to-date, we believe there is potential for 200 domestic locations over time, which supports our plan forapproximately 20% annual unit growth. We target an average unit size of approximately 5,000 to 6,500 square feet. Average sales perlocation for North Italia restaurants is approximately $7 million, or approximately $1,200 per square foot, utilizing sales since theAcquisition on an annualized basis.
FRC operates as an independent subsidiary in Phoenix, Arizona. Its concepts are diverse in industry segment, occasions,square footage and geography. FRC's largest concept, Flower Child, operates in the fast casual dining segment, offering acustomizable menu, made fresh from scratch, featuring locally-sourced, all-natural and organic ingredients. Flower Child is a potentialopportunity for us to diversify our portfolio in a strong and growing niche. Other FRC potential growth concepts include The Henry,Culinary Dropout and Blanco, which together with the othe FRC brands, serve as an ecosystem for talent, menu and designdevelopment.
We target approximately 20% annual unit growth for the aggregate portfolio, driven primarily by the anticipated growth of theFlower Child concept, complemented by additional market tests of the potential growth concepts. Unit sizes range from approximately3,500 to 15,000 square feet. The FRC restaurants generate sales of approximately $1,000 per square foot, on average, utilizing salessince the Acquisition on an annualized basis.
Bakery Operations
We own and operate two bakery production facilities, one in Calabasas Hills, California, and one in Rocky Mount, NorthCarolina. Our facility in California accommodates both production operations and corporate support personnel, while our facility in NorthCarolina houses production operations and a distribution center. In fiscal 2018, we completed an infrastructure modernization of ourCalifornia facility.
We produce approximately 70 varieties of proprietary cheesecakes and other baked desserts using high-quality ingredients forThe Cheesecake Factory and Grand Lux Cafe restaurants and for international licensees and third-party customers. Some of our mostpopular cheesecakes include the Original Cheesecake, Ultimate Red Velvet Cake CheesecakeTM, Godiva® Chocolate Cheesecake,Oreo® Dream Extreme Cheesecake and Pineapple Upside Down Cheesecake. Other popular baked desserts include Chocolate TowerTruffle CakeTM, Carrot Cake, Black-Out Cake and Lemoncello Cream Torte.
The primary role of our bakery operations is to produce innovative, high-quality cheesecakes and other baked desserts for saleat our restaurants and those of our international licensees. Integration of this vital part of our brand gives us control over the creativityand quality of our desserts and is also more profitable than buying from a third party.

9
We also leverage The Cheesecake Factory brand identity and utilize our bakery production capacity by selling cheesecakesand other baked products to external foodservice operators, retailers and distributors. Current large-account customers include retailand supermarkets, foodservice distributors and operators, a national retail bookstore, other restaurants and national warehouseclubs. We also currently sell a selection of our cakes online and in catalogs domestically through an agreement with an upscale retailer.Items produced for outside accounts are marketed under The Cheesecake Factory Bakery® and The Cheesecake Factory At Home ®
marks and other private labels and were previously marketed under The Cheesecake Factory® and The Dream Factory® marks.
We also sell baked goods internationally under The Cheesecake Factory Bakery®, The Cheesecake Factory At Home ®, TheCheesecake Factory® and The Dream Factory® marks and have entered over 30 countries with our brands. Offering our cheesecakesand other baked desserts internationally is important to our branding, creating awareness and driving demand, not only for bakeryproducts but for the international expansion of our restaurants.
Other Concepts
We also operate Grand Lux Cafe, RockSugar Southeast Asian Kitchen and Social Monk Asian Kitchen. At present, we have noplans to open additional locations of these concepts.
Grand Lux Cafe
Grand Lux Cafe is an upscale casual dining concept that offers globally-inspired cuisine with an ambiance of modernsophistication. Using fresh ingredients, the menu of approximately 175 items at Grand Lux Cafe offers classic American dishes andinternational favorites, including appetizers, pasta, seafood, steaks, chicken, burgers, salads, specialty items and desserts. Examples ofmenu offerings include our Cedar Planked B.B.Q Salmon, Buffalo Chicken Rolls and Shrimp Scampi. Each Grand Lux Cafe features anon-site bakery which produces a selection of signature desserts, and a full-service bar.
RockSugar Southeast Asian Kitchen
RockSugar Southeast Asian Kitchen features a Southeast Asian menu and design elements in an upscale casual diningsetting. RockSugar Southeast Asian Kitchen showcases the cuisines of Thailand, Vietnam, Malaysia, Singapore, Indonesia and Indiawith approximately 75 dishes served “family-style” to create an atmosphere that encourages sharing and conversation. Examples ofmenu offerings include Shaking Beef, Thai Basil Cashew Chicken, Ginger Fried Rice and Crispy Samosas. RockSugar SoutheastAsian Kitchen also features a full-service bar with an extensive wine list and exotic cocktails and offers freshly-made desserts thatinfuse traditional French flair into nearly a dozen Asian-influenced items.
Social Monk Asian Kitchen
In February 2019, we opened the first location of Social Monk Asian Kitchen, a fast casual Asian concept with a modern urbanfeel. The menu features the cuisines of Thailand, Vietnam, Malaysia, Singapore, China, Indonesia and India in made-to-order starters,salads, soups, sandwiches, rice and noodle bowls, classic entrees, vegetables and sides and house-made frozen custard. Therestaurant also offers beer and wine. Examples of menu offerings include Crisp Vegetable Spring Rolls, Asian Chicken Salad, ThaiBasil Cashew Chicken, Shaking Beef and Dan Dan Noodles.
Purchasing and Distribution
We strive to obtain quality menu ingredients, bakery raw materials and other supplies and services for our operations fromreliable sources at competitive prices and consistent with our sustainability goals. We continually research and evaluate variousingredients and products in an effort to maintain high quality, be responsive to changing consumer tastes and manage costs.
In order to maximize purchasing efficiencies and to provide the freshest ingredients for our menu items while obtainingcompetitive prices for the required quality and consistency, each restaurant’s management determines the quantities of food andsupplies required for their restaurant and orders the items from local, regional and national suppliers based upon specificationsdetermined and terms negotiated at a corporate level. We strive to maintain restaurant-level inventories at a minimum dollar level inrelation to sales due to the high concentration and relatively rapid turnover of the perishable produce, poultry, meat, fish and dairycommodities that we use in our operations, coupled with the limited storage space at our restaurants. Independent foodservicedistributors, including the largest foodservice distributor in North America, deliver most items multiple times per week to our restaurants.

10
We purchase food and other commodities for use in our operations, based on market prices established with our suppliers.Many of the commodities purchased by us can be subject to volatility due to market supply and demand factors outside of our control.We mitigate the risk of supply shortages and obtain competitive prices by utilizing multiple qualified suppliers for substantially all ouringredients and supplies.
We negotiate short-term and long-term agreements for some of our principal commodity, supply and equipment requirements,such as certain dairy products and poultry, depending on market conditions and expected demand. We continue to evaluate thepossibility of entering into similar arrangements for other commodities and also periodically evaluate hedging vehicles, such as directfinancial instruments, to assist us in managing risk and variability associated with such commodities. As of the end of fiscal 2019, wehad no hedging contracts in place. We may or may not have the ability to increase menu prices or vary menu items in response to foodcommodity price increases. (See Item 1A — Risk Factors — “Our inability to anticipate and react effectively to changes in the costs ofkey operating resources may increase our cost of doing business, which could materially adversely affect our financial performance.”)
Information Technology
This information technology discussion relates to The Cheesecake Factory, North Italia, Grand Lux Cafe, RockSugarSoutheast Asian Kitchen and Social Monk Asian Kitchen restaurants. We are in the process of reviewing the information technologysystems and infrastructure for the FRC brands other than North Italia. Our technology-enabled business solutions are designed toprovide effective financial controls, cost management, improved efficiencies and enhanced customer experience. Our businessintelligence solution and data warehouse architecture provide corporate and restaurant management with information and insights intokey operational metrics and performance indicators. This framework delivers enterprise reporting, dashboards and analytics, and allowsaccess to metrics such as quote and wait time accuracy, staff member retention trends, and restaurant quality and service analyses.
Our restaurant point of sale and back-office systems provide information regarding daily sales, cash receipts, inventory, foodand beverage costs, labor costs and other controllable operating expenses. The Cheesecake Factory restaurants offer online orderingfor to-go sales, and the point of sale system is integrated with our delivery provider to drive efficiencies in the restaurants and enhancethe customer delivery experience. We utilize a customer satisfaction measurement platform that leverages the “Net Promoter Score”methodology at all of our restaurants. The data and analytics provided by this software provide us with actionable insights to betterunderstand what customer experience opportunities should be addressed, while reinforcing positive staff behaviors.
Our kitchen management system provides automated routing and cook line balancing, and synchronizes order completion,ticket time and cook time data, promoting more efficient levels of labor and productivity without sacrificing quality. We leverage ourrecipe viewer system to ensure timely and accurate recipe updates, and to provide instructional media content and detailed proceduresenabling our staff to consistently prepare our highly-complex, diverse menu across all locations. We utilize a web-based laborscheduling solution to enhance scheduling precision and staff satisfaction. We also employ a web-based notification and trackingsolution to contact our restaurants and monitor progress in the event of a needed product withdrawal or recall.
Restaurant hardware and software support is provided by both our internal support services team at our corporate center aswell as third-party vendors for remote and on-site restaurant support. Each restaurant has a private high-speed wide area connection tosend and receive critical business data as well as to access web-based applications securely as well as a failover capability whereby asecondary public circuit is used to automatically establish a secure connection to our private network if the primary connection becomesunavailable. We employ modern restaurant switching and routing technology that allows us to leverage and support contemporarysecurity standards and practices and employ wireless capability for a variety of mobile uses. All of our core and critical applications arehoused in an external tier 3 data center. To mitigate business interruptions, we utilize a disk-based data backup and replicationinfrastructure between our onsite and external data centers so all data is replicated nightly between the two sites.

11
We employ a multi-discipline security incident response plan to recognize, manage and resolve cybersecurity threats, andrequire cybersecurity awareness training for all staff members who have access to our cyber systems. We also maintain cyber riskinsurance coverage to further reduce our risk profile. Security of our financial data and other sensitive information remains a high priorityfor us, led by our information technology department in conjunction with an interdepartmental information security council representingall of our key functional areas. We utilize a private key infrastructure, ensuring only trusted devices can access our network and requiresecure sockets layer (SSL) certificates for access to sites outside our network. To further enhance our cybersecurity protection, weadded a third-party security operations center (SOC) provider to monitor and analyze internal network traffic for potential maliciouscontent. Also, in an effort to further secure our customers’ credit card information, we employ a robust encryption and tokenizationplatform for all credit card transactions in our restaurants, ensuring no credit card data is stored in our internal systems. This includesequipment that can also process smart payment cards, commonly referred to as EMV (Europay, Mastercard, Visa). (See Item 1A —Risk Factors — “Information technology system failures or breaches of our network security could interrupt our operations and subjectus to increased operating costs, as well as to litigation and other liabilities, any of which could materially adversely affect our financialperformance.”)
Marketing and Advertising
The Cheesecake Factory
We rely on our reputation, as well as our high-profile locations, media exposure and positive “word of mouth,” to maintain andgrow market share and historically have not used significant paid national advertising through television, radio or print, or use significantdiscounting. We utilize a social media and digital marketing strategy that allows us to engage regularly with our customers outside ofour restaurants, including communication and paid advertising on Facebook®, Instagram®, YouTube®, Twitter®, Snapchat®, Pinterest®
and other social media platforms, influencer marketing, Google search advertising and direct email to customers. In 2019, we tested atelevision commercial with a highly-targeted media buy, and we are considering additional targeted media buys in the future. (SeeItem 1A — Risk Factors — “Any inability to effectively use and manage social media could harm our marketing efforts as well as ourreputation, which could materially adversely affect our financial performance.”)
Public relations is another important aspect of our marketing approach, and we frequently appear on local and nationaltelevision in connection with a variety of promotional opportunities, such as National Cheesecake Day, to perform cookingdemonstrations and other brand-building exposure. We generated approximately 4.8 billion media impressions in fiscal 2019 at minimalcost to us. We partner with several premiere third-party gift card distributors, contributing to our brand awareness and gift cardsales. We also attempt to build awareness and relationships with retailers located in the same developments, shopping centeroperators, local hotel concierges, neighborhood groups and others in the community. For restaurants opening in new markets, we striveto obtain local television, radio station and newspaper coverage in order to benefit from publicity at low or no cost. At times, we alsoengage in marketing and advertising opportunities in selective local markets. In addition, we partner with our third-party deliveryprovider and consumer packaged goods licensees on co-branded marketing campaigns.
Our international licensees are committed to opening each new restaurant with marketing that can be comprised of a mix ofelements including print, billboards, digital and radio. We maintain final approval of our licensees’ marketing campaigns and socialmedia posts to promote consistency in the look and feel of marketing efforts including our brand, domestically and abroad.
North Italia and FRC
North Italia and FRC execute localized marketing programs focused on awareness, frequency and brand engagement througha variety of channels, including store-level marketing, public relations, in-store events, digital advertising, email programs and socialmedia. Each restaurant is positioned as an individual brand with a neighborhood connection. Additionally, the restaurant interiors andexteriors are utilized for brand engagement and messaging through art and graphics, creating an important part of a brand experiencefor the customer. We believe minimal discounts ensure compelling brand proposition for experience and value.

12
Seasonality and Quarterly Results
While seasonal fluctuations generally do not have a material impact on our quarterly results, year-over-year comparisons canbe significantly impacted by the number and timing of new restaurant openings and associated preopening costs, the timing of holidays,the impact from inclement weather, the additional week in a 53-week fiscal year, other variations in revenues and expenses and, in theperiod covered by this report, by the Acquisition in the fourth quarter of fiscal 2019. Because of these and other factors, our financialresults for any quarter are not necessarily indicative of the results that may be achieved for the full fiscal year.
Food Safety and Quality Assurance
Our food safety processes and systems are designed to mitigate the risk of contamination and illness and to ensure compliancewith regulatory requirements as well as industry standards. We continuously seek to improve our food safety and sanitation policies andprocedures. Our work and management processes are verified by routine restaurant management reviews, third-party health inspectionaudits and regulatory agency inspections. In addition, our bakery facilities are Safe Quality Food (SQF) certified in alignment with theGlobal Food Safety Initiative’s Global Markets Program.
The following discussion on suppliers and traceability applies to The Cheesecake Factory, Grand Lux Cafe, RockSugarSoutheast Asian Kitchen and Social Monk Asian Kitchen restaurants and to our bakeries. We are in the process of reviewing theseprocesses for the FRC brands. In selecting suppliers, we look for key performance indicators relating to sanitation, operations andfacility management, good manufacturing and agricultural practices, product protection, recovery and food security. In addition tomeasuring and testing food safety and security practices, we strive to ensure that all our food suppliers have annual food safety andquality system audits. Our restaurants and bakery facilities also follow regulatory guidelines required for conducting and managingingredient and product traceability. We utilize a web-based notification and tracking solution to efficiently contact our restaurants andmonitor our progress in the event of a product withdrawal or recall. (See Item 1A — Risk Factors — “Concerns relating to food safety,food-borne illness, pandemics and other diseases could reduce customer traffic to our restaurants, disrupt our food supply chain orcause us to be the target of litigation, which could materially adversely affect our financial performance.”)
Government Regulation
We are subject to numerous federal, state, local and foreign laws affecting our business. Each of our restaurants is subject tolicensing and regulation by a number of government authorities, which may include alcoholic beverage control, health, sanitation,environmental, labor, immigration, zoning and public safety agencies. We are also subject to various environmental regulations,including water usage, sanitation disposal and transportation mitigation.
Our international business exposes us to additional regulations, including antitrust and tax requirements, anti-boycottlegislation, import/export and customs regulations and other international trade regulations, privacy laws, the USA Patriot Act and theForeign Corrupt Practices Act.
As a provider of food products, we are subject to a comprehensive regulatory framework that governs the manufacture(including composition and ingredients), labeling, packaging and safety of food in the United States , including the Federal Food, Drugand Cosmetic Act, the Public Health Security and Bioterrorism Preparedness Response Act of 2002, the Federal Food SafetyModernization Act and regulations concerning nutritional labeling under the Patient Protection and Affordable Care Act of 2010. (SeeItem 1A — Risk Factors — “Our inability to respond appropriately to changes in consumer health and disclosure regulations, and toadapt to evolving consumer dining preferences could negatively impact our operations and competitive position, which could materiallyadversely affect our financial performance.”)
In order to serve alcoholic beverages in our restaurants, we must comply with alcoholic beverage control regulations whichrequire each of our restaurants to apply to a state or other governmental alcoholic beverage control authority for licenses and permits tosell alcoholic beverages on the premises. In addition, we are subject to dram shop statutes in most of the jurisdictions in which weoperate, which generally provide a person injured by an intoxicated person the right to recover damages from an establishment thatwrongfully served alcoholic beverages to the intoxicated person. To help mitigate this risk, we carry liquor liability coverage as part ofour existing comprehensive general liability insurance.

13
Various federal, state, local and foreign laws govern our operations and our relationships with our staff members, including suchmatters as minimum wages, breaks, scheduling, exempt classifications, equal pay, overtime, tip credits, fringe benefits, leaves, safety,working conditions, provision of health insurance and citizenship or work authorization requirements. In California, we are subject to thePrivate Attorneys General Act (“PAGA”) which authorizes employees to file lawsuits to recover civil penalties on behalf of themselves,other employees and the State of California for labor code violations. We must also comply with local, state and federal laws protectingthe right to equal employment opportunities and prohibiting discrimination and harassment in the work place. We have training andawareness programs in place for these areas and plan to further expand the curriculum in fiscal 2020. We are also subject to theregulations of the Department of Homeland Security, the U.S. Citizenship and Immigration Services and U.S. Immigration and CustomsEnforcement.
Our facilities must comply with applicable requirements of the Americans with Disabilities Act of 1990 (“ADA”) and relatedfederal, state and foreign statutes which prohibit discrimination on the basis of disability with respect to public accommodations andemployment. Under the ADA and related state and local laws, we take steps to make our new or significantly remodeled restaurants,our corporate and bakery facilities and our websites readily accessible to disabled persons. We make reasonable accommodations forthe employment of disabled persons as required by applicable laws.
A significant number of our hourly restaurant staff members receive income from gratuities. In the United States, many of ourlocations participate voluntarily in a Tip Reporting Alternative Commitment (“TRAC”) agreement with the Internal Revenue Service(“IRS”). By complying with the educational and other requirements of the TRAC agreement, we reduce the likelihood of potentialemployer-only FICA tax assessments for unreported or underreported tips.
We are subject to laws relating to information security, privacy, cashless payments and consumer credit, protection andfraud. An increasing number of governments and industry groups worldwide have established data privacy laws and standards for theprotection of personal information (including social security numbers), financial information (including credit card numbers) and healthinformation.
(See Item 1A — Risk Factors — “Changes in, or any failure to comply with, applicable laws or regulations could materiallyadversely affect our ability to operate our restaurants and/or increase our cost to do so, which could materially adversely affect ourfinancial performance.”)
Trade Names, Trademarks and Other Intellectual Property
We own various types of intellectual property and have applied to register trade names, logos, service marks, trademarks andcopyrights (collectively, “Intellectual Property”) in the United States, Canada and in additional countries throughout the world in variouscategories, including without limitation, restaurant services and bakery goods. We regard our Intellectual Property, including withoutlimitation “The Cheesecake Factory,” ”North Italia,” and a collection with the Fox Restaurant Concepts subsidiary, as well as our tradedress, as having substantial value and as being important to our marketing efforts. Our policy is to pursue registration of our importantIntellectual Property whenever commercially feasible and to vigorously oppose infringements of our Intellectual Property. The durationof Intellectual Property registrations varies from country to country, and we have not registered all of our trademarks in every country inwhich we now or in the future may do business. However, registrations of Intellectual Property are generally valid and may be renewedindefinitely as long as they are in use and/or their registrations are properly maintained. We have also registered various internetdomain names, including, without limitation, “www.thecheesecakefactory.com,” “northitaliarestaurants.com,” and “www.foxrc.com,” aswell as derivations of these and other domain names to include international country codes. (See Item 1A — Risk Factors — “Ourfailure to adequately protect our intellectual property could materially adversely affect our financial performance.”)
Charitable Giving
The Cheesecake Factory Oscar and Evelyn Overton Charitable Foundation (“Foundation”) was created as a means to giveback to the communities that our restaurants serve, as well as to unite our staff members in charitable causes. Since the inception of itsannual Invitational Charity Golf Tournament, the Foundation has raised $3.7 million, including $0.3 million in fiscal 2019, for the City ofHope Comprehensive Cancer Center, a leading research and treatment center for cancer, diabetes and other life-threatening diseasesin Southern California.
Our staff members volunteer their time to the Foundation to serve holiday meals to low-income individuals and families in 13Salvation Army centers across the United States at our annual Thanksgiving Day Feast. Additionally, the Foundation providessponsorships for teams of our staff members who work directly with non-profit organizations in their communities supporting a variety oflocal and national initiatives.

14
In addition to the efforts of the Foundation, the Company directly participates in a variety of charitable endeavors. Throughnationwide food donation programs, we regularly donate surplus food from our restaurants to local food rescue operations fordistribution to soup kitchens and shelters. Since the program’s inception in 2007, we have donated more than 5.2 million pounds offood, including approximately 470,000 pounds in fiscal 2019.
We also contribute to Feeding America ®, the nation’s largest domestic hunger-relief organization, through specially-designatedcheesecake sales, periodic meal donation campaigns in conjunction with our delivery provider and participation in Feeding America’sannual campaign to bring awareness to and help fight domestic hunger by donating peanut butter to local food banks. In fiscal 2019, wedonated $0.3 million to Feeding America through sales of our Pinapple Upside-Down cheesecake and Very Cherry Ghirardelli®cheesecake, bringing our total contributions to $4.9 million over the past twelve years. Nationwide in fiscal 2019, our staff memberscollected approximately 250,000 pounds of peanut butter for donation to Feeding America’s annual campaign.
Additionally, we partner with the California Community Foundation to provide a method for our staff members to assist otherstaff members in need through our The Cheesecake Factory “HELP” fund.
Sustainability
We strive to achieve excellence and quality in everything we do. As a part of this commitment, we continue to develop asustainability program that is aligned with our culture and values, is operationally feasible given the complexity of our restaurants and isfinancially responsible. We regularly examine all aspects of our business in an effort to identify, create and implement meaningful andsustained change.
For more information, please visit the “Sustainability” and “Sustainable Sourcing” pages on our website atwww.thecheesecakefactory.com. The contents of our website are not incorporated by reference into this Form 10-K.
Employees
As of December 31, 2019, we employed approximately 46,250 staff members, of which approximately 44,900 worked in ourrestaurants, approximately 700 worked in our bakery operations and approximately 650 worked in our corporate center, FRCheadquarters and restaurant field supervision organizations. Our staff members are not covered by any collective bargainingagreements, and we consider our relations with our staff members to be favorable. Our commitment to people-focused programs andcreating a great workplace for all our staff and managers contributed to The Cheesecake Factory being named to Fortune magazine’slist of “100 Best Companies to Work For®” in February 2020, for the seventh year in a row, among other human resources awards.
Executive Officers of the Registrant
David Overton, age 73, serves as our Chairman of the Board and Chief Executive Officer. Mr. Overton co-founded ourpredecessor company in 1972 with his parents, Oscar and Evelyn Overton. He is also a founding member and director of ourFoundation.
David M. Gordon, age 55, was appointed President of the Company in February 2013. Mr. Gordon joined our Company in 1993as a Manager and held operational positions, including General Manager, Area Director of Operations, Regional Vice President andChief Operating Officer prior to his appointment as President. He is also a director of our Foundation.
Matthew E. Clark, age 50, was appointed Executive Vice President and Chief Financial Officer in 2017. Mr. Clark joined ourCompany in 2006 as Vice President of Strategic Planning and most recently oversaw the strategy, financial planning, treasury and riskmanagement functions as Senior Vice President, Finance and Strategy. Earlier in his career, Mr. Clark held a number of financepositions of increasing responsibility at Groupe Danone, Kinko’s and The Walt Disney Company. He is also an advisory director of ourFoundation.
Keith T. Carango, age 58, serves as President of The Cheesecake Factory Bakery Incorporated, our bakery subsidiary.Mr. Carango joined our bakery operations in 1996 to lead manufacturing, and provide continuous improvement to the bakery operation.In his most recent role of Senior Vice President and Chief Operating Officer, he oversaw strategic planning, supply chain,manufacturing, distribution, human resources, quality assurance and finance. Prior to joining the Company, he held manufacturing andfinance roles at Frito-Lay, Inc. and Prince Foods.
15
Scarlett May, age 53, serves as our Executive Vice President, General Counsel and Secretary. Ms. May joined our Company in2018, from Brinker International, Inc., where she served as Senior Vice President, General Counsel and Secretary from 2014 to 2018.Prior to that, she was Senior Vice President, Chief Legal Officer and Secretary for Ruby Tuesday, Inc. following her earlier career inprivate practice.
ITEM 1A. RISK FACTORS
An investment in our common stock involves risks and uncertainties. In addition to the information contained elsewhere in thisAnnual Report on Form 10-K and other filings that we make with the SEC, you should carefully read and consider the risks describedbelow before making an investment decision. The occurrence of any of the following risks could materially harm our business, operatingresults, earnings per share, financial position, cash flows and/or the trading price of our common stock (individually and collectivelyreferred to as our “financial performance.”) In addition, our actual financial performance could vary materially from any resultsexpressed or implied by forward-looking statements contained in this report, in any of our other filings with the SEC and othercommunications by us, both written and oral, depending on a variety of factors, including the risks and uncertainties described below. Itis not possible for us to predict all possible risk factors or the impact these factors could have on us or the extent to which any onefactor, or combination of factors, may materially adversely affect our financial performance.
Risks Related to Our Financial Performance
The impact global and domestic economic conditions have on consumer discretionary spending could materially adverselyaffect our financial performance.
Dining out is a discretionary expenditure that historically has been influenced by domestic and global economic conditions.These conditions include, but may not be limited to: unemployment, general and industry-specific inflation, consumer confidence,consumer purchasing and saving habits, credit conditions, stock market performance, home values, population growth, householdincomes and tax policy. Material changes to governmental policy related to domestic and international fiscal concerns, and/or changesin central bank policies with respect to monetary policy, also could affect consumer discretionary spending. Any factor affectingconsumer discretionary spending may influence customer traffic in our restaurants and average check amount, thus potentially havinga material impact on our financial performance.
Our inability to grow comparable restaurant sales could materially adversely affect our financial performance.
We strive to increase comparable restaurant sales by improving customer traffic trends and growing average check. Changesin customer traffic and average check amount may be impacted by a variety of factors, including, without limitation: macroeconomicconditions that impact consumer discretionary spending; perception of our concepts’ offerings in terms of quality, price, value andservice; increased competition; changes in consumer eating habits; the evolving retail landscape, which is becoming increasinglyinfluenced by technology and a growing consumer preference for convenience, value and experience; adverse weather conditions;demographic, economic and other adverse changes in the trade areas in which our restaurants are located and changes in theregulatory environment.
We compete directly and indirectly for customer traffic with national and regional casual dining restaurant chains, as well asindependently-owned restaurants. In addition, we face competition for customer traffic from fast casual and quick-service restaurants,home delivery services, mobile food service, convenience stores, grocery stores and meal kits that are evolving the quality and varietyof their food products in response to customer demand. This increased competition, coupled with an oversupply of restaurants, hasdriven casual dining industry comparable traffic declines in recent years. This backdrop has made it even more challenging to improvecustomer traffic. We believe that many consumers remain focused on value and if our competitors, many of whom have significantlygreater resources to market aggressively to customers, are able to promote and deliver a higher degree of perceived value, ourcustomer traffic could suffer.
We utilize menu price increases to help offset inflation of key operating costs. However, our menu price increases may beinsufficient to entirely absorb or offset increased costs and, if not accepted by customers, menu price increases could result in reducedcustomer traffic.
Our menu mix could be materially adversely affected if our customers purchase fewer menu items or lower cost menu items inorder to reduce their spend. Unfavorable menu mix shifts could reduce average check amount, negatively impacting our ability to growcomparable restaurant sales.

16
We have generated a higher mix of sales from off-premise channels as a consumer preference for convenience has increased.More competition in these channels and any reduction in our ability to differentiate our concepts in these channels could negativelyimpact our comparable restaurant sales performance.
If our efforts to grow comparable restaurant sales are not successful, the effect, over time, would be to spread costs across alower level of sales, which could materially adversely affect our financial performance.
If we are unable to protect our reputation, the value of our brands and sales at our restaurants may be negatively impacted,which could materially adversely affect our financial performance.
Our greatest asset is the value of our brands, which is directly linked to our reputation. We must protect our reputation in orderto continue to be successful and to grow the value of our brands domestically and internationally.
Negative publicity directed at any of our brands, regardless of factual basis, such as relating to the quality of our restaurant foodor consumer packaged goods, restaurant facilities, customer complaints or litigation alleging injury or food-borne illnesses, foodtampering or contamination or poor health inspection scores, sanitary or other issues with respect to food processing by us or oursuppliers, the condition of our restaurants, labor relations, any failure to comply with applicable regulations or standards, allegations ofharassment, politically motivated accusations or other negative publicity, could damage our reputation. Any failure of our third-partydelivery provider to represent our brands well could damage our reputation. These concerns are exacerbated by the speed with whichnegative information may now be disseminated through social media. (See Item 1A — Risk Factors — “Any inability to effectively useand manage social media, could harm our marketing efforts as well as our reputation, which could materially adversely affect ourfinancial performance”). Negative publicity about us could harm our reputation and damage the value of our brands, which couldmaterially adversely affect our financial performance.
We are experiencing significant labor cost inflation. If we are unable to offset higher labor costs, our cost of doing businesswill significantly increase, which could materially adversely impact our financial performance.
Increases in minimum wages and minimum tip credit wages, extensions of personal and other leave policies, othergovernmental regulations affecting labor costs and a diminishing pool of potential staff members when the unemployment rate falls andlegal immigration is restricted, especially in certain localities, could significantly increase our labor costs and make it more difficult tofully staff our restaurants, either of which could materially adversely affect our financial performance.
We operate in many jurisdictions where the minimum wage, other mandated benefits and labor, wage and hour laws, requiresignificantly more from employers than what is required under United States federal requirements. Some jurisdictions allow tipped staffmembers to be paid a lower tip credit wage that is supplemented by gratuities paid by customers. Many jurisdictions, including theUnited States federal and state governments, either have or plan to significantly increase their minimum wage, tip credit wage and otherbenefits requirements. In addition to increasing the overall wages paid to our minimum wage and tip credit wage earners, theseincreases create pressure to increase wages and other benefits paid to other staff members who, in recognition of their tenure,performance, job responsibilities and other similar considerations, historically received a rate of pay exceeding the applicable minimumwage or minimum tip credit wage. Because we employ a large workforce, minimum wage and tip credit wage increases, as well asexpanding benefits mandates, have a particularly significant impact on our labor costs. Our vendors, contractors and business partnersare similarly impacted by wage and benefit cost inflation, and many have or will increase their price for goods, construction andservices in order to offset their increasing labor costs. We expect these trends will continue as minimum wages and minimum tip creditwages continue to rise and other benefits are mandated.
Our labor expenses include significant costs related to our self-insured health, pharmacy and dental benefit plans. Health carecosts continue to rise and are especially difficult to project. These costs include very expensive new specialty pharmaceutical products.Material increases in costs associated with medical claims, or an increase in the severity or frequency of such claims, may cause healthcare costs to vary substantially from quarter-to-quarter and year-over-year. We offer a variety of health plans to our staff members,including lower cost high deductible health plans, with an option for participants to contribute to a personal health savings account.However, given the unpredictable nature of actual health care claims trends, including the severity or frequency of claims, in anygiven year our health care costs could significantly exceed our estimates, which could materially adversely affect our financialperformance.

17
A great deal of uncertainty exists with respect to the future of the Patient Protection and Affordable Care Act as amended bythe Health Care and Education Affordability Reconciliation Act of 2010 (the “PPACA”) and such uncertainty makes planning difficult yearover year. Any significant changes to the healthcare insurance system, including a further dismantling of the PPACA in whole or in partand/or implementation of a supplementary and/or replacement healthcare insurance system, could impact our healthcare costs.Material increases in healthcare costs could materially adversely affect our financial performance.
While we try to offset labor cost increases through price increases, more efficient purchasing practices, productivityimprovements and greater economies of scale, there can be no assurance that these efforts will be successful. If we are unable toeffectively anticipate and respond to increased labor costs, our financial performance could be materially adversely affected.
Our inability to anticipate and react effectively to changes in the costs of key operating resources may increase our cost ofdoing business, which could materially adversely affect our financial performance.
We negotiate short-term and long-term agreements for some of our principal commodity, supply and equipment requirements,such as certain dairy products and poultry, depending on market conditions and expected demand. We continue to evaluate thepossibility of entering into similar arrangements for other commodities and also periodically evaluate hedging vehicles, such as directfinancial instruments, to assist us in managing risk and variability associated with such commodities. Although these vehicles may beavailable to us, as of the end of fiscal 2019, we had chosen not to enter into any hedging contracts due to pricing volatility, excessiverisk premiums, hedge inefficiencies or other factors. Commodities for which we have not entered into contracts can be subject tounforeseen supply and cost fluctuations, which at times may be significant. Additionally, the cost of commodities subject togovernmental regulation, such as dairy and corn, can be especially susceptible to price fluctuation. Commodities we purchase on theinternational market may be subject to even greater fluctuations in cost and availability, which could result from a variety of factors,including the value of the U.S. dollar relative to other currencies, international trade disputes, tariffs and varying global demand.
While we strive to engage in a competitive bidding process for our principal commodity, supply, service and equipmentrequirements, because certain of these products and services may only be available from a few vendors or service providers, we maynot always be able to do so. Because of this lack of competition, we may be vulnerable to excessive price demands, especially as theyrelate to the cost of products or services that are critical to our operations or profitability.
Certain products and ingredients commonly used in food preparation have recently come under scrutiny for possibly posingsocial and environmental risks, such as from an animal welfare and sustainability perspective. We have identified some of theseproducts and ingredients in our supply chain and have adopted a comprehensive Sustainable Sourcing Policy under which we committo a buying preference in our supply chain by 2025, or sooner where required, for products and ingredients that are sustainably grownand harvested and which do not have negative social impact, and for products from animals that are humanely raised and processed(“sustainable products”). While we are committed to implementing these changes in as timely and commercially feasible manner aspossible, there is a risk that some of our products or ingredients may become the subject of adverse media attention before we are ableto do so, regardless of factual basis. Additionally, while we make significant efforts to ensure we will have a sufficient ongoing supply ofsustainable products at a reasonable cost, since there is currently a smaller market for certain of these products, they may be especiallysusceptible to cost volatility and supply fluctuations. We cannot be certain that our supply and cost mitigation efforts or commitment topurchase sustainable products will be successful.
Our international licensees are also subject to commodity price fluctuations. While they too employ strategies to mitigate theimpact these fluctuations have on their business, neither we nor they can be assured such strategies will be successful. Commodityprice fluctuations could impede our international licensees’ profitability and hamper their ability to grow, which could negatively impactour ability to expand our brand internationally.
For all of these reasons, our financial performance could be materially adversely affected if we are unable to anticipate andeffectively respond to increases in our operating costs.

18
Our financial performance could be materially adversely affected if we fail to retain, or effectively respond to a loss of keyexecutives.
The success of our business continues to depend in critical respects on the contributions of David Overton, our founder,Chairman of the Board and Chief Executive Officer, and other senior executives of the Company. The departure of Mr. Overton or othersenior executives for any reason could have a material adverse effect on our business and long-term strategic plan. We have asuccession plan that includes short-term and long-term planning elements intended to allow us to successfully continue operationsshould any of our senior management become unavailable to serve in their respective roles. However, there is a risk that we may not beable to implement the succession plan successfully or in a timely manner or that the succession plan will not result in the samefinancial performance we currently achieve under the guidance of our existing executive team.
If we are unable to successfully recruit and retain qualified restaurant management and operating personnel in anincreasingly competitive market, we may be unable to effectively operate and grow our business and revenues, which couldmaterially adversely affect our financial performance.
We must continue to attract, retain and motivate a sufficient number of qualified management and operating personnel tomaintain consistency in the quality of our restaurants, both domestically and internationally. Qualified management and operatingpersonnel are currently in high demand. If we are unable to attract and retain qualified people, our restaurants could be short staffed,we may be forced to incur overtime expenses, and our ability to operate and expand our concepts effectively could be limited, any ofwhich could materially adversely affect our financial performance.
Concerns relating to food safety, food-borne illness, pandemics and other diseases could reduce customer traffic to our restaurants, disrupt our food supply chain or cause us to be the target of litigation, which could materially adversely affect our financial performance.
We face food safety risks, including the risk of food-borne illness and food contamination (including allergen crosscontamination), which are common both in the restaurant industry and the food supply chain. While we dedicate substantial resourcesand provide training to ensure the safety and quality of the food we serve, these risks cannot be completely eliminated. Additionally, werely on our network of suppliers to properly handle, store and transport our ingredients for delivery to our restaurants. Any failure by oursuppliers, or their suppliers, could cause our ingredients to be contaminated, which could be difficult to detect and put the safety of ourfood in jeopardy. We freshly prepare our menu items at our restaurants, which may put us at greater risk for food-borne illness and foodcontamination outbreaks than some of our competitors who use processed foods or commissaries to prepare their food. The risk offood-borne illness also may increase whenever our menu items are served outside of our control, such as by third-party food deliveryservices, customer take-out or at catered events.
Adverse publicity or news reports, regardless of accuracy, regarding food quality or safety issues, illness, injury, recalls, healthconcerns, government or industry findings concerning food products served by us or our licensees or delivered by a third-party for off-premises consumption, or issues stemming from the operation of our restaurants or bakeries, restaurants operated by our licensees,third parties with whom we may co-brand products or who sell or distribute our products, or third parties we may use to procurematerials used in our business or to deliver our products, or generally in the food supply chain, could be damaging to the restaurantindustry overall and specifically harm our brand and reputation, which in turn could materially adversely affect our financial performance.
The demand for and availability and price of certain food items may be adversely impacted if a pathogen, such as coronavirus,Ebola, “mad cow disease,” “SARS,” “swine flu,” avian influenza, norovirus or other virus or bacteria, such as salmonella or E.coli, or ifparasites or other toxins infect or are believed to have infected the food supply, including the food supply chain for our restaurants orbakery facilities. Additionally, customers may avoid our restaurants and/or it may become difficult to adequately staff our restaurants ifour customers or staff members become infected with a pathogen which was actually or claimed to be contracted at our restaurants.Any adverse food safety occurrence may result in litigation against us. Although we carry liability and other insurance coverage tomitigate costs we may incur as a result of these risks, not all risks of this nature are fully insurable and, even if insured, the negativepublicity associated with such an event could damage our reputation and materially adversely affect our financial performance.

19
In addition to selling products throughout the world through various distribution channels, including, without limitation,supermarkets, mass market retailers, club stores and various other food service and retail channels, our two bakery facilities are theonly sources of most of our baked desserts to our restaurants. If any of our bakery products becomes subject to a product recall ormarket withdrawal, whether voluntary or involuntary, our costs to conduct such recall or market withdrawal could be significant,restaurant sales as well as third-party sales of bakery product could be negatively impacted and our reputation could be damaged, anyof which could materially adversely affect our financial performance.
In addition, any adverse food safety event could result in mandatory or voluntary product withdrawals or recalls, regulatory andother investigations, and/or criminal fines and penalties, any of which could disrupt our operations, increase our costs, require us torespond to findings from regulatory agencies that may divert resources and assets, and result in potential civil fines and penalties aswell as other legal action, any of which could materially adversely affect our financial performance.
Information technology system failures or breaches of our network security could interrupt our operations and subject us toincreased operating costs, as well as to litigation and other liabilities, any of which could materially adversely affect ourfinancial performance.
We rely heavily on our in-restaurant and enterprise-wide computer systems and network infrastructure across our operations(“Cyber Environment”), which could be vulnerable to various risks. The efficient management of our operations depends upon our abilityto protect our Cyber Environment against damage from theft, casualties such as fire, power loss, telecommunications failure or othercatastrophic events, as well as from internal and external security breaches, denial of service attacks, viruses, worms, malware,breaches of the algorithms we and our third-party service providers use to encrypt and protect data, including customer transaction andcredit card data, and other malicious or disruptive events (collectively, “security incidents”). We employ both internal resources andexternal consultants to conduct auditing and testing for weaknesses in our Cyber Environment to reduce the likelihood of any securityincident. In addition, we developed a multi-discipline security incident response plan to help ensure that our executives are fully andaccurately informed and manage, with the help of content experts, the discovery, investigation and auditing of, and recovery from anysecurity incidents. However, we can provide no assurance that these measures will be successful in preventing a security incident ormitigating losses resulting from a security incident. We have and will continue to have greater uncertainty with respect to these risks asthey relate to our newly acquired concepts until we are able to complete a full review of their Cyber Environments and implement allidentified corrective measures.
Our international licensees have access to certain elements of our intellectual property within their Cyber Environment and maynot have developed adequate processes to secure their Cyber Environments against a security incident and may not maintain robustdiscovery, investigation, auditing or recovery protocols, or have the ability to promptly and effectively respond to a security incident.Available cyber-risk insurance coverage and policy limits may not adequately cover or compensate us in the event of a securityincident. Our financial performance could be materially adversely affected if our operations are interrupted by a security incident fromwhich we are not able to promptly and fully recover, if any cyber-risk insurance is unable to fully address our losses and/or if webecome subjected to litigation or regulatory action because of such an incident.
Our inability to maintain a secure environment for customers’ and staff members’ personal data could harm our reputationand result in litigation against us, which could materially adversely affect our financial performance.
We receive and maintain certain personal information about our customers and staff members. For example, we transmitconfidential credit card information in connection with credit card transactions, and we are required to collect and maintain certainpersonal information in connection with our employment practices, including the administration of our benefit plans. Our collection anduse of this information may be regulated by U.S. federal, state and local and foreign laws and regulations. If a security incident were tooccur involving loss of or inappropriate access to or dissemination of such personal information, we may become liable under applicablelaw for damages (including statutory damages) and incur penalties and other costs to remedy such an incident. Depending on the factsand circumstances of such an incident, these damages, penalties and costs could be significant and may not be covered by insuranceor could exceed our applicable insurance coverage limits. Such an event also could harm our reputation and result in litigation againstus. Any of these results could materially adversely affect our financial performance.

20
Our ability to accept credit cards as a form of payment depends on us remaining compliant with standards set by the PCISecurity Standards Council (PCI). These standards require certain levels of Cyber Environment security and procedures to protect ourcustomers’ credit card and other personal information. We continue to evaluate additional security enhancements and haveimplemented end-to-end encryption and tokenization technology at our The Cheesecake Factory, Grand Lux Cafe, Rock SugarSoutheast Asian Kitchen and Social Monk Asian Kitchen concepts as well as public key infrastructure that only permits knowncomputing assets access to our network and Intrusion Detection and Intrusion Prevention (IDS/IPS) that scans data in transit detectingand preventing the execution of harmful code. However, we can provide no assurance that our security measures will be successful inthe event of an attempted or actual security incident. If these security measures are not successful, we may become subject to litigationor the imposition of regulatory penalties, which could result in negative publicity and significantly harm our reputation, either of whichcould materially adversely affect our financial performance. We have and will continue to have greater uncertainty with respect to theserisks as they relate to our recently acquired restaurant concepts until we are able to complete a full review of their Cyber Environmentsand implement all identified corrective measures.
If any of our third-party vendors experiences a failure that affects a significant aspect of our business, we may be subject tocertain risks and may experience data loss, increased costs or other harm, any of which could materially adversely affect ourfinancial performance.
In order to leverage our internal resources and information technology infrastructure, and to support our business continuity anddisaster recovery planning efforts in the event of a physical loss or damage to our corporate facilities, we utilize third-party vendors toassist us with some of our essential business processes. For example, we rely on a network of third-party distribution warehouses todeliver ingredients and other materials to our restaurants. In some instances, these processes rely on technology and may beoutsourced to the vendor in their entirety and in other instances we utilize these vendors’ externally-hosted business applications.
We also utilize third parties to provide gift card distribution and transaction processing services and to perform food deliveryservices. We derive substantial revenue from these aspects of our business, which could suffer in the event of any factor that adverselyimpacts our vendors’ ability to provide such services. Such factors may include, without limitation, loss of, or significant change incontractual terms of, key vendor contracts, vendor or processor failures, technology failures, damage to the reputation of any keyvendor or other similar occurrences.
We continue to review options to expand the use of third-party providers in other areas. Our practice is to work with serviceproviders that are leading performers in their industries and with technology vendors that employ up to date and appropriate datasecurity practices and internal control practices. However, we cannot guarantee that failures will not occur. The failure of third-partyvendors to provide adequate services, including protection of sensitive data, could significantly harm our operations and reputation,which could materially adversely affect our financial performance.
Any failure to realize the anticipated benefits of our acquisition of North Italia and the remaining business of Fox RestaurantConcepts LLC could materially adversely affect our financial performance.
On October 2, 2019, we completed the acquisition of North Italia and the remaining business of Fox Restaurant Concepts LLC("FRC"), including Flower Child and all other FRC brands (the "Acquisition"). We have incurred and expect to continue to incursignificant costs in connection with the Acquisition, including accounting, legal and other fees and expenses. Further, the Acquisitionrequires us to pay contingent consideration and provide financing to FRC in an amount sufficient to support certain targets during thefive years after closing, in each case, subject to the satisfaction of certain conditions. In addition, we will incur substantial costs inconnection with integrating FRC's businesses with ours, and there can be no assurance that we will not incur a material amount ofunanticipated costs.
We acquired FRC's businesses with the expectation that the Acquisition will result in various benefits including, among others,business and growth opportunities and synergies in supply chain, real estate and other areas over time. However, even if we are able tosuccessfully integrate FRC's businesses with ours, there can be no assurances that we will realize some or all of the anticipatedbenefits of the Acquisitions, within the anticipated timeframes, if at all. We may experience increased competition that limits our ability toexpand our business, we may not be able to capitalize on expected business opportunities, and general industry and businessconditions may deteriorate. If any of these or other expected or unexpected factors limit our ability to achieve the anticipated benefits ofthe Acquisition, or if such business opportunities, growth prospects and synergies are not realized for any other reason, our financialperformance could be materially adversely affected.

21
We may incur additional costs if we are unable to renew our restaurant leases on similar terms and conditions, or at all, or torelocate our restaurants in certain trade areas, which could materially adversely affect our financial performance.
We currently lease all of our restaurant premises and, although we may consider other arrangements, we currently plan tocontinue to lease our restaurant locations in the future. Some of our leases have terms that will expire in the next few years andbeyond. Many of these leases include renewal options; some do not. While lease expirations allow us to opportunistically evaluate thepossibility of relocating certain restaurants to higher quality sites and trade areas over time, doing so may involve additional costs, suchas increased rent and other expenses related to renegotiating the terms of occupancy of an existing lease, and the costs to relocateand develop a replacement restaurant if we choose not to renew a lease, or are unable to do so, on favorable terms in a desirablelocation. In addition, we may elect to terminate certain leases prior to their expiration dates, and we may be unable to negotiatefavorable terms for such early terminations. Additional costs related to expiring restaurant lease terms, our inability to terminate certainrestaurant leases under favorable terms or the unavailability of suitable replacement locations could materially adversely affect ourfinancial performance.
Any inability to effectively use and manage social media could harm our marketing efforts as well as our reputation, whichcould materially adversely affect our financial performance.
Social media provides a powerful medium for consumers, staff members and others to communicate their approval of ordispleasure with a business. This aspect of social media is especially challenging because it allows any individual to reach a broadaudience with an ability to respond or react, in near real time, with comments that are often not filtered or checked for accuracy. If weare unable to quickly and effectively respond, any negative publicity could “go viral” causing nearly immediate and potentially significantharm to our brand and reputation, whether or not factually accurate.
Our marketing strategy includes an emphasis on social media. As social media continues to grow in popularity, many of ourcompetitors have expanded and improved their use of social media, making it more difficult for us to differentiate our social mediamessaging. As a result, we need to continuously innovate and develop our social media strategies.
If we do not appropriately use and manage our social media strategies, our marketing efforts in this area may not besuccessful, and any failure to effectively respond to negative or potentially damaging social media, whether accurate or not, coulddamage our reputation, which could materially adversely affect our financial performance.
Our failure to adequately protect our intellectual property could materially adversely affect our financial performance.
We own and have applied to register trade names, logos, service marks, trademarks, copyrights and other intellectual property(collectively, “Intellectual Property”), including The Cheesecake Factory®, North Italia®, a collection within the Fox RestaurantConcepts subsidiary and other trademarks related to our restaurant businesses in the United States and in additional countriesthroughout the world. Our Intellectual Property is valuable to our business and requires continuous monitoring to protect. We regularlyand systemically search for misappropriations of our Intellectual Property and seek to enforce our rights whenever appropriate to do so;however, we cannot be assured of success in every case and cannot possibly find all infringing uses of our Intellectual Property.Furthermore, we have not registered all of our Intellectual Property throughout the world, as doing so may not be feasible because ofassociated costs, various foreign trademark law prohibitions or registrations by others. Our failure or inability to protect our IntellectualProperty worldwide could limit our ability to globally expand our brand.
Our inability to effectively protect our Intellectual Property domestically or internationally could cause our customers to believelesser quality products or services are ours, may reduce the capacity of our Intellectual Property to uniquely identify our products andservices and/or may limit our ability to globally expand our brand, any of which could materially adversely affect our financialperformance.

22
We face a variety of risks and challenges related to our international operations and global brand development efforts, any ofwhich could materially adversely affect our financial performance.
International operations have a unique set of risks and challenges that differ from country to country, and can include, amongother risks, political instability, governmental corruption, social, religious and ethnic unrest, anti-American sentiment, delayed andpotentially less effective ability to respond to a crisis occurring internationally, changes in global economic conditions (such as currencyvaluation, disposable income, unemployment levels and increases in the prices of commodities and labor), the regulatory environment,immigration, labor and pension laws, income and other taxes, consumer preferences and practices, as well as changes in the laws andregulations governing foreign investment, joint ventures or licensing arrangements in countries where our restaurants or licensees arelocated and local import controls.
Operations at our international Company-owned (Canada) and licensed restaurants (Middle East, Mexico and Asia) may be negatively affected by factors outside of our control, including, but not limited to:
● difficulties in achieving the consistency of product quality and service as compared to restaurants we operate in the UnitedStates;
● changes to our recipes required by cultural norms;● inability to obtain, at a reasonable cost, adequate and reliable supplies of ingredients and products necessary to execute our
diverse menu;● availability of experienced management to operate international restaurants according to our domestic standards;● changes in economic conditions of our licensees, whether or not related to the operation of our restaurants;● differences, changes or uncertainties in economic, regulatory, legal, immigration, social, climatic, and political conditions,
including the possibility of terrorism, social unrest, trade embargos and/or trade restrictions, which may result in periodic orpermanent closure of foreign restaurants, affect our ability to supply our international restaurants with necessary supplies andingredients and affect international perception of our brand;
● inability of our licensees to locate profitable or suitable sites for development;● rising cost and scarcity of labor world-wide;● exchange rate fluctuations; and● currency fluctuations, trade restrictions, taxes or tariffs adversely affecting our or our licensees’ ability to import goods from the
United States and other parts of the world that are required for operating our branded restaurants, including our cakes whichare wholly manufactured in the United States.
Our international licensees are authorized to operate The Cheesecake Factory ® restaurant concept in licensed trade areasusing certain of our Intellectual Property, including our proprietary systems. We provide extensive and detailed training to our licenseesso their staff members may be able to effectively execute our operating processes and procedures and periodically audit theirperformance and adherence to our requirements. However, because we do not operate these restaurants directly, we can provide noassurance that our licensees will adhere to our operating standards to the same extent as we would.
If we or our licensees fail to effectively operate our international restaurants, or if we or they fail to receive an adequate returnon investment, and these difficulties are attributed to us or our brand, our reputation and brand value could be harmed, our revenuesfrom these restaurants could be diminished and our international growth may be slowed, any of which could materially adversely affectour financial performance.
In order to support our international expansion, our bakeries supply certain of our bakery products to our branded internationalrestaurants. In order to supply bakery products to restaurants in other countries, we may be required to adapt certain recipes toeliminate locally prohibited ingredients, comply with labeling requirements that differ from those in the United States and maintaincertifications required to export to such countries. In addition, unexpected events outside of our control, such as, without limitation, traderestrictions, import and export embargos, governmental shutdowns and disruptions in shipping, may affect our ability to transportadequate levels of our bakery products to our or our licensee’s international restaurants, for which we are the sole source of supply. Afailure to adequately supply bakery products to our or our licensee’s international restaurants could affect the customer experience atthose restaurants, resulting in decreased sales, and could, depending upon the reason for the failure, trigger contractual defaults on ourpart, any of which could materially adversely affect our financial performance.

23
As we continue to expand our brand internationally, we must comply with regulations and legal requirements, including thoserelated to immigration and the protection of our Intellectual Property. Additionally, we must comply with domestic laws affecting U.S.businesses that operate internationally, including the Foreign Corrupt Practices Act and anti-boycott laws, and with foreign laws in thecountries in which we expand our restaurants. (See Item 1A — Risk Factors — “Changes in, or any failure to comply with, applicable laws or regulations could materially adversely affect our ability to operate our restaurants and/or increase our cost to do so, which could materially adversely affect our financial performance.”) We may incur considerable liability in the event we or our licensees fail to comply with foreign or domestic laws relating to our or their operation of any international restaurant and can provide no assurance that our insurance programs or contractual indemnification rights would be effective to protect against such liabilities.
We may not be able to successfully integrate FRC’s businesses or any future business we may acquire with ours.
Combining independent companies with separate businesses, customers, employees, cultures and systems is a complex,costly and time-consuming process. We may experience material unanticipated difficulties or expenses in connection with theintegration of FRC’s businesses with ours, and this process may disrupt the business of either or both companies. In addition, we maypursue acquisitions of other businesses and assets. Some of the difficulties related to past and any future acquisitions could include:
● consolidating and retaining management and other key employees;● integrating information, communications and other systems;● integrating purchasing, logistics, marketing and administration methods;● integrating corporate and administrative infrastructures;● minimizing the diversion of management’s attention from ongoing business concerns; and● successfully managing and coordinating the growth of the combined company.
In addition, we may incur impairment charges if an acquired business does not meet the performance expectations upon whichthe acquisition price was based. Many of these factors are outside of our control and any one of them could result in increased costs,decreased revenues and diversion of management’s time and focus, which could materially adversely impact our business, financialcondition and operating results.
We may engage in expansion opportunities or other initiatives which may create risks to our business that could materiallyadversely affect our financial performance.
We may engage in other means to leverage our competitive strengths, including expansion of our brand to other retailopportunities and/or other initiatives. Many risks are inherent in any such development, investment arrangement, expansion of ourbrand or other initiative, including, without limitation:
● damaging our reputation if retail products bearing our brand are not of the same value and quality that our customers associatewith our brand;
● dilution of the goodwill associated with our brand as it become more common and increasingly accessible;● inaccurate assessment of value, growth potential, weaknesses, liabilities, contingent or otherwise, and expected profitability of
such ventures; and● diversion of management's attention and focus from existing operations to the expansion of our brand to non-restaurant items.
If we do not appropriately scale our infrastructure in a timely manner we may be unable to respond to and support ourdomestic or international opportunities for growth, which could materially adversely affect our financial performance.
We continually evaluate the appropriate level of infrastructure necessary to support our operational and development plans,including our domestic and international expansion. If market conditions improve and we are able to identify enough high-quality sites tosignificantly increase the planned number of new restaurant openings in the future, we may be unable to scale or manage the growth ofour corporate and field supervision infrastructure in the short term to appropriately support our expansion. Likewise, if sales decline, wemay be unable to reduce our infrastructure quickly enough to prevent sales deleveraging. Either circumstance could materiallyadversely affect our financial performance.

24
Our international license agreements require us to provide training and support to our licensees for their development andoperation of The Cheesecake Factory restaurants. We have dedicated certain corporate personnel to international development andcontinue to utilize the talents of existing management, as we grow our international licensing and operations infrastructure. In addition,one of the most important aspects of our restaurant operations is our ability to deliver dependable, quality service by experienced staffmembers who can execute our concepts according to our high standards. This may require training our licensees’ management in theUnited States and our licensees’ staff members in the licensed territories, as well as providing support in the selection and developmentof restaurant sites, product sourcing logistics, technological systems, menu modification and other areas. If, for any reason, we areunable to provide the appropriate level of infrastructure support to our international licensees, our licensee’s operations could suffer,which could make it more difficult for us to grow our brand internationally and materially adversely affect our financial performance.
We may be required to record impairment charges, be unable to fully recoup landlord improvement allowances and/or decideto discontinue operations at certain restaurants, any of which could materially adversely affect our financial performance.
We assess the potential impairment of our long-lived assets on an annual basis or whenever events or changes incircumstances indicate the carrying value of the assets or asset group may not be recoverable. Factors considered include, but are notlimited to, negative cash flow, significant underperformance relative to historical or projected future operating results, significantchanges in the manner in which an asset is being used, an expectation that an asset will be disposed of significantly before the end ofits previously estimated useful life and significant negative industry or economic trends. In addition, we may incur impairment charges ifan acquired business does not meet the performance expectations upon which the acquisition price was based. At any given time, wemay be monitoring certain locations, and future impairment charges and/or closures may occur if individual restaurant performancedoes not improve, which could materially adversely affect our financial performance.
We test our goodwill and other intangible assets for impairment annually or whenever events or changes in circumstancesindicate the carrying value may not be recoverable. Factors considered include, but are not limited to historical financial performance, asignificant decline in expected future cash flows, unanticipated competition, changes in management or key personnel, macroeconomicand industry conditions and the legal and regulatory environment. We cannot accurately predict the amount and timing of anyimpairment of assets. Should the value of goodwill or other intangible assets become impaired, there could be a material adverse affecton our financial performance.
A portion of our tenant allowances at certain premises may be subject to recoupment against percentage rent otherwisepayable for such sites. When we are unable to achieve sales in a sufficient amount to generate percentage rent obligations, we are notable to fully recoup available allowances at affected sites, which also could materially adversely affect our financial performance.
Our inability to secure an adequate number of high-quality sites for future restaurant openings could adversely affect ourability to grow our business.
Our ability to grow our business depends on the availability and selection of high-quality sites that meet our criteria. Thenumber and timing of new restaurants opened during any given period, and their associated contribution to the growth of our business,will depend on a number of factors including, but not limited to:
● unforeseen delays due to market conditions;● the identification and availability of high-quality locations;● an increase in competition for available premier locations;● the influence of consumer shopping trends on the availability of sites in traditional locations, such as premier shopping centers;● acceptable lease terms and the lease negotiation process;● the availability of suitable financing for our landlords;● the financial viability of our landlords;● timing of the delivery of the leased premises to us from our landlords in order to perform build-out construction activities;● the ability of our landlords and us to obtain all necessary governmental licenses and permits, and consents of third parties, on a
timely basis to construct and operate our restaurants;● our ability to successfully manage the complex design, construction and preopening processes for our highly customized
restaurants;● the availability and/or cost of raw materials and labor used in construction;● the availability of qualified tradespeople in the local market;● any unforeseen engineering or environmental problems with the leased premises; and● adverse weather or other delays during the construction period.

25
Changes in, or any failure to comply with, applicable laws or regulations could materially adversely affect our ability tooperate our restaurants and/or increase our cost to do so, which could materially adversely affect our financial performance.
We are required to comply with various federal, state and local and foreign laws and regulations, including, without limitation,those relating to alcoholic beverage control, public health and safety, access and use by the disabled, environmental hazards, labor andemployment, such as, equal wage laws and exempt versus non-exempt employee classifications, data security and food safety andlabeling. Changes to these laws or regulations may create challenges for us. While we subscribe to certain services and haveestablished procedures to identify legal and regulatory changes, we cannot be certain to identify and comply with every change on atimely basis. We may incur penalties and other costs, sanctions and adverse publicity by failing to comply with applicable laws, any ofwhich could materially adversely affect our financial performance.
Our failure to obtain and/or retain licenses, permits or other regulatory approvals required to operate our business could delayor prevent the opening and/or continued operation of any of our restaurants or bakeries, materially adversely affecting that facility’soperations and profitability and our ability to obtain similar licenses, permits or approvals elsewhere, any of which could materiallyadversely affect our financial performance.
In certain jurisdictions, we may be subject to “dram shop” statutes that generally allow a person injured by an intoxicatedperson the right to recover damages from an establishment that wrongfully served alcoholic beverages to the intoxicated person. Dramshop litigation may result in significant judgments, including punitive damages. A settlement or judgment against us under a dram shopstatute in excess of our general liability insurance coverage could materially adversely affect our financial performance.
Significant increases in minimum wages, including the tip credit wage in certain states, paid or unpaid leaves of absence, equalwage legislation, mandatory sick pay and paid time off regulations in a growing number of jurisdictions, mandated health and/orCOBRA benefits, or increased tax reporting, assessment or payment requirements related to our staff members who receive gratuities,or changes in interpretations of existing employment law, including with respect to classification of exempt versus non-exemptemployees, could significantly increase our labor costs, which would materially adversely affect our financial performance.
We are subject to federal and state laws that prohibit discrimination in the workplace and that set standards for the design,accessibility and operation of public facilities, such as the Americans with Disabilities Act. Compliance with these laws and regulationscan be costly and failure to comply could create exposure to government proceedings and litigation. Even a perceived failure to complycould result in negative publicity that could damage our reputation and materially adversely affect our financial performance. In addition,various federal, state and local and foreign labor laws and regulations govern our operations and relationships with our staff members,including, but not limited to, minimum wages, breaks, overtime, deductions, certain benefits (including health care benefits), safety,working conditions and citizenship and legal residency requirements. These requirements also extend to independent third-partyservice providers we engage to perform certain services at our restaurants. While we take precautions to ensure that our third-partyservice providers comply with applicable laws and to maintain an independent contractor relationship, we cannot be assured suchefforts will be successful, and we may incur liability vicariously as a joint employer for failures by our independent third-party serviceproviders to comply with applicable laws. Changes in, or any failure to comply with, these laws and regulations could subject us to finesor other legal actions, which could materially adversely affect our financial performance. Additionally, some jurisdiction includingCalifornia have introduced (or may be planning to introduce) legislation seeking to mandate an employment relationship betweencompanies that facilitate third-party delivery services and their service personnel. If these measures are successful, delivery costs willsignificantly increase and/or these companies may choose to no longer operate within such jurisdictions, either of which result couldsignificantly impede our ability to grow off-premises sales.
Despite our efforts to maintain compliance with legal requirements, including implementation of electronic verification of legalwork status, some of our staff members may not meet legal citizenship or residency requirements. In addition, immigration-relatedemployment regulations may make it more difficult for us to identify and hire qualified staff members. Our inability to maintain anexperienced and qualified work force comprised of individuals who meet all legal citizenship or residency requirements could result in adisruption in our work force, sanctions against us and adverse publicity, any of which could materially adversely affect our financialperformance.

26
Changes in tax laws and resulting regulations could result in changes to our tax provisions and expose us to additional taxliabilities that could materially adversely affect our financial performance.
We are subject to income and other taxes in the U.S. and foreign jurisdictions. Changes in applicable U.S. or foreign tax lawsand regulations, such as the December 2017 enactment of Federal legislation commonly referred to as the Tax Cuts and Jobs Act (the“Tax Act”), or their interpretation and application, including the possibility of retroactive effect and changes to state tax laws that mayoccur in response to the Tax Act, could affect our tax expense and profitability. In addition, the final determination of any tax audits orrelated litigation could be materially different from our historical income tax provisions and accruals. Changes in our tax provision or anincrease in our tax liabilities, whether due to changes in applicable laws and regulations, the interpretation or application thereof, or afinal determination of tax audits or litigation, could materially adversely affect our financial performance.
Our inability to respond appropriately to changes in consumer health and disclosure regulations, and to adapt to evolvingconsumer dining preferences could negatively impact our operations and competitive position, which could materiallyadversely affect our financial performance.
Federal law requires restaurant operators with twenty or more locations to make certain nutritional information available tocustomers. Additionally, some state, local and foreign governments also have enacted legislation regulating or prohibiting the sale of ormandating disclosures relating to certain types and/or levels of ingredients in food served in restaurants, such as trans fats, sodium,genetically modified organisms (GMOs) and gluten, and are taxing or considering taxing and/or otherwise regulating high fat, high sugarand high sodium foods. While it remains unclear if and to what extent consumers may reconsider dining preferences in response tosuch requirements, it is clear that consumer dining preferences continue to evolve and these preferences may evolve more rapidly inlight of these new requirements. We must be able to quickly and effectively adapt to any significant shift in consumer dining preference.Our failure or inability to do so could cause our or our licensee’s restaurants to lose market share, which could materially adverselyaffect our financial performance.
Labor organizing could harm our operations and competitive position in the restaurant industry, which could materiallyadversely affect our financial performance.
Our staff members and others may attempt to unionize our workforce, establish boycotts or picket lines or interrupt our supplychains which could limit our ability to manage our workforce effectively and cause disruptions to our operations, which could materiallyadversely affect our financial performance. Our labor costs may significantly increase if we become unable to effectively manage ourworkforce and the compensation and benefits we offer to our staff members, which also could materially adversely affect our financialperformance.
If we are unable to manage risks related to our business, costs associated with litigation and insurance could increase, whichcould materially adversely affect our financial performance.
We are subject to lawsuits, administrative proceedings and claims that arise in the ordinary course of business. These matterstypically involve claims by customers, staff members and others regarding issues such as food-borne illness, food safety, premisesliability, dram shop liability, compliance with wage and hour requirements, work-related injuries, discrimination, harassment, disabilityand other operational issues common to the foodservice industry. We could be materially adversely affected by negative publicity andlitigation costs resulting from these claims, regardless of their validity. Employment-related litigation, particularly with respect to claimsstyled as class action lawsuits, are especially costly to defend. Also, some employment-related claims in the area of wage and hourdisputes are not insurable risks and many employment-related disputes involve uncertainty in judicial interpretation from state to stateand from federal to state court with respect to the effectiveness of arbitration agreements with our staff members, particularly thosewhich provide for class waivers. We have experienced an increase in wage and hour litigation, in particular in California, where wehave seen an increase in claims filed under California’s Private Attorneys General Act (“PAGA”). PAGA allows an aggrieved staffmember to bring a lawsuit on behalf of other current and former staff members for labor code violations, including certain technicalviolations. PAGA claims are not subject to arbitration and may result in exposure to additional penalties, which can be assessedseparately from recovery of attorneys’ fees. Significant legal fees and costs in complex class action litigation or an adverse judgment orsettlement that are not insured or are in excess of insurance coverage can materially and adversely affect our financial performance.

27
We retain financial responsibility for a significant portion of our risks and associated liabilities with respect to workers’compensation, general liability, employment practices, staff health benefits and certain other insurable risks. A number of factors maysignificantly increase our self-insurance costs, such as conditions of the insurance market, the availability of insurance, or changes inapplicable regulations. The accrued liabilities associated with these programs are based on our annual estimate of the ultimate costs tosettle known claims as well as claims incurred but not yet reported to us (“IBNR”). Significant judgment is required to estimate IBNRamounts, as parties have yet to assert such claims. Our financial performance may be materially adversely affected if our actual claimscosts significantly exceed our estimates.
Our inability or failure to execute on comprehensive business continuity and disaster recovery plans following a majordisaster could interfere with our business operations, which could materially adversely affect our financial performance.
All of our core and critical applications are housed in an external tier 3 data center, which is a location with redundant and dual-powered servers, storage, network links and other IT components. To mitigate business interruptions, we employ a disk-based databackup and replication infrastructure between our onsite and external data centers. We provide support for our restaurant operations,with the exception of design and construction, from our corporate headquarters in Calabasas, California, an area that is prone to naturaldisasters such as earthquakes and wildfires. Corporate support for our bakery operations is also performed from this centralizedlocation. If we are unable to execute our disaster recovery procedures in whole or in part, we may experience delays in recovery andlosses of data, inability to perform vital corporate functions, tardiness in required reporting and compliance, failures to adequatelysupport field operations and other breakdowns in normal operating procedures that could expose us to administrative and other legalclaims, any of which could materially adversely affect our financial performance.
A closure of or material damage to one or both of our bakery facilities could impede our ability to supply bakery products to ourown and our international licensees’ restaurants as well as to other bakery customers. Such an incident could also result in the loss ofcritical data regarding our bakery operations. Any of these events could materially adversely affect our financial performance.
Adverse weather conditions, natural disasters and health epidemics could unfavorably impact our restaurant sales, whichcould materially adversely affect our financial performance.
Adverse weather conditions, natural disasters and health epidemics can impact customer traffic at our restaurants, make itmore difficult to fully staff our restaurants and, in more severe cases, such as hurricanes, earthquakes, tornadoes, blizzards, othernatural disasters or health epidemics, such as the recent outbreak of coronavirus, cause a temporary inability to obtain supplies,increase commodity costs and cause closures of our affected restaurants, sometimes for prolonged periods of time, any of which couldmaterially adversely affect our financial performance. The recent outbreak of coronavirus in China has caused and may causeadditional restaurant closures by our licensees in affected areas and may result in restaurant closures by our international licenesses inother countries if the number of cases in those countries rises, which decreases the amount of roylaties we receive from theselicensees. Climate change may cause adverse weather conditions and natural disasters to become more frequent and less predictable,which could make it more difficult to accurately project year-to-year comparisons in sales and other factors affecting financialperformance. Our cash flows may be negatively impacted by delay in the receipt of proceeds under any insurance policies or programswe maintain against certain of these risks or the proceeds may not fully offset any such losses. Any or all of these situations couldmaterially adversely affect our financial performance.
Acts of violence at or threatened against our restaurants or the centers in which they are located, including active shootersituations and terrorism, could unfavorably impact our restaurant sales, which could materially adversely affect our financialperformance.
Any act of violence at or threatened against our restaurants or the centers in which they are located, including active shootersituations and terrorist activities, may result in restricted access to our restaurants and/or restaurant closures in the short-term and, inthe long-term, may cause our customers and staff to avoid our restaurants. Any such situation could adversely impact customer trafficand make it more difficult to fully staff our restaurants, which could materially adversely affect our financial performance.

28
Our failure to establish, maintain and apply adequate internal control over our financial reporting and comply with changes infinancial accounting standards or interpretations of existing standards could limit our ability to report our financial resultsaccurately and timely or to detect and prevent fraud, any of which could materially adversely affect our financial performance.
We are subject to the ongoing internal control provisions of Section 404 of the Sarbanes-Oxley Act of 2002. These provisionsprovide for the identification of material weaknesses in internal control over financial reporting — a process to provide reasonableassurance regarding the reliability of financial reporting for external purposes in accordance with accounting principles generallyaccepted in the United States. There can be no assurance that we will be able to timely remediate material weakness in internalcontrols (if any) or maintain all of the controls necessary to remain in compliance. Any failure to maintain an effective system of internalcontrol over financial reporting could limit our ability to report our financial results accurately and timely or to detect and prevent fraud,any of which could materially adversely affect our financial performance. We have not fully evaluated any changes in internal controlover financial reporting associated with the Acquisition and therefore any material changes that may result from the Acquisition havenot been disclosed in this report. We intend to disclose all material changes resulting from the Acquisition within or prior to the time ofour first annual assessment of internal control over financial reporting that is required to include these entities. Additionally, changes inaccounting standards or new accounting pronouncements and interpretations could materially adversely affect our previously reportedor future financial results, which could materially adversely affect our financial performance.
We incurred substantial indebtedness to fund the Acquisition, which could adversely affect our business, and any failure tosatisfy financial covenants and/or repayment requirements under our credit facility could harm our financial condition.
On July 30, 2019, we entered into a Third Amended and Restated Loan Agreement (the “New Facility”), which amends andrestates in its entirety our prior Second Amended and Restated Loan Agreement dated as of December 22, 2015. The New Facility,which terminates on July 30, 2024, provides us with revolving loan commitments that total $400 million (of which $40 million may beused for issuances of letters of credit). The New Facility contains a commitment increase feature that could provide for an additional$200 million in available credit upon our request and subject to the participating lenders electing to increase their commitments or newlenders being added to the New Facility.
We financed the Acquisition with the New Facility and cash on hand. This increased indebtedness and our resulting higherdebt-to-equity ratio, as compared to that which has existed on a historical basis, could limit our ability to obtain additional financing inthe future and have other material consequences, including:
● increasing our vulnerability to, and limiting our flexibility in planning for, changing business and market conditions, making usmore vulnerable to adverse economic and industry conditions;
● limiting our ability to use proceeds from any offering or divestiture transaction for purposes other than the repayment of debt;and
● creating competitive disadvantages compared to other companies with less indebtedness.
Under the New Facility, we are subject to certain financial covenants, limitations on cash distributions and negative covenantsthat restrict indebtedness, liens, investments, sales of assets, fundamental changes and other matters. Any failure to maintain thesedebt covenants or have sufficient liquidity to either repay or refinance the then outstanding balance at expiration of the New Facility, orupon violation of the covenants, could materially adversely affect our financial performance. (See Note 12 of Notes to ConsolidatedFinancial Statements in Part IV, Item 15 for further discussion of our long-term debt.)
Risks Related to Owning Our Stock
The market price of our common stock is subject to volatility.
During fiscal 2019, the price of our common stock fluctuated between $35.83 and $51.15 per share. The market price of ourcommon stock may be significantly affected by a number of factors, including, but not limited to, actual or anticipated variations in ouroperating results or those of our competitors as compared to analyst expectations, changes in financial estimates by research analystswith respect to us or others in the restaurant industry, and announcements of significant transactions (including mergers or acquisitions,divestitures, joint ventures or other strategic initiatives) by us or others in the restaurant industry. In addition, the equity markets haveexperienced price and volume fluctuations that affect the stock price of companies in ways that have been unrelated to an individualcompany’s operating performance. The price of our common stock may continue to be volatile, based on factors specific to ourcompany and industry, as well as factors related to the equity markets overall.

29
Our stock price could be adversely affected if our performance falls short of our financial guidance and/or marketexpectations.
Our failure to achieve performance consistent with our financial guidance and/or market expectations could adversely affect theprice of our stock. Factors such as comparable restaurant sales that are below our target, slowing growth of our concepts domestically,our inability to successfully integrate and realize the anticipated benefits of the Acquisition, execute other growth opportunities, adecline in growth of our international business, any event that causes our operating costs to substantially increase, including, withoutlimitation, any of the events described elsewhere in these Risk Factors, or our failure to repurchase stock as expected or pay orincrease our dividend over time, could cause our performance to fall short of our financial guidance and/or market expectations.
Our stock price could be adversely affected if we are unable to continue to pay or if we are unable to increase dividends.
Our ability to pay and increase our dividends over time will depend on our ability to generate sufficient cash flows fromoperations and capacity to borrow funds, which may be subject to economic, financial, competitive and other factors that are beyond ourcontrol. The New Facility limits cash distributions with respect to our equity interests, such as cash dividends and share repurchases,based on a defined ratio. (See Note 12 of Notes to Consolidated Financial Statements in Part IV, Item 15 of this report for furtherdiscussion of our long-term debt.) Any failure to pay or increase our dividends over time may negatively impact investor confidence inus, and may negatively impact our stock price.
Our stock price could be adversely affected by future sales or other dilution of our equity.
We are not restricted from issuing additional common stock or preferred stock, including any securities that are convertible intoor exchangeable for, or that represent the right to receive, common stock or preferred stock or any substantially similar securities. OurBoard of Directors is authorized to issue additional shares of common stock and additional classes or series of preferred stock withoutany action on the part of the stockholders. The Board of Directors also has the discretion, without stockholder approval, to set the termsof any such classes or series of preferred stock that may be issued, including voting rights, dividend rights and preferences over thecommon stock with respect to dividends or upon the liquidation or winding up of our business and other terms. If we issue preferredshares that have a preference over our common stock with respect to the payment of dividends or upon liquidation, dissolution orwinding up, or if we issue preferred shares with voting rights that dilute the voting power of our common stock, the rights of our commonstockholders or the market price of our common stock could be materially adversely affected.
Our business and stock price could be adversely affected by the actions of activist investors.
Publicly-traded companies have increasingly become subject to activist investor campaigns. Responding to actions of anactivist investor may be a significant distraction for our management and staff, and could require us to expend significant time andresources, including legal fees and potential proxy solicitation expenses. Any of these conditions could materially adversely affect ourfinancial performance.
ITEM 1B. UNRESOLVED STAFF COMMENTS
Not applicable.
ITEM 2. PROPERTIES
Our corporate support center and one of our bakery production facilities are located in Calabasas Hills, California. Thecorporate support center consists of an 88,000 square foot main facility and a 19,000 square foot training facility on an approximatelyfive acre parcel of land. The bakery production facility is a 60,000 square foot facility on an approximately three acre parcel of land. Oursecond bakery facility located in Rocky Mount, North Carolina is a 100,000 square foot facility on an approximately 31 acre parcel ofland. Our development and design department is in a 29,000 square foot facility on approximately one acre of land in Irvine,California. All of these properties are owned by the Company. FRC's headquarters are located in Phoenix, Arizona in 22,150 squarefeet of leased office space.
As of March 11, 2020, we operated 294 Company-owned restaurants: 206 under The Cheesecake Factory ® mark in 39 states,the District of Columbia, Puerto Rico and Ontario, Canada; 50 within our FRC subsidiary in nine states and the District of Columbia; 23under the North Italia® mark in 11 states and the District of Columbia; 13 under the Grand Lux Cafe ® mark in eight states; one underthe RockSugar Southeast Asian Kitchen® mark in California; and one under the Social Monk Asian Kitchen TM mark in California. All ofour Company-owned restaurants are located on leased properties, and we have no current plans to own the real estate underlying ourrestaurants.

30
The Cheesecake FactoryCompany-Owned Restaurants
LocationAlabama 1Arizona 6California 39Colorado 3Connecticut 4Delaware 1District of Columbia 1Florida 19Georgia 5Hawaii 2Idaho 1Illinois 6Indiana 2Iowa 1Kansas 1Kentucky 2Louisiana 1Maryland 6Massachusetts 7Michigan 2Minnesota 2Missouri 3Nebraska 1Nevada 5New Jersey 10New Mexico 1New York 12North Carolina 4Oklahoma 2Ohio 7Oregon 2Pennsylvania 5Puerto Rico 1Rhode Island 1South Carolina 1Tennessee 5Texas 16Utah 2Virginia 7Washington 5Wisconsin 3Ontario, Canada 1
Total 206
ITEM 3. LEGAL PROCEEDINGS
See Note 14 of Notes to Consolidated Financial Statements in Part IV, Item 15 of this report for a summary of legalproceedings.
ITEM 4. MINE SAFETY DISCLOSURES
Not applicable.

31
PART II
ITEM 5. MARKET FOR REGISTRANT’S COMMON EQUITY, RELATED STOCKHOLDER MATTERS AND ISSUERPURCHASES OF EQUITY SECURITIES
Our common stock is traded on The Nasdaq Global Select Market under the symbol CAKE. There were approximately 1,000holders of record of our common stock at February 21, 2020, and we estimate there were approximately 43,500 beneficial stockholderson that date.
Future decisions to pay or to increase or decrease dividends are at the discretion of the Board and will be dependent on ouroperating performance, financial condition, capital expenditure requirements, limitations on cash distributions pursuant to the terms andconditions of the New Facility and applicable law, and such other factors that the Board considers relevant. (See Note 12 and 15 ofNotes to Consolidated Financial Statements in Part IV, Item 15 of this report for further discussion of our long-term debt andstockholders’ equity, respectively and see Item 1A — Risk Factors — Our stock price could be adversely affected if we are unable tocontinue to pay or if we are unable to increase dividends.)
The following table presents our purchases of our common stock during the thirteen weeks ended December 31, 2019 (inthousands, except per share data):
Total Total Number of Shares Maximum Number ofNumber Average Purchased as Part of Shares that May Yet
of Shares Price Paid Publicly Announced Be Purchased Under thePeriod Purchased (1) per Share Plans or Programs Plans or ProgramsOctober 2 — November 5, 2019 — $ — — 3,090November 6 — December 3, 2019 8 43.59 — 3,082December 4 — December 31, 2019 2 42.93 — 3,080
Total 10 —
(1) The total number of shares purchased includes 9,690 shares withheld upon vesting of restricted share awards to satisfy taxwithholding obligations.
On July 21, 2016, our Board authorized the repurchase of up to 56.0 million shares of our common stock, we have cumulativelyrepurchased 52.9 million shares at a total cost of $ 1,693.1 million through December 31, 2019, including 9,690 shares at a cost of $0.4million during the fourth quarter of fiscal 2019. Our share repurchase authorization does not have an expiration date, does not requireus to purchase a specific number of shares and may be modified, suspended or terminated at any time. (See Note 15 of Notes toConsolidated Financial Statements in Part IV, Item 15 of this report for further discussion of our repurchase authorization and methods.)
The timing and number of shares repurchased are also subject to legal constraints and financial covenants under the NewFacility that limit share repurchases based on a defined ratio. (See Note 12 of Notes to Consolidated Financial Statements inPart IV, Item 15 of this report for further discussion of our long-term debt.)
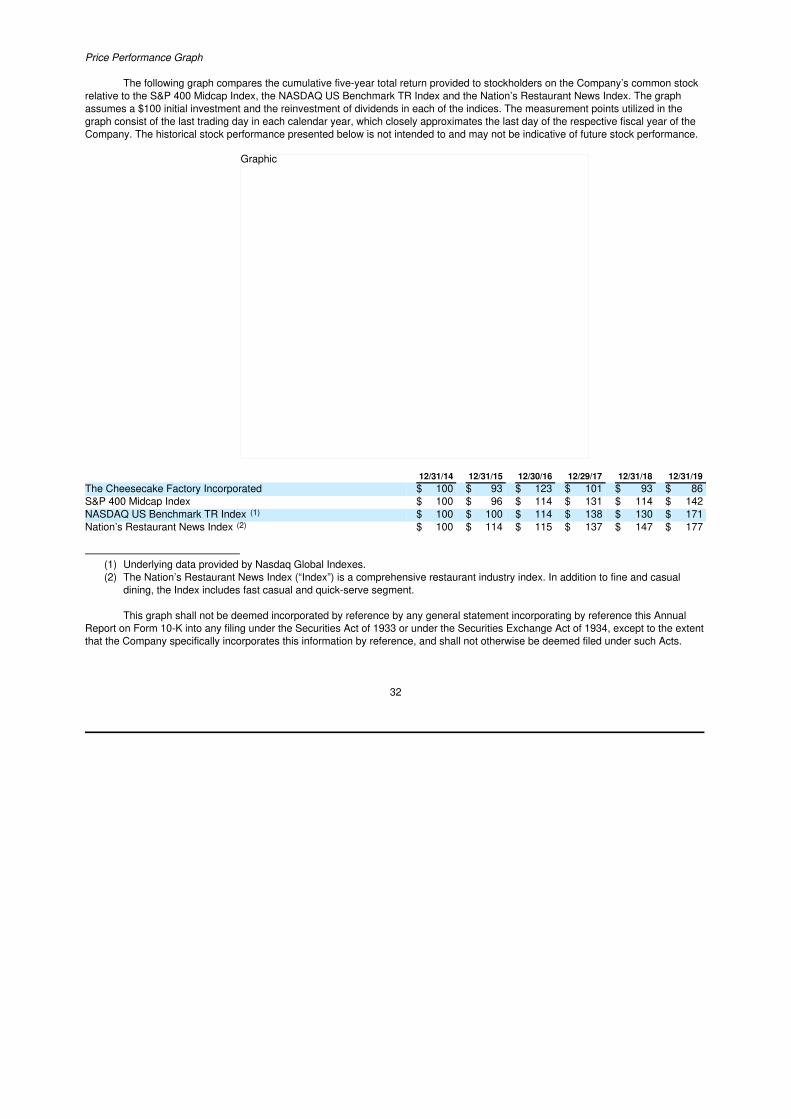
32
Price Performance Graph
The following graph compares the cumulative five-year total return provided to stockholders on the Company’s common stockrelative to the S&P 400 Midcap Index, the NASDAQ US Benchmark TR Index and the Nation’s Restaurant News Index. The graphassumes a $100 initial investment and the reinvestment of dividends in each of the indices. The measurement points utilized in thegraph consist of the last trading day in each calendar year, which closely approximates the last day of the respective fiscal year of theCompany. The historical stock performance presented below is not intended to and may not be indicative of future stock performance.
12/31/14 12/31/15 12/30/16 12/29/17 12/31/18 12/31/19The Cheesecake Factory Incorporated $ 100 $ 93 $ 123 $ 101 $ 93 $ 86S&P 400 Midcap Index $ 100 $ 96 $ 114 $ 131 $ 114 $ 142NASDAQ US Benchmark TR Index (1) $ 100 $ 100 $ 114 $ 138 $ 130 $ 171Nation’s Restaurant News Index (2) $ 100 $ 114 $ 115 $ 137 $ 147 $ 177
(1) Underlying data provided by Nasdaq Global Indexes.(2) The Nation’s Restaurant News Index (“Index”) is a comprehensive restaurant industry index. In addition to fine and casual
dining, the Index includes fast casual and quick-serve segment.
This graph shall not be deemed incorporated by reference by any general statement incorporating by reference this AnnualReport on Form 10-K into any filing under the Securities Act of 1933 or under the Securities Exchange Act of 1934, except to the extentthat the Company specifically incorporates this information by reference, and shall not otherwise be deemed filed under such Acts.
Graphic

33
ITEM 6. SELECTED FINANCIAL DATA
The following selected financial data should be read in conjunction with our consolidated financial statements and related notesthereto, and with Part II, Item 7, “Management’s Discussion and Analysis of Financial Condition and Results of Operations.”
Fiscal Year (1) 2019 2018 2017 2016 2015 (In thousands, except per share data)
Statements of Income Data: Revenues $ 2,482,692 $ 2,332,331 $ 2,260,502 $ 2,275,719 $ 2,100,609
Costs and expenses: Cost of sales 561,783 532,880 519,388 526,628 504,031Labor expenses 899,667 834,134 777,595 759,998 684,818Other operating costs and expenses 631,613 566,825 552,791 540,365 500,640General and administrative expenses 160,199 154,770 141,533 146,042 137,402Depreciation and amortization expenses 88,133 95,976 92,729 88,010 85,563Impairment of assets and lease terminations 18,247 17,861 10,343 114 6,011Acquisition-related costs 5,270 — — — —Acquisition-related contingent consideration,compensation and amortization expenses 1,033 — — — —Preopening costs 13,149 10,937 13,278 13,569 16,898
Total costs and expenses 2,379,094 2,213,383 2,107,657 2,074,726 1,935,363
Income from operations 103,598 118,948 152,845 200,993 165,246Gain/(loss) on investments in unconsolidated affliates 39,233 (4,754) (479) — —Interest and other expense, net (2,497) (6,783) (5,900) (9,225) (5,894)Income before income taxes 140,334 107,411 146,466 191,768 159,352Income tax provision/(benefit) 13,041 8,376 (10,926) 52,274 42,829Net income $ 127,923 $ 99,035 $ 157,392 $ 139,494 $ 116,523
Net income per share: Basic $ 2.90 $ 2.19 $ 3.35 $ 2.91 $ 2.39Diluted $ 2.86 $ 2.14 $ 3.27 $ 2.83 $ 2.30
Weighted average shares outstanding: Basic 43,949 45,263 46,930 47,981 48,833Diluted 44,545 46,215 48,152 49,372 50,605
Cash dividends declared per common share $ 1.38 $ 1.24 $ 1.06 $ 0.88 $ 0.73
Balance Sheet Data (at end of period): Cash and cash equivalents $ 58,416 $ 26,578 $ 6,008 $ 53,839 $ 43,854Total assets 2,840,593 1,314,133 1,333,060 1,293,319 1,233,346Total long-term debt and deemed landlord financingliability, including current portion 290,000 118,610 113,527 104,868 91,343Total stockholders’ equity 571,742 571,059 613,530 603,207 588,539
Restaurant Data: The Cheesecake Factory comparable restaurant sales 0.8 % 1.7 % (0.8)% 1.2 % 2.6 %The Cheesecake Factory restaurants open at year-end 206 201 199 194 187
(1) Fiscal 2016 consisted of 53 weeks. All other fiscal years presented consisted of 52 weeks. The estimated impact of the 53rdweek in fiscal 2016 was an increase in revenues and diluted net income per share of approximately $54.7 million and $0.07,respectively.

34
ITEM 7. MANAGEMENT’S DISCUSSION AND ANALYSIS OF FINANCIAL CONDITION AND RESULTS OF OPERATIONS
General
This Mangagement's Discussion and Analysis of Financial Condition and Results of Operations ("MD&A"), which containsforward-looking statements, should be read in conjunction with our audited consolidated financial statements and related notes inPart IV, Item 15 of this report, the “Risk Factors” included in Part I, Item 1A of this report and the cautionary statements includedthroughout this report. The inclusion of supplementary analytical and related information herein may require us to make estimates andassumptions to enable us to fairly present, in all material respects, our analysis of trends and expectations with respect to our results ofoperations and financial position.
The following MD&A includes a discussion comparing our results in fiscal 2019 to fiscal 2018. For a discussion comparing ourresults from fiscal 2018 to fiscal 2017, refer to “Management’s Discussion and Analysis of Financial Condition and Results ofOperations” in Part II, Item 7 of our Annual Report on Form 10-K for the fiscal year ended January 1, 2019, filed with the SEC on March4, 2019.
The Cheesecake Factory Incorporated is a leader in experiential dining. We are culinary forward and relentlessly focused onhospitality. We currently own and operate 294 restaurants throughout the United States and Canada under brands including TheCheesecake Factory®, North Italia® and a collection within our FRC subsidiary. Internationally, 26 The Cheesecake Factory®restaurants operate under licensing agreements. Our bakery division operates two facilities that produce quality cheesecakes and otherbaked products for our restaurants, international licensees and third-party bakery customers.
On October 2, 2019, we completed the acquistion of North Italia and the remaining business of Fox Restaurant Concepts LLC (“FRC”), including Flower Child and all other FRC brands (the “Acquisition”). The results of operations, financial position and cash flows of the acquired businesses are included in our consolidated financial statements as of the acquisition date. (See Note 2 of Notes to Consolidated Financial Statements in Part I, Item 1 of this report for further discussion of the Acquisition.)
Overview
Our strategy is driven by our commitment to customer satisfaction and is focused primarily on menu innovation, service andoperational execution to continue to differentiate ourselves from other restaurant concepts, as well as to drive competitively strongperformance that is sustainable. Financially, we are focused on prudently managing expenses at our restaurants, bakery facilities , FRCheadquarters and corporate support center, and leveraging our size to make the best use of our purchasing power.
Investing in new Company-owned restaurant development is our top capital allocation priority, with a focus on opening ourconcepts in premier locations within both new and existing markets . For The Cheesecake Factory concept, we target an average cash-on-cash return on investment of approximately 20% to 25% at the unit level. We target an average cash-on-cash return on investmentof about 35% for the North Italia concept and 25% to 30% for the FRC concepts. Returns are affected by the cost to build restaurants,the level of revenues that each restaurant can deliver and our ability to maximize the profitability of restaurants. Investing in newrestaurant development that meets our return on investment criteria is expected to support achieving mid-teens Company-level returnon invested capital.
Our overall revenue growth is primarily driven by revenues from new restaurant openings and increases in comparablerestaurant sales. Changes in comparable restaurant sales come from variations in customer traffic, as well as in average check.
For The Cheesecake Factory concept, our strategy is to increase comparable restaurant sales by growing average check andstabilizing customer traffic through (1) continuing to offer innovative, high quality menu items that offer customers a wide range ofoptions in terms of flavor, price and value (2) focusing on service and hospitality with the goal of delivering an exceptional customerexperience and (3) continuing to provide our customers with convenient options for off-premise dining. We are continuing our efforts ona number of initiatives, including a greater focus on increasing customer throughput in our restaurants, leveraging the success of ourgift card program, working with a third party to provide delivery services for our restaurants, increasing customer awareness of ouronline ordering capabilities, augmenting our marketing programs, enhancing our training programs and leveraging our customersatisfaction measurement platform.

35
Average check is driven by menu price increases and/or changes in menu mix. We generally update The Cheesecake Factoryrestaurant menus twice a year, and our philosophy is to use price increases to help offset key operating cost increases in a manner thatbalances protecting both our margins and customer traffic levels. We plan to continue targeting menu price increases of approximately2% to 3% annually , utilizing a market-based strategy to help mitigate cost pressure in higher-wage geographies, and expect near-termincreases to be at the higher end of this range.
Margins are subject to fluctuations in commodity costs, labor, restaurant-level occupancy expenses, general and administrative ("G&A") expenses and preopening expenses. Our objective is to stabilize our margins, and longer-term to drive margin expansion, by maintaining flat restaurant-level margins at The Cheesecake Factory concept, leveraging our bakery operations, international and consumer packaged goods royalty revenue streams and G&A expense over time, and optimizing our restaurant portfolio.
We plan to maintain a balanced capital allocation strategy, comprised of: investing in new restaurants that are expected to meetour targeted returns, repaying borrowings under the New Facility and continuing our dividend and share repurchase program, the latterof which offsets dilution from our equity compensation program and supports our earnings per share growth. Our ability to declaredividends and repurchase shares is subject to financial covenants under the New Facility.
Our domestic revenue growth (comprised of our annual unit growth and comparable sales growth), combined with internationalexpansion, planned debt repayment, our share repurchase program and our dividend supports our long-term financial objective of 13%to 14% total return to shareholders, on average. We define our total return as earnings per share growth plus our dividend yield. (SeeItem 1A — Risk Factors — “Our stock price could be adversely affected if our performance falls short of our financial guidance and/ormarket expectations.”)
Results of Operations
The following table presents, for the periods indicated, information from our consolidated statements of income expressedas percentages of revenues.
Fiscal Year 2019 2018 2017
Revenues 100.0 % 100.0 % 100.0 %
Costs and expenses: Cost of sales 22.6 22.8 23.0Labor expenses 36.3 35.8 34.4Other operating costs and expenses 25.5 24.3 24.4General and administrative expenses 6.5 6.6 6.2Depreciation and amortization expenses 3.5 4.1 4.1Impairment of assets and lease terminations 0.7 0.8 0.5Acquisition-related costs 0.2 — —Acquisition-related contingent consideration, compensation andamortization expenses 0.0 — —Preopening costs 0.5 0.5 0.6
Total costs and expenses 95.8 94.9 93.2
Income from operations 4.2 5.1 6.8Gain/(loss) on investments in unconsolidated affiliates 1.6 (0.3) (0.0)Interest and other expense, net (0.1) (0.2) (0.3)Income before income taxes 5.7 4.6 6.5Income tax provision/(benefit) 0.6 0.4 (0.5)Net income 5.1 % 4.2 % 7.0 %

36
Fiscal 2019 Compared to Fiscal 2018
Revenues
Revenues increased 6.5% to $2, 482.7 million for fiscal 2019 compared to $2,332.3 million for fiscal 2018, primarily due to additional revenue related to the acquired restaurants, new restaurant openings and positive comparable restaurant sales.
Revenue contribution from the acquired concepts in the fourth quarter of fiscal 2019, including comparable restaurant salesgrowth of approximately 4% for North Italia, totaled $92.0 million. Comparable sales at The Cheesecake Factory restaurants increasedby 0.8%, or $17.5 million, from fiscal 2018. This compares to the casual dining industry which had approximately flat comparable sales,as measured by Knapp Track. The Cheesecake Factory comparable sales growth was driven by average check growth of 4.0% (basedon an increase of 3.1% in menu pricing and a 0.9% positive change in mix), partially offset by a decline in customer traffic of 3.2%. Weimplemented effective menu price increases of approximately 1.6% in both the first and third quarters of fiscal 2019. The CheesecakeFactory average sales per restaurant operating week increased 0.8% to $207,310 in fiscal 2019 from $205,660 in fiscal 2018. Totaloperating weeks at The Cheesecake Factory restaurants increased 1.7% to 10,520 in fiscal 2019 compared to 10,344 in the prior year.North Italia average sales per restaurant operating week for the fourth quarter was $125,960 based on 280 operating weeks.
Restaurants become eligible to enter our comparable sales base in their 19th month of operation. At December 31, 2019, therewere nine The Cheesecake Factory restaurants not yet in our comparable sales base. International licensed locations and restaurantsthat are no longer in operation, including those which we have relocated, are excluded from our comparable sales calculations.
External bakery sales were $ 58.4 million for fiscal 2019 compared to $ 54.4 million for fiscal 2018.
Cost of Sales
Cost of sales consists of food, beverage, retail and bakery production supply costs incurred in conjunction with our restaurantand bakery revenues, and excludes depreciation, which is captured separately in depreciation and amortization expenses. Asa percentage of revenues, cost of sales was 22.6% for fiscal 2019 compared to 22.8% for fiscal 2018.
The Cheesecake Factory restaurant menus are among the most diversified in the foodservice industry and, accordingly, arenot overly dependent on a few select commodities. Changes in costs for one commodity sometimes can be offset by cost changes inother commodity categories. The principal commodity categories for our restaurants include general grocery items, dairy, produce,seafood, poultry, meat and bread. (See the discussion of our contracting activities in Part II, Item 7A — “Quantitative and QualitativeDisclosures About Market Risk.”)
As has been our past practice, we will carefully consider opportunities to introduce new menu items and implement selectedmenu price increases to help offset any expected cost increases for key commodities and other goods and services. For newrestaurants, cost of sales will typically be higher for a period of time after opening until our management team becomes moreaccustomed to predicting, managing and servicing the sales volumes at these restaurants.
Labor Expenses
As a percentage of revenues, labor expenses, which include restaurant-level labor costs and bakery direct production labor, including associated fringe benefits, were 36.3% and 35.8% in fiscal 2019 and fiscal 2018, respectively. This variance was driven primarily by higher hourly wage rates.
For new restaurants, labor expenses will typically be higher for a period of time after opening while our management teambecomes more accustomed to predicting and managing the sales volumes at the new restaurants.

37
Other Operating Costs and Expenses
Other operating costs and expenses consist of restaurant-level occupancy expenses (rent, common area expenses, insurance,licenses, taxes and utilities), other operating expenses (excluding food costs and labor expenses, which are reported separately) andbakery production overhead and distribution expenses. As a percentage of revenues, other operating costs and expenses increased to25.5% for fiscal 2019 from 24.3% for fiscal 2018. This increase was primarily driven by increased rent expense related to our adoptionof the new lease accounting standard and higher marketing costs, partially offset by lower general liability costs.
G&A Expenses
G&A expenses consist of the restaurant management recruiting and training program, restaurant field supervision, corporatesupport and bakery administrative organizations, as well as gift card commissions to third-party distributors. As a percentage ofrevenues, G&A expenses decreased to 6.5% for fiscal 2019 versus 6.6% for fiscal 2018.
Depreciation and Amortization Expenses
As a percentage of revenues, depreciation and amortization expenses were 3.5% in fiscal 2019 compared to 4.1% in fiscal2018. This decrease was primarily due to our adoption of the new lease accounting standard. (See Note 1 of Notes to ConsolidatedFinancial Statements in Part I, Item 1 of this report for further discussion of our adoption of the new lease accounting standard.)
Impairment of Assets and Lease Terminations
In fiscal 2019, we recorded $18.2 million of impairment of assets and lease termination expense related to the impairment of two The Cheesecake Factory restaurants, one Grand Lux Cafe and Social Monk Asian Kitchen and the closure of one Grand Lux Cafe and one RockSugar Southeast Asian Kitchen. In fiscal 2018, we recorded $17.9 million of impairment of assets and lease termination expense related to the impairment of one The Cheesecake Factory restaurant, one Grand Lux Cafe and one RockSugar Southeast Asian Kitchen and the closure of two The Cheesecake Factory restaurants.
Acquisition-Related Costs
In fiscal 2019, we recorded $5.3 million of costs to effect and integrate the Acquisition.
Acquisition-Related Contingent Consideration, Compensation and Amortization Expenses
In fiscal 2019, we recorded $1.0 million of acquisition-related expenses related to changes in the fair value of the deferred andcontingent consideration and compensation liabilities, as well as amortization of acquired definite-lived licensing agreements.
Preopening Costs
Preopening costs were $ 13.1 million for fiscal 2019 compared to $10.9 million for fiscal 2018 . We opened nine restaurants infiscal 2019 comprised of five The Cheesecake Factory restaurants, one Social Monk Asian Kitchen, one North Italia and two FlowerChild locations, compared to five restaurants in fiscal 2018 comprised of four The Cheesecake Factory restaurants and one Grand LuxCafe. Preopening costs include all costs to relocate and compensate restaurant management staff members during the preopeningperiod, costs to recruit and train hourly restaurant staff members, and wages, travel and lodging costs for our opening training team andother support staff members. Also included are expenses for maintaining a roster of trained managers for pending openings, theassociated temporary housing and other costs necessary to relocate managers in alignment with future restaurant opening andoperating needs, and corporate travel and support activities. Preopening costs can fluctuate significantly from period to period based onthe number and timing of restaurant openings and the specific preopening costs incurred for each restaurant.
Gain/(loss) on Investments in Unconsolidated Affiliates
We recorded a $39.2 million gain on investments in unconsolidated affiliates in fiscal 2019 compared to a $4.8 million loss infiscal 2018. This variance was primarily driven by the fiscal 2019 gain of $52.7 million on our investments in North Italia and FlowerChild upon acquisition of the remaining equity interests in these concepts, partially offset by an increase in our share of pre-acquisitionlosses incurred by these concepts which were driven primarily by impairment of assets and acquisition-related expenses.

38
Interest and Other Expense, Net
Interest and other expense, net was $2.5 million in fiscal 2019 compared to $6.8 million in fiscal 2018. This variance wasprimarily due to our adoption of the new lease accounting standard under which we no longer have deemed landlord financing liabilitiesand associated interest expense, partially offset by increased interest expense related to higher outstanding debt.
Income Tax Provision/(Benefit)
Our effective income tax rate was 9.3% in fiscal 2019 compared to 7.8% in fiscal 2018. This variance was driven primarily by a lower proportion of FICA tip credit in relation to pre-tax income partially offset by non-taxable gains on our investments in variable life insurance contracts used to support our non-qualified deferred compensation plan as compared to non-deductible losses in fiscal 2018. (See Note 18 of Notes to Consolidated Financial Statements in Part IV, Item 15 of this report for further discussion of income taxes.)
Non-GAAP Measures
Adjusted net income and adjusted diluted net income per share are supplemental measures of our performance that are notrequired by or presented in accordance with GAAP. These non-GAAP measures may not be comparable to similarly titled measuresused by other companies and should not be considered in isolation or as a substitute for measures of performance prepared inaccordance with GAAP. We calculate these non-GAAP measures by eliminating from net income and diluted net income per share theimpact of items we do not consider indicative of our ongoing operations. We use these non-GAAP financial measures for financial andoperational decision-making and as a means to evaluate period-to-period comparisons. Our inclusion of these adjusted measuresshould not be construed as an indication that our future results will be unaffected by unusual or infrequent items. In the future, we mayincur expenses or generate income similar to the adjusted items.
Following is a reconciliation from net income and diluted net income per share to the corresponding adjusted measures (inthousands, except per share data).
Fiscal Year 2019 2018 2017
Net income $ 127,293 $ 99,035 $ 157,392Impairment of assets and lease terminations (1) 18,247 17,861 10,343Loss on investment in unconsolidated affiliates (2) 13,439 4,754 479Gain on investment in unconsolidated affiliates (3) (52,672) — —Acquisition-related costs (4) 5,270 — —Acquisition-related contingent consideration, compensation and amortization expenses (5) 1,033 — —Tax effect of adjustments (6) 3,818 (5,880) (4,329)One-time tax benefit items (7) — — (38,525)
Adjusted net income $ 116,428 $ 115,770 $ 125,360
Diluted net income per share $ 2.86 $ 2.14 $ 3.27Impairment of assets and lease terminations (1) 0.41 0.39 0.21Loss on investment in unconsolidated affiliates (2) 0.30 0.10 0.01Gain on investment in unconsolidated affiliates (3) (1.18) — —Acquisition-related costs (4) 0.12 — —Acquisition-related contingent consideration, compensation and amortization expenses (5) 0.02 — —Tax effect of adjustments (6) 0.09 (0.13) (0.09)One-time tax benefit items (7) — — (0.80)
Adjusted diluted net income per share (8) $ 2.61 $ 2.51 $ 2.60
(1) See Note 1 of Notes to Consolidated Financial Statements in Part IV, Item 15 of this report for further discussion of impairmentof long-lived assets and lease terminations expense.
(2) Represents our share of pre-acquisition losses incurred by North Italia and Flower Child.

39
(3) Represents gain related to the acquisition of the remaining equity interests in North Italia and Flower Child. (See Note 2 andNote 18 of Notes to Consolidated Financial Statements in Part IV, Item 15 of this report for further discussion of the Acquisitionand income taxes, respectively.)
(4) Represents our costs incurred to effect and integrate the Acquisition. (See Note 2 of Notes to Consolidated FinancialStatements in Part IV, Item 15 of this report for further discussion of the Acquisition.)
(5) Represents changes in the fair value of the acquisition-related deferred consideration and contingent consideration andcompensation liabilities, as well as amortization of acquired definite-lived licensing agreements. (See Note 2 of Notes toConsolidated Financial Statements in Part IV, Item 15 of this report for further discussion of the Acquisition.)
(6) Based on the federal statutory rate and an estimated blended state tax rate, the tax effect on all adjustments other than thegain on investment in unconsolidated affiliates assumes a 26% tax rate for fiscal 2019 and 2018 and a 40% tax rate for fiscal2017.
(7) Represents a benefit to our income tax provision related to the Tax Act in fiscal 2017. (See Note 18 of Notes to ConsolidatedFinancial Statements in Part IV, Item 15 of this report for further discussion of income taxes.)
(8) Adjusted diluted net income per share may not add due to rounding.
Fiscal 2020 Outlook
This discussion contains forward-looking statements within the meaning of the Private Securities Litigation Reform Act of 1995,as codifed in Section 27A of the Securities Act, and Section 21E of the Echange Act and should be read in conjunction with ourconsolidated financial statements and related notes in Part IV, Item 15 of this report, the “Risk Factors” included in Part I, Item 1A of thisreport and the cautionary statements included throughout this report.
For fiscal 2020, we estimate adjusted diluted net income per share will be between $2.70 and $2.86 based on an assumedcomparable sales range of 1% to 2% at The Cheesecake Factory restaurants and approximately $425 million in revenue contributed byNorth Italia and FRC. This adjusted diluted net income per share range excludes acquisition-related costs and contingent consideration,compensation and amortization, which we expect will be approximately $8 million and $4 million, respectively. For fiscal 2020, weestimate food inflation of about 2%, wage rate inflation of approximately 5.5% and an effective tax rate of approximately 9%.
In fiscal 2020, we plan new unit growth to accelerate with as many as 20 new restaurants. This includes six The CheesecakeFactory restaurants, six North Italia restaurants and eight restaurants within the FRC subsidiary, which includes as many as four FlowerChild locations. We also expect as many as four locations to open internationally under licensing agreements.
We expect fiscal 2020 net capital expenditures to range between $130 million and $140 million to support anticipated new unitgrowth and ongoing maintenance needs. We will also have a $17.3 million cash outflow for acquisition-related deferred consideration.
Liquidity and Capital Resources
Our corporate financial objectives are to maintain a sufficiently strong and conservative balance sheet to support our operatinginitiatives and unit growth while maintaining financial flexibility to provide the financial resources necessary to protect and enhance thecompetitiveness of our restaurant and bakery brands and to provide a prudent level of financial capacity to manage the risks anduncertainties of conducting our business operations under various economic and industry cycles. Our ongoing capital requirements areprincipally related to our restaurant expansion plans, ongoing maintenance of our restaurants and bakery facilities, and investment inour corporate and information technology infrastructures.

40
Similar to many restaurant and retail chain store operations, we utilize operating lease arrangements for all of our restaurantlocations. We believe our operating lease arrangements continue to provide appropriate leverage for our capital structure in afinancially efficient manner. However, we are not limited to the use of lease arrangements as our only method of opening newrestaurants. Accordingly, our lease arrangements reduce, to some extent, our capacity to utilize funded indebtedness in our capitalstructure.
Historically, we have obtained capital from our ongoing operations, public stock offerings, credit facilities, stock option exercises and construction contributions from our landlords. Our requirement for working capital is not significant, since our restaurant customers pay for their food and beverage purchases in cash or cash equivalents at the time of sale, and we are able to sell many of our restaurant inventory items before payment is due to the suppliers of such items.
The following table presents, for the periods indicated, a summary of our key cash flows from operating, investing and financingactivities (in millions):
Fiscal Year 2019 2018 2017
Cash provided by operating activities $ 218.8 $ 291.3 $ 238.8Additions to property and equipment $ (73.8) $ (102.9) $ (120.8)Growth capital provided to unconsolidated affiliates $ (3.0) $ (25.0) $ (18.0)Acquisition, net of cash acquired $ (261.7) $ — $ —Net borrowings on credit facility $ 280.0 $ — $ 10.0Deemed landlord financing proceeds $ — $ 21.8 $ 12.1Proceeds from exercise of stock options $ 7.7 $ 8.6 $ 9.0Cash dividends paid $ (60.7) $ (56.3) $ (49.9)Treasury stock purchases $ (51.0) $ (109.3) $ (123.0)
During fiscal 2019, our cash and cash equivalents increased by $31.8 million to $58.4 million. This increase was primarilyattributable to cash provided by operating activities and borrowings on our credit facility, partially offset by cash paid for the Acquisition,additions to property and equipment, dividend payments and treasury stock purchases.
Capital expenditures for new restaurants, including locations under development as of each fiscal year-end, were $40.5 million,$58.6 million and $76.5 million for fiscal 2019, 2018 and 2017, respectively. Capital expenditures also included $29.4 million, $26.9million and $36.5 million for our existing restaurants and $3.9 million, $17.4 million and $7.8 million for bakery and corporate capacityand infrastructure investments in fiscal 2019, 2018 and 2017, respectively, including an infrastructure upgrade of our California bakeryin 2018.
As of December 31, 2019, we maintained a $400 million unsecured revolving credit facility (the “New Facility”), $40 million ofwhich could be used for issuances of letters of credit. The New Facility, which terminates on July 30, 2024, contains a commitmentincrease feature that could provide for an additional $200 million in available credit upon our request and subject to the satisfaction ofcertain conditions. Certain of our material subsidiaries have guaranteed our obligations under the New Facility. During fiscal 2019, weutilized the New Facility to fund the Acquisition. During fiscal 2019, 2018 and 2017, we utilized our previous credit facility to fund aportion of our stock repurchases. At December 31, 2019, we had net availability for borrowings of $90.6 million, based on a $290.0million outstanding debt balance and $19.4 million in standby letters of credit. The New Facility limits cash distributions with respect toour equity interests, such as cash dividends and share repurchases, based on a defined ratio. As of December 31, 2019, we were incompliance with the covenants set forth in the New Facility. (See Note 12 of Notes to Consolidated Financial Statements in Part IV,Item 15 of this report for further discussion of our long-term debt .)
On October 2, 2019 (“Closing” or “Closing Date”), we acquired North Italia and FRC, including Flower Child and all other FRCbrands. The Acquisition was completed for consideration consisting of the following components: $286 million in cash at Closing, whichwas primarily funded by drawing on the New Facility; assumption of $10 million in debt previously owed by FRC to us; a $12 millionindemnity escrow amount specifically related to North Italia due ratably over the next two years; and $45 million of deferredconsideration due ratably over the next four years (including a $13 million indemnity escrow amount specifically related to the remainingFRC business).

41
The acquisition agreement also included a contingent consideration provision which is payable on the fifth anniversary of theClosing Date and is based on achievement of revenue and profitability targets for the FRC brands other than North Italia and FlowerChild with considerations made in the event we undergo a change in control or divest any FRC brand (other than North Italia andFlower Child). We are also required to provide financing to FRC in an amount sufficient to support achievement of these targets duringthe five years after Closing. (See Note 2 of Notes to Consolidated Financial Statements in Part IV, Item 15 of this report for furtherdiscussion of the Acquisition.)
In fiscal 2012, our Board approved the initiation of a cash dividend to our stockholders, which is subject to quarterly Boardapproval. Cash dividends have been declared every quarter since initiation. Future decisions to pay or to increase or decreasedividends are at the discretion of the Board and will be dependent on our operating performance, financial condition, capital expenditurerequirements, limitations on cash distributions pursuant to the terms and conditions of the New Facility and applicable law, and othersuch factors that the Board considers relevant.
Under authorization by our Board to repurchase up to 56.0 million shares of our common stock, we have cumulativelyrepurchased 52.9 million shares at a total cost of $1,693.1 million through December 31, 2019, including 9,690 shares at a cost of $0.4million during the fourth quarter of fiscal 2019. During fiscal 2019, 2018 and 2017, we repurchased 1.1 million, 2.3 million and 2.6million shares of our common stock at a cost of $51.0 million, $109.3 million and $123.0 million, respectively. Our share repurchaseauthorization does not have an expiration date, does not require us to purchase a specific number of shares and may be modified,suspended or terminated at any time. We make the determination to repurchase shares based on several factors, including current andforecasted operating cash flows, capital needs associated with new restaurant development and maintenance of existing locations,dividend payments, debt levels and cost of borrowing, obligations associated with the Acquisition, our share price and current marketconditions. The timing and number of shares repurchased are also subject to legal constraints and financial covenants under the NewFacility that limit share repurchases based on a defined ratio. (See Note 12 of Notes to Consolidated Financial Statements in Part IV,Item 15 of this report for further discussion of our long-term debt.) Our objectives with regard to share repurchases are to offset thedilution to our shares outstanding that results from equity compensation grants and to supplement our earnings per share growth. (SeeNote 15 of Notes to Consolidated Financial Statements in Part IV, Item 15 of this report for further discussion of our repurchaseauthorization and methods.)
Based on our current expansion objectives, we believe that during the upcoming 12 months our cash and cash equivalents,combined with expected cash flows provided by operations, available borrowings under the New Facility and expected landlordconstruction contributions should be sufficient in the aggregate to finance our capital allocation strategy, including capital expenditures,continuation of our dividend and share repurchase program, potential debt repayments and obligations associated with the Acquisition.
As of December 31, 2019, we had no financing transactions, arrangements or other relationships with any unconsolidatedentities or related parties. Additionally, we had no financing arrangements involving synthetic leases or trading activities involvingcommodity contracts.

42
Contractual Obligations and Commercial Commitments
The following table summarizes our undiscounted contractual obligations and commercial commitments as of December 31,2019 (amounts in millions):
Payment Due by Period Less than More than
Total 1 Year 1‑3 Years 4‑5 Years 5 YearsContractual obligations Recorded contractual obligations:
Operating leases liabilities (1) $ 2,030.5 $ 122.3 $ 249.8 $ 242.6 $ 1,415.8Long-term debt 290.0 — — 290.0 —Deferred consideration (2) 57.0 17.3 28.5 11.2 —Uncertain tax positions (3) 0.7 — 0.7 — —
Unrecorded contractual obligations:Purchase obligations (4) 118.2 87.3 24.0 6.9 —Real estate obligations (5) 176.1 37.6 15.0 11.1 112.4
Total $ 2,672.5 $ 264.5 $ 318.0 $ 561.8 $ 1,528.2
Other commercial commitments Standby letters of credit $ 19.4 $ 19.4 $ — $ — $ —
(1) Includes $867.2 million related to options to extend lease terms that are reasonably certain of being exercised. (See Note 1 in Notes to Consolidated Financial Statements in Part IV, Item 15 of this report for discussion of leases.)
(2) Represents acquisition-related deferred consideration. (See Note 2 of Notes to Consolidated Financial Statements in Part IV,Item 15 of this report for further discussion of the Acquisition.)
(3) Represents liability for uncertain tax positions. (See Note 18 of Notes to Consolidated Financial Statements in Part IV, Item 15of this report for further discussion of income taxes.)
(4) Includes obligations for inventory purchases, equipment purchases, information technology and other miscellaneouscommitments. Amounts exclude agreements that are cancelable without significant penalty.
(5) Real estate obligations include construction commitments, net of up-front landlord construction contributions, and legallybinding minimum lease payments for leases signed but not yet commenced. Amounts exclude agreements that are cancelablewithout significant penalty.
The acquisition agreement also included a contingent consideration provision which is payable on the fifth anniversary of theClosing Date and is based on achievement of revenue and profitability targets for the FRC brands other than North Italia and FlowerChild with considerations made in the event we undergo a change in control or divest any FRC brand (other than North Italia andFlower Child) during the five years after Closing. We are also required to provide financing to FRC in an amount sufficient to supportachievement of these targets during the five years after Closing. (See Note 2 in Notes to Consolidated Financial Statements in Part IV,Item 15 of this report for further discussion of the Acquisition.)
We expect to fund our contractual obligations primarily with operating cash flows generated in the normal course of business.
Critical Accounting Policies
Critical accounting policies are those we believe are most important to portraying our financial condition and results ofoperations and also require the greatest amount of subjective or complex judgments by management. Judgments and uncertaintiesregarding the application of these policies may result in materially different amounts being reported under various conditions or usingdifferent assumptions. We consider the following policies to be the most critical in understanding the judgment that is involved inpreparing our consolidated financial statements.

43
Business Combination
On October 2, 2019, we completed the acquisition of North Italia and the remaining business of Fox Restaurant Concepts LLC. In accordance with the acquisition method of accounting for business combinations, we allocated the purchase price of acquired businesses to the tangible and intangible assets acquired and liabilities assumed based on preliminary estimated fair values. Our purchase price allocation methodology contains uncertainties because it requires us to make certain assumptions and to apply judgment to estimate the fair value of acquired assets and liabilities, including, but not limited to, property and equipment and intangible assets. We estimated the fair value of assets and liabilities based upon widely-accepted valuation techniques, including discounted cash flow, relief from royalty and Monte Carlo methods, depending on the nature of the assets acquired or liabilities assumed. The process for estimating fair values in many cases requires the use of significant estimates, assumptions and judgments, including determining the timing and estimates of future cash flows and developing appropriate discount rates. Unanticipated events or circumstances may occur which could affect the accuracy of our fair value estimates. We expect minor adjustments to our purchase accounting in the first quarter of fiscal 2020 as we finalize our valuation of the acquired intangible assets.
Contingent Consideration
The acquisition agreement also included a contingent consideration provision which is payable on the fifth anniversary of theClosing Date. The fair value of the contingent consideration was determined utilizing a Monte Carlo model based on estimated futurerevenues, margins and volatility factors, among other variables and estimates, and has no maximum payment. The fair value of thecontingent consideration is highly subjective, and results could change materially if different estimates and assumptions were used.
Intangible Assets
Goodwill and other indefinite-lived intangible assets are tested for impairment annually or on an interim basis if events orchanges in circumstances between annual tests indicate a potential impairment. Factors considered include, but are not limited tohistorical financial performance, a significant decline in expected future cash flows, unanticipated competition, changes in managementor key personnel, macroeconomic and industry conditions and the legal and regulatory environment. If the qualitative assessmentindicates that it is more likely than not that an impairment exists, then a quantitative assessment is performed. The quantitativeassessment requires an analysis of several best estimates and assumptions, including future sales and operating results, and otherfactors that could affect fair value or otherwise indicate potential impairment. The goodwill impairment assessment involves valuing ourreporting units that carry goodwill and considers their projected ability to generate income from operations and positive cash flow infuture periods. The fair value assessment could change materially if different estimates and assumptions were used.
Impairment of Long-Lived Assets
We assess the potential impairment of our long-lived assets on an annual basis or whenever events or changes incircumstances indicate that the carrying value of the assets or asset group may not be recoverable. Factors considered include, but arenot limited to, negative cash flow, significant underperformance relative to historical or projected future operating results, significantchanges in the manner in which an asset is being used, an expectation that an asset will be disposed of significantly before the end ofits previously estimated useful life and significant negative industry or economic trends.
Assessing whether impairment testing is warranted and, if so, determining the amount of expense require the use of estimatesand assumptions regarding future cash flows, which are subject to a significant degree of judgment based on our experience andknowledge. These estimates can be significantly impacted by changes in the economic environment, real estate market conditions andcapital spending decisions.
Leases
The reasonably certain lease term and the incremental borrowing rate for each restaurant location require judgment bymanagement and can impact the classification and accounting for a lease as operating or finance, as well as the value of the operatinglease asset and liability. These judgments may produce materially different amounts of rent expense than would be reported if differentassumptions were used.

44
Self-Insurance Liabilities
We retain the financial responsibility for a significant portion of our risks and associated liabilities with respect to workers’compensation, general liability, staff member health benefits, employment practices and other insurable risks. The accrued liabilitiesassociated with these programs are based on our estimate of the ultimate costs to settle known claims, as well as claims incurred butnot yet reported to us (“IBNR”) as of the balance sheet date. Our estimated liabilities are based on information provided by ourinsurance brokers and insurers, combined with our judgment regarding a number of assumptions and factors, including the frequencyand severity of claims, claims development history, case jurisdiction, applicable legislation and our claims settlement practices.Significant judgment is required to estimate IBNR amounts, as parties have yet to assert such claims. If actual claims trends, includingthe severity or frequency of claims, differ from our estimates, our financial results could be impacted.
Income Taxes
We compute income taxes based on estimates of our federal, state and foreign tax liabilities. Our estimates include, but are notlimited to, effective state and local income tax rates, allowable tax credits, depreciation expense allowable for tax purposes andapplicable valuation allowances on deferred tax assets. Our estimates are made based on the best available information at the time weprepare our consolidated financial statements. In making our estimates, we consider the impact of legislative and judicial developments.As these developments evolve, we update our estimates, which, in turn, may result in adjustments to our effective tax rate. Wegenerally file our income tax returns within ten months after our fiscal year-end. All tax returns are subject to audit by the applicabletaxing authorities, usually years after the returns are filed, and could be subject to differing interpretations of the tax laws.
Uncertain tax positions taken or expected to be taken in a tax return are recognized (or derecognized) in the financialstatements when it is more likely than not (i.e., a likelihood of more than 50%) that the position would be sustained on its technicalmerits upon examination by tax authorities, taking into account available administrative remedies and litigation. A recognized taxposition is then measured at the largest amount of benefit that is greater than 50% likely of being realized upon ultimateresolution. Assessment of uncertain tax positions requires significant judgments relating to the amounts, timing and likelihood ofresolution. Our actual results could differ materially from these estimates.
Recent Accounting Pronouncements
See Note 1 of Notes to Consolidated Financial Statements in Part IV, Item 15 of this report for a summary of new accountingstandards.
Impact of Inflation
The impact of inflation on food costs, labor, and other supplies and services can adversely impact our financial results. Whilewe attempt to at least partially offset increases in the costs of key operating resources by gradually raising prices for our menu itemsand bakery products and employing more efficient purchasing practices, productivity improvements and greater economies of scale,there can be no assurance that we will be effective in doing so.
ITEM 7A. QUANTITATIVE AND QUALITATIVE DISCLOSURES ABOUT MARKET RISK
The following discussion of market risks contains forward-looking statements and should be read in conjunction with ourconsolidated financial statements and related notes in Part IV, Item 15 of this report, the “Risk Factors” included in Part I, Item 1A of this report' the "Management's Discussion and Analysis of Financial Condition and Results of Operations" in Part II, Item 7 of this report and the cautionary statements included throughout this report. Actual results may differ materially from the following discussion based on general conditions in the commodity and financial markets.
45
We purchase food and other commodities for use in our operations based on market prices established with our suppliers. Many of the commodities purchased by us can be subject to volatility due to market supply and demand factors outside of our control. We mitigate the risk of supply shortages and obtain competitive prices by utilizing multiple qualified suppliers for substantially all of our ingredients and supplies. We negotiate short-term and long-term agreements for some of our principal commodity, supply and equipment requirements, such as certain dairy products and poultry, depending on market conditions and expected demand. We continue to evaluate the possibility of entering into similar arrangements for other commodities and also periodically evaluate hedging vehicles, such as direct financial instruments, to assist us in managing risk and variability associated with such commodities. Although these vehicles may be available to us, as of the end of our 2019 fiscal year, we had chosen not to enter into any hedging contracts due to pricing volatility, excessive risk premiums, hedge inefficiencies or other factors. Commodities for which we have not entered into contracts can be subject to unforeseen supply and cost fluctuations, which at times may be significant. Additionally, the cost of commodities subject to governmental regulation, such as dairy and corn, can be especially susceptible to price fluctuation. Commodities we purchase on the international market may be subject to even greater fluctuations in cost and availability, which could result from a variety of factors, including the value of the U.S. dollar relative to other currencies, international trade disputes, tariffs and varying global demand. We may or may not have the ability to increase menu prices or vary menu items in response to food commodity price increases. For fiscal years 2019 and 2018, a hypothetical increase of 1% in food costs would have negatively impacted cost of sales by $5.6 million and $5.4 million, respectively. (See Item 1A — Risk Factors — “Our inability to anticipate and react effectively to changes in the costs of key operating resources may increase our cost of doing business, which could materially adversely affect our financial performance.”)
We are exposed to market risk from interest rate changes on our funded debt. This exposure relates to the component of theinterest rate on the New Facility and our previous credit facility that is indexed to market rates. Based on outstanding borrowings atDecember 31, 2019 and January 1, 2019, a hypothetical 1% rise in interest rates would have increased interest expense by $2.9 millionand $0.1 million, respectively, on an annual basis. (See Note 12 of Notes to Consolidated Financial Statements in Part IV, Item 15 ofthis report for further discussion of our long-term debt.)
We are also subject to market risk related to our investments in variable life insurance contracts used to support our ESP to theextent these investments are not equivalent to the related liability. In addition, because changes in these investments are not taxable,gains and losses result in tax benefit and tax expense, respectively, and directly affect net income through the income tax provision.Based on balances at December 31, 2019 and January 1, 2019, a hypothetical 10% decline in the market value of our deferredcompensation asset and related liability would not have impacted income before income taxes. However, under such scenario, netincome would have declined by $1.9 million and $1.5 million at December 31, 2019 and January 1, 2019, respectively.
ITEM 8. FINANCIAL STATEMENTS AND SUPPLEMENTARY DATA
The consolidated financial statements required to be filed hereunder are set forth in Part IV, Item 15 of this report.
ITEM 9. CHANGES IN AND DISAGREEMENTS WITH ACCOUNTANTS ON ACCOUNTING AND FINANCIAL DISCLOSURE
The information required by this Item 9 was previously reported in the Company’s Current Report on Form 8-K that was filedwith the SEC on March 7, 2018.
ITEM 9A. CONTROLS AND PROCEDURES
Evaluation of Disclosure Controls and Procedures
We have established and maintain disclosure controls and procedures that are designed to ensure that information required tobe disclosed by us in the reports that we file or submit under the Securities Exchange Act of 1934 is recorded, processed, summarized,and reported within the time periods specified in the SEC’s rules and forms, and that such information is accumulated andcommunicated to our management, including our Chief Executive Officer and Chief Financial Officer, as appropriate to allow timelydecisions regarding required disclosure. In designing and evaluating the disclosure controls and procedures, management recognizedthat any controls and procedures, no matter how well designed and operated, can provide only a reasonable assurance of achieving thedesired control objectives, and management was necessarily required to apply its judgment in evaluating the cost-benefit relationshipof possible controls and procedures. We carried out an evaluation, under the supervision and with the participation of our management,including our Chief Executive Officer and Chief Financial Officer, of the effectiveness of the design and operation of our disclosurecontrols and procedures as of the end of the period covered by this report. Based on that evaluation, the Chief Executive Officer andChief Financial Officer concluded that our disclosure controls and procedures were effective at the reasonable assurance level as ofDecember 31, 2019.

46
Management’s Report on Internal Control over Financial Reporting
Our management is responsible for establishing and maintaining adequate internal control over financial reporting. As definedin Exchange Act Rule 13a-15(f), internal control over financial reporting is a process designed by, or under the supervision of, ourprincipal executive and principal financial officers and effected by our Board of Directors, management and other personnel, to providereasonable assurance regarding the reliability of financial reporting and the preparation of financial statements for external purposes inaccordance with accounting principles generally accepted in the United States (“GAAP”) and includes those policies and proceduresthat (i) pertain to the maintenance of records that in reasonable detail accurately and fairly reflect the transactions and dispositions ofthe assets of the company; (ii) provide reasonable assurance that transactions are recorded as necessary to permit preparation offinancial statements in accordance with GAAP, and that receipts and expenditures of the Company are being made only in accordancewith authorizations of management and directors of the Company; and (iii) provide reasonable assurance regarding prevention or timelydetection of unauthorized acquisition, use or disposition of the Company’s assets that could have a material effect on the financialstatements. Because of its inherent limitations, internal control over financial reporting may not prevent or detect misstatements.
Under the supervision and with the participation of our management, including our Chief Executive Officer and Chief FinancialOfficer, we carried out an evaluation of the effectiveness of our internal control over financial reporting as of December 31, 2019 basedon the criteria in “Internal Control - Integrated Framework (2013)” issued by the Committee of Sponsoring Organizations of theTreadway Commission (“COSO”). Based on this evaluation, our management concluded that our internal control over financial reportingwas effective as of December 31, 2019.
On October 2, 2019, we completed the acquistion of North Italia and the remaining business of Fox Restaurant Concepts LLC("FRC"). As permitted by the Securities and Exchange Commission, management has elected to exclude these businesses from itsassessment of internal controls over financial reporting as of December 31, 2019. North Italia's and FRC's operations are included inthe Company's 2019 consolidated financial statements for the period from October 2, 2019 to December 31, 2019 and represented28.3% of the Company's consolidated total assets as of December 31, 2019 and 3.7% of the Company's consolidated total revenuesfor the year ended December 31, 2019.
The effectiveness of our internal control over financial reporting as of December 31, 2019 has been audited by KPMG LLP, anindependent registered public accounting firm, as stated in their report which appears in Part IV, Item 15 of this report.
Changes in Internal Control over Financial Reporting
As previously announced, we acquired North Italia and the remaining business of Fox Restaurant Concepts, including FlowerChild and all other FRC brands on October 2, 2019. We have not fully evaluated any changes in internal control over financial reportingassociated with the acquisition and therefore any material changes that may result from these acquisitions have not been disclosed inthis report. We intend to disclose all material changes resulting from these acquisitions within or prior to the time of our first annualassessment of internal control over financial reporting that is required to include these entities.
There have been no other changes in our internal control over financial reporting (as defined in Rules 13a-15(f) and 15d-15(f) under the Securities Exchange Act of 1934) during fiscal year ended December 31, 2019 that have materially affected, or arereasonably likely to materially affect, our internal control over financial reporting.
ITEM 9B. OTHER INFORMATION
None.

47
PART III
ITEM 10. DIRECTORS, EXECUTIVE OFFICERS AND CORPORATE GOVERNANCE
We have adopted a code of ethics which applies to our Chief Executive Officer, Chief Financial Officer and Chief AccountingOfficer, who are the Company’s principal executive, financial and accounting officers, respectively, and the Company’s other executiveofficers and members of the Board of Directors, entitled “Code of Ethics for Executive Officers, Senior Financial Officers andDirectors.” We have also adopted a code of ethics which applies to other employees entitled “Code of Ethics and Code of BusinessConduct.” The codes of ethics are available on our corporate website at www.thecheesecakefactory.com in the “Governance” sectionof our “Investors” page. The contents of our website are not incorporated by reference into this report. We intend to satisfy disclosurerequirements under Item 5.05 of Form 8-K regarding an amendment to, or waiver from, a provision of the Code of Ethics for ExecutiveOfficers, Senior Financial Officers and Directors by posting such information on our website, at the address and location specifiedabove, or as otherwise required by the NASDAQ Global Market.
Information with respect to our executive officers is included in Part I, Item 1 of this report. Other information required by thisitem is hereby incorporated by reference from the sections entitled “Election of Directors,” “The Board and Corporate Governance,” and”Delinquent Section 16(a) Reports” in our definitive proxy statement for the annual meeting of stockholders to be held on May 30, 2019(the “Proxy Statement”).
ITEM 11. EXECUTIVE COMPENSATION
The information required by this item is hereby incorporated by reference to the sections entitled “Directors Compensation,”“Executive Compensation” and “Compensation Committee Interlocks and Insider Participation” in the Proxy Statement.
ITEM 12. SECURITY OWNERSHIP OF CERTAIN BENEFICIAL OWNERS AND MANAGEMENT AND RELATEDSTOCKHOLDER MATTERS
The information required by this item is hereby incorporated by reference to the section entitled “Beneficial Ownership ofPrincipal Stockholders and Management” and “Equity Compensation Plan Information” in the Proxy Statement.
ITEM 13. CERTAIN RELATIONSHIPS AND RELATED TRANSACTIONS, AND DIRECTOR INDEPENDENCE
The information required by this item is hereby incorporated by reference to the sections entitled “Policies Regarding Review,Approval or Ratification of Transactions with Related Persons” and “The Board and Corporate Governance” in the Proxy Statement.
ITEM 14. PRINCIPAL ACCOUNTING FEES AND SERVICES
The information required by this item is hereby incorporated by reference to the section entitled “Independent Registered PublicAccounting Firm Fees and Services” (in the proposal entitled “Ratification of Selection of Independent Registered Public AccountingFirm”) in the Proxy Statement.

48
PART IV
ITEM 15. EXHIBITS, FINANCIAL STATEMENT SCHEDULES
The following documents are filed as a part of this Report:
(a) 1. Financial statements:
The consolidated financial statements required to be filed hereunder are listed in the Index to ConsolidatedFinancial Statements on page 48 of this report.
2. Financial statement schedules:
All schedules have been omitted because they are not applicable, not required or the information has beenotherwise supplied in the financial statements or notes to the financial statements.
3. Exhibits:
The Exhibits required to be filed hereunder are listed in the exhibit index included herein at page 75.
ITEM 16. FORM 10-K SUMMARY
None.

49
INDEX TO CONSOLIDATED FINANCIAL STATEMENTS
Page
Report of Independent Registered Public Accounting Firm 50
Consolidated Balance Sheets 53
Consolidated Statements of Income 54
Consolidated Statements of Comprehensive Income 55
Consolidated Statements of Stockholders’ Equity 56
Consolidated Statements of Cash Flows 57
Notes to Consolidated Financial Statements 58

50
Report of Independent Registered Public Accounting Firm
To the Stockholders and Board of DirectorsThe Cheesecake Factory Incorporated:
Opinions on the Consolidated Financial Statements and Internal Control Over Financial Reporting
We have audited the accompanying consolidated balance sheets of The Cheesecake Factory Incorporated and subsidiaries (theCompany) as of December 31, 2019 and January 1, 2019, the related consolidated statements of income, comprehensive income,stockholders’ equity, and cash flows for each of the years in the two-year period ended December 31, 2019, and the related notes(collectively, the consolidated financial statements). We also have audited the Company’s internal control over financial reporting as ofDecember 31, 2019, based on criteria established in Internal Control – Integrated Framework (2013) issued by the Committee ofSponsoring Organizations of the Treadway Commission.
In our opinion, the consolidated financial statements referred to above present fairly, in all material respects, the financial position of theCompany as of December 31, 2019 and January 1, 2019, and the results of its operations and its cash flows for each of the years in thetwo-year period ended December 31, 2019, in conformity with U.S. generally accepted accounting principles. Also in our opinion, theCompany maintained, in all material respects, effective internal control over financial reporting as of December 31, 2019 based oncriteria established in Internal Control – Integrated Framework (2013) issued by the Committee of Sponsoring Organizations of theTreadway Commission.
The Company acquired North Italia and the remaining business of Fox Restaurant Concepts LLC (FRC) during 2019, and managementexcluded from its assessment of the effectiveness of the Company’s internal control over financial reporting as of December 31, 2019,North Italia’s and FRC’s internal control over financial reporting associated with 28.3% of total assets and 3.7% of total revenuesincluded in the consolidated financial statements of the Company as of and for the year ended December 31, 2019. Our audit of internalcontrol over financial reporting of the Company also excluded an evaluation of the internal control over financial reporting of North Italiaand FRC.
Change in Accounting Principles
As discussed in Note 1 to the consolidated financial statements, the Company has changed its method of accounting for revenue fromcontracts with customers as of January 3, 2018 due to the adoption of Accounting Standards Codification Topic 606, Revenue fromContracts with Customers, and has changed its method of accounting for leases as of January 2, 2019 due to the adoption ofAccounting Standards Codification Topic 842, Leases.
Basis for Opinions
The Company’s management is responsible for these consolidated financial statements, for maintaining effective internal control overfinancial reporting, and for its assessment of the effectiveness of internal control over financial reporting, included in the accompanyingManagement’s Report on Internal Control over Financial Reporting . Our responsibility is to express an opinion on the Company’sconsolidated financial statements and an opinion on the Company’s internal control over financial reporting based on our audits. We area public accounting firm registered with the Public Company Accounting Oversight Board (United States) (PCAOB) and are required tobe independent with respect to the Company in accordance with the U.S. federal securities laws and the applicable rules andregulations of the Securities and Exchange Commission and the PCAOB.
We conducted our audits in accordance with the standards of the PCAOB. Those standards require that we plan and perform the auditsto obtain reasonable assurance about whether the consolidated financial statements are free of material misstatement, whether due toerror or fraud, and whether effective internal control over financial reporting was maintained in all material respects.
Our audits of the consolidated financial statements included performing procedures to assess the risks of material misstatement of theconsolidated financial statements, whether due to error or fraud, and performing procedures that respond to those risks. Suchprocedures included examining, on a test basis, evidence regarding the amounts and disclosures in the consolidated financialstatements. Our audits also included evaluating the accounting principles used and significant estimates made by management, as wellas evaluating the overall presentation of the consolidated financial statements. Our audit of internal control over financial reportingincluded obtaining an understanding of internal control over financial reporting, assessing the risk that a material weakness exists, andtesting and evaluating the design and operating effectiveness of internal control based on the assessed risk. Our audits also includedperforming such other procedures as we considered necessary in the circumstances. We believe that our audits provide a reasonablebasis for our opinions.

51
Definition and Limitations of Internal Control Over Financial Reporting
A company’s internal control over financial reporting is a process designed to provide reasonable assurance regarding the reliability offinancial reporting and the preparation of financial statements for external purposes in accordance with generally accepted accountingprinciples. A company’s internal control over financial reporting includes those policies and procedures that (1) pertain to themaintenance of records that, in reasonable detail, accurately and fairly reflect the transactions and dispositions of the assets of thecompany; (2) provide reasonable assurance that transactions are recorded as necessary to permit preparation of financial statementsin accordance with generally accepted accounting principles, and that receipts and expenditures of the company are being made only inaccordance with authorizations of management and directors of the company; and (3) provide reasonable assurance regardingprevention or timely detection of unauthorized acquisition, use, or disposition of the company’s assets that could have a material effecton the financial statements.
Because of its inherent limitations, internal control over financial reporting may not prevent or detect misstatements. Also, projections ofany evaluation of effectiveness to future periods are subject to the risk that controls may become inadequate because of changes inconditions, or that the degree of compliance with the policies or procedures may deteriorate.
Critical Audit Matters
The critical audit matters communicated below are matters arising from the current period audit of the consolidated financial statementsthat were communicated or required to be communicated to the audit committee and that: (1) relate to accounts or disclosures that arematerial to the consolidated financial statements and (2) involved our especially challenging, subjective, or complex judgments. Thecommunication of critical audit matters does not alter in any way our opinion on the consolidated financial statements, taken as awhole, and we are not, by communicating the critical audit matters below, providing separate opinions on the critical audit matters or onthe accounts or disclosures to which they relate.
Assessment of carrying value of property and equipment
As discussed in Notes 1 and 6 to the consolidated financial statements, the property and equipment, net, and impairment of assets andlease termination balances as of and for the year ended December 31, 2019 were $832 million and $18 million, respectively. TheCompany assesses the potential impairment of long-lived assets, which includes property and equipment, net, on an annual basis orwhenever events or changes in circumstances indicate the carrying value of the asset or asset group may not be recoverable.
We identified the assessment of the carrying value of property and equipment, net, as a critical audit matter. For some restaurant assetgroups, the estimated undiscounted cash flow of the asset groups were less than their carrying values, which indicated potentialimpairment. This required the Company to estimate the fair value of the asset groups in order to measure the amount of impairmentexpense. The estimates of undiscounted cash flow and fair value resulted in the application of greater auditor judgment. In particular,the revenue growth rate and the operating margin assumptions used to estimate both the undiscounted cash flow and the fair value ofthe restaurant asset groups were challenging to evaluate as minor changes to those assumptions had a potential significant effect onthe Company’s assessment of the carrying value of the restaurant asset groups, and the amount of the related impairment expense.
The primary procedures we performed to address the critical audit matter included the following. We tested certain internal controlsover the Company’s long-lived asset impairment assessment process. This included controls related to the determination of theundiscounted cash flow and fair value of the restaurant asset groups, and the related revenue growth rate and operating marginassumptions. We performed sensitivity analyses over the revenue growth rate and operating margin assumptions to assess theirimpact on the Company’s determination of the undiscounted cash flow and fair value of the restaurant assets groups. We evaluated theCompany’s forecasted revenue growth rate and operating margin assumptions for the restaurant asset groups by comparing theassumptions to the restaurant asset groups’ historical and peer group performance. We compared the Company’s revenue growth rateand operating margin forecasts to actual results to assess the Company’s ability to accurately forecast.
Evaluation of the acquisition-date fair values of trade names and trademarks and remeasurement of previously held equity interests
As discussed in Notes 1, 2 and 7 to the consolidated financial statements, on October 2, 2019, the Company acquired North Italia andthe remaining business of Fox Restaurant Concepts LLC (FRC). As a result of the transaction, the Company acquired trade names andtrademarks representing the names of the restaurant concepts acquired. The acquisition-date fair value for the trade names andtrademark assets are included in intangibles acquired of $337 million. The Company also remeasured previously held equity interests inNorth Italia and Flower Child immediately before the acquisition to acquisition-date fair value of $122 million and recognized a gain of$53 million which is included in gain on investments in unconsolidated affiliates in the consolidated statements of operations.
52
We identified the evaluation of the acquisition-date fair value of the North Italia, Flower Child and other FRC trade names and trademark assets and the remeasurement of previously held equity interests in North Italia and Flower Child as a critical audit matter. A high degree of subjective auditor judgment was involved in evaluating certain inputs to the relief from royalty model used to determine the fair value of the trade names and trademarks, and the discounted cash flow model used to determine the enterprise value of North Italia and Flower Child. The key inputs used in the relief from royalty model included royalty rates, discount rates, and revenue growth rates. The key inputs used in the discounted cash flow model included revenue growth rates, EBITDA as a percentage of revenue, and discount rates. There was limited observable market information and the calculated fair value of such assets was sensitive to possible changes in these key inputs.
The primary procedures we performed to address this critical audit matter included the following. We tested certain internal controlsover the Company’s acquisition-date valuation process, including controls over the key inputs listed above. In connection with ourassessment of the inputs used in the valuation, we compared forecasted revenue growth rates and EBITDA as a percentage ofrevenue to historical actual results and performing sensitivity analyses to assess the impact of changes to the forecasted revenuegrowth rates. In addition, we involved valuation professionals with specialized skills and knowledge, who assisted in:
● evaluating the selected discount rates by comparing them against discount rate ranges that were independently developed usingpublicly available market data;
● assessing the forecasted revenue growth rates and EBITDA as a percentage of revenue by comparing them against revenuegrowth rates and EBITDA as a percentage of revenue of publicly available market data for comparable companies;
● evaluating the selected royalty rates by comparing them against publicly available royalty rates of comparable companies; and● testing the estimates of fair values of the trade name and trademark assets and enterprise values using independently obtained
market data and comparing the results to the Company’s fair value estimates.
Evaluation of the acquisition-date fair value of contingent consideration
As discussed in Notes 1, 2 and 13 to the consolidated financial statements, on October 2, 2019, the Company acquired North Italia andthe remaining business of Fox Restaurant Concepts LLC. The acquisition agreement included a contingent consideration provision, aportion of which was considered part of the acquisition consideration, and the remainder of which was considered future compensationexpense. The acquisition-date fair values for the acquisition consideration and future compensation expense were $13 million and $7million, respectively.
We identified the evaluation of the acquisition-date fair value of the contingent consideration as a critical audit matter. A high degree ofsubjective auditor judgment was required in evaluating certain inputs to the Monte Carlo model used to determine the fair value of thecontingent consideration. Specifically, the key inputs included forecasted revenue growth rates, EBITDA as a percentage of revenueand volatility rate. There was limited observable market information, and the calculated fair value of the contingent consideration wassensitive to possible changes to these key inputs.
The primary procedures we performed to address this critical audit matter included the following. We tested certain internal controlsover the Company’s acquisition-date valuation process, including controls over the key inputs listed above. In connection with ourassessment of the revenue and EBITDA forecasts used in the valuation, we compared forecasted revenue growth rates and EBITDAas a percentage of revenue to historical actual results. In addition, we involved valuation professionals with specialized skills andknowledge, who assisted in:
● assessing the selected volatility rate by comparing it against publicly available volatility rate of comparable companies;● developing estimates of the fair values of the contingent consideration using independently obtained external information and
comparing the results to the Company’s fair value estimates; and● performing sensitivity analyses to assess the impact of reasonably possible changes to the forecasted revenue growth rates and
EBITDA.
/s/ KPMG LLP
We have served as the Company’s auditor since 2018.
Los Angeles, CaliforniaMarch 11, 2020

53
THE CHEESECAKE FACTORY INCORPORATEDCONSOLIDATED BALANCE SHEETS
(In thousands, except share data)
December 31, 2019 January 1, 2019ASSETS
Current assets:Cash and cash equivalents $ 58,416 $ 26,578Accounts receivable 25,619 20,928Income taxes receivable 4,626 —Other receivables 64,683 68,193Inventories 47,225 38,886Prepaid expenses 43,946 40,645
Total current assets 244,515 195,230
Property and equipment, net 831,599 913,275
Other assets:Intangible assets, net 437,207 26,209Prepaid rent — 34,961Operating lease assets 1,240,976 —Investments in unconsolidated affiliates — 79,767Other 86,296 64,691
Total other assets 1,764,479 205,628
Total assets $ 2,840,593 $ 1,314,133
LIABILITIES AND STOCKHOLDERS’ EQUITYCurrent liabilities:
Accounts payable $ 61,946 $ 49,071Income taxes payable — 712Gift card liabilities 187,978 172,336Operating lease liabilities 128,081 —Other accrued expenses 236,582 194,381
Total current liabilities 614,587 416,500
Deferred income taxes 33,847 52,123Deferred rent liabilities — 79,697Deemed landlord financing liabilities — 113,095Long-term debt 290,000 10,000Operating lease liabilities 1,189,869 —Other noncurrent liabilities 140,548 71,659Commitments and contingencies (Note 14)Stockholders’ equity:
Preferred stock, $.01 par value, 5,000,000 shares authorized; none issued — —Common stock, $.01 par value, 250,000,000 shares authorized; 97,685,178 and 96,621,990 sharesissued at December 31, 2019 and January 1, 2019, respectively 977 967Additional paid-in capital 855,989 828,676Retained earnings 1,408,333 1,384,494Treasury stock, 52,916,434 and 51,791,941 shares at cost at December 31, 2019 and January 1,2019, respectively (1,693,122) (1,642,140)Accumulated other comprehensive loss (435) (938)
Total stockholders’ equity 571,742 571,059
Total liabilities and stockholders’ equity $ 2,840,593 $ 1,314,133
See the accompanying notes to the consolidated financial statements.

54
THE CHEESECAKE FACTORY INCORPORATEDCONSOLIDATED STATEMENTS OF INCOME
(In thousands, except per share data)
Fiscal Year 2019 2018 2017
Revenues $ 2,482,692 $ 2,332,331 $ 2,260,502Costs and expenses:
Cost of sales 561,783 532,880 519,388Labor expenses 899,667 834,134 777,595Other operating costs and expenses 631,613 566,825 552,791General and administrative expenses 160,199 154,770 141,533Depreciation and amortization expenses 88,133 95,976 92,729Impairment of assets and lease terminations 18,247 17,861 10,343Acquisition-related costs 5,270 — —Acquisition-related contingent consideration, compensation and amortization expenses 1,033 — —Preopening costs 13,149 10,937 13,278
Total costs and expenses 2,379,094 2,213,383 2,107,657Income from operations 103,598 118,948 152,845Gain/(loss) on investments in unconsolidated affiliates 39,233 (4,754) (479)Interest and other expense, net (2,497) (6,783) (5,900)Income before income taxes 140,334 107,411 146,466Income tax provision/(benefit) 13,041 8,376 (10,926)Net income $ 127,293 $ 99,035 $ 157,392
Net income per share:Basic $ 2.90 $ 2.19 $ 3.35Diluted $ 2.86 $ 2.14 $ 3.27
Weighted average shares outstanding:Basic 43,949 45,263 46,930Diluted 44,545 46,215 48,152
See the accompanying notes to the consolidated financial statements.

55
THE CHEESECAKE FACTORY INCORPORATEDCONSOLIDATED STATEMENTS OF COMPREHENSIVE INCOME
(In thousands)
Fiscal Year 2019 2018 2017
Net income $ 127,293 $ 99,035 $ 157,392Other comprehensive gain/(loss):
Foreign currency translation adjustment 503 (850) (88)Other comprehensive gain/(loss) 503 (850) (88)
Total comprehensive income $ 127,796 $ 98,185 $ 157,304
See the accompanying notes to the consolidated financial statements.

56
THE CHEESECAKE FACTORY INCORPORATEDCONSOLIDATED STATEMENTS OF STOCKHOLDERS’ EQUITY
(In thousands)
AccumulatedShares of Additional OtherCommon Common Paid-in Retained Treasury Comprehensive
Stock Stock Capital Earnings Stock Loss TotalBalance, January 3, 2017 94,672 $ 947 $ 774,137 $ 1,238,012 $ (1,409,889) $ — $ 603,207Net income — — — 157,392 — — 157,392Foreign currency translation adjustment — — — — — (88) (88)Cash dividends declared Common stock, $ 1.06 per share — — — (49,738) — — (49,738)Stock-based compensation — — 16,696 — — — 16,696Common stock issued under stock-based compensationplans 740 7 9,029 — — — 9,036Treasury stock purchases — — — — (122,975) — (122,975)Balance, January 2, 2018 95,412 954 799,862 1,345,666 (1,532,864) (88) 613,530Cumulative effect of adopting the pronouncement relatedto revenue recognition, net of tax — — — (3,560) — — (3,560)Balance, January 2, 2018, as adjusted 95,412 954 799,862 1,342,106 (1,532,864) (88) 609,970Net income — — — 99,035 — — 99,035Foreign currency translation adjustment — — — — — (850) (850)Cash dividends declared Common stock, $ 1.24 per share — — — (56,647) — — (56,647)Stock-based compensation 554 6 20,245 — — — 20,251Common stock issued under stock-based compensationplans 656 7 8,569 — — — 8,576Treasury stock purchases — — — — (109,276) — (109,276)Balance, January 1, 2019 96,622 967 828,676 1,384,494 (1,642,140) (938) 571,059Cumulative effect of adopting the pronouncement relatedto lease accounting, net of tax — — — (41,466) — — (41,466)Balance, January 1, 2019, as adjusted 96,622 967 828,676 1,343,028 (1,642,140) (938) 529,593Net income — — — 127,293 — — 127,293Foreign currency translation adjustment — — — — — 503 503Cash dividends declared Common stock, $ 1.38 per share — — — (61,988) — — (61,988)Stock-based compensation 476 4 19,595 — — — 19,599Common stock issued under stock-based compensationplans 587 6 7,718 — — — 7,724Treasury stock purchases — — — — (50,982) — (50,982)Balance, December 31, 2019 97,685 $ 977 $ 855,989 $ 1,408,333 $ (1,693,122) $ (435) $ 571,742
See the accompanying notes to the consolidated financial statements.

57
THE CHEESECAKE FACTORY INCORPORATEDCONSOLIDATED STATEMENTS OF CASH FLOWS
(In thousands)
Fiscal Year 2019 2018 2017
Cash flows from operating activities:Net income $ 127,293 $ 99,035 $ 157,392
Adjustments to reconcile net income to cash provided by operating activities:Depreciation and amortization expenses 88,133 95,976 92,729Deferred income taxes (2,197) (5,510) (25,180)Impairment of assets and lease terminations 16,223 16,411 10,586Stock-based compensation 19,373 19,988 16,457(Gain)/loss from investments in unconsolidated affiliates (39,233) 4,754 479Changes in assets and liabilities, net of acquired amounts:
Accounts and other receivables 3,777 3,680 (7,188)Income taxes receivable/payable (5,338) 15,729 (17,315)Inventories (5,766) 3,667 (7,634)Prepaid expenses (4,133) 6,262 (5,227)Operating lease assets/liabilities 5,019 — —Other assets (11,989) 7,406 (9,034)Accounts payable 2,326 5,601 3,771Gift card liabilities 9,695 8,395 10,200Other accrued expenses 15,578 9,921 18,760
Cash provided by operating activities 218,761 291,315 238,796
Cash flows from investing activities:Additions to property and equipment (73,765) (102,909) (120,779)Additions to intangible assets (2,100) (3,020) (1,654)Acquisition, net of cash acquired (261,695) — —Investments in unconsolidated affiliates (3,000) (25,000) (18,000)Loans made to unconsolidated affiliates (22,500) — —Proceeds from variable life insurance contract — 540 —
Cash used in investing activities (363,060) (130,389) (140,433)
Cash flows from financing activities:Deemed landlord financing proceeds — 21,788 12,128Deemed landlord financing payments — (5,128) (4,391)Borrowings on credit facility 335,000 70,000 85,000Repayments on credit facility (55,000) (70,000) (75,000)Proceeds from exercise of stock options 7,724 8,576 9,036Cash dividends paid (60,722) (56,251) (49,889)Treasury stock purchases (50,982) (109,276) (122,975)
Cash provided by/(used in) financing activities 176,020 (140,291) (146,091)Foreign currency translation adjustment 117 (65) (103)Net change in cash and cash equivalents 31,838 20,570 (47,831)Cash and cash equivalents at beginning of period 26,578 6,008 53,839Cash and cash equivalents at end of period $ 58,416 $ 26,578 $ 6,008
Supplemental disclosures:Interest paid $ 1,646 $ 8,156 $ 7,128Income taxes paid $ 20,778 $ 10,149 $ 31,582Construction payable $ 6,504 $ 4,585 $ 12,145
Non-cash operating:Settlement of sale-leaseback accounting $ — $ 11,863 $ —
Non-cash investing:Settlement of landlord sale-leaseback accounting $ — $ 6,824 $ —Acquisition-related deferred consideration and compensation $ (66,257) $ — $ —Fair value of previously-held equity investments $ (122,000) $ — $ —Loans repaid by unconsolidated affiliates as a reduction of acquisition cash $ 12,500 $ — $ —Loan to unconsolidated affiliate assumed in acquisition $ 10,000 $ — $ —
Non-cash financing:Settlement of landlord financing obligation for sale-leaseback leases $ — $ (18,687) $ —Deemed landlord financing proceeds $ — $ 13,748 $ —
See the accompanying notes to the consolidated financial statements.

58
THE CHEESECAKE FACTORY INCORPORATEDNOTES TO CONSOLIDATED FINANCIAL STATEMENTS
1. Summary of Significant Accounting Policies
Description of Business
The Cheesecake Factory Incorporated is a leader in experiential dining. We are culinary forward and relentlessly focused onhospitality. We currently own and operate 294 restaurants throughout the United States and Canada under brands including TheCheesecake Factory®, North Italia® and a collection within the Fox Restaurant Concepts ("FRC") subsidiary. Internationally, 26 TheCheesecake Factory® restaurants operate under licensing agreements. Our bakery division operates two facilities that produce qualitycheesecakes and other baked products for our restaurants, international licensees and third-party bakery customers.
Basis of Presentation
The accompanying consolidated financial statements include the accounts of The Cheesecake Factory Incorporated and itswholly owned subsidiaries (referred to herein collectively as the “Company,” “we,” “us” and “our”) and are prepared in accordance withaccounting principles generally accepted in the United States of America (“GAAP”). All intercompany accounts and transactions for theperiods presented have been eliminated in consolidation.
On October 2, 2019, we completed the acquistion of North Italia and the remaining business of FRC, including Flower Childand all other FRC brands. The results of operations, financial position and cash flows of the acquired businesses are included in ourconsolidated financial statements as of the acquisition date. See Note 2 for further discussion of the Acquisition.
We utilize a 52/53-week fiscal year ending on the Tuesday closest to December 31 for financial reporting purposes. Fiscal years 2019, 2018 and 2017 each consisted of 52 weeks.
Use of Estimates
The preparation of financial statements in conformity with GAAP requires us to make estimates and assumptions for the reporting periods covered by the financial statements. These estimates and assumptions affect the reported amounts of assets, liabilities, revenues and expenses, and the disclosure of contingent liabilities. Actual results could differ from these estimates.
Business Combination
On October 2, 2019, we completed the acquisition of North Italia and the remaining business of FRC. Since the Acquisitionrepresents a business combination achieved in stages, we remeasured our previously-held equity interests in North Italia and FlowerChild immediately before the acquisition to acquisition-date fair value and recognized a resulting gain. In accordance with theacquisition method of accounting for business combinations, we allocated the purchase price of acquired businesses to the tangibleand intangible assets acquired and liabilities assumed based on preliminary estimated fair values. We estimated the fair value of assetsand liabilities based upon widely-accepted valuation techniques, including discounted cash flow, relief from royalty and Monte Carlomethods, depending on the nature of the assets acquired or liabilities assumed. We expect minor adjustments to our purchaseaccounting in the first quarter of fiscal 2020 as we finalize our valuation of the acquired intangible assets. (See Note 2 for furtherdiscussion of the Acquisition.)
Cash and Cash Equivalents
Amounts receivable from credit card processors, totaling $ 21.2 million and $17.3 million at December 31, 2019 and January 1,2019, respectively, are considered cash equivalents because they are both short-term and highly liquid in nature and are typicallyconverted to cash within three days of the sales transaction. Our cash management system provides for the funding of all major bank disbursement accounts on a daily basis as checks are presented for payment. Under this system, outstanding checks are in excess of the cash balances at certain banks, which creates book overdrafts. Book overdrafts are presented as a current liability in other accrued expenses on our consolidated balance sheet.

59
Accounts and Other Receivables
Our accounts receivable principally result from credit sales to bakery customers. Other receivables consist primarily of amounts due from our gift card distributors and landlords.
Concentration of Credit Risk
Financial instruments that potentially subject us to a concentration of credit risk are cash and cash equivalents and receivables. We maintain our day-to-day operating cash balances in non-interest-bearing transaction accounts, which are insured by the Federal Deposit Insurance Corporation (“FDIC”) up to $250,000. We invest our excess cash in a money market deposit account, which is insured by the FDIC up to $250,000. Although we maintain balances that exceed the federally insured limit, we have not experienced any losses related to this balance, and we believe credit risk to be minimal.
We consider the concentration of credit risk for accounts receivable to be minimal due to the payment histories and general financial condition of our larger bakery customers. Concentration of credit risk related to other receivables is limited as this balance is comprised primarily of amounts due from our gift card distributors and landlords.
Fair Value Measurements
Fair value measurements are estimated based on valuation techniques and inputs categorized as follows:
● Level 1: Quoted prices in active markets for identical assets or liabilities.
● Level 2: Observable inputs other than quoted prices in active markets for identical assets and liabilities
● Level 3: Unobservable inputs in which little or no market activity exists, therefore requiring the Company to develop its ownassumptions
The following tables present the components and classification of our assets and liabilities that are measured at fair value on arecurring basis (in thousands):
December 31, 2019 Level 1 Level 2 Level 3
Assets (Liabilities) Non-qualified deferred compensation assets $ 77,228 $ — $ —Non-qualified deferred compensation liabilities (76,255) — —Acquisition-related deferred consideration — (53,933) —Acquisition-related contingent consideration andcompensation liabilities — — (13,218)
January 1, 2019 Level 1 Level 2 Level 3
Assets (Liabilities)Non-qualified deferred compensation assets $ 57,606 $ — $ —Non-qualified deferred compensation liabilities (57,551) — —Deemed landlord financing liabilities — (118,600) —
Changes in the fair value of non-qualified deferred compensation assets and liabilities and deemed landlord financing liabilitiesare recognized in interest and other expense, net in our consolidated statements of income. Changes in the fair value of theacquisition-related deferred and contingent consideration and compensation liabilities are recognized in acquisition-related contingentconsideration, compensation and amortization expenses in our consolidated statements of income.

60
The fair value of the acquisition-related contingent consideration and compensation liabilities was determined utilizing a MonteCarlo model based on estimated future revenues, margins and volatility factors, among other variables and estimates and has nominimum or maximum payment. The undiscounted range of outcomes per the Monte Carlo model was $0 to $69.2 million. Resultscould change materially if different estimates and assumptions were used. The following table presents a reconciliation of the beginningand ending amounts of the fair value of the acquisition-related contingent consideration and compensation liabilities, categorized asLevel 3 (in thousands):
Balance, January 1, 2019 $ —Acquisition-date fair value 12,786Change in fair value 432
Balance, December 31, 2019 $ 13,218
The fair values of our cash and cash equivalents, accounts receivable, income taxes receivable, other receivables, prepaidexpenses, accounts payable, income taxes payable and other accrued expenses approximate their carrying amounts due to their shortduration.
Inventories
Inventories consist of restaurant food and other supplies, bakery raw materials and bakery finished goods and are stated at thelower of cost or net realizable value on an average cost basis at the restaurants and on a first-in, first-out basis at the bakeries.
Property and Equipment
We record property and equipment at cost less accumulated depreciation. Improvements are capitalized while repairs and maintenance costs are expensed as incurred. Depreciation and amortization are calculated using the straight-line method over the estimated useful life of the assets or the lease term, whichever is shorter. Leasehold improvements include the cost of our internal development and construction department. Depreciation and amortization periods are as follows:
Buildings and land improvements 25 to 30 yearsLeasehold improvements 10 to 30 yearsFurnishings, fixtures and equipment 3 to 15 yearsComputer software and equipment 5 years
Gains and losses related to property and equipment disposals are recorded in depreciation and amortization expenses.
Intangible Assets
Our intangible assets consist primarily of goodwill, indefinite-lived trade names,trademarks and transferable alcoholic beveragelicenses and definite-lived licensing agreements and non-transferable alcoholic beverage licenses. Definite-lived intangible assets areamortized on a straight-line basis over their estimated useful lives and reviewed for impairment whenever events or changes incircumstances indicate that the carrying amount of an asset or asset group may not be recoverable based on estimated undiscountedfuture cash flows. If impaired, the asset or asset group is written down to fair value based on discounted future cash flows. Amortizationis recorded in acquisition-related contingent consideration, compensation and amortization expenses in our consolidated statements ofincome.
Goodwill and other indefinite-lived intangible assets are not amortized but are instead tested for impairment annually as of thefirst day of our fiscal fourth quarter or on an interim basis if events or changes in circumstances between annual tests indicate apotential impairment. First, we determine if, based on qualitative factors, it is more likely than not that an impairment exists. Factorsconsidered include, but are not limited to historical financial performance, a significant decline in expected future cash flows,unanticipated competition, changes in management or key personnel, macroeconomic and industry conditions and the legal andregulatory environment. If the qualitative assessment indicates that it is more likely than not that an impairment exists, then aquantitative assessment is performed. The quantitative assessment requires an analysis of several best estimates and assumptions,including future sales and operating results and other factors that could affect fair value or otherwise indicate potential impairment. Wealso consider our reporting units’ projected ability to generate income from operations and positive cash flow in future periods.

61
We evaluate the useful lives of our intangible assets, other than goodwill, at each reporting period to determine if they aredefinite or indefinite-lived. A determination on useful life requires judgments and assumptions regarding the future effects ofobsolescence, demand, competition, other economic factors (such as the stability of the industry, legislative action that results in anuncertain or changing regulatory environment and expected changes in distribution channels), the level of required maintenanceexpenditures and the expected lives of other related groups of assets.
Impairment of Long-Lived Assets and Lease Terminations
We assess the potential impairment of our long-lived assets on an annual basis or whenever events or changes incircumstances indicate the carrying value of the assets or asset group may not be recoverable. Factors considered include, but are notlimited to, negative cash flow, significant underperformance relative to historical or projected future operating results, significantchanges in the manner in which an asset is being used, an expectation that an asset will be disposed of significantly before the end ofits previously estimated useful life and significant negative industry or economic trends. At any given time, we may be monitoring asmall number of locations, and future impairment charges could be required if individual restaurant performance does not improve orwe make the decision to close or relocate a restaurant.
We have determined that our asset group for impairment testing is comprised of the assets and liabilities of each of ourindividual restaurants, as this is the lowest level of identifiable cash flows. We have identified leasehold improvements as the primaryasset because it is the most significant component of our restaurant assets, it is the principal asset from which our restaurants derivetheir cash flow generating capacity and it has the longest remaining useful life. The recoverability is assessed by comparing thecarrying value of the assets to the undiscounted cash flows expected to be generated by these assets. Impairment losses are measuredas the amount by which the carrying values of the assets exceed their fair value, which is determined based on discounted future netcash flows expected to be generated by the assets.
In fiscal 2019, we recorded $ 18.2 million of impairment of assets and lease termination expense related to the impairment oftwo The Cheesecake Factory restaurants, one Grand Lux Cafe and Social Monk Asian Kitchen and the closure of one Grand Lux Cafeand one RockSugar Southeast Asian Kitchen. In fiscal 2018, we recorded $ 17.9 million of impairment of assets and lease terminationexpense related to the impairment of one The Cheesecake Factory restaurant, one Grand Lux Cafe and one RockSugar SoutheastAsian Kitchen and the closure of two The Cheesecake Factory restaurants. In fiscal 2017, we recorded $10.3 million of impairment ofassets and lease termination expense related to three The Cheesecake Factory restaurants, including one relocation and one leaseexpiration, and one Grand Lux Cafe. These amounts are recorded in impairment of assets and lease terminations on the consolidatedstatements of income.
Investments in Unconsolidated Affiliates
During fiscal years 2018, 2017 and until the Acquisition on October 2, 2019, we made minority equity investments in tworestaurant concepts, North Italia and Flower Child, bringing our percentage of ownership to 49% in both concepts immediately prior tothe Acquisition. Since we held a number of rights with regard to participation in policy-making processes, but did not control theseentities prior to the Acquisition, we accounted for these investments under the equity method. Accordingly, we recognized ourproportionate share of the reported earnings or losses of these entities on the consolidated statements of income and as an adjustmentto our investments on the consolidated balance sheets.
Prior to the Acquisition, we assessed the potential impairment of our equity investments whenever events or changes incircumstances indicated that a decrease in value of the investment had occurred that was other than temporary, in which case wewould recognize the decrease even though it is in excess of what would otherwise be recognized by application of the equity method.No impairment losses were recorded for these assets during fiscal years 2019, 2018 and 2017.
Revenue Recognition
Our revenues consist of sales at our Company-owned restaurants, sales from our bakery operations to our licensees and otherthird-party customers, royalties from our licensees’ restaurant sales and from consumer packaged goods sales, and licenseedevelopment and site fees. Revenues are presented net of sales taxes. Sales tax collected is included in other accrued expenses untilthe taxes are remitted to the appropriate taxing authorities.

62
Revenues from restaurant sales are recognized when payment is tendered at the point of sale. Revenues from bakery salesare recognized upon transfer of title and risk to customers. Royalty revenues are recognized in the period the related sales occur,utilizing the sale-based royalty exception available under current accounting guidance. Our consumer packaged goods minimumguarantees do not require distinct performance obligations. Therefore, related revenue is recognized on a straight-line basis over thelife of the applicable agreements, ranging from one to three years. As our development and site fee agreements do not contain distinctperformance obligations, related revenue is recognized on a straight-line basis over the life of the applicable agreements, ranging fromeight to 30 years.
In fiscal 2019, we deferred revenue of $ 0.2 million for new minimum guarantees for consumer packaged goods and recognizedminimum guarantee revenue of $0.5 million. In fiscal 2019, we deferred revenue of $ 0.3 million for new site and developmentagreements and recognized revenue of $0.5 million. In fiscal 2018, we deferred revenue of $ 0.9 million for new minimum guarantees forconsumer packaged goods and recognized minimum guarantee revenue of $0.8 million. In fiscal 2018, we deferred revenue of $ 0.2million for new site and development agreements and recognized revenue of $0.4 million. Prior to the adoption of the new revenuerecognition standard in 2018, we recognized revenue for development fees upon execution of new development agreements and forsite fees upon our approval of new restaurant sites.
We recognize a liability upon the sale of our gift cards and recognize revenue when these gift cards are redeemed in our restaurants. Based on our historical redemption patterns, we can reasonably estimate the amount of gift cards for which redemption is remote, which is referred to as “breakage.” Breakage is recognized over a three-year period in proportion to historical redemption trends and is classified as revenues in our consolidated statements of income. We recognized $8.0 million, $8.0 million and $7.9 million of gift card breakage in fiscal years 2019, 2018 and 2017, respectively. Incremental direct costs related to gift card sales, including commissions and credit card fees, are deferred and recognized in earnings in the same pattern as the related gift card revenue. There were no changes to our accounting for gift card revenue and related costs upon adoption of the new revenue recognition standard.
Certain of our promotional programs include multiple element arrangements that incorporate various performance obligations.We allocate revenue using the relative selling price of each performance obligation considering the likelihood of redemption andrecognize revenue upon satisfaction of each performance obligation. During fiscal 2019, we deferred revenue of $7.9 million related topromotional programs and recognized $7.3 million of previously deferred revenue related to promotional programs. During fiscal 2018,we deferred revenue of $7.0 million related to promotional programs and recognized $ 5.9 million of previously deferred revenue relatedto promotional programs.
(See Recent Accounting Pronouncements for further discussion of our adoption of the new revenue recognition accounting guidance.)
Leases
We currently lease all of our restaurant locations, generally with initial terms of 10 to 20 years plus two five-year renewaloptions. Our leases typically require contingent rent above the minimum base rent payments based on a percentage of revenuesranging from 2% to 10%, have escalating minimum rent requirements over the term of the lease and require payment for variousexpenses incidental to the use of the property. A majority of our leases provide for a reduced level of overall rent obligation shouldspecified co-tenancy requirements not be satisfied. We expend cash for leasehold improvements and furniture, fixtures, and equipmentto build out and equip our leased premises. We may also expend cash for structural additions that we make to leased premises.Generally, a portion of the leasehold improvements and building costs are reimbursed to us by our landlords as constructioncontributions. If obtained, landlord construction contributions usually take the form of up-front cash, full or partial credits against ourfuture minimum or percentage rents, or a combination thereof. We do not meet any of the accounting criteria under FinancialAccounting Standards Board (“FASB”) Accounting Standards Codification (“ASC”) Topic 842, Leases, for being the owner of the assetunder construction. Many of our leases provide early termination rights permitting us to terminate the lease prior to expiration in theevent our revenues are below a stated level for a period of time, generally conditioned upon repayment of the unamortized landlordcontributions.
In addition to leases for our restaurant locations, we also lease automobiles and certain equipment that is used in therestaurants, bakeries and corporate office. The automobile leases are the only non-real estate leases included in our operating leaseassets and liabilities. All other leases are immaterial or qualify for the short-term lease exclusion.
The assessment of whether a contract is or contains a lease is performed at contract inception. A lease is defined as a contractthat conveys the right to control the use of an identified asset for a period of time in exchange for consideration. Control is defined ashaving both the right to obtain substantially all the economic benefits from the use of the asset and to direct how and for what purposethe asset is used.

63
At lease commencement, we evaluate each lease to determine its appropriate classification as an operating or finance lease.All of our restaurant and automobile leases are classified as operating leases. For restaurant leases existing at transition, we willcontinue to apply our historical practice of excluding executory costs, and only minimum base rent will be factored into the initialoperating lease liability and corresponding lease asset. For restaurant leases beginning after adoption of ASC 842, we have elected thesingle lease component practical expedient. Operating lease assets and liabilities are recorded on the balance sheet at leasecommencement based on the present value of minimum base rent and other fixed payments over the reasonably certain lease term.The difference between the amounts we expend for structural costs and the construction contributions received from our landlords isrecorded as an adjustment to the operating lease asset. Lease terms include the build-out period for our leases where no rentpayments are typically due under the terms of the lease, as well as options to renew when we deem we have significant economicincentive to exercise the extension. When determining if we have a significant economic incentive, we consider relevant factors, suchas contractual, asset, entity and market-based considerations. Option periods are included in the lease term for the majority of ourleases. Termination rights have not been factored into the lease terms since based on our probability assessment we are reasonablycertain we will not terminate our leases.
We cannot determine the interest rate implicit in our leases because we do not have access to the lessor’s estimated residualvalue or the amount of the lessor’s deferred initial direct costs. Therefore, we use our incremental borrowing rate as the discount ratefor our leases. Our incremental borrowing rate for a lease is the rate of interest we would have to pay on a collateralized basis toborrow an amount equal to the lease payments under similar terms. Because we do not generally borrow on a collateralized basis, wederive an appropriate incremental borrowing rate using the interest rate we pay on our non-collateralized borrowings, adjusted for theamount of the lease payments, the lease term and the effect of designating specific collateral with a value equal to the unpaid leasepayments for that lease. We apply the incremental borrowing rate on a portfolio basis given the impact of applying it on a lease bylease basis would be immaterial.
We monitor for events or changes in circumstances that require reassessment of our leases. When a reassessment results inthe re-measurement of a lease liability, a corresponding adjustment is made to the carrying amount of the operating lease asset. Wealso assess the potential impairment of our operating lease assets under long-lived asset impairment guidance in ASC 360, Property,Plant, and Equipment: Impairment or disposal on long-lived assets.
Rent expense included in our operating lease assets is recognized on a straight-line basis. Contingent rent expense isrecorded as incurred to the extent it exceeds minimum base rent per the lease agreement. Variable lease payments, which primarilyconsist of real estate taxes, common area maintenance charges, insurance cost and other operating expenses, are not included in theoperating lease right-of-use asset or operating lease liability balances and are recognized as incurred. The reasonably certain leaseterm and the incremental borrowing rate for each restaurant location require judgment by management and can impact theclassification and accounting for a lease as operating or finance, as well as the value of the operating lease asset and liability. Thesejudgments may produce materially different amounts of rent expense than would be reported if different assumptions were used. Rentexpense is included in other operating costs and expenses in the consolidated statements of income.
Self-Insurance Liabilities
We retain the financial responsibility for a significant portion of our risks and associated liabilities with respect to workers’ compensation, general liability, staff member health benefits, employment practices and other insurable risks. The accrued liabilities associated with these programs are based on our estimate of the ultimate costs to settle known claims, as well as claims incurred but not yet reported to us (“IBNR”) as of the balance sheet date and are recorded in other accrued expenses. Our estimated liabilities, which are not discounted, are based on information provided by our insurance brokers and insurers, combined with our judgment regarding a number of assumptions and factors, including the frequency and severity of claims, claims development history, case jurisdiction, applicable legislation and our claims settlement practices.
Stock-Based Compensation
We maintain stock-based incentive plans under which equity awards may be granted to staff members and consultants. We account for the awards based on fair value measurement guidance and amortize to expense over the vesting period using a straight-line or graded-vesting schedule, as applicable. (See Note 16 for further discussion of our stock-based compensation.)
Advertising Costs
We expense advertising production costs at the time the advertising first takes place. All other advertising costs are expensedas incurred. Most of our advertising costs are included in other operating costs and expenses and were $10.6 million, $6.1 million and$6.1 million in fiscal 2019, 2018 and 2017, respectively.
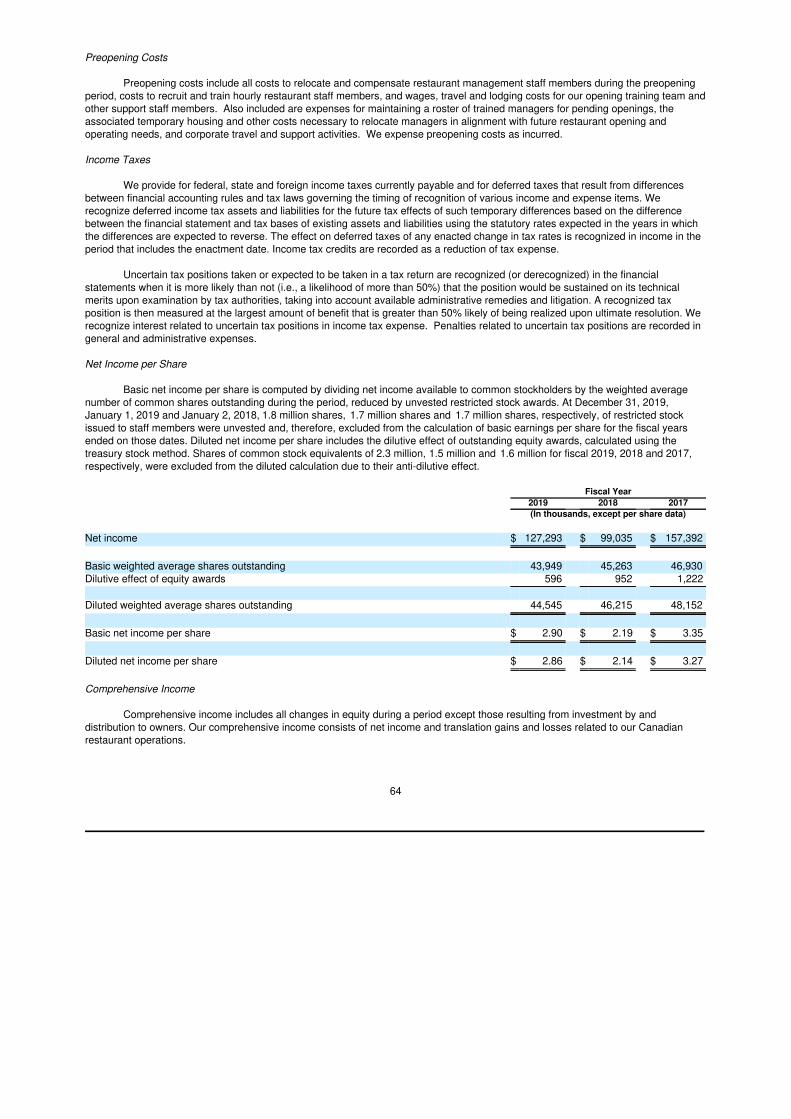
64
Preopening Costs
Preopening costs include all costs to relocate and compensate restaurant management staff members during the preopening period, costs to recruit and train hourly restaurant staff members, and wages, travel and lodging costs for our opening training team and other support staff members. Also included are expenses for maintaining a roster of trained managers for pending openings, the associated temporary housing and other costs necessary to relocate managers in alignment with future restaurant opening and operating needs, and corporate travel and support activities. We expense preopening costs as incurred.
Income Taxes
We provide for federal, state and foreign income taxes currently payable and for deferred taxes that result from differencesbetween financial accounting rules and tax laws governing the timing of recognition of various income and expense items. Werecognize deferred income tax assets and liabilities for the future tax effects of such temporary differences based on the differencebetween the financial statement and tax bases of existing assets and liabilities using the statutory rates expected in the years in whichthe differences are expected to reverse. The effect on deferred taxes of any enacted change in tax rates is recognized in income in theperiod that includes the enactment date. Income tax credits are recorded as a reduction of tax expense.
Uncertain tax positions taken or expected to be taken in a tax return are recognized (or derecognized) in the financial statements when it is more likely than not (i.e., a likelihood of more than 50%) that the position would be sustained on its technical merits upon examination by tax authorities, taking into account available administrative remedies and litigation. A recognized tax position is then measured at the largest amount of benefit that is greater than 50% likely of being realized upon ultimate resolution. We recognize interest related to uncertain tax positions in income tax expense. Penalties related to uncertain tax positions are recorded in general and administrative expenses.
Net Income per Share
Basic net income per share is computed by dividing net income available to common stockholders by the weighted averagenumber of common shares outstanding during the period, reduced by unvested restricted stock awards. At December 31, 2019,January 1, 2019 and January 2, 2018, 1.8 million shares, 1.7 million shares and 1.7 million shares, respectively, of restricted stockissued to staff members were unvested and, therefore, excluded from the calculation of basic earnings per share for the fiscal yearsended on those dates. Diluted net income per share includes the dilutive effect of outstanding equity awards, calculated using thetreasury stock method. Shares of common stock equivalents of 2.3 million, 1.5 million and 1.6 million for fiscal 2019, 2018 and 2017,respectively, were excluded from the diluted calculation due to their anti-dilutive effect.
Fiscal Year 2019 2018 2017
(In thousands, except per share data)
Net income $ 127,293 $ 99,035 $ 157,392
Basic weighted average shares outstanding 43,949 45,263 46,930Dilutive effect of equity awards 596 952 1,222
Diluted weighted average shares outstanding 44,545 46,215 48,152
Basic net income per share $ 2.90 $ 2.19 $ 3.35
Diluted net income per share $ 2.86 $ 2.14 $ 3.27
Comprehensive Income
Comprehensive income includes all changes in equity during a period except those resulting from investment by anddistribution to owners. Our comprehensive income consists of net income and translation gains and losses related to our Canadianrestaurant operations.

65
Foreign Currency
The Canadian dollar is the functional currency for our Canadian restaurant operations. Revenue and expense accounts aretranslated into U.S. dollars using the average exchange rates during the reporting period. Assets and liabilities are translated using theexchange rates in effect at the reporting period end date. Equity accounts are translated at historical rates, except for the change inretained earnings which is the result of the income statement translation process. Translation gains and losses are reported as aseparate component in our consolidated statements of comprehensive income and would only be realized upon the sale or uponcomplete or substantially complete liquidation of the business. Gains and losses from foreign currency transactions are recognized inour consolidated statements of income in interest and other expense, net.
Recent Accounting Pronouncements
Recently Adopted Accounting Standards
We adopted FASB Accounting Standards Codification (“ASC”) Topic 842, Leases, as of January 2, 2019, using the alternativetransition method and recorded a cumulative effect adjustment to beginning retained earnings without restating prior periods. Weelected the package of practical expedients which allowed us to carry forward our historical lease classification, our assessment ofwhether a contract is or contains a lease and our initial direct costs for any leases that existed prior to adoption of the new standard. Inaddition, we elected the short-term lease exclusion and the hindsight practical expedient, which lengthened the lease term for certainof our leases to include renewal options. Adoption of the new standard resulted in the recognition of operating lease assets andliabilities of $975.1 million and $1,045.4 million, respectively, and a reduction to retained earnings of $ 41.5 million, net of tax. All priorlease-related balances of $39.2 million of prepaid rent, $ 140.2 million in property and equipment, net, $ 6.2 million of intangible assets,net, $82.1 million of deferred rent liabilities and $ 118.7 million of deemed landlord financing were reclassified into operating leaseassets or eliminated upon ASC 842 adoption.
We adopted ASC Topic 606, Revenue from Contracts with Customers, as of January 3, 2018. This accounting guidanceprovides a comprehensive new revenue recognition model that supersedes most of the existing revenue recognition requirements andrequires entities to recognize revenue at an amount that reflects the consideration to which a company expects to be entitled inexchange for transferring goods or services to a customer. Utilizing the cumulative-effect method of adoption, we recorded a $4.8million increase to deferred revenue and a corresponding reduction of $3.6 million, net of tax, to retained earnings to reverse a portionof the previously-recognized development and site fees from our international licensees. Whereas previously we recognized incomeand received payment upon execution of the agreements and approval of new restaurant sites, respectively, future revenue for theseitems will be recorded on a straight-line basis over the life of the applicable license agreements as the agreements do not containdistinct performance obligations. Comparative financial information has not been restated and continues to be reported under theaccounting standards in effect for those periods. The impact of adopting this standard as compared to the previous revenue recognitionguidance was not material to our consolidated balance sheet and consolidated statements of income and comprehensive income.
Recently Issued Accounting Standards
In August 2018, the FASB issued ASU 2018-13, Fair Value Measurement (Topic 820): Disclosure Framework - Changes to theDisclosure Requirements for Fair Value Measurement. The update eliminates, adds and modifies certain disclosure requirements forfair value measurements. The new standard is effective for us on January 1, 2020. We have substantially completed our assessment ofthe new standard and do not expect its adoption to have a significant impact on our consolidated financial statement disclosures.
2. Acquisition
On October 2, 2019 (the “Closing Date” or “Closing”), we completed the acquisition of North Italia and the remaining businessof Fox Restaurant Concepts LLC, including Flower Child and all other FRC brands. North Italia is a restaurant company that operated21 locations across ten states and Washington D.C. as of the Closing Date. FRC is a multi-concept restaurant company that operated10 concepts with 47 locations across eight states and Washington D.C. as of the Closing Date. The results of operations, financial position and cash flows of the acquired businesses are included in our consolidated financial statements as of the acquisition date.
We have concluded that the Acquisition represents a single business combination of related businesses under common controlwithin the scope of ASC Topic 805, Business Combinations. The acquisition date was determined to be the Closing Date, which wasthe date we obtained control by legally transferring the consideration for the remaining ownership interests, acquiring the assets andassuming the liabilities of North Italia and the remaining FRC business.

66
The Acquisition, which we expect will accelerate and diversify our revenue growth, was completed for consideration consistingof the following components: $288.1 million in cash at Closing, which was primarily funded by drawing on the New Facility; assumptionof $10.0 million in debt previously owed by FRC to us; a $ 12.0 million indemnity escrow amount specifically related to North Italia dueratably over the next two years; and $45.0 million of deferred consideration due ratably over the next four years (including a $13.0million indemnity escrow amount specifically related to the remaining FRC businesses).
The acquisition agreement also included a contingent consideration provision, a portion of which was considered part of theacquisition consideration, and the remainder of which was considered future compensation expense. The acquisition-date fair values forthe acquisition consideration and future compensation expense were $12.8 million and $7.3 million, respectively. The contingentconsideration is payable on the fifth anniversary of the Closing Date and is based on achievement of revenue and profitability targetsfor the FRC brands other than North Italia and Flower Child with considerations made in the event we undergo a change in control ordivest any FRC brand (other than North Italia and Flower Child) during the five years after Closing. We are also required to providefinancing to FRC in an amount sufficient to support achievement of these targets during the five years after Closing. The fair value ofthe contingent consideration and compensation liabilities was determined utilizing a Monte Carlo model based on estimated futurerevenues and volatility factors, among other variables and estimates, and has no maximum payment. The undiscounted range ofoutcomes per the Monte Carlo model was $0 to $69.2 million. The fair value will be evaluated each reporting period and the contingentconsideration will be adjusted accordingly. The assumption of debt previously owed by North Italia to us represents the effectivesettlement of a preexisting relationship. Since we determined the loans were at market terms, the debt assumed was treated aspurchase consideration, and no gain or loss was recorded.
Since the Acquisition represents a business combination achieved in stages, we remeasured our previously-held equityinterests in North Italia and Flower Child immediately before the acquisition to acquisition-date fair value of $122.0 million andrecognized a resulting gain of $52.7 million which is included in gain/(loss) on investments in unconsolidated affiliates in ourconsolidated statements of operations. The fair value of the previously-held interests was determined using a discounted cash flowmodel based on estimated future revenues, margins and discount rates, among other variables and estimates.
The following table summarizes the preliminary calculation of goodwill based on the excess of consideration transferred andthe fair value of the previously held equity interests over the fair value of the assets acquired and liabilities assumed (in thousands).
December 31, 2019Purchase consideration:
Cash at closing $ 288,089Assumption of debt previously owed by FRC 10,000Deferred payments 53,471Contingent consideration 12,786
Consideration transferred 364,346Fair value of previously-held equity interests 122,000
Total 486,346Less net assets acquired:
Current assets 23,682Property and equipment 84,360Intangible assets 338,782Operating lease assets 223,455Other assets 5,842Current liabilities (64,814)Operating lease liabilities (202,433)Other noncurrent liabilities (883)
Total net assets acquired 407,991Goodwill $ 78,355
Goodwill is related to the benefits expected as result of the Acquisition, including acceleration and diversification of our revenuegrowth, and of the $78.4 million recorded as preliminary goodwill, $73.1 million is expected to be deductible for tax purposes. $ 29.2million of the goodwill recorded relates to North Italia.
Property and equipment will be depreciated over useful lives of 3 years to 30 years. The fair value of acquired property andequipment was determined under a trended original cost approach utilizing variables and estimates such as useful lives, hold factorsand economic obsolescence.

67
Intangible assets acquired primarily consist of trade names and trademarks that were assigned indefinite lives based on theexpected use of the assets and the regulatory and economic environment within which they are being used. The fair value of theacquired intangible assets was determined utilizing the relief from royalty method based on estimated future revenues, royalty ratesand discount rates, among other variables and estimates. We expect minor adjustments to our purchase accounting in the first quarterof fiscal 2020 as we finalize our valuation of the acquired intangible assets.
Operating lease assets include values associated with favorable and unfavorable market leases that will amortize over aweighted-average period of 15.2 years. The fair value of the operating lease assets was derived using an income approach based onmarket transaction data and estimated discount rates, among other variables and estimates.
During fiscal 2019, we incurred $ 5.3 million of costs to effect and integrate the Acquisition, which were expensed in accordancewith ASC 805 and are included in acquisition-related costs in our consolidated statements of operations. In addition, we incurred $1.0million related to changes in the fair value of the deferred and contingent consideration and compensation liabilities, as well asamortization of acquired definite-lived licensing agreements, which are included in acquisition-related contingent consideration,compensation and amortization expenses in our consolidated statements of operations.
Pro Forma Results of Operations (unaudited)
The following pro forma results of operations for fiscal 2019 and 2018 give effect to the Acquisition as if it had occurred onJanuary 2, 2018 (in thousands):
Fiscal Year 2019 2018
Revenues $ 2,732,901 $ 2,579,019Net income 74,949 80,800Net income per share:
Basic 1.71 1.79Diluted $ 1.68 $ 1.75
The above pro forma information includes combined North Italia and FRC actual revenues and net loss of $ 92.0 million and$1.5 million, respectively, contributed post acquisition in fiscal 2019. The most significant adjustments included in the pro formafinancial information are the elimination of the gain/(loss) on our previously-held equity interests in North Italia and Flower Child,elimination of transaction costs, increased interest expense associated with debt incurred to fund the Acquisition, elimination ofhistorical FRC interest expense and corresponding income tax effects.
In the opinion of the Company’s management, the unaudited pro forma financial information includes all significant necessaryadjustments that can be factually supported to reflect the effects of the Acquisition and related transactions. The unaudited pro formafinancial information is provided for informational purposes only and are not necessarily indicative of what our actual results ofoperations would have been had the Acquisition and related transactions been completed as of January 2, 2018 or that may beachieved in the future.
3. Other Receivables
Other receivables consisted of (in thousands):
December 31, 2019 January 1, 2019
Gift card distributors $ 38,947 $ 41,996Insurance providers 9,646 9,020Landlord construction contributions 3,501 4,976Other 12,589 12,201
Total $ 64,683 $ 68,193

68
4. Inventories
Inventories consisted of (in thousands):
December 31, 2019 January 1, 2019
Restaurant food and supplies $ 25,057 $ 18,362Bakery finished goods and work in progress 16,000 13,845Bakery raw materials and supplies 6,168 6,679
Total $ 47,225 $ 38,886
5. Prepaid Expenses
Prepaid expenses consisted of (in thousands):
December 31, 2019 January 1, 2019
Gift card contract assets $ 23,172 $ 23,388Other 20,774 17,257
Total $ 43,946 $ 40,645
6. Property and Equipment
Property and equipment consisted of (in thousands):
December 31, 2019 January 1, 2019
Land and related improvements $ 15,852 $ 15,852Buildings 44,049 44,036Leasehold improvements 1,158,467 1,283,233Furnishings, fixtures and equipment 548,075 467,051Computer software and equipment 55,614 55,434Restaurant smallwares 34,653 30,268Construction in progress 23,732 27,975
Property and equipment, total 1,880,442 1,923,849Less: Accumulated depreciation (1,048,843) (1,010,574)
Property and equipment, net $ 831,599 $ 913,275
Depreciation expenses related to property and equipment for fiscal 2019, 2018 and 2017 were $ 88.0 million, $93.3 million and$89.6 million, respectively. Repair and maintenance expenses for fiscal 2019, 2018 and 2017 were $56.3 million, $55.2 million and $54.1 million, respectively. Net expense for property and equipment disposals was $0.9 million, $2.1 million and $2.5 million, in fiscal 2019, 2018 and 2017, respectively.

69
7. Intangible Assets, net
The following table presents components of intangible assets, net (in thousands):
December 31, 2019 January 1, 2019Indefinite-lived intangible assets:
Goodwill $ 78,355 —Trade names and trademarks 337,027 $ 9,922Transferable alcoholic beverage licenses 8,575 7,164
Total indefinite-lived intangible assets 423,957 17,086Definite-lived intangible assets, net:
Licensing agreements 10,060 —Non-transferable alcoholic beverage licenses 3,190 2,951Leasehold acquisition assets — 6,172
Total definite-lived intangible assets 13,250 9,123Total intangible assets, net $ 437,207 $ 26,209
Amortization expenses related to our definite-lived intangible assets was $ 0.3 million, $0.6 million and $0.6 million for fiscal2019, 2018 and 2017, respectively. Definite-lived intangible assets will be amortized over one to 56 years. We performed our annualassessment of indefinite-lived intangible assets and concluded as of the date of the test, there was no impairment of these assets.
8. Leases
Components of lease expense were as follows (in thousands):
Fiscal Year 2019
Operating $ 112,048Variable 66,689Short-term 368
Total $ 179,105
Rent expense on all operating leases (under ASC 840) was as follows (in thousands):
Fiscal Year 2018 2017
Straight-lined minimum base rent $ 83,999 $ 83,387Contingent rent 20,147 19,559Common area maintenance and taxes 39,961 38,103
Total $ 144,107 $ 141,049
Supplemental information related to leases (in thousands, except percentages):
Fiscal Year 2019
Cash paid for amounts included in the measurement of lease liabilities:Operating cash flows from operating leases $ 103,210
Right-of-use assets obtained in exchange for new operating lease liabilities 262,421 (1)
Weighted-average remaining lease term — operating leases (in years) 16.6Weighted-average discount rate — operating leases 5.2 %
(1) Includes $223.5 million in right-of-use assets related to the Acquisition. (See Note 2 for further discussion of the Acquisition.)
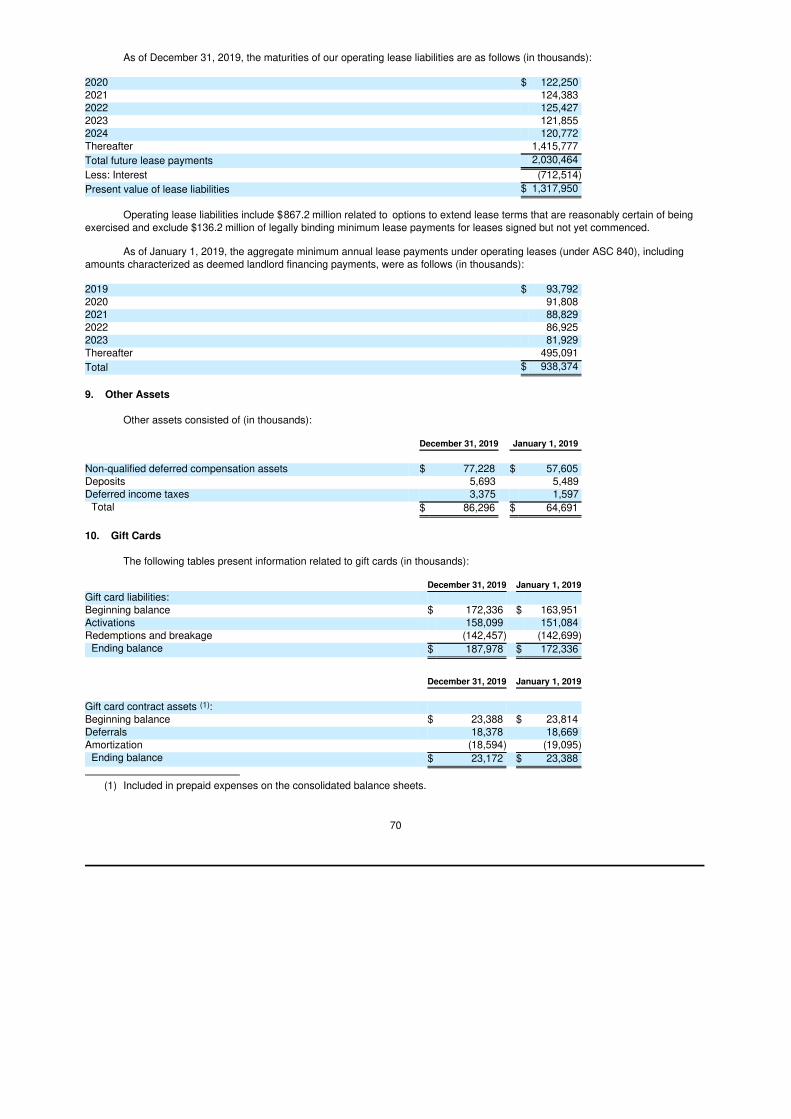
70
As of December 31, 2019, the maturities of our operating lease liabilities are as follows (in thousands):
2020 $ 122,2502021 124,3832022 125,4272023 121,8552024 120,772Thereafter 1,415,777Total future lease payments 2,030,464Less: Interest (712,514)Present value of lease liabilities $ 1,317,950
Operating lease liabilities include $867.2 million related to options to extend lease terms that are reasonably certain of being exercised and exclude $136.2 million of legally binding minimum lease payments for leases signed but not yet commenced.
As of January 1, 2019, the aggregate minimum annual lease payments under operating leases (under ASC 840), includingamounts characterized as deemed landlord financing payments, were as follows (in thousands):
2019 $ 93,7922020 91,8082021 88,8292022 86,9252023 81,929Thereafter 495,091Total $ 938,374
9. Other Assets
Other assets consisted of (in thousands):
December 31, 2019 January 1, 2019
Non-qualified deferred compensation assets $ 77,228 $ 57,605Deposits 5,693 5,489Deferred income taxes 3,375 1,597
Total $ 86,296 $ 64,691
10. Gift Cards
The following tables present information related to gift cards (in thousands):
December 31, 2019 January 1, 2019Gift card liabilities:Beginning balance $ 172,336 $ 163,951Activations 158,099 151,084Redemptions and breakage (142,457) (142,699)
Ending balance $ 187,978 $ 172,336
December 31, 2019 January 1, 2019
Gift card contract assets (1):Beginning balance $ 23,388 $ 23,814Deferrals 18,378 18,669Amortization (18,594) (19,095)
Ending balance $ 23,172 $ 23,388
(1) Included in prepaid expenses on the consolidated balance sheets.

71
11. Other Accrued Expenses
Other accrued expenses consisted of (in thousands):
December 31, 2019 January 1, 2019
Self-insurance $ 68,881 $ 72,631Salaries and wages 56,774 39,102Staff member benefits 25,044 22,946Payroll and sales taxes 22,822 15,684Deferred consideration 16,740 —Other 46,321 44,018
Total $ 236,582 $ 194,381
12. Long-Term Debt
On July 30, 2019, we entered into a Third Amended and Restated Loan Agreement (the “New Facility”), which amends andrestates in its entirety our prior Second Amended and Restated Loan Agreement dated as of December 22, 2015. The New Facility,which terminates on July 30, 2024, provides us with revolving loan commitments that total $400 million (of which $40 million may beused for issuances of letters of credit). The New Facility contains a commitment increase feature that could provide for an additional$200 million in available credit upon our request and subject to the participating lenders electing to increase their commitments or newlenders being added to the New Facility. At December 31, 2019, we had net availability for borrowings of $90.6 million, based on anoutstanding debt balance of $290.0 million and $19.4 million in standby letters of credit. During fiscal 2019, we utilized the New Facilityto fund the Acquisition (see Note 2 for further discussion of the Acquisition). During fiscal years 2019, 2018 and 2017, we utilized ourprevious credit facility to fund a portion of our stock repurchases.
We are subject to certain financial covenants under the New Facility requiring us to maintain (i) a maximum “Net AdjustedLeverage Ratio” of 4.75 and (ii) a minimum EBITDAR to interest and rent expense ratio (“EBITDAR Ratio”) of 1.9, as well as customary events of default that, if triggered, could results in acceleration of the maturity of the New Facility. The New Facility also limits cash distributions with respect to our equity interests, such as cash dividends and share repurchases, based on a defined ratio, and also sets forth negative covenants that restrict indebtedness, liens, investments, sales of assets, fundamental changes and other matters.
Borrowings under the New Facility bear interest, at our option, at a rate equal to either (i) the adjusted LIBO Rate (ascustomarily defined) (the “Adjusted LIBO Rate”) plus a margin that is based on our net adjusted leverage ratio, or (ii) the sum of (a) thehighest of (1) the rate of interest last quoted by The Wall Street Journal as the prime rate in effect in the United States, (2) the greater ofthe rate calculated by the Federal Reserve Bank of New York as the effective federal funds rate or the rate that is published by theFederal Reserve Bank of New York as an overnight bank funding rate, in either case plus 0.5%, and (3) the one-month Adjusted LIBORate plus 1.0%, plus (b) a margin that is based on our net adjusted leverage ratio. Letters of credit issued under the New Facility bearfees that are equivalent to the interest rate margin that is applicable to revolving loans that bear interest at the adjusted LIBO Rate plusother customary fees charged by the issuing bank. Under the New Facility, we paid certain customary loan origination fees and will payan unused fee on the unused portion of the New Facility that is also based on our Net Adjusted Leverage Ratio. Our Net AdjustedLeverage and EBITDAR Ratios were 3.8 and 2.5, respectively, at December 31, 2019, and we were in compliance with all covenants ineffect at that date.
Our obligations under the New Facility are unsecured. Certain of our material subsidiaries have guaranteed our obligationsunder the New Facility. The New Facility will be used for our general corporate purposes, including for the issuance of standby lettersof credit to support our self-insurance programs, and to fund dividends, stock repurchases and permitted acquisitions.
We capitalized interest expense related to new restaurant openings and major remodels totaling $ 0.6 million, $0.4 million and$0.7 million in fiscal 2019, 2018 and 2017, respectively.

72
13. Other Noncurrent Liabilities
Other noncurrent liabilities consisted of (in thousands):
December 31, 2019 January 1, 2019
Non-qualified deferred compensation liabilities $ 76,255 $ 57,551Deferred consideration 37,193 —Contingent consideration and compensation liabilities 13,218 —Other 13,882 14,108
Total $ 140,548 $ 71,659
(See Note 17 for further discussion of our non-qualified deferred compensation plan.)
14. Commitments and Contingencies
Purchase obligations, which include inventory purchases, equipment purchases, information technology and othermiscellaneous commitments, were $118.2 million and $149.8 million at December 31, 2019 and January 1, 2019, respectively. Thesepurchase obligations are primarily due within three years and recorded as liabilities when goods are received or services rendered. Real estate obligations, which include construction commitments, net of up-front landlord construction contributions, and legally binding minimum lease payments for leases signed but not yet commenced, were $176.1 million and $12.6 million at December 31, 2019 and January 1, 2019, respectively.
The purchase price of the Acquisition includes a $ 12 million indemnity escrow amount specifically related to North Italia dueratably over the next two years; and $45 million of deferred consideration due ratably over the next four years (including a $13 million indemnity escrow amount specifically related to the remaining FRC businesses). The acquisition agreement also included a contingent consideration provision which is payable on the fifth anniversary of the Closing Date and is based on achievement of revenue and profitability targets for the FRC brands other than North Italia and Flower Child with considerations made in the event we undergo a change in control or divest any FRC brand (other than North Italia and Flower Child) during the five years after Closing. We are also required to provide financing to FRC in an amount sufficient to support achievement of these targets during the five years after Closing. (See Note 2 for further discussion of the Acquisition.)
As credit guarantees to insurers, we had $ 19.4 million and $20.7 million at December 31, 2019 and January 1, 2019,respectively, in standby letters of credit related to our self-insurance liabilities. All standby letters of credit are renewable annually.
We retain the financial responsibility for a significant portion of our risks and associated liabilities with respect to workers’compensation, general liability, staff member health benefits, employment practices and other insurable risks. The accrued liabilitiesassociated with these programs are based on our estimate of the ultimate costs to settle known claims, as well as claims incurred butnot yet reported to us (“IBNR”) as of the balance sheet date. The total accrued liability for our self-insured plans was $67.7 million and$72.2 million at December 31, 2019 and January 1, 2019, respectively.
On June 7, 2018, the California Department of Industrial Relations issued a $ 4.2 million wage citation jointly against theCompany and our vendor that provides janitorial services to eight of our Southern California restaurants, alleging that the janitorialvendor or its subcontractor failed to comply with various provisions of the California Labor Code (Wage Citation Case No. 35-CM-188798-16). The wage citation seeks to recover penalties and other monetary payments on behalf of the employees that worked forthis vendor or its subcontractor. On June 28, 2018, we filed an appeal of the wage citation. The Company’s appeal of the wage citationis tentatively scheduled for hearing in July 2020. We intend to vigorously defend this action. However, it is not possible at this time toreasonably estimate the outcome of or any potential liability from this matter and, accordingly, we have not reserved for any potentialfuture payments.
On June 22, 2018, the Internal Revenue Service issued a Notice of Deficiency in which they disallowed $ 8.0 million of our §199Domestic Production Activities Deduction for tax years 2010, 2011 and 2012. On September 11, 2018 we petitioned the United StatesTax Court for a redetermination of the deficiency. The tax court has assigned docket number 18150-18 to our case. We intend tovigorously defend our position in litigation and based on our analysis of the law, regulations and relevant facts, we have not reserved forany potential future payments.

73
Within the ordinary course of our business, we are subject to private lawsuits, government audits, administrative proceedingsand other claims. These matters typically involve claims from customers, staff members and others related to operational andemployment issues common to the foodservice industry. A number of these claims may exist at any given time, and some of the claimsmay be pled as class actions. From time to time, we are also involved in lawsuits with respect to infringements of, or challenges to, ourregistered trademarks and other intellectual property, both domestically and abroad. We could be affected by adverse publicity andlitigation costs resulting from such allegations, regardless of whether they are valid or whether we are legally determined to be liable.
At this time, we believe that the amount of reasonably possible losses resulting from final disposition of any pending lawsuits,audits, proceedings and claims will not have a material adverse effect individually or in the aggregate on our financial position, results ofoperations or liquidity. It is possible, however, that our future results of operations for a particular quarter or fiscal year could beimpacted by changes in circumstances relating to lawsuits, audits, proceedings or claims. Legal costs related to such claims areexpensed as incurred.
We have employment agreements with certain of our executive officers that provide for payments to those officers in the event of an actual or constructive termination of their employment, including in the event of a termination without cause, an acquirer failure to assume or continue equity awards following a change in control of the Company or, otherwise, in the event of death or disability as defined in those agreements. Aggregate payments totaling approximately $2.3 million, excluding accrued potential bonuses of $2.7 million, which are subject to approval by the Compensation Committee, would have been required by those agreements had all such officers terminated their employment for reasons requiring such payments as of December 31, 2019. In addition, the employment agreement with our Chief Executive Officer specifies an annual founder’s retirement benefit of $650,000 for ten years, commencing six months after termination of his full-time employment.
15. Stockholders’ Equity
Cash dividends of $1.38, $1.24 and $1.06 were declared during fiscal 2019, 2018 and 2017, respectively. Future decisions topay or to increase or decrease dividends are at the discretion of the Board and will be dependent on our operating performance,financial condition, capital expenditure requirements, limitations on cash distributions pursuant to the terms and conditions of the NewFacility and applicable law, and such other factors that the Board considers relevant. (See Note 12 for further discussion of our long-term debt.)
Under authorization by our Board to repurchase up to 56.0 million shares of our common stock, we have cumulativelyrepurchased 52.9 million shares at a total cost of $ 1,693.1 million through December 31, 2019. During fiscal 2019, 2018 and 2017, werepurchased 1.1 million, 2.3 million and 2.6 million shares of our common stock at a cost of $ 51.0 million, $109.3 million and $123.0million, respectively. Repurchased common stock is reflected as a reduction of stockholders’ equity in treasury stock.
Our share repurchase authorization does not have an expiration date, does not require us to purchase a specific number ofshares and may be modified, suspended or terminated at any time. Shares may be repurchased in the open market or through privatelynegotiated transactions at times and prices considered appropriate by us. We make the determination to repurchase shares based onseveral factors, including current and forecasted operating cash flows, capital needs associated with new restaurant development andmaintenance of existing locations, dividend payments, debt levels and cost of borrowing, obligations associated with the Acquisition,our share price and current market conditions. (See Note 2 for further discussion of the Acquisition.) The timing and number of sharesrepurchased are also subject to legal constraints and financial covenants under the New Facility that limit share repurchases based ona defined ratio. (See Note 12 for further discussion of our long-term debt.) Our objectives regarding share repurchases are to offset thedilution to our shares outstanding that results from equity compensation grants and to supplement our earnings per share growth.
16. Stock-Based Compensation
We maintain stock-based incentive plans under which incentive stock options, non-qualified stock options, stock appreciationrights, restricted shares and restricted share units may be granted to staff members, consultants and non-employee directors. Ourcurrent practice is to issue new shares, rather than treasury shares, upon stock option exercises, for restricted share grants and uponvesting of restricted share units. To date, we have only granted non-qualified stock options, restricted shares and restricted share unitsof common stock under these plans. No grants have been made to non-employee directors under these plans.

74
On April 5, 2017, our Board approved an amendment to our 2010 Stock Incentive Plan to increase the number of shares ofcommon stock reserved for grant under the plan to 12.7 million shares from 9.2 million shares. This amendment was approved by ourstockholders at our annual meeting held on June 8, 2017. On April 4, 2019, our Board adopted The Cheesecake Factory IncorporatedStock Incentive Plan. This plan was approved by our stockholders at our annual meeting held on May 30, 2019. The maximum numberof shares of common stock available for grant under this plan is 4.8 million shares plus 1.8 million shares, which, as of May 30, 2019,were available for issuance under our 2010 Stock Incentive Plan, plus 1.9 million shares which may become available for issuanceunder The Cheesecake Factory Incorporated Stock Incentive Plan due to forfeiture or lapse of awards under our 2010 Stock IncentivePlan following May 30, 2019. Approximately 6.5 million of these shares were available for grant as of December 31, 2019.
Stock options generally vest at 20% per year and expire eight years from the date of grant. Restricted shares and restricted share units generally vest between three to five years from the date of grant and require that the staff member remains employed in good standing with the Company as of the vesting date. Certain restricted share units granted to executive officers contain performance-based vesting conditions. Performance goals are determined by the Board of Directors. The quantity of units that will vest ranges from 0% to 150% based on the level of achievement of the performance conditions. Equity awards for certain executive officers may vest earlier in the event of a change of control in which the acquirer fails to assume or continue such awards, as defined in the plan, or under certain circumstances described in such executive officers’ respective employment agreements. Compensation expense is recognized only for those options, restricted shares and restricted share units expected to vest, with forfeitures estimated based on our historical experience and future expectations.
The following table presents information related to stock-based compensation, net of forfeitures (in thousands):
Fiscal Year 2019 2018 2017(2)
Labor expenses $ 6,233 $ 5,681 $ 5,236Other operating costs and expenses 274 287 243General and administrative expenses 12,866 14,020 10,978
Total stock-based compensation 19,373 19,988 16,457Income tax benefit 4,760 4,987 6,295
Total stock-based compensation, net of taxes $ 14,613 $ 15,001 $ 10,162
Capitalized stock-based compensation (1) $ 226 $ 262 $ 239
(1) It is our policy to capitalize the portion of stock-based compensation costs for our internal development department that relatesto capitalizable activities such as the design and construction of new restaurants, remodeling existing locations and equipmentinstallation. Capitalized stock-based compensation is included in property and equipment, net on the consolidated balancesheets.
(2) Fiscal 2017 stock-based compensation expense includes a $ 3.9 million benefit for an out-of-period adjustment related to acorrection in stock-based compensation valuation and forfeitures.
Stock Options
The weighted-average fair value at the grant date for options issued during fiscal 2019, 2018 and 2017 was $ 9.84, $11.62 and$14.83 per share, respectively. The fair value of options was estimated utilizing the Black-Scholes valuation model with the followingweighted-average assumptions for fiscal 2019, 2018 and 2017, respectively: (a) an expected option term of 6.9 years in all fiscal years presented, (b) expected stock price volatility of 26.3%, 27.8% and 24.4%, (c) a risk-free interest rate of 2.6%, 2.8% and 2.3%, and (d) a dividend yield on our stock of 2.9%, 2.5% and 1.6%.
The expected option term represents the estimated period of time until exercise and is based on historical experience of similar options, giving consideration to the contractual terms, vesting schedules and expectations of future staff member behavior. Expected stock price volatility is based on a combination of the historical volatility of our stock and the implied volatility of actively traded options on our common stock. The risk-free interest rate is based on the U.S. Treasury yield curve in effect at the time of grant with an equivalent remaining term. The dividend yield is based on anticipated cash dividend payouts.

75
Stock option activity during fiscal 2019 was as follows:
WeightedAverage
Weighted Remaining AggregateAverage Contractual Intrinsic
Shares Exercise Price Term Value(1)
(In thousands) (Per share) (In years) (In thousands)Outstanding at beginning of year 1,799 $ 45.03 4.1 $ 5,606Granted 307 $ 45.90Exercised (260) $ 29.72Forfeited or cancelled (17) $ 48.38Outstanding at end of year 1,829 $ 47.32 4.3 $ 844
Exercisable at end of year 986 $ 46.04 2.8 $ 844
(1) Aggregate intrinsic value is calculated as the difference between our closing stock price at fiscal year-end and the exerciseprice, multiplied by the number of in-the-money options and represents the pre-tax amount that would have been received bythe option holders, had they all exercised their options on the fiscal year -end date.
The total intrinsic value of options exercised during fiscal 2019, 2018 and 2017 was $ 4.3 million, $6.2 million and $11.2 million, respectively. As of December 31, 2019, total unrecognized stock-based compensation expense related to unvested stock options was $7.0 million, which we expect to recognize over a weighted-average period of approximately 3.0 years.
Restricted Shares and Restricted Share Units
Restricted share and restricted share unit activity during fiscal 2019 was as follows:
WeightedAverage
Fair Shares Value
(In thousands) (Per share)Outstanding at beginning of year 1,702 $ 48.08Granted 541 $ 45.02Vested (349) $ 45.26Forfeited (130) $ 47.19Outstanding at end of year 1,764 $ 47.76
Fair value of our restricted shares and restricted share units is based on our closing stock price on the date of grant. Theweighted-average fair value for restricted shares and restricted share units issued during fiscal 2019, 2018 and 2017 was $45.02,$48.22 and $54.29, respectively. The fair value of shares that vested during fiscal 2019, 2018 and 2017 was $15.8 million, $17.8 million and $18.4 million, respectively. As of December 31, 2019, total unrecognized stock-based compensation expense related to unvested restricted shares and restricted share units was $36.4 million, which we expect to recognize over a weighted-average period of approximately 2.9 years.

76
17. Employee Benefit Plans
We have defined contribution benefit plans in accordance with section 401(k) of the Internal Revenue Code (“401(k) Plans”)that are open to our staff members who meet certain compensation and eligibility requirements. Participation in the 401(k) Plans iscurrently open to staff members from our restaurant concepts, bakery facilities, corporate office and FRC headquarters. The 401(k)Plans allow participating staff members to defer the receipt of a portion of their compensation and contribute such amount to one ormore investment options. Our executive officers and a select group of management and/or highly compensated staff members are noteligible to participate in the 401(k) Plans. We currently match in cash a certain percentage of the staff member contributions to the401(k) Plans and also pay a portion of the administrative costs. Expense recognized in fiscal 2019, 2018 and 2017 was $1.2 million,$1.0 million and $1.0 million, respectively.
We have also established non-qualified deferred compensation plans (“Non-Qualified Plans”) for our executive officers and aselect group of management and/or highly compensated staff members. The Non-Qualified Plans allow participating staff members todefer the receipt of a portion of their base compensation and bonuses. Non-employee directors may also participate in the Non-Qualified Plans and defer the receipt of their earned director fees. We currently match in cash a certain percentage of the staff membercontributions to the Non-Qualified Plans and also pay for the administrative costs. We do not match any contributions made by non-employee directors. Expense recognized in fiscal 2019, 2018 and 2017 was $1.2 million, $1.3 million and $1.0 million, respectively.
While we are under no obligation to fund Non-Qualified Plan liabilities (in whole or in part), our current practice is to maintaincompany-owned life insurance contracts and other investments that are specifically designed to informally fund savings plans of thisnature. These contracts are recorded at their cash surrender value as determined by the insurance carrier. Our consolidated balancesheets reflect investments in other assets and our obligation to participants in the Non-Qualified Plans in other noncurrent liabilities. Allgains and losses related to our non-qualified deferred compensation assets and liabilities are reflected in interest and other expense,net in our consolidated statements of income.
We maintain self-insured medical and dental benefit plans for our staff members. The accrued liabilities associated with theseprograms are based on our estimate of the ultimate costs to settle known claims as well as claims incurred but not yet reported to us asof the balance sheet date. The accrued liability for our self-insured benefit plans, which is included in other accrued expenses, was$10.8 million and $10.4 million as of December 31, 2019 and January 1, 2019, respectively. (See Note 1 for further discussion ofaccounting for our self-insurance liabilities.)
18. Income Taxes
The provision for income taxes consisted of the following (in thousands):
Fiscal Year 2019 2018 2017(1)
Income before income taxes $ 140,334 $ 107,411 $ 146,466Income tax (benefit)/provision:Current:
Federal $ 8,211 $ 5,082 $ 7,148State 7,027 8,804 7,106
Total current 15,238 13,886 14,254Deferred:
Federal (3,695) (4,549) (24,570)State 1,498 (961) (610)
Total deferred (2,197) (5,510) (25,180)Total (benefit)/provision $ 13,041 $ 8,376 $ (10,926)
(1) The Tax Act, which was enacted on December 22, 2017, made significant changes to how corporations are taxed in the U.S.,the most prominent of which affecting us was to lower the U.S. corporate tax rate from 35% to 21%. In addition to the benefit ofa lower rate in future years, the enactment of the Tax Act caused us to revalue our deferred tax assets and liabilities to reflectthe new rate, resulting in a benefit to our fiscal 2017 income tax provision of $38.5 million.

77
The following reconciles the U.S. federal statutory rate to the effective tax rate:
Fiscal Year 2019 2018 2017
U.S. federal statutory rate 21.0 % 21.0 % 35.0 %State and district income taxes, net of federal benefit 4.9 6.1 3.3Credit for FICA taxes paid on tips (12.8) (16.5) (9.4)Other credits and incentives (1.4) (2.5) (1.9)Manufacturing deduction — — (2.3)Deferred compensation (1.7) 0.8 (1.5)Equity compensation (0.2) (1.5) (4.5)Impact of statutory rate change on deferred taxes — — (26.3)Other (0.5) 0.4 0.1Effective tax rate 9.3 % 7.8 % (7.5)%
Following are the temporary differences that created our deferred tax assets and liabilities (in thousands):
December 31, 2019 January 1, 2019Deferred tax assets:
Staff member benefits $ 27,059 $ 22,925Insurance reserves 14,157 15,165Accrued rent 27,582 10,870Deferred income 22,725 17,288Stock-based compensation 8,794 8,628Tax credit carryforwards 15,754 1,880Other 1,958 1,265
Subtotal 118,029 78,021Less: Valuation allowance (713) (792)
Total $ 117,316 $ 77,229
Deferred tax liabilities:Property and equipment $ (131,120) $ (107,513)Prepaid expenses (8,819) (7,929)Inventory (7,713) (6,893)Other (136) (5,420)
Total $ (147,788) $ (127,755)
Net deferred tax liability $ (30,472) $ (50,526)
At December 31, 2019 and January 1, 2019, we had $ 1.9 million and $2.4 million, respectively, of state tax creditcarryforwards, consisting of hiring and investment credits, which began to expire in 2013, and $0.8 million and $0.7 million, respectively,of foreign net operating losses and $14.3 million and $3.3 million, respectively, of federal credit carryforwards which begin to expire in 2038. We assess the available evidence to estimate if sufficient future taxable income will be generated to use these carryforwards. Based on this evaluation, we recorded a valuation allowance of $0.7 million and $0.8 million at December 31, 2019 and January 1, 2019, respectively, to reflect the amount that we will likely not realize. This assessment could change if estimates of future taxable income during the carryforward period are revised. The earliest tax year still subject to examination by a significant taxing jurisdiction is 2010.

78
At December 31, 2019, we had a reserve of $0.7 million for uncertain tax positions. If recognized, this amount would impact our effective income tax rate. A reconciliation of the beginning and ending amount of our uncertain tax positions is as follows (in thousands):
Fiscal Year 2019 2018 2017
Balance at beginning of year $ 830 $ 843 $ 829Additions related to current period tax positions 13 104 168Reductions related to settlements with taxing authorities and lapsesof statutes of limitations (139) (117) (154)
Balance at end of year $ 704 $ 830 $ 843
At both December 31, 2019 and January 1, 2019, we had $ 0.2 million of accrued interest and penalties related to uncertain taxpositions. None of the balance of uncertain tax positions at December 31, 2019 relates to tax positions for which it is reasonablypossible that the total amount could decrease during the next twelve months based on the lapses of statutes of limitations.
19. Segment Information
Our operating segments are comprised of The Cheesecake Factory, North Italia, Flower Child, the other FRC brands, ourbakery division and Grand Lux Cafe, the businesses for which our management reviews discrete financial information for decision-making purposes. Based on quantitative thresholds set forth in ASC 280, “Segment Reporting,” The Cheesecake Factory, North Italiaand the other FRC brands are the only businesses that meet the criteria of a reportable operating segment. The remaining operatingsegments, including Flower Child, along with our businesses that don’t qualify as operating segments are combined in Other.Unallocated corporate expenses, capital expenditures and assets, which were previously classified in a separate Corporate line, arealso combined in Other. In addition, gift card costs, which were previously classified in The Cheesecake Factory restaurants reportablesegment, are combined in Other. Corresponding prior year balances were reclassified to conform to the current year presentation.
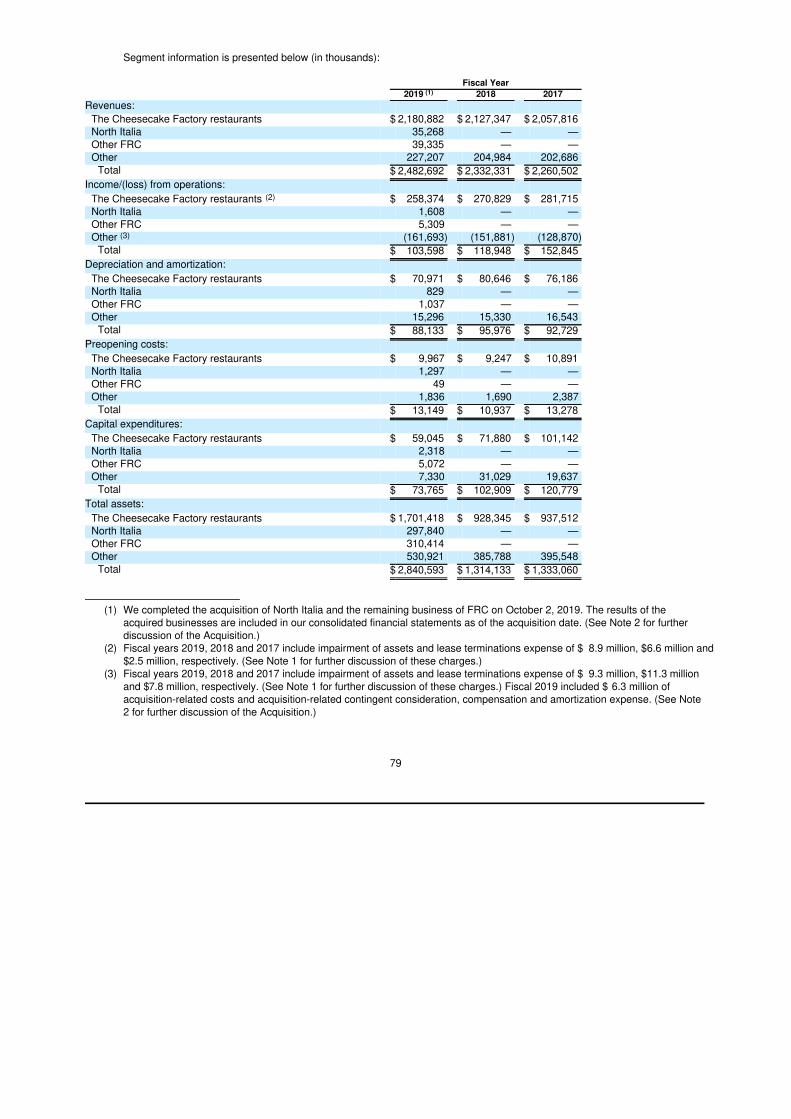
79
Segment information is presented below (in thousands):
Fiscal Year 2019 (1) 2018 2017
Revenues:The Cheesecake Factory restaurants $ 2,180,882 $ 2,127,347 $ 2,057,816North Italia 35,268 — —Other FRC 39,335 — —Other 227,207 204,984 202,686
Total $ 2,482,692 $ 2,332,331 $ 2,260,502Income/(loss) from operations:
The Cheesecake Factory restaurants (2) $ 258,374 $ 270,829 $ 281,715North Italia 1,608 — —Other FRC 5,309 — —Other (3) (161,693) (151,881) (128,870)
Total $ 103,598 $ 118,948 $ 152,845Depreciation and amortization:
The Cheesecake Factory restaurants $ 70,971 $ 80,646 $ 76,186North Italia 829 — —Other FRC 1,037 — —Other 15,296 15,330 16,543
Total $ 88,133 $ 95,976 $ 92,729Preopening costs:
The Cheesecake Factory restaurants $ 9,967 $ 9,247 $ 10,891North Italia 1,297 — —Other FRC 49 — —Other 1,836 1,690 2,387
Total $ 13,149 $ 10,937 $ 13,278Capital expenditures:
The Cheesecake Factory restaurants $ 59,045 $ 71,880 $ 101,142North Italia 2,318 — —Other FRC 5,072 — —Other 7,330 31,029 19,637
Total $ 73,765 $ 102,909 $ 120,779Total assets:
The Cheesecake Factory restaurants $ 1,701,418 $ 928,345 $ 937,512North Italia 297,840 — —Other FRC 310,414 — —Other 530,921 385,788 395,548
Total $ 2,840,593 $ 1,314,133 $ 1,333,060
(1) We completed the acquisition of North Italia and the remaining business of FRC on October 2, 2019. The results of theacquired businesses are included in our consolidated financial statements as of the acquisition date. (See Note 2 for furtherdiscussion of the Acquisition.)
(2) Fiscal years 2019, 2018 and 2017 include impairment of assets and lease terminations expense of $ 8.9 million, $6.6 million and$2.5 million, respectively. (See Note 1 for further discussion of these charges.)
(3) Fiscal years 2019, 2018 and 2017 include impairment of assets and lease terminations expense of $ 9.3 million, $11.3 millionand $7.8 million, respectively. (See Note 1 for further discussion of these charges.) Fiscal 2019 included $ 6.3 million ofacquisition-related costs and acquisition-related contingent consideration, compensation and amortization expense. (See Note2 for further discussion of the Acquisition.)
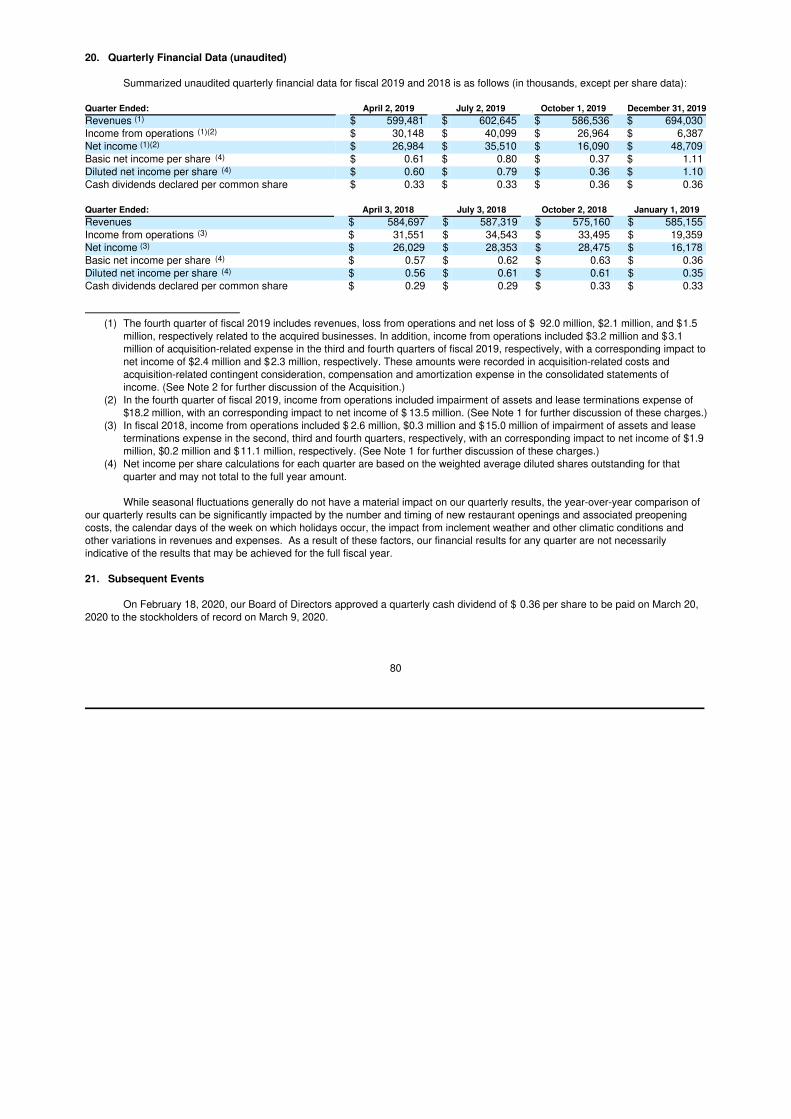
80
20. Quarterly Financial Data (unaudited)
Summarized unaudited quarterly financial data for fiscal 2019 and 2018 is as follows (in thousands, except per share data):
Quarter Ended: April 2, 2019 July 2, 2019 October 1, 2019 December 31, 2019Revenues (1) $ 599,481 $ 602,645 $ 586,536 $ 694,030Income from operations (1)(2) $ 30,148 $ 40,099 $ 26,964 $ 6,387Net income (1)(2) $ 26,984 $ 35,510 $ 16,090 $ 48,709Basic net income per share (4) $ 0.61 $ 0.80 $ 0.37 $ 1.11Diluted net income per share (4) $ 0.60 $ 0.79 $ 0.36 $ 1.10Cash dividends declared per common share $ 0.33 $ 0.33 $ 0.36 $ 0.36
Quarter Ended: April 3, 2018 July 3, 2018 October 2, 2018 January 1, 2019Revenues $ 584,697 $ 587,319 $ 575,160 $ 585,155Income from operations (3) $ 31,551 $ 34,543 $ 33,495 $ 19,359Net income (3) $ 26,029 $ 28,353 $ 28,475 $ 16,178Basic net income per share (4) $ 0.57 $ 0.62 $ 0.63 $ 0.36Diluted net income per share (4) $ 0.56 $ 0.61 $ 0.61 $ 0.35Cash dividends declared per common share $ 0.29 $ 0.29 $ 0.33 $ 0.33
(1) The fourth quarter of fiscal 2019 includes revenues, loss from operations and net loss of $ 92.0 million, $2.1 million, and $1.5million, respectively related to the acquired businesses. In addition, income from operations included $3.2 million and $3.1million of acquisition-related expense in the third and fourth quarters of fiscal 2019, respectively, with a corresponding impact tonet income of $2.4 million and $2.3 million, respectively. These amounts were recorded in acquisition-related costs andacquisition-related contingent consideration, compensation and amortization expense in the consolidated statements ofincome. (See Note 2 for further discussion of the Acquisition.)
(2) In the fourth quarter of fiscal 2019, income from operations included impairment of assets and lease terminations expense of$18.2 million, with an corresponding impact to net income of $ 13.5 million. (See Note 1 for further discussion of these charges.)
(3) In fiscal 2018, income from operations included $ 2.6 million, $0.3 million and $15.0 million of impairment of assets and leaseterminations expense in the second, third and fourth quarters, respectively, with an corresponding impact to net income of $1.9million, $0.2 million and $11.1 million, respectively. (See Note 1 for further discussion of these charges.)
(4) Net income per share calculations for each quarter are based on the weighted average diluted shares outstanding for thatquarter and may not total to the full year amount.
While seasonal fluctuations generally do not have a material impact on our quarterly results, the year-over-year comparison of our quarterly results can be significantly impacted by the number and timing of new restaurant openings and associated preopening costs, the calendar days of the week on which holidays occur, the impact from inclement weather and other climatic conditions and other variations in revenues and expenses. As a result of these factors, our financial results for any quarter are not necessarily indicative of the results that may be achieved for the full fiscal year.
21. Subsequent Events
On February 18, 2020, our Board of Directors approved a quarterly cash dividend of $ 0.36 per share to be paid on March 20,2020 to the stockholders of record on March 9, 2020.

81
EXHIBIT INDEX
ExhibitNo. Item Form File Number
Incorporated byReference fromExhibit Number
Filed withSEC
2.1 Form of Reorganization Agreement (P) Amend. No. 1to Form S-1
33-479336 2.1 8/17/92
2.2 Purchase Agreement, dated as of November 14,2016, as amended by Amendment & OptionExercise Agreement, dated as of July 30, 2019,by and among The Cheesecake FactoryIncorporated and the other Parties thereto#
10-Q 000-20574 2.1 11/8/19
2.3 First Amendment to Option Exercise Agreementand Second Amendment to Purchase Agreementand Operating Agreement, dated as of October 2,2019, by and among The Cheesecake FactoryIncorporated and the other Parties thereto#
10-Q 000-20574 2.2 11/8/19
2.4 Membership Interest Purchase Agreement, datedas of July 30, 2019, by and among TheCheesecake Factory Restaurants, Inc., FoxRestaurant Concepts LLC, the Sellers partythereto, SWF Posse LLC, as Seller’srepresentative, and, solely for limited purposesset forth therein, The Cheesecake FactoryIncorporated#†
10-Q 000-20574 2.3 11/8/19
2.5 First Amendment to Membership InterestPurchase Agreement, dated as of October 2,2019, by and among The Cheesecake FactoryRestaurants, Inc., Fox Restaurant Concepts LLC,and SWF Posse LLC, as Seller’s representative#
10-Q 000-20574 2.4 11/8/19
3.1 Restated Certificate of Incorporation of TheCheesecake Factory Incorporated
10-Q 000-20574 3.2 8/6/18
3.2 Bylaws of The Cheesecake Factory Incorporated(Amended and Restated on May 20, 2009)
8-K 000-20574 3.8 5/27/09
3.3 Certificate of Elimination of Series A JuniorParticipating Cumulative Preferred Stock of TheCheesecake Factory Incorporated
10-Q 000-20574 3.1 8/6/18
4.1 Description of The Cheesecake FactoryIncorporated’s Securities Registerd Pursuant toSecion 12 of the Securities Exchange Act
— — — Filedherewith
10.1.1 Employment Agreement, effective as of April 1,2017, between The Cheesecake FactoryIncorporated and David M. Overton*
8-K 000-20574 99.2 2/22/17
10.1.2 First Amendment to Employment Agreement,effective as of April 1, 2018, between TheCheesecake Factory Incorporated and David M.Overton*
8-K 000-20574 99.2 2/21/18

82
ExhibitNo. Item Form File Number
Incorporated byReference fromExhibit Number
Filed withSEC
10.2 Employment Agreement, effective as of March 3,2016, between The Cheesecake FactoryIncorporated and David M. Gordon*
10-K 000-25074 10.6 3/2/17
10.3 Employment Agreement, effective as of March 3,2016, between The Cheesecake FactoryIncorporated and W. Douglas Benn*
10-K 000-25074 10.7 3/2/17
10.4 Employment Agreement, effective as of March 3,2016, between The Cheesecake FactoryIncorporated and Debby R. Zurzolo*
10-K 000-25074 10.8 3/2/17
10.5 Employment Agreement, effective as of March 3,2016, between The Cheesecake FactoryIncorporated and Max Byfuglin*
10-K 000-25074 10.9 3/2/17
10.6 Employment Agreement, effective as of July 7,2017, between The Cheesecake FactoryIncorporated and Matthew E. Clark*
8-K 000-25074 99.1 6/13/17
10.7 Employment Agreement, effective as of May 14,2018, between The Cheesecake FactoryIncorporated and Scarlett May*
10-Q 000-25074 10.10 5/11/18
10.8 Employment Agreement, effective as ofFebruary 13, 2019, between The CheesecakeFactory Incorporated and Keith T. Carango*
10-K 000-20574 10.8 3/4/19
10.9.1 Amended and Restated The Cheesecake FactoryIncorporated Executive Savings Plan*
10-K 000-25074 10.20 3/2/17
10.9.2 First Amendment to The Cheesecake FactoryIncorporated Executive Savings Plan as amendedand restated November 7, 2016*
10-K 000-25074 10.11.1 2/28/18
10.10 Form of Indemnification Agreement* 8-K 000-25074 99.1 12/14/07
10.11.1 Inducement Agreement dated as of July 27, 2005 8-K 000-25074 99.3 8/2/05
10.11.2 First Amendment to Inducement Agreement datedas of March 1, 2010
10-K 000-25074 10.36 2/23/11
10.11.3 Second Amendment to Inducement Agreementdated as of May 7, 2015
10-K 000-25704 10.24 3/2/17
10.12.1 The Cheesecake Factory Incorporated 2010 StockIncentive Plan as amended April 7, 2011*
DEF 14A 000-20574 Appendix A 4/21/11
10.12.2 The Cheesecake Factory Incorporated 2010 StockIncentive Plan as amended effective as ofFebruary 27, 2013*
DEF 14A 000-20574 Appendix A 04/19/13
10.12.3 The Cheesecake Factory Incorporated 2010 StockIncentive Plan as amended April 3, 2014*
DEF 14A 000-20574 Appendix A 4/17/14
10.12.4 The Cheesecake Factory Incorporated 2010 StockIncentive Plan as amended May 28, 2015*
DEF 14A 000-20574 Appendix A 4/17/15

83
ExhibitNo. Item Form File Number
Incorporated byReference fromExhibit Number
Filed withSEC
10.12.5 The Cheesecake Factory Incorporated 2010 StockIncentive Plan as amended April 5, 2017*
DEF 14A 000-20574 Appendix A 4/25/17
10.13 Form of Grant Agreement for Executive Officersunder 2010 Stock Incentive Plan*
10-Q 000-20574 10.1 11/4/10
10.14 Form of Grant Agreement for Executive Officersunder the 2010 Stock Incentive Plan, for equitygrants made after August 2, 2012*
10-Q 000-20574 10.1 8/10/12
10.15 Form of Notice of Stock Option Grant andAgreement and/or Restricted Stock GrantAgreement for Executive Officers under the 2010Stock Incentive Plan, for equity grants made afterMarch 6, 2014*
8-K 000-20574 99.1 3/7/14
10.16 Form of Notice of Grant and Stock OptionAgreement and/or Stock Unit Agreement under the2010 Stock Incentive Plan, for equity grants madeafter March 3, 2016*
8-K 000-20574 99.2 3/4/16
10.17.1 Form of Notice of Grant and Stock OptionAgreement and/or Restricted Share Agreement forMEP I under the 2010 Stock Incentive Plan, forequity grants made after February 15, 2018*
10-K 000-25074 10.24.1 2/28/18
10.17.2 Form of Notice of Grant and Stock OptionAgreement and/or Restricted Share Agreement forMEP II under the 2010 Stock Incentive Plan, forequity grants made after February 15, 2018*
10-K 000-25074 10.24.2 2/28/18
10.17.3 Form of Notice of Grant and Stock OptionAgreement and/or Restricted Share Agreement forMEP III under the 2010 Stock Incentive Plan, forequity grants made after February 15, 2018*
10-K 000-25074 10.24.3 2/28/18
10.17.4 Form of Notice of Grant and Stock OptionAgreement and/or Restricted Share Agreement forMEP IV under the 2010 Stock Incentive Plan, forequity grants made after February 15, 2018*
10-K 000-25074 10.24.4 2/28/18
10.17.5 Form of Notice of Grant and Stock OptionAgreement and/or Restricted Share Agreement forMEP V under the 2010 Stock Incentive Plan, forequity grants made after February 15, 2018*
10-K 000-25074 10.24.5 2/28/18
10.17.6 Form of Standard Notice of Grant and RestrictedShare Agreement I under the 2010 Stock IncentivePlan, for equity grants made after February 15,2018*
10-K 000-25074 10.24.6 2/28/18
10.17.7 Form of Notice of Grant and Stock OptionAgreement and/or Restricted Share Agreement forSenior Executive under the 2010 Stock IncentivePlan, for equity grants made after February 15,2018*
8-K 000-20574 99.3 2/21/18

84
ExhibitNo. Item Form File Number
Incorporated byReference fromExhibit Number
Filed withSEC
10.17.8 Form of Notice of Grant and Stock OptionAgreement and/or Restricted Share Agreementunder the 2010 Stock Incentive Plan, for equitygrants made on or after February 13, 2019*
10-Q 000-20574 10.2 5/6/19
10.18 The Cheesecake Factory Incorporated StockIncentive Plan*
8-K 000-20574 10.1 6/5/19
10.19 2015 Amended and Restated Annual PerformanceIncentive Plan, as amended and restated May 28,2015*
DEF 14A 000-20574 Appendix B 4/17/15
10.20 Third Amended and Restated Loan Agreementwith JPMorgan Chase Bank, National Associationdated as of July 30, 2019
10-Q 000-20574 10.1 12/24/15
21.1 List of Subsidiaries — — — Filedherewith
23.1 Consent of Independent Registered PublicAccounting Firm — KPMG LLP
— — — Filedherewith
23.2 Consent of Independent Registered PublicAccounting Firm — PricewaterhouseCoopers LLP
— — — Filedherewith
31.1 Rule 13a-14(a)/15d-14(a) Certification of thePrincipal Executive Officer
— — — Filedherewith
31.2 Rule 13a-14(a)/15d-14(a) Certification of thePrincipal Financial Officer
— — — Filedherewith
32.1 Certification Pursuant to 18 U.S.C. Section 1350,as Adopted Pursuant to Section 906 of theSarbanes-Oxley Act of 2002 for Principal ExecutiveOfficer
— — — Filedherewith
32.2 Certification Pursuant to 18 U.S.C. Section 1350,as Adopted Pursuant to Section 906 of theSarbanes-Oxley Act of 2002 for Principal FinancialOfficer
— — — Filedherewith

85
ExhibitNo. Item Form File Number
Incorporated byReference fromExhibit Number
Filed withSEC
101.1 The following materials from The CheesecakeFactory Incorporated’s Annual Report on Form 10-K for the year ended December 31, 2019,formatted in Inline eXtensible Business ReportingLanguage (iXBRL): (i) consolidated balancesheets, (ii) consolidated statements of income, (iii)consolidated statements of comprehensiveincome, (iv) consolidated statement ofstockholders’ equity, (v) consolidated statementsof cash flows, and (vi) the notes to theconsolidated financial statements
— — — Filedherewith
104.1 The cover page of The Cheesecake FactoryIncorporated’s Annual Report on Form 10-K for theyear ended December 31, 2019, formatted iniXBRL (included with Exhibit 101.1)
— — — Filedherewith
* Management contract or compensatory plan or arrangement required to be filed as an exhibit.# The schedules (or similar attachments) to this exhibit have been omitted from this filing pursuant to Item 601(a)(5) of Regulation S-
K. The Company will furnish copies of any such schedules or similar attachments to the SEC upon request.† Certain confidential information contained in this agreement has been omitted because it (i) is not material and (ii) would be
competitively harmful if publicly disclosed.(P) This exhibit has been paper filed and is not subject to the hyperlinking requirements of Item 601 of Regulation S-K.

86
SIGNATURES
Pursuant to the requirements of Section 13 or 15(d) of the Securities Exchange Act of 1934, the registrant has duly caused thisreport to be signed on its behalf by the undersigned, thereunto duly authorized on the 11th day of March 2020.
THE CHEESECAKE FACTORY INCORPORATED
/s/ DAVID OVERTONBy: David Overton
Chairman of the Board and Chief Executive Officer(Principal Executive Officer)

87
POWER OF ATTORNEY
KNOW ALL PERSONS BY THESE PRESENTS, that each person whose signature appears below constitutes and appointsDavid Overton and Matthew E. Clark, and each of them, as his or her true and lawful attorneys-in-fact and agents, each with full powerof substitution and resubstitution, for him or her and in his or her name, place and stead, in any and all capacities, to sign any and allamendments to this Annual Report on Form 10-K, and to file the same, with all exhibits thereto, and other documents in connectiontherewith, with the Securities and Exchange Commission, granting unto said attorneys-in-fact and agents full power and authority to doand perform each and every act and thing requisite and necessary to be done in connection therewith, as fully to all intents andpurposes as he or she might or could do in person, hereby ratifying and confirming all that said attorney-in-fact and agent, or hissubstitute or substitutes, may lawfully do or cause to be done by virtue hereof.
SIGNATURES
Pursuant to the requirements of the Securities Exchange Act of 1934, this report has been signed below by the followingpersons on behalf of the Registrant in the capacities and on the dates indicated.
Name Title Date
/s/ DAVID OVERTON Chairman of the Board and March 11, 2020David Overton Chief Executive Officer
(Principal Executive Officer)
/s/ MATTHEW E. CLARK Executive Vice President and March 11, 2020Matthew E. Clark Chief Financial Officer
(Principal Financial Officer)
/s/ CHERYL M. SLOMANN Senior Vice President, Controller and March 11, 2020Cheryl M. Slomann Chief Accounting Officer
(Principal Accounting Officer)
/s/ EDIE A. AMES Director March 11, 2020Edie A. Ames
/s/ ALEXANDER L. CAPPELLO Director March 11, 2020Alexander L. Cappello
/s/ JEROME I. KRANSDORF Director March 11, 2020Jerome I. Kransdorf
Director March 11, 2020Janice Meyer
/s/ LAURENCE B. MINDEL Director March 11, 2020Laurence B. Mindel
/s/ DAVID B. PITTAWAY Director March 11, 2020David B. Pittaway
/s/ HERBERT SIMON Director March 11, 2020Herbert Simon