cheese & healthy eating - Dairy MAX and Healthy Eating.pdf · from the whey in the cheese making...
7
cheese & healthy eating
Transcript of cheese & healthy eating - Dairy MAX and Healthy Eating.pdf · from the whey in the cheese making...
chee
se &
hea
lthy
eat
ing
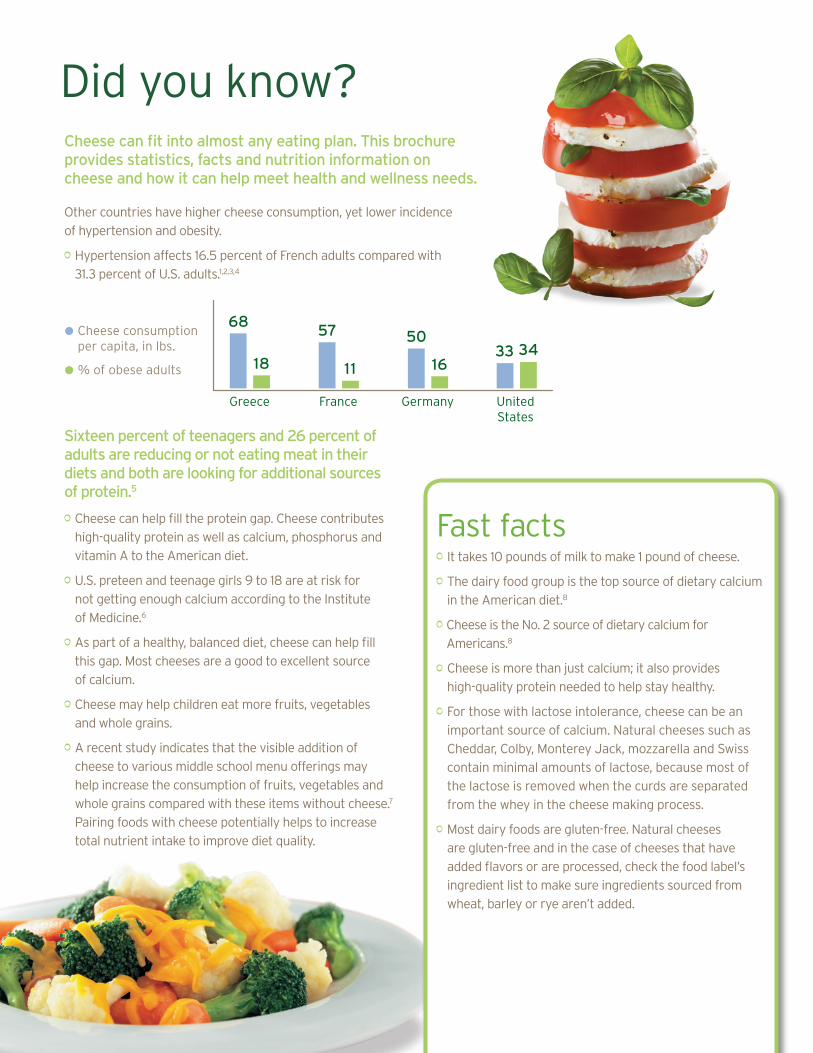
Cheese consumption per capita, in lbs.
57
France
11
Greece
68
18
Germany
50
16
UnitedStates
33 34% of obese adults
Fast facts• It takes 10 pounds of milk to make 1 pound of cheese.
• The dairy food group is the top source of dietary calcium
in the American diet.8
• Cheese is the No. 2 source of dietary calcium for
Americans.8
• Cheese is more than just calcium; it also provides
high-quality protein needed to help stay healthy.
• For those with lactose intolerance, cheese can be an
important source of calcium. Natural cheeses such as
Cheddar, Colby, Monterey Jack, mozzarella and Swiss
contain minimal amounts of lactose, because most of
the lactose is removed when the curds are separated
from the whey in the cheese making process.
• Most dairy foods are gluten-free. Natural cheeses
are gluten-free and in the case of cheeses that have
added flavors or are processed, check the food label’s
ingredient list to make sure ingredients sourced from
wheat, barley or rye aren’t added.
Did you know?Cheese can fit into almost any eating plan. This brochure provides statistics, facts and nutrition information on cheese and how it can help meet health and wellness needs.
Other countries have higher cheese consumption, yet lower incidence
of hypertension and obesity.
• Hypertension affects 16.5 percent of French adults compared with
31.3 percent of U.S. adults.1,2,3,4
Sixteen percent of teenagers and 26 percent of adults are reducing or not eating meat in their diets and both are looking for additional sources of protein.5
• Cheese can help fill the protein gap. Cheese contributes
high-quality protein as well as calcium, phosphorus and
vitamin A to the American diet.
• U.S. preteen and teenage girls 9 to 18 are at risk for
not getting enough calcium according to the Institute
of Medicine.6
• As part of a healthy, balanced diet, cheese can help fill
this gap. Most cheeses are a good to excellent source
of calcium.
• Cheese may help children eat more fruits, vegetables
and whole grains.
• A recent study indicates that the visible addition of
cheese to various middle school menu offerings may
help increase the consumption of fruits, vegetables and
whole grains compared with these items without cheese.7
Pairing foods with cheese potentially helps to increase
total nutrient intake to improve diet quality.
Cheese is a complex food made from a few simple
ingredients. Cheese makers have developed thousands
of varieties of cheese around the world, each with a unique
taste, texture and nutritional profile. No cheese is the
same — there are many standards of identity for cheese,
because there are a number of ways to adjust the basic
recipe to get a distinct product (e.g., Cheddar, Swiss, blue,
Brie, mozzarella, etc.).
Natural cheese is made from four basic ingredients:
milk, salt, starter culture or “good bacteria” and an
enzyme called rennet. The nutrients found in cheese
(e.g., calcium, protein, phosphorus) are there because milk
is the main ingredient in cheese.9 Salt is needed to finish
the transformation of liquid milk into enjoyable cheese.
Salt also acts as a natural preservative.10
Process cheese is made from high-quality natural cheese
so it also provides important nutrients such as calcium,
phosphorus and protein. And it can be made to have
more calcium as well as added vitamin D. Historically,
process cheese was used to provide shelf-stable cheese
for wartime and for shipping to warmer climates.11,12,13
The processing halts the aging process so the cheese
maintains its flavor, texture and smoothness. Process cheese
is customizable for flavor and qualities such as a smooth
melt that make it a versatile, tasty and easy-to-use food.
The amount of salt used impacts firmness, flavor, food
safety and preservation.10
• Its origins date back to ancient times when travelers
from Asia are believed to have brought the art of cheese
making to Europe. According to an ancient legend,
the first cheese was accidentally made by an Arabian
merchant who carried his milk in a pouch made from an
animal’s stomach. The rennet in the lining of the pouch
combined with the heat of the sun and caused the milk
to separate into curd and whey. That night he found
that the whey satisfied his thirst, and the cheese (curd)
satisfied his hunger.14
• Cheese making was common in the Roman Empire
and the Romans passed on their knowledge to the rest
of Europe. The art of cheese making flourished. The
Pilgrims included cheese in the Mayflower’s supplies for
their voyage to America in 1620. Once in the New World,
the craft of cheese making spread quickly.14
• The cheese making process is an art with roots going
back to Biblical times, and is a sustainable and natural
food that helps keep cultures, communities and families
vibrant and healthy today.14
Cheese has been around for centuries and is rich in culture
Cheese … a few simple ingredients
Cheese can fit into almost any eating plan
Because there are so many different types of
cheese, it’s a nutritious choice that easily fits
into most eating plans — the Dietary Guidelines
for Americans (DGA) general population
recommendations and many of its meal plans; the
Dietary Approaches to Stop Hypertension (DASH)
diet, diabetic, Mediterranean, plant-based, vegetarian,
gluten-free and low-lactose, among others.
What about fat?
Cheese accounts for only 9 percent of the total fat
and 16 percent of the saturated fat in the U.S. diet.15
Emerging research has shown simply reducing
saturated fat in the diet is not associated with a
decreased risk of heart disease or cardiovascular
disease.16 And scientists from Harvard have
identified a component in dairy fat that may reduce
the risk of type 2 diabetes.17
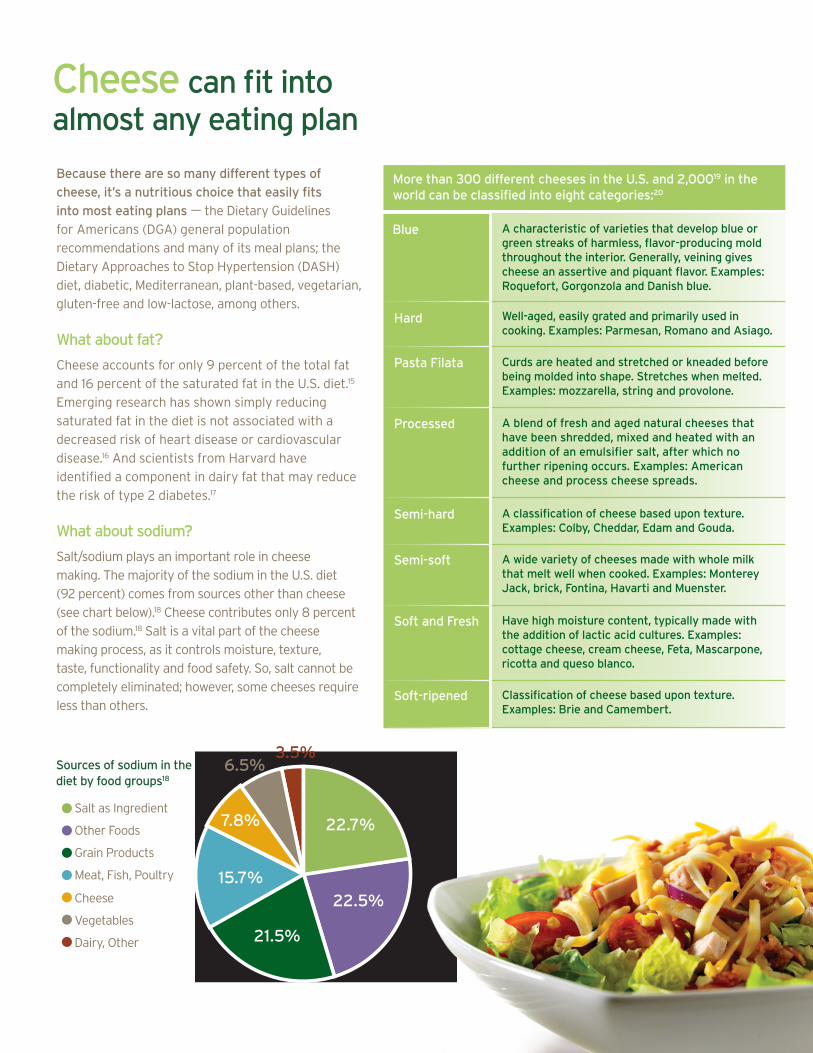
What about sodium?
Salt/sodium plays an important role in cheese
making. The majority of the sodium in the U.S. diet
(92 percent) comes from sources other than cheese
(see chart below).18 Cheese contributes only 8 percent
of the sodium.18 Salt is a vital part of the cheese
making process, as it controls moisture, texture,
taste, functionality and food safety. So, salt cannot be
completely eliminated; however, some cheeses require
less than others.
22.5%
21.5%
15.7%
6.5%
7.8%
3.5%
22.7% Salt as Ingredient
Other Foods
Grain Products
Meat, Fish, Poultry
Cheese
Vegetables
Dairy, Other
Sources of sodium in the diet by food groups18
More than 300 different cheeses in the U.S. and 2,00019 in the world can be classified into eight categories:20
Blue
Hard
Pasta Filata
Processed
Semi-hard
Semi-soft
Soft and Fresh
Soft-ripened
A characteristic of varieties that develop blue or green streaks of harmless, flavor-producing mold throughout the interior. Generally, veining gives cheese an assertive and piquant flavor. Examples: Roquefort, Gorgonzola and Danish blue.
Well-aged, easily grated and primarily used in cooking. Examples: Parmesan, Romano and Asiago.
Curds are heated and stretched or kneaded before being molded into shape. Stretches when melted. Examples: mozzarella, string and provolone.
A blend of fresh and aged natural cheeses that have been shredded, mixed and heated with an addition of an emulsifier salt, after which no further ripening occurs. Examples: American cheese and process cheese spreads.
A classification of cheese based upon texture. Examples: Colby, Cheddar, Edam and Gouda.
A wide variety of cheeses made with whole milk that melt well when cooked. Examples: Monterey Jack, brick, Fontina, Havarti and Muenster.
Have high moisture content, typically made with the addition of lactic acid cultures. Examples: cottage cheese, cream cheese, Feta, Mascarpone, ricotta and queso blanco.
Classification of cheese based upon texture. Examples: Brie and Camembert.
Watching lactose in your diet?
Try: Cheddar, Swiss, Monterey Jack or mozzarella.
*A blend of cheeses
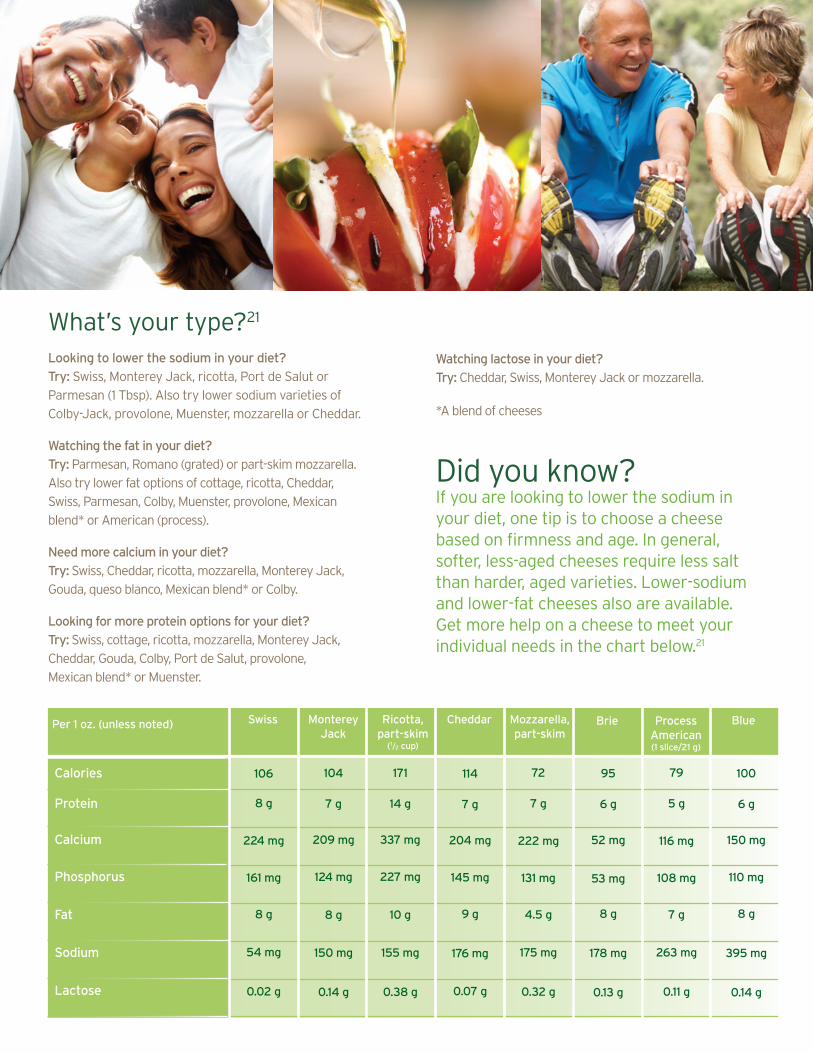
Per 1 oz. (unless noted)
Calories
Protein
Calcium
Phosphorus
Fat
Sodium
Lactose
106
8 g
224 mg
161 mg
8 g
54 mg
0.02 g
171
14 g
337 mg
227 mg
10 g
155 mg
0.38 g
72
7 g
222 mg
131 mg
4.5 g
175 mg
0.32 g
79
5 g
116 mg
108 mg
7 g
263 mg
0.11 g
104
7 g
209 mg
124 mg
8 g
150 mg
0.14 g
114
7 g
204 mg
145 mg
9 g
176 mg
0.07 g
95
6 g
52 mg
53 mg
8 g
178 mg
0.13 g
100
6 g
150 mg
110 mg
8 g
395 mg
0.14 g
Swiss CheddarMonterey Jack
Mozzarella, part-skim
Brie Process American (1 slice/21 g)
BlueRicotta, part-skim
(1/2 cup)
Did you know? If you are looking to lower the sodium in your diet, one tip is to choose a cheese based on firmness and age. In general, softer, less-aged cheeses require less salt than harder, aged varieties. Lower-sodium and lower-fat cheeses also are available. Get more help on a cheese to meet your individual needs in the chart below.21
What’s your type?21
Looking to lower the sodium in your diet?
Try: Swiss, Monterey Jack, ricotta, Port de Salut or
Parmesan (1 Tbsp). Also try lower sodium varieties of
Colby-Jack, provolone, Muenster, mozzarella or Cheddar.
Watching the fat in your diet?
Try: Parmesan, Romano (grated) or part-skim mozzarella.
Also try lower fat options of cottage, ricotta, Cheddar,
Swiss, Parmesan, Colby, Muenster, provolone, Mexican
blend* or American (process).
Need more calcium in your diet?
Try: Swiss, Cheddar, ricotta, mozzarella, Monterey Jack,
Gouda, queso blanco, Mexican blend* or Colby.
Looking for more protein options for your diet?
Try: Swiss, cottage, ricotta, mozzarella, Monterey Jack,
Cheddar, Gouda, Colby, Port de Salut, provolone,
Mexican blend* or Muenster.
Choose calories by the company they keepNatural cheese is made with four simple ingredients, and process cheese is
made from natural cheese. Cheese is a high-quality food rich in nutrients that
has been, and continues to be, part of a healthy eating plan. Many cheeses
are excellent sources of calcium and good sources of high-quality protein and
phosphorus — providing three nutrients particularly important for helping to
build and maintain healthy bones.21,22 Some natural and process cheeses are
fortified with vitamin D.
While nutrient profiles vary due to the large variety of cheeses, cheese
contributes essential nutrients for good health to the U.S. diet, including
calcium, phosphorus, protein, vitamin A and zinc. See chart to the left.
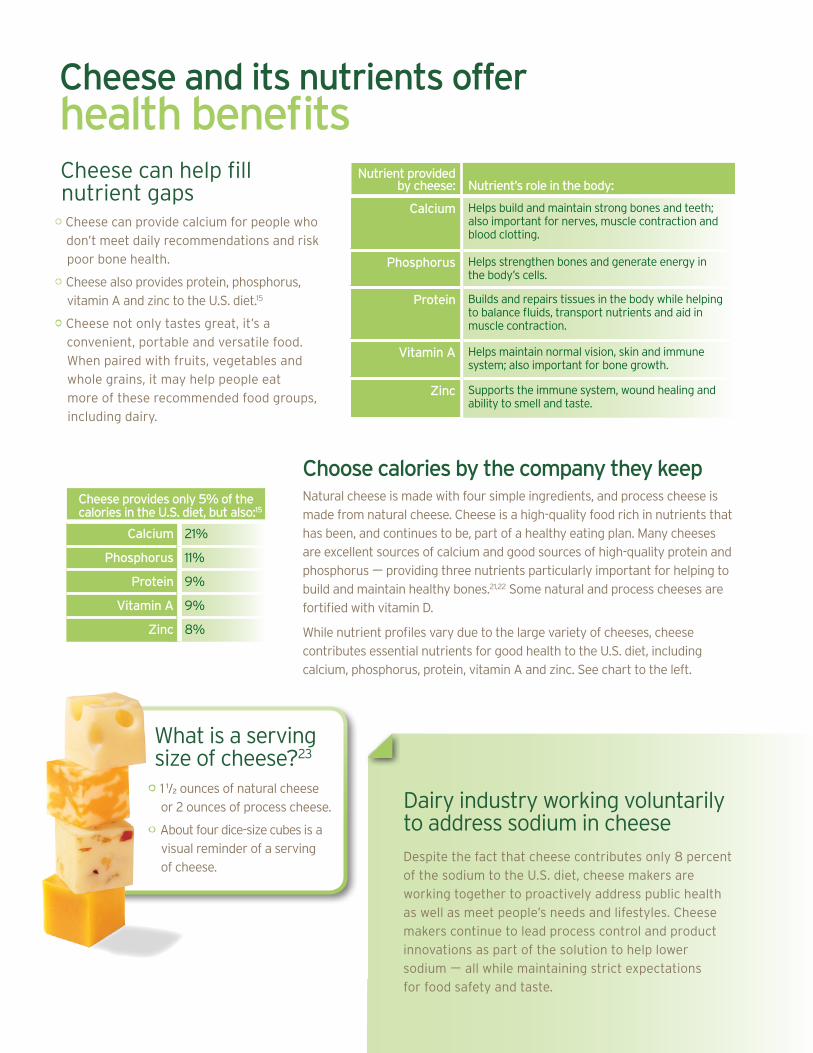
Cheese can help fill nutrient gaps
• Cheese can provide calcium for people who
don’t meet daily recommendations and risk
poor bone health.
• Cheese also provides protein, phosphorus,
vitamin A and zinc to the U.S. diet.15
• Cheese not only tastes great, it’s a
convenient, portable and versatile food.
When paired with fruits, vegetables and
whole grains, it may help people eat
more of these recommended food groups,
including dairy.
Nutrient provided by cheese: Nutrient’s role in the body:
Calcium Helps build and maintain strong bones and teeth; also important for nerves, muscle contraction and blood clotting.
Phosphorus Helps strengthen bones and generate energy in the body’s cells.
Protein Builds and repairs tissues in the body while helping to balance fluids, transport nutrients and aid in muscle contraction.
Vitamin A Helps maintain normal vision, skin and immune system; also important for bone growth.
Zinc Supports the immune system, wound healing and ability to smell and taste.
Cheese provides only 5% of the calories in the U.S. diet, but also:15
Calcium 21%
Phosphorus 11%
Protein 9%
Vitamin A 9%
Zinc 8%
Cheese and its nutrients offer health benefits
What is a serving size of cheese?23
• 1 1/2 ounces of natural cheese
or 2 ounces of process cheese.
• About four dice-size cubes is a
visual reminder of a serving
of cheese.
Dairy industry working voluntarily to address sodium in cheese Despite the fact that cheese contributes only 8 percent
of the sodium to the U.S. diet, cheese makers are
working together to proactively address public health
as well as meet people’s needs and lifestyles. Cheese
makers continue to lead process control and product
innovations as part of the solution to help lower
sodium — all while maintaining strict expectations
for food safety and taste.
©2011 Innovation Center for U.S. Dairy® and National Dairy Council®
References1 International Dairy Federation. Bulletin of the International Dairy Federation 446/2010: The World Dairy Situation 2010.2 Tibi-Levy Y, de Pouvourville G, Westerloppe J, Bamberger M. The cost of treating high blood pressure in general practice in France. Eur J Health Econ. 2008;9(3):229-236.3 Centers for Disease Control and Prevention. High Blood Pressure Frequently Asked Questions. Available at: http://www.cdc.gov/bloodpressure/faqs.htm. Accessed November 18, 2010.4 Organisation for Economic Co-operation and Development (OECD). Available at: http://www.oecd.org/document/35/0,3343,en_21571361_44315115_46064099_1_1_1_1,00.html.
Accessed March 8, 2011.5 DMI Emerging Diets Research, 2010. Available at: http://www.usdairy.com/Health/ConsumerTrendsProteinLocal/Pages/Market%20Insights.aspx. 6 IOM (Institute of Medicine). Dietary Reference Intakes for Calcium and Vitamin D. Washington, D.C.: The National Academies Press; 2011:480.7 Donnelly JE, Sullivan DK, Smith BK, et al. The Effects of Visible Cheese on the Selection and Consumption of Food Groups to Encourage in Middle School Students.
J Child Nutr Manag. 2010;34(1). Available at: http://schoolnutrition.org/Content.aspx?id=14040. 8 Fulgoni III VL, Keast DR, Quann EE, Auestad N. Food sources of calcium, phosphorus, vitamin D, and potassium in the U.S. Presented at Experimental Biology, Anaheim, Calif.
April 24-29, 2010.9 Cheesemaking: A Wisconsin Tradition. Available at: http://trade.eatwisconsincheese.com/wisconsin/how_cheese_is_made.aspx. Accessed February 15, 2011.10 Guinee TP. Salting and the role of salt in cheese. International Journal of Dairy Technology. 2004;57(2-3):99-109.11 Ustunol Z. Processed Cheese: What is that stuff anyway? Michigan Dairy Review. 2009. Available at: https://www.msu.edu/~mdr/vol14no2/ustunol.html. Accessed February 6, 2011.12 What’s That Stuff? Chemical & Engineering News. 2000;78(6):51. Available at: http://pubs.acs.org/cen/whatstuff/stuff/7806sci2.html. Accessed February 16, 2011.13 Kraft Foods. Kraft History: JL Kraft. Kraft.com. Available at: http://www.kraft.com.au/products/krafthistory/fredwalkerfounder/jlkraft.aspx. Accessed May 16, 2011.14 International Dairy Foods Association. Available at: http://www.idfa.org/resource-center/industry-facts/cheese/. Accessed February 16, 2011.15 Dairy Research Institute™, NHANES (2003-2006). Ages 2+ years. Data Source: Centers for Disease Control and Prevention, National Center for Health Statistics, National Health
and Nutrition Examination Survey. Hyattsville, Md.: U.S. Department of Health and Human Services, Centers for Disease Control and Prevention. 2003-2004; 2005-2006. Available at: http://www.cdc.gov/nchs/nhanes.htm.
16 Siri-Tarino PW, Sun Q, Hu FB, Krauss RM. Meta-analysis of prospective cohort studies evaluating the association of saturated fat with cardiovascular disease. Am J Clin Nutr. 2010;91(3):535-546.
17 Mozaffarian D, Cao H, King IB, et al. Trans-Palmitoleic Acid, Metabolic Risk Factors, and New-Onset Diabetes in U.S. Adults: A Cohort Study. Ann Intern Med. 2010;153(12):790-799. 18 Hentges E. Sources of Sodium in the Food Supply. Paper presented at: Institute of Medicine Committee on Strategies to Reduce Sodium Intake, Information-Gathering Workshop;
2009; Washington, D.C.19 International Dairy Foods Association. Available at: http://www.idfa.org/news--views/media-kits/cheese/cheese-facts/. Accessed February 16, 2011.20 Wisconsin Milk Marketing Board. Available at: http://www.eatwisconsincheese.com/cheese/cheesecyclopedia.aspx. Accessed March 10, 2011.21 U.S. Department of Agriculture, Agricultural Research Service. 2010. USDA National Nutrient Database for Standard Reference, Release 23. Nutrient Data Laboratory Home Page.
Available at: http://www.ars.usda.gov/ba/bhnrc/ndl. Accessed March 9, 2011.22 U.S. Department of Health and Human Services. Bone Health and Osteoporosis: A Report of the Surgeon General. Rockville, Md.: U.S. Department of Health and Human Services,
Office of the Surgeon General, 2004.23 U.S. Department of Health and Human Services and U.S. Department of Agriculture. Dietary Guidelines for Americans, 2010. 7th Edition, Washington, D.C.: U.S. Government
Printing Office, January 2011.
Education is the true link between diet and healthSpeak with your health care provider for information
specific to your needs.