Check Out the Web Study Guide! - Booksca.ca
45
Transcript of Check Out the Web Study Guide! - Booksca.ca


2

Check Out the Web Study Guide!You will notice a reference throughout this version of Laboratory Manual for ExercisePhysiology, Second Edition, to a web study guide. This resource is available to supplementyour ebook.
The web study guide provides electronic versions of the individual and group data sheets,question sets, and case studies for each laboratory activity. In addition, 10 of the laboratoryactivities are provided as interactive labs, some of which include video, that give you anapproximation of the real-world experience of performing these 10 labs. We are certain youwill enjoy this unique online learning experience.
Follow these steps to purchase access to the web study guide:
1. Visit https://tinyurl.com/LabManForExPhys2EWSG.2. Click the Add to Cart button and complete the purchase process.3. After you have successfully completed your purchase, visit the book’s website at
www.HumanKinetics.com/LaboratoryManualForExercisePhysiology.4. Click the second edition link next to the corresponding second edition book cover.5. Click the Sign In link on the left or top of the page and enter the email address and
password that you used during the purchase process. Once you sign in, your onlineproduct will appear in the Ancillary Items box. Click on the title of the web studyguide to access it.
6. Once purchased, a link to your product will permanently appear in the menu on theleft. All you need to do to access your web study guide on subsequent visits is sign into www.HumanKinetics.com/LaboratoryManualForExercisePhysiology and followthe link!
Click the Need Help? button on the book’s website if you need assistance along theway.
3
Laboratory Manual for Exercise Physiology
Second Edition
G. Gregory Haff, PhD, CSCS,*D, FNSCA, ASCC
School of Medical and Health Sciences
Edith Cowan University
Charles Dumke, PhD, FACSM
Health and Human Performance
University of Montana
4

Library of Congress Cataloging-in-Publication Data
Names: Haff, Greg, author. | Dumke, Charles, 1966- author.
Title: Laboratory manual for exercise physiology / G. Gregory Haff, Charles
Dumke.
Description: Second edition. | Champaign, IL : Human Kinetics, [2019] |
Includes bibliographical references.
Identifiers: LCCN 2017021596 (print) | LCCN 2017022349 (ebook) | ISBN
9781492536949 (print) | ISBN 9781492536956 (e-book)
Subjects: | MESH: Exercise--physiology | Physical Fitness--physiology |
Exercise Test | Laboratory Manuals
Classification: LCC QP301 (ebook) | LCC QP301 (print) | NLM QT 25 | DDC
613.7/1--dc23
LC record available at https://lccn.loc.gov/2017021596
ISBN: 978-1-4925-3694-9 (print)
Copyright © 2019, 2012 by G. Gregory Haff and Charles Dumke
All rights reserved. Except for use in a review, the reproduction or utilization of this work in any form or by any electronic, mechanical, or other means,now known or hereafter invented, including xerography, photocopying, and recording, and in any information storage and retrieval system, is forbiddenwithout the written permission of the publisher.
Notice: Permission to reproduce the following material is granted to instructors and agencies who have purchased Laboratory Manual for Exercise Physiology,Second Edition: pp. 64-85. The reproduction of other parts of this book is expressly forbidden by the above copyright notice. Persons or agencies who havenot purchased Laboratory Manual for Exercise Physiology, Second Edition, may not reproduce any material.
The web addresses cited in this text were current as of November 2017, unless otherwise noted.
Senior Acquisitions Editor: Amy N. Tocco
Senior Developmental Editor: Amanda S. Ewing
Managing Editor: Anna Lan Seaman
Copyeditor: Alisha Jeddeloh
Permissions Manager: Dalene Reeder
Senior Graphic Designer: Joe Buck
Cover Designer: Keri Evans
Photograph: © Human Kinetics
Photographs (interior): © Human Kinetics, unless otherwise noted
Photo Asset Manager: Laura Fitch
Photo Production Manager: Jason Allen
Senior Art Manager: Kelly Hendren
Illustrations: © Human Kinetics, unless otherwise noted
Printer: Walsworth
We thank the University of Montana in Missoula, Montana, for assistance in providing the location for the photo and video shoot for this book.
The video contents of this product are licensed for educational public performance for viewing by a traditional (live) audience, via closed circuit television,or via computerized local area networks within a single building or geographically unified campus. To request a license to broadcast these contents to awider audience—for example, throughout a school district or state, or on a television station—please contact your sales representative(www.HumanKinetics.com/SalesRepresentatives).
Printed in the United States of America
10 9 8 7 6 5 4 3 2 1
The paper in this book was manufactured using responsible forestry methods.
Human Kinetics
P.O. Box 5076
Champaign, IL 61825-5076
Website: www.HumanKinetics.com
In the United States, e-mail [email protected] or call 800-747-4457.
In Canada, e-mail [email protected].
In Europe, e-mail [email protected].
For information about Human Kinetics’ coverage in other areas of the world, please visit our website: www.HumanKinetics.com
E6910
5

ContentsLaboratory Activity Finder
PrefaceUpdates to Second EditionSpecial Laboratory FeaturesWeb Study GuideInstructor AncillariesNotes for Instructors
Acknowledgments
Chapter Laboratory 1: Primary Data CollectionTest VariablesMeasurement TerminologyMetric ConversionsBackground and Environmental InformationDescriptive StatisticsPresentation of ResultsInterpretation of Data
Chapter Laboratory 2: Pretest ScreeningInformed ConsentPhysical Activity Readiness Questionnaire for EveryoneHealth History QuestionnaireSigns and Symptoms of Disease and Medical ClearanceCoronary Risk Factor AnalysisLifestyle EvaluationDisease Risk Stratification
Chapter Laboratory 3: Flexibility TestingDirect and Indirect ROM AssessmentBody Areas
Chapter Laboratory 4: Blood Pressure MeasurementsBlood Pressure Responses to ExerciseAccurate Blood Pressure Checks
Chapter Laboratory 5: Resting Metabolic Rate DeterminationsAerobic Metabolism and Respiratory Exchange RatioTotal Energy Expenditure and RMR
Chapter Laboratory 6: Oxygen Deficit and EPOC Evaluations
6
Transition From Rest to ExerciseOxygen Uptake During Exercise and Recovery
Chapter Laboratory 7: Submaximal Exercise TestingMeasurement of Heart RateRating of Perceived Exertion
Chapter Laboratory 8: Aerobic Power Field AssessmentsCooper 1.5-Mile Run/Walk TestCooper 12-Minute Run/Walk TestRockport Fitness Walking Test
Chapter Laboratory 9: High-Intensity Fitness TestingLéger 20 m Shuttle Run TestYo-Yo Intermittent Recovery Test30-15 Intermittent Fitness Test
Chapter Laboratory 10: Maximal Oxygen Consumption MeasurementsSelecting a Test ProtocolMonitoring Progress With RPE ScalesEstimating Fuel Usage With RERVentilatory Threshold
Chapter Laboratory 11: Blood Lactate Threshold AssessmentDetermining the Deflection PointSelecting a Test MethodRole of the Ventilatory Threshold
Chapter Laboratory 12: Musculoskeletal Fitness MeasurementsAssessments of Muscular StrengthAssessments of Muscular Endurance
Chapter Laboratory 13: Anaerobic Fitness MeasurementsSprinting Performance Tests for Estimating Horizontal PowerJumping Performance Tests for Determining Vertical PowerFormulas for Estimating Vertical PowerBosco Test for Estimating Power EnduranceDetermining the Eccentric Utilization RatioWingate Anaerobic Test for Determining Anaerobic Cycling PowerMargaria-Kalamen Stair-Climb Test for Determining Anaerobic Power
Chapter Laboratory 14: Pulmonary Function TestingPulmonary Function TestingPulmonary Function Testing as a Tool for Diagnosing Pulmonary DiseaseRespiratory Limitations on Exercise
7

Chapter Laboratory 15: Body Composition AssessmentsBody Composition ModelsBMI for Categorizing Body CompositionCircumference Measurements and Health RiskSkinfold Thickness as a Measure of Body Fat
Chapter Laboratory 16: Electrocardiograph MeasurementsElectrical Activity of the HeartPlacement of ECG LeadsInterpreting the ECG RecordingECG as a Tool for Diagnosing Cardiac AbnormalitiesHeart Rate Response to Exercise
Appendix A
Appendix BTreadmill WalkingTreadmill RunningLeg Ergometry
Appendix CConstantsConversion of VATPS to VSTPDCalculation of Oxygen Consumption and Carbon Dioxide ProductionDefinitions
Appendix D
Appendix ETreadmill CalibrationBicycle Ergometer Calibration
Appendix FACSM CertificationsCSEP CertificationsBASES Accreditations and CertificationsESSA AccreditationsNSCA Certifications
References
About the Authors
8

Laboratory Activity FinderHere is an alphabetical listing of the laboratory activities.
30-15 Intermittent Fitness Test (30-15IFT-40m)
Anaerobic Cycling Power
Basic Data
Basic Screening Procedures
Blood Lactate After Anaerobic Exercise
Blood Lactate Measurement at Rest
BMI and Circumference Data
Calculation of Oxygen Deficit and EPOC
Canadian, Traditional, and Backsaver Sit-and-Reach Test Comparisons
Cooper 1.5-Mile Run/Walk Test and 12-Minute Run/Walk Test
Cycle Ergometer O2max Test
Effects of Body Position on BP
Effects of Body Position on the Heart Axis
Effects of Dynamic Exercise on BP
Effects of Isometric Contractions on BP
Estimating Relative Body Fat Using Hydrodensitometry
Exercise-Induced Asthma
Exercise-Induced Ventilatory Limitations
Graded Treadmill O2max Test
Jumping Performance
9

Jumping Performance With a Switch Mat
Léger 20 m Shuttle Run Test (20mSRT)
LT During an Incremental Cycle TestM
Lung Volumes and Capacities
Margaria-Kalamen Stair-Climb Test
Maximal Handgrip Strength
Maximal Lower-Body Strength
Maximal Upper-Body Strength
Measuring RMR
Modified 30-15 Intermittent Fitness Test (30-15IFT-28m)
Power Endurance
Predicting RMR
Pretest Results
Pulmonary Function
Resting ECG
Rockport Fitness Walking Test
Shoulder Flexibility Test Comparisons
Sprinting Performance
Statistical Procedures
Submaximal Bench Step Test
Submaximal Cycle Ergometer Test
Submaximal Exercise Effects With the 12-Lead ECG
Submaximal Treadmill Test
Tables and Graphs
10

Techniques for Measuring Skinfold Thickness
Traditional, Wall, V-Sit, and Chair Sit-and-Reach Test Comparisons
Upper-Body Muscular Endurance
YMCA, Backsaver, and Goniometer Test Comparisons
Yo-Yo Intermittent Recovery Test (Yo-Yo IRT)
11

PrefaceLaboratory Manual for Exercise Physiology, Second Edition, is a detailed source of tests for anundergraduate or graduate exercise physiology laboratory course. The text covers a widevariety of tests typically performed in an exercise physiology laboratory when evaluatingathletes, clinical clients, or other generally healthy individuals. The design allows instructorsto choose activities that best suit their course needs. Specifically, each chapter offers a widevariety of laboratory activities that can be mixed and matched depending upon theinstrumentation and time allotted for your course. The range of field and laboratory testspresented here gives students broad exposure to testing that can be applied in a wide varietyof professional settings. Organized in a logical progression, the labs build in complexity asstudents progress through the book and develop their knowledge base. Ultimately, the textserves as a resource for basic testing procedures used in assessing human performance,health, and wellness.
12

Updates to Second Edition
The second edition of this text brings some new and exciting updates. Perhaps the mostimportant is the inclusion of 10 virtual laboratory activities that provide an enhanced,immersive learning experience for students. These activities, in which video is usedextensively, allow students to interact with virtual lab partners, observe the proper setupand use of equipment, and participate in following test protocols in the onlineenvironment. The virtual labs align with specific aspects of the lab activities introduced inthe manual, often presenting some of the more complex lab concepts.
Other updates in this second edition of the manual include laboratory activities thatintroduce common intermittent fitness tests such as the Léger 20 m shuttle run test, theYo-Yo Intermittent Recovery Test, and the 30-15 Intermittent Fitness Test. These types oftests are increasingly popular in the fitness world, and their addition to the manual allowsstudents to learn how to perform these tests and interpret their results.
In addition to these new lab activities, updates have been made to every lab in the manual:
Added new research and information pertaining to each laboratory topicUpdated standards and norms with new published researchClarified instructionsAdded new case studies to illuminate laboratory conceptsIncluded answers to the case studiesUpdated question sets to help students better understand lab concepts
13

Special Laboratory Features
Each laboratory chapter is a complete lesson, beginning with objectives, definitions of keyterms, and background information that sets the stage for learning. For each of thelaboratory activities, you will find step-by-step instructions, making it easier for those newto the lab setting to complete the procedures. Each laboratory activity has a data sheet torecord individual findings, as well as question sets related to the data collected by students;these questions invite students to put their laboratory experience into context.
14

Web Study Guide
The web study guide provides additional tools that can assist students in working throughthe 49 laboratory activities in the book. All laboratory activities in the book are supportedby the following:
Electronic versions of the individual data sheets from the book, which students candownload to a computer or mobile device and print.Group data sheets, found only in the web study guide, that allow students to movebeyond collecting individual data; with these group sheets, students can compile datafrom the entire class, calculate values such as mean and range, and compare findingsto the normative data discussed in the lab.Downloadable versions of the question sets from the book, which can be submittedelectronically, giving students an easy way to turn in answers after completing alaboratory activity.Practical case study questions, found only in the web study guide, that help studentsbegin to critically analyze data collection and synthesize it with material they havelearned in lecture and other courses. The case studies are provided as downloadableelectronic files that students can complete and submit online.
In addition, 10 of the laboratory activities are provided as interactive labs, all of whichinclude video, that give students an approximation of the real-world experience ofperforming the lab activities. These interactive labs complement the laboratory manual.This sentence identifies the 10 interactive labs:
This laboratory activity is supported by a virtual lab experience in the webstudy guide.
The web study guide is available atwww.HumanKinetics.com/LaboratoryManualForExercisePhysiology.
15

Instructor Ancillaries
An image bank is available for instructor use. The image bank includes most of the figures,tables, and photos from the book, saved as individual files. Instructors can use these itemsto create a PowerPoint presentation, enhance lecture notes, create student handouts, and soon. Instructors also have full access to the web study guide, and they have access to the casesstudy answers.
16

Notes for Instructors
This manual is geared toward use in an exercise physiology laboratory course. It is designedto translate the scientific foundation developed in a core exercise physiology lecture course—using, for example, a text such as Physiology of Sport and Exercise by Kenney, Wilmore,and Costill (Human Kinetics, 2016)—into practical applications typically performed in avariety of settings. To accomplish this goal, the manual is divided into 16 laboratories thatlead students through a series of activities: primary data collection, pretesting screening,flexibility testing, blood pressure measurements, resting metabolic rate, oxygen deficit andEPOC evaluations, submaximal exercise testing, aerobic power field assessments, high-intensity fitness testing, maximal oxygen consumption measurements, blood lactatethreshold assessment, musculoskeletal fitness measurements, anaerobic fitnessmeasurements, pulmonary function testing, body composition assessments, andelectrocardiograph measurements.
Each laboratory provides background information and detailed step-by-step procedures fora variety of tests. In addition, because exercise physiology laboratories are equipped invarious ways, the labs present multiple methods for introducing the testing concept. Forexample, laboratory 13 presents multiple methods for assessing vertical jump performance:jump and reach, Vertec, and switch mat. Equipment lists at the beginning of each activitymake it easier to choose the labs that will work best in your facility. This versatility enablesyou to choose activities that best fit your facilities and best meet the needs of your students.
17

AcknowledgmentsI would like to thank Human Kinetics for their patience with Chuck and me as we sloggedthrough the writing of the second edition of this text. Specifically, I would like to thankRoger Earle for his belief in our abilities and, more importantly, for his friendship.Additionally, I would like to thank Amy, Lisa, and Amanda for working tirelessly to assistus in updating this text to improve upon our first edition.
While the book was difficult to complete and, at times, very stressful, I would like to thankChuck for his patience and dedicated efforts and, more importantly, for being one of myvery best friends and favorite colleagues.
To my friends Michael Stone, Duncan French, Joel Cramer, Jay Dawes, and TravisTriplett, I am honored to call you my friends, and you each impact my life more than youknow. I look forward to enjoying life in your company.
Finally, I would be remiss if I did not acknowledge the most important person in my life—my wife, Erin. You are the rock that supports me in all endeavors that I undertake. Whilethings never seem to go smoothly or appear to be working out, your ability to ground meand to make me laugh, stop, and watch the waves is more than anyone could ever want in alife partner. I am blessed to have you in my life.
—Greg Haff
Thanks to Greg for being a great coauthor and friend. I wouldn’t have wanted to do this bymyself or with anybody else. Human Kinetics deserves a shout-out for their experience,professionalism, and patience with our ideas and extension of deadlines. Thank you fortaking this book to product and being open to creative ideas for the second edition.
I would also like to thank my colleagues in the department of health and humanperformance at the University of Montana for their patience with me as I worked on thisproject.
Most importantly, thank you to my parents, Bob and Leah, and to my wife, Shannon; son,Carter; and dog, Rastro.
—Chuck Dumke
18

Laboratory 1Primary Data Collection
19

ObjectivesDefine basic terminology associated with testing.Learn metric conversions and the units recommended by the InternationalSystem of Units (SI).Provide a rationale for collecting basic information during testing.Present the methods for evaluating temperature, barometric pressure, andrelative humidity.Present basic statistical methods for evaluating test results.Describe types of graphics for presenting data.
20

Definitionsaccuracy—Degree of a measurement’s closeness to the actual value.
barometric pressure—Pressure exerted by ambient air.
central tendency—Score that best represents all scores collected for a group.
dependent variable—Effect or yield of the independent variable.
displacement—Length that an object moves in a straight line between two points.
distance—Total length that an object travels (may or may not be in a straight line).
effect size—Statistical method used to determine the magnitude of an effect.
energy—Capacity to do work, expressed as a joule (J).
field/laboratory test—Test that can be completed in either a field or a laboratorysetting.
field test—Test completed in a field setting.
force—Mass multiplied by acceleration, expressed as a newton (N).
independent variable—Variable that is manipulated.
inferential statistics—Statistical methods that can be used to draw generalconclusions about a population based on a population sample.
laboratory test—Sophisticated test that must be conducted in a laboratory setting.
magnitude statistics—Statistical methods that can be used to evaluate themagnitude of change, typically using the smallest worthwhile change or effect size.
mass—Measure of matter that constitutes an object; expressed in kilogram (kg).
mean—Average score of a sample.
median—Middle score of a sample.
mode—Most frequent score of a sample.
normative data—Placement within a population; also referred to as norms or norm
21

data.
power—Rate at which work can be performed, represented as a watt (W).
precision—Degree to which a test is reproducible with nearly the same value.
range—Distance between end points in a group of scores.
relative humidity—Amount of water or percent saturation in ambient air.
reliability—Repeatability of a measure.
smallest worthwhile change—Smallest practically important change in somemeasure.
speed—Scalar quantity generally considered to be how fast a body is moving;calculated by dividing distance covered by time.
standard—Desirable or target score.
standard deviation (SD)—Measure of variability that shows variation or dispersionfrom the mean.
typical error (TE)—The most common measure of reliability; calculated as thestandard deviation of the change scores between repeated measures divided by √2.
validity—Accuracy of a measure.
variability—Spread of a data set.
variable—A characteristic.
velocity—Vector quantity calculated by dividing displacement by time.
wet-bulb globe temperature (WBGT)—Measure of temperature that estimatescooling capacity of the surrounding environment.
work—Force times the distance through which it acts.
z-score—Standardized score indicating the distance of an individual score instandard deviation units from the mean of a group.
Testing human performance under exercise conditions allows for the evaluation of thehuman body’s functional ability. This information can give us an understanding of the
22
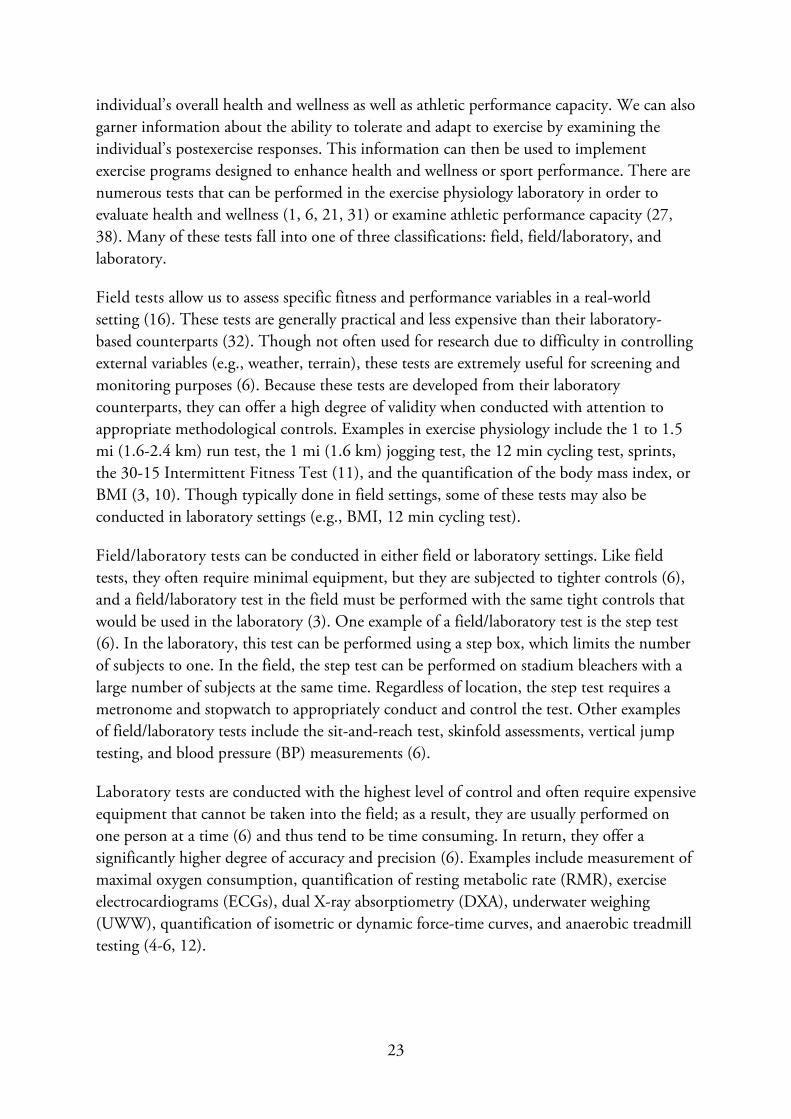
individual’s overall health and wellness as well as athletic performance capacity. We can alsogarner information about the ability to tolerate and adapt to exercise by examining theindividual’s postexercise responses. This information can then be used to implementexercise programs designed to enhance health and wellness or sport performance. There arenumerous tests that can be performed in the exercise physiology laboratory in order toevaluate health and wellness (1, 6, 21, 31) or examine athletic performance capacity (27,38). Many of these tests fall into one of three classifications: field, field/laboratory, andlaboratory.
Field tests allow us to assess specific fitness and performance variables in a real-worldsetting (16). These tests are generally practical and less expensive than their laboratory-based counterparts (32). Though not often used for research due to difficulty in controllingexternal variables (e.g., weather, terrain), these tests are extremely useful for screening andmonitoring purposes (6). Because these tests are developed from their laboratorycounterparts, they can offer a high degree of validity when conducted with attention toappropriate methodological controls. Examples in exercise physiology include the 1 to 1.5mi (1.6-2.4 km) run test, the 1 mi (1.6 km) jogging test, the 12 min cycling test, sprints,the 30-15 Intermittent Fitness Test (11), and the quantification of the body mass index, orBMI (3, 10). Though typically done in field settings, some of these tests may also beconducted in laboratory settings (e.g., BMI, 12 min cycling test).
Field/laboratory tests can be conducted in either field or laboratory settings. Like fieldtests, they often require minimal equipment, but they are subjected to tighter controls (6),and a field/laboratory test in the field must be performed with the same tight controls thatwould be used in the laboratory (3). One example of a field/laboratory test is the step test(6). In the laboratory, this test can be performed using a step box, which limits the numberof subjects to one. In the field, the step test can be performed on stadium bleachers with alarge number of subjects at the same time. Regardless of location, the step test requires ametronome and stopwatch to appropriately conduct and control the test. Other examplesof field/laboratory tests include the sit-and-reach test, skinfold assessments, vertical jumptesting, and blood pressure (BP) measurements (6).
Laboratory tests are conducted with the highest level of control and often require expensiveequipment that cannot be taken into the field; as a result, they are usually performed onone person at a time (6) and thus tend to be time consuming. In return, they offer asignificantly higher degree of accuracy and precision (6). Examples include measurement ofmaximal oxygen consumption, quantification of resting metabolic rate (RMR), exerciseelectrocardiograms (ECGs), dual X-ray absorptiometry (DXA), underwater weighing(UWW), quantification of isometric or dynamic force-time curves, and anaerobic treadmilltesting (4-6, 12).
23

Test Variables
A central goal in the exercise physiology laboratory is to quantify specific physiological orperformance characteristics. A characteristic is usually termed a variable. Variables oftenquantified in an exercise physiology laboratory include maximal strength, bodycomposition, anaerobic or aerobic power, and flexibility.
Variables are generally categorized as either independent or dependent. The independentvariable is the one that is manipulated, whereas the dependent variable is the effect of,response to, or yield of the independent variable (39). In other words, the independentvariable is controlled by the person administering the test, and the dependent variable is thephysiological or performance response to the independent variable. In a treadmill test, forexample, the independent variable is the speed of the treadmill; the dependent variable isthe heart rate (HR) response or oxygen consumption rate. When graphically representingthese variables, we place the independent variable on the x-axis (horizontal axis) and thedependent variable on the y-axis (vertical axis) (39). In the example of the treadmill test,then, the workload or speed would be the independent variable presented on the x-axis, andthe HR response would be the dependent variable presented on the y-axis.
24

Measurement Terminology
When examining physiological and performance characteristics, exercise physiologists usespecific measurement terminology to discuss their data. This terminology is based on theguidelines set forth in the Système International d’Unités, or International System of Units(SI) (42). This system is designed to adhere to the core principles of being simple, precise,and accurate (table 1.1).
25

Following are some examples of common terms used in the exercise physiology laboratory.
The most common measurements of mass performed in the exercise physiology laboratoryare measurements of body mass, lean body mass, and fat mass. Though the terms body massand body weight are often used interchangeably in the United States, it is more accurate touse the term body mass. The SI base unit for mass is the kilogram (kg) (42).
Force is a vector quantity characterized by both magnitude and direction. It can becalculated according to Isaac Newton’s second law, which states that force is equivalent tomass multiplied by acceleration (29):
Force = mass × acceleration
For example, body mass is used often in this laboratory manual when calculating work orwork rate, and in such instances body mass is converted to newtons and used in othercalculations. Forces are generally expressed as newtons (N), which are calculated bymultiplying the object’s mass in kg by its downward acceleration due to gravity:
Force (N) = mass × acceleration = mass (kg) × 9.81 m ∙ s−2
When thinking about force, it is not uncommon to consider the expression of strength.Generally, strength is the maximal force generated by a muscle or group of muscles at aspecific velocity or the ability to generate external force (29). Such capability oftenconstitutes a major concern. Force-generating capacity plays an important role in the abilityto perform in sport (10) and activities of daily living (22). In addition, the ability torepetitively express submaximal forces is important in endurance activities. Thus strength,or force-generating capacity, exerts a major effect on athletic performance and overallfitness.
Both displacement and distance can be considered as lengths. Displacement is measured in
26

a straight line from one point to another, whereas distance is the total length that an objecttravels and may or may not be limited to a straight line. Both are typically measured incentimeters or meters, but the meter is the SI base unit. Quantification of displacement anddistance contributes to calculations such as work, velocity of movement, and expression ofpower.
To calculate the amount of work completed, multiply the amount of force exerted on anobject by the distance that the object is moved:
Work (J) = force (N) × distance (m)
The results of this equation are reported in joules (J; the SI unit for work), which is equalto newton × meters (N ∙ m). As a whole, work is directly related to the amount of metabolicenergy expended—the more work performed, the more kilocalories used (28, 37).
It is important to differentiate between speed and velocity. Speed is a scalar quantitygenerally considered to be how fast a body is moving, which is directly related to the totaldistance covered divided by time. Though similar to speed, velocity is an actual vector thathas a magnitude and a direction. Therefore, velocity is based on both speed and direction(26). The difference between speed and velocity centers on the difference between distanceand displacement. Mathematically, speed is calculated by dividing distance by time,whereas velocity is calculated by dividing displacement by time:
Speed = distance / time
Velocity = displacement / time
For example, a runner who completes a 400 m dash in 49 s would have an average velocityof 0 m ∙ s−1 because the displacement would be zero. In this instance, then, it would bebetter to use average speed to represent how fast the runner is moving, and the result wouldbe 8.16 m ∙ s−1.
Velocity is the linear speed of the object, distance represents how far the object has movedin a given direction, and time represents how long it took to cover that distance (26). Forexample, if a 100 m sprint was run in 9.58 s, the average velocity of the event would be10.4 m ∙ s−1.
Power is the rate at which work can be performed (37, 41), and the ability to express highpower outputs is one of the most important factors in sport performance (8). Power can becalculated in several ways:
Power = work / time
= force × velocity
27

= force × (displacement / time)
Power is generally proportional to the amount of energy used (37)—thus, the higher thepower output, the higher the work rate, which corresponds to a faster expenditure ofenergy. Because of this relationship, power is often used when discussing the transfer ofmetabolic energy to physical performance (24, 25). For example, power is used to describethis transformation when talking about aerobic power and anaerobic power.
In a general sense, energy is the capacity to do work (9), and it is often represented injoules. When examining metabolic energy release—the result of work done (energy used)and heat released (energy wasted)—the joule is the universally accepted unit (6). In theUnited States, however, it is more common to represent this release as kilocalories (kcal).
It is possible to estimate caloric or kilojoule (kJ) expenditure by determining oxygen uptakeand cost. It can be assumed that 1 liter (L) of oxygen uptake corresponds to approximately5 kcal or 21 kJ of energy expenditure. Thus, caloric expenditure can be calculated with oneof the following formulas (3):
Energy expenditure (kcal ∙ min−1) = oxygen uptake (L ∙ min−1) × 5 (kcal ∙ L−1)
Energy expenditure (kJ ∙ min−1) = oxygen uptake (L ∙ min−1) × 21 (kJ ∙ L−1)
These figures are only approximations, and they can be influenced by the intensity ofexercise. Specifically, higher intensities result in more energy being expended per liter ofoxygen consumed (6).
28

Metric Conversions
The use of metric units is standard in most exercise physiology laboratories. Though themetric system is not popular in the United States, it is the preferred system whenconducting testing and research. Laboratory work in exercise physiology typically involvesthree categories of conversion: length, weight, and volume.
The standard metric and SI unit for length in scientific publications is the meter; it isgenerally used when reporting a person’s height. The meter is easily converted to othermetric units, such as the millimeter, centimeter, and kilometer (e.g., 0.01 km = 10 m =1,000 cm = 10,000 mm) (see appendix A). To convert from the American system to themetric system, simply multiply length in inches by 2.54 to figure the length in centimeters.A more complete list of conversions can be found in appendix A.
When referring to weight, the base metric and SI unit is the kilogram (kg), which is thepreferred method for representing mass in scientific literature (40, 42). In the exercisephysiology laboratory, it is common to represent body mass, lean body mass, and fat massin terms of kilograms (3). The conversion of pounds to kilograms is easily accomplished bydividing the pound weight by 2.2046. A summary of basic conversions for measurementsof mass can be found in appendix A.
The basic metric unit for volume is the liter, also known as a cubic decimeter (dm3) (40).The SI unit for volume is the cubic meter (m3) because it can be used to express thevolumes of solids, liquids, and gases (40, 42). For example, 0.0015 m3 is equivalent to1,500 mL or 1.5 L (appendix A). The liter is commonly used when quantifying lungvolume, oxygen consumption, cardiac output (CO), stroke volume (SV), and sweat loss.Length and weight measures can also be converted easily to volume measures. For example,if an athlete loses 1 kg of body mass during a training session, this is equivalent to 1 L ofsweat loss and thus would require >1 L of water to restore fluid balance (6). A summary ofvolume conversions can be found in appendix A.
29

Background and Environmental Information
Collecting basic information is an important organizational part of the testing process (3,6). In planning a testing session, you should consider several distinct items as part of thebasic information collected—for example, the subject’s name or identification number, age,and sex. It is also important to note the date, time of day, and who conducted the testingsession.
Name or identification number: Typically, the subject’s surname is noted first,followed by a comma and the subject’s first name; however, if the data are being usedfor research, a subject number should be noted instead of the subject’s name in orderto ensure confidentiality and compliance with research procedures for humansubjects (7). This information is generally placed at the top of each data sheet and onall forms related to the test.Age and sex: It is crucial to note the subject’s age, especially when comparing thesubject’s data with those presented in normative data tables. The subject’s age istypically recorded to the nearest year, though some instances may warrant reportingthe year to the closest tenth of a year (3, 6). For example, if a subject is 18 years and 6months old, the age should be recorded as 18.5 years. It is also necessary to documentthe subject’s sex, generally by recording an M for male or an F for female on the datasheet.Date: The date should be recorded as either month/day/year or day/month/year. Forexample, the date of March 3, 2018, could be noted as 3/3/2018 in the appropriatelocation on the laboratory data sheet. This information should be clearly noted onany data sheet used in the testing process (3, 6).Time: It is especially important to note time when performing longitudinal testingbecause some biological and performance measures exhibit diurnal or circadianvariations (10, 35, 36). As a result, longitudinal testing sessions should generally beconducted at the same time each day in order to minimize the possibility of diurnal-or circadian-induced variations in performance.Tester’s initials: The tester should initial the data sheet to create a record of whoconducted the testing session (6). This information identifies a contact person towhom one can direct questions about the session. It also enables you to match thesubject and tester if differences arise between testers in the facility.
In testing procedures in the exercise physiology laboratory, the two basic variables mostoften assessed are height and weight. These measures can serve simply as descriptors or asintegral parts of a testing program.
Height, technically referred to as stature, is routinely measured in most exercise physiologylaboratories. Stature is generally measured with a physician’s scale, a stadiometer, or a
30

metric scale attached to a wall (6). The measurement should be made to the nearest tenthof a centimeter (0.1 cm) or to the nearest quarter or half of an inch (.25-.5 in.) and thenconverted to meters. For example, if stature is determined to be 5 ft 11 in., the followingconversion would be made:
m = in. × 0.0254
Stature in m = 71 in. × 0.0254 = 1.8034 m
Rounding to the nearest hundredth of a meter, 1.8034 m would be reported as a value of1.80 m. Similarly, if the height had been calculated as 1.8288 m, the reported value wouldbe rounded to 1.83 m.
The assessment of weight is probably the most common test in the exercise physiologylaboratory because it plays a role in many calculations. Body weight, which is equivalent tobody mass under normal gravitational forces (6), is represented as a kilogram value in thescientific literature. Most Americans are familiar with pound measurements, but thisrepresentation of weight does not meet SI standards. To convert body mass from pounds tokilograms, use the following equation:
Mass (kg) = mass (lb) / 2.2046
Every 1 kg is equal to 2.2046 lb, a figure that is more commonly expressed as 2.2 lb. If aperson weighs 225 lb, body mass would be calculated as follows:
Mass (kg) = 225 lb / 2.2046 = 102.1 kg
If this equation were used with 2.2 lb in the denominator, then the individual’s body masswould be recorded as 102.3 kg. Body mass results should be rounded to the nearest tenth ofa kilogram.
Once you have recorded the background information, the next step is to measure andrecord meteorological information about the testing environment. Typically, you will assesstemperature, barometric pressure, and relative humidity (6) because they can profoundlyaffect the results of certain physiological and performance tests (14, 28, 33). It is welldocumented that high temperature can exert a significant physiological effect on test results(14, 33). In fact, it appears that HR increases 1 beat per minute (beats ∙ min−1) for everyincrease of 1 °C above 24 °C (33). In contrast, cold environments can increase therespiratory rate, which can negatively affect performance by increasing the risk ofdehydration.
Temperature is commonly represented in units of Fahrenheit, Celsius, or Kelvin (40). MostAmericans are familiar with the Fahrenheit temperature scale, in which 32 °F represents themelting point of ice (6), but this measure is not recommended by the international system
31

(SI) that sets the standard in research settings (40).
Another common method for representing temperature is the Celsius scale, in which 0 °Crepresents the freezing point of water and 100 °C represents the boiling point (6, 16). Toconvert from Fahrenheit to Celsius, use either of the following formulas:
°C = (°F − 32) / 1.8
°C = 0.56 × (°F − 32)
This measure of temperature is commonly seen in the scientific literature, but, likeFahrenheit, it is not the recommended SI unit (42). Instead, the SI thermal unit is theKelvin (K), which contains no negative or below-zero temperatures. The conversion fromCelsius to the Kelvin scale is accomplished by the following formula:
K = 273.15 + °C
This system represents the coldest possible temperature as 0 K (6).
The pressure of ambient air is represented as barometric pressure and can fluctuate withchanges in altitude (23) and weather pattern (6). As barometric pressure changes, so do thepartial pressures of the gases that make up ambient air (oxygen, carbon dioxide, andnitrogen). Regardless of the change in overall barometric pressure, the percentage of thegases contained in the ambient air remain constant. Ambient air contains 79.04% nitrogen(N2), 20.93% oxygen (O2), and 0.03% carbon dioxide (CO2). In order to determine thepartial pressures of these gases, simply multiply the total barometric pressure by the percentcontribution of the gases.
Barometric pressure is measured with an aneroid or mercury barometer in units ofmillimeters of mercury (mmHg). For example, at sea level, barometric pressure is about760 mmHg, and the partial pressure of oxygen is around 159 mmHg. At an elevation of2,000 m above sea level, the barometric pressure would fall to about 596 mmHg, whereasthe partial pressure of oxygen would decrease to 125 mmHg. This reduction in barometricpressure and concomitant decrease in the partial pressure of oxygen can result in asignificant decrease in the ability to perform aerobic exercise (18, 28). Because of theimpact of changes in barometric pressure on both pulmonary and cardiovascular function,both respiratory ventilation and metabolic volumes are often corrected for these changes(6).
In the scientific literature, barometric pressure is typically reported in the following units:mmHg, torr, hectopascal (hPa), or kilopascal (kPa). Generally, the following formulas canbe used to convert the various units:
1 torr = 1 mmHg
32
kPa = torr × 0.1333 = torr / 7.50
hPa = torr × 1.333 = torr / 0.750
Therefore, a barometric pressure of 674 mmHg or 674 torr would be converted as follows:
674 torr × 0.1333 = 89.8 kPa
674 torr × 1.333 = 898.4 hPa
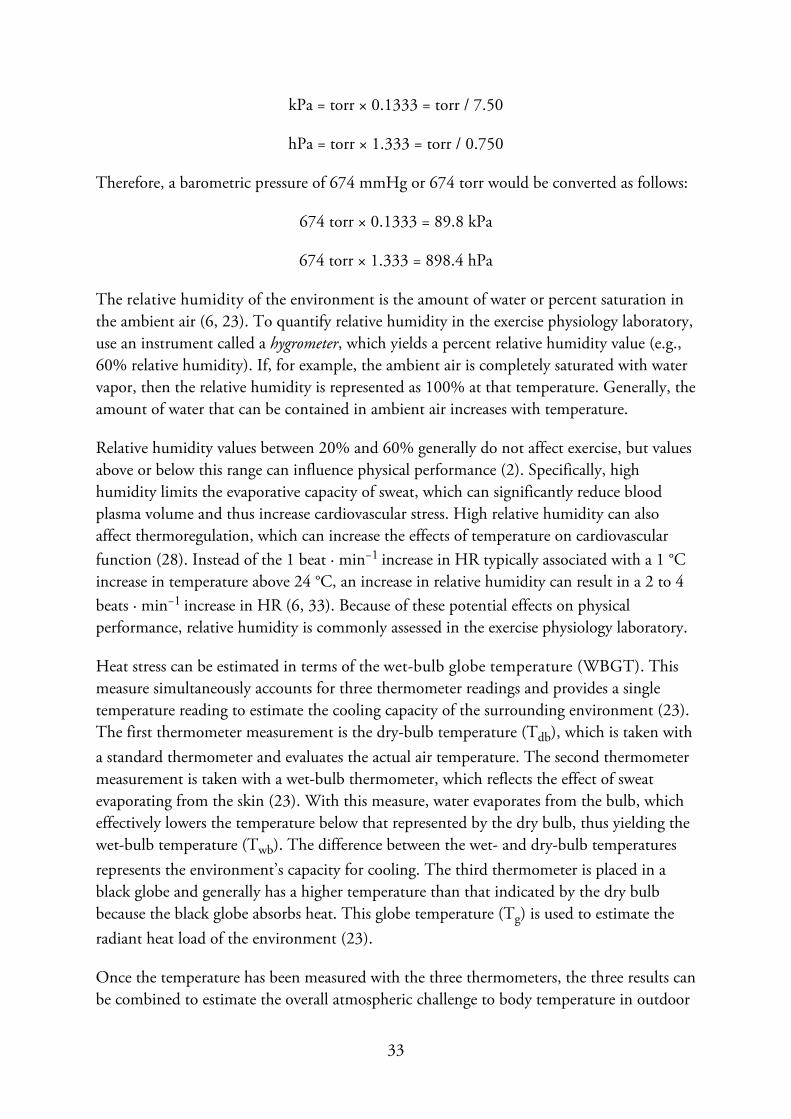
The relative humidity of the environment is the amount of water or percent saturation inthe ambient air (6, 23). To quantify relative humidity in the exercise physiology laboratory,use an instrument called a hygrometer, which yields a percent relative humidity value (e.g.,60% relative humidity). If, for example, the ambient air is completely saturated with watervapor, then the relative humidity is represented as 100% at that temperature. Generally, theamount of water that can be contained in ambient air increases with temperature.
Relative humidity values between 20% and 60% generally do not affect exercise, but valuesabove or below this range can influence physical performance (2). Specifically, highhumidity limits the evaporative capacity of sweat, which can significantly reduce bloodplasma volume and thus increase cardiovascular stress. High relative humidity can alsoaffect thermoregulation, which can increase the effects of temperature on cardiovascularfunction (28). Instead of the 1 beat ∙ min−1 increase in HR typically associated with a 1 °Cincrease in temperature above 24 °C, an increase in relative humidity can result in a 2 to 4beats ∙ min−1 increase in HR (6, 33). Because of these potential effects on physicalperformance, relative humidity is commonly assessed in the exercise physiology laboratory.
Heat stress can be estimated in terms of the wet-bulb globe temperature (WBGT). Thismeasure simultaneously accounts for three thermometer readings and provides a singletemperature reading to estimate the cooling capacity of the surrounding environment (23).The first thermometer measurement is the dry-bulb temperature (Tdb), which is taken witha standard thermometer and evaluates the actual air temperature. The second thermometermeasurement is taken with a wet-bulb thermometer, which reflects the effect of sweatevaporating from the skin (23). With this measure, water evaporates from the bulb, whicheffectively lowers the temperature below that represented by the dry bulb, thus yielding thewet-bulb temperature (Twb). The difference between the wet- and dry-bulb temperaturesrepresents the environment’s capacity for cooling. The third thermometer is placed in ablack globe and generally has a higher temperature than that indicated by the dry bulbbecause the black globe absorbs heat. This globe temperature (Tg) is used to estimate theradiant heat load of the environment (23).
Once the temperature has been measured with the three thermometers, the three results canbe combined to estimate the overall atmospheric challenge to body temperature in outdoor
33

environments using the following equation:
WBGT = 0.1Tdb + 0.7Twb + 0.2Tg
Careful examination of this equation reveals that the Twb reflects the importance of sweatevaporation in the physiology of heat exchange. If the relative humidity is high, thismeasure reflects impairment in the ability to evaporate sweat, which in turn increases theheat load encountered by the body (23). As a general rule, if the WBGT is >28 °C (>82-83°F), then modifications to exercise or practice should be considered—including cancelingpractice, moving to indoor facilities, or reducing the training intensity.
34

Descriptive Statistics
Statistics are a mathematical method for describing and analyzing numerical data (39).Exercise physiology laboratories typically involve calculating descriptive statistics such asmeasures of central tendency and variability.
Central Tendency
Measures of central tendency are commonly used to present a score that best represents allof the scores collected for a group (39). The most common statistics calculated whenrepresenting central tendency are the mean, median, and mode. The mean is calculated bysumming all the scores and dividing the result by the number of scores. The followingformula represents the calculation of the mean:
In this equation, X is the individual scores, and N equals the number of scores. Forexample, if you measured the body mass of five people as 53, 55, 65, 48, and 60 kg, themean would be calculated as follows:
Therefore, for this example, the mean weight for the five individual tests is 56.2 kg.
The median represents the middle score in a series of data. It is generally calculated usingthe following equation when the sample is placed in order:
Median = [(N + 1) / 2]th score
In this equation, N represents the total number of scores in the sample. For the precedingexample involving five body weights—now placed in order as 48, 53, 55, 60, and 65 kg—the median would be calculated as follows:
Median = (5 + 1) / 2 = 3rd score
You would then count 3 places from the first score, thus revealing the median as 55 kg. Iftrying to calculate the median with an even number of values, you need to first find the
35

middle pair of numbers. For example, if the six weights are 48, 53, 55, 58, 60, and 65 kg,the preceding equation would give (6 + 1) / 2 = 3.5. You would then move in 3.5 positionsand find the two middle values, 55 and 58. These would be added together, 55 + 58 = 113,and then divided by 2, which yields a median value of 56.5.
The mode is the most frequent score in a sample, and it is possible to have more than onemode in a group of scores. If the body masses of 10 people were measured as 48, 49, 53,53, 55, 59, 60, 60, 60, and 62 kg, the most frequently occurring value would be 60 kg,which would thus be identified as the mode of this sample population. If each score in asample appears with the same frequency, then the mode is undefined for that sample.
Variability
The variability of a data set allows the spread of the data to be depicted. In examining agroup of data in the exercise physiology laboratory, variability is commonly examined withthe use of the standard deviation and the range.
The standard deviation (SD) of a data set is easily calculated by many spreadsheetprograms, but it can also be calculated by hand with the following equation:
In this equation, the mean (M) is subtracted from each score (X) in the group. The resultfor each score is then squared, and these figures are summed to provide a total, which isthen divided by the number (N) of scores in the group minus 1. The square root of this isthe standard deviation. An example of how one might calculate the standard deviation ispresented in the accompanying highlight box; the example involves body massmeasurements of five subjects.
Sample Calculation of Standard Deviation
36

Note: SD = standard deviation; X = sample score; M = mean; N = number ofsamples.
Thus the mean body mass was 56.2 kg, and the standard deviation was 6.53 kg. Ina results section of a manuscript or laboratory report, we would then representthese data as 56.2 ± 6.5 kg.
If the standard deviation and the mean of a group are calculated, a z-score can bedetermined in order to express the distance of any individual score in standard units fromthe mean (30):
For example, if a group of weightlifters were tested in the isometric midthigh pull, and thegroup average peak force was 3013.9 N and the group standard deviation was 360.7 N,then the z-score for an athlete who had a peak force of 2679.7 would be calculated asfollows:
This athlete’s performance on the test would then be −0.93 standard deviations below (i.e.,weaker) than the group tested.
The second measure of variability often used in the exercise physiology laboratory is range—the distance between the end points in a group of scores (7). The range is easily
37

calculated with the following formula:
Range = (high score − low score) + 1
Thus, for our previous example of body mass scores, the range would be calculated asfollows:
Range = (65 − 48) + 1 = 17 + 1 = 18
The high score can also be considered as the maximum, and the low score would beconsidered as the minimum. These variables are also sometimes reported in the resultsgenerated by performance testing in the exercise physiology laboratory.
Reliability and Validity
Whether you are conducting basic testing or using test results for research purposes, it isessential to determine the reliability and validity of the testing process. If the tests chosendo not meet both of these criteria, you may produce false information about the subject’sphysiological or physical performance capacity. Therefore, before using any testingprocedure—whether in the field or laboratory—you must determine its reliability andvalidity. Typically, you can do so by using established testing protocols that have beenpreviously validated and determined to be reliable.
Reliability refers to the repeatability or consistency of a measure (7, 19, 39). The reliabilityof a measure is often affected by experimental or biological errors (6). Experimental errorsmay include technical errors such as miscalibration of instruments or changes to the testingenvironment. Biological errors may include natural shifts in performance that occur inresponse to the time of day when testing is undertaken (35, 36) or in response toaccumulated fatigue. The subject’s familiarity with the testing process can also affectreliability (6). Therefore, when introducing new testing procedures, it is important thatathletes and clients are adequately familiarized with the tests. This can be done via severalpractice trials before the start of the actual testing session.
Statistically, the primary methods for evaluating reliability are the change in the meanbetween measurements, the standard error of the measurement, and the intraclasscorrelation coefficient (ICC) (34). Highly reliable field, field/laboratory, and laboratorytests generate high ICCs and low coefficients of variation (CVs) when repeated trial dataare compared (6, 19). Acceptable ICCs range between 0 and 1 or between 0 and −1. Perfectcorrelations are either 1 or −1 (4); they rarely occur with the variables analyzed in theexercise physiology laboratory. Generally, correlations greater than 0.90 demonstrate highreliability, whereas correlations less than 0.70 exhibit poor reliability (6). The mostcommon reliability measure is the typical error (TE) of the measurement. The typical erroris calculated by dividing the standard deviation of the change scores between repeated
38

measures divided by the square root of 2 (34).
Sample Reliability and Error Calculations
39

Generally, the smaller the TE, the more reliable the measure. With performance-basedmeasures, the general marker of reliability is an ICC >0.80 and a CV (%) <10.0 (15).
Even if a measure or test is reliable, it may not be valid; in other words, rather thanproviding a suitable assessment of what you are trying to measure, your measures might bedependable but consistently wrong. Therefore, you must determine that a test is bothreliable and valid before using it in a clinical or sport testing program.
Validity is the degree to which a test or instrument measures what it is supposed tomeasure (39). In the exercise physiology laboratory, the main form of validity is criterionvalidity—the ability of a test to be related to a recognized standard or criterion measure(39). For example, when examining body composition, UWW is considered the goldstandard or criterion measure. When considering another method of assessing bodycomposition—say, skinfold measurements—validity is determined by correlating the resultsobtained from the skinfold estimate to the body fat as determined by underwater weighing.Typically, this correlation is performed with the use of a Pearson product-momentcorrelation coefficient, and a high correlation (r) between the criterion variable and the testrepresents high validity.
A measurement is considered valid if it is both accurate and precise. The closer ameasurement is to an accepted value, the higher the accuracy of the measurement. For
40

example, if multiple arrows are shot at a target, the closeness of the arrows to the bull’s-eyeindicates the accuracy of the measure. If the arrows are clustered close to one another, thenthere would be a high degree of precision. Thus, precision is considered to be thereproducibility of the measurement. Ultimately, a measure can be highly accurate but notprecise, highly precise but not accurate, highly accurate and highly precise, or neither highlyprecise nor highly accurate (see figure 1.1).
41
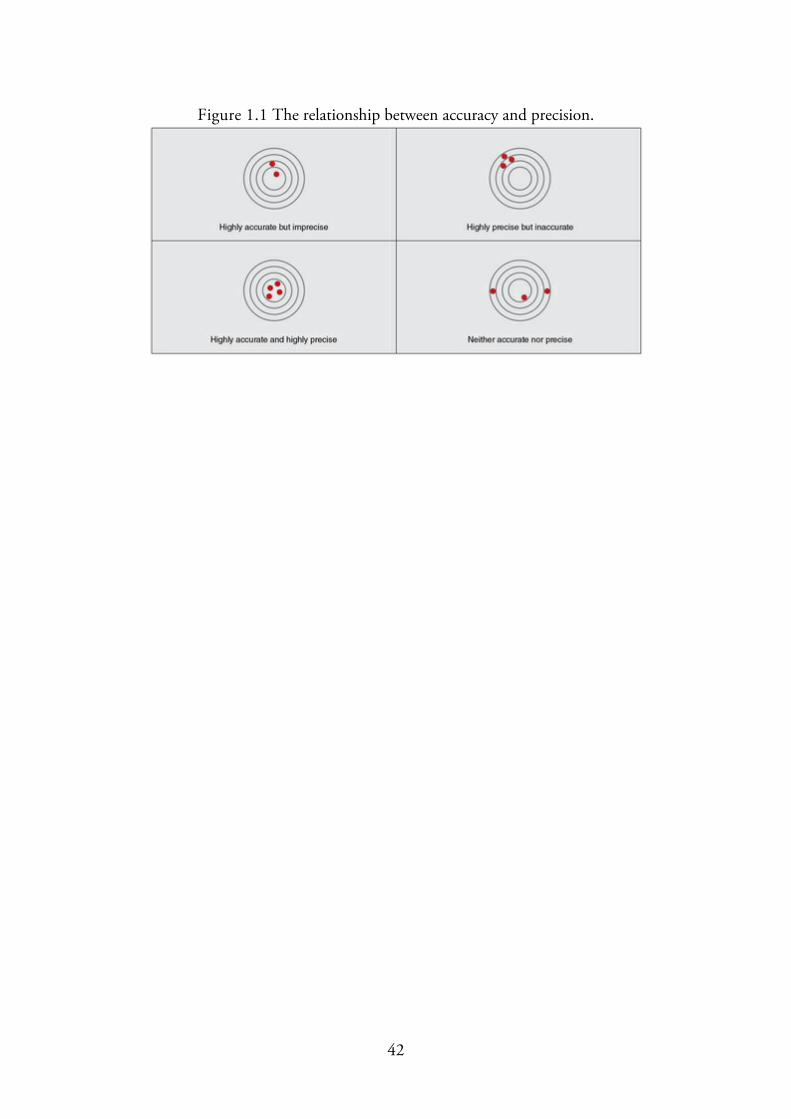
Figure 1.1 The relationship between accuracy and precision.
42

Presentation of Results
Data collected on a group of subjects can be presented in many ways in a publication orlaboratory report. One of the first steps in determining how to present data is to decidewhether it should be placed in a table, a figure, or the text of the document. Considerwhether you can best represent the information in the form of the actual numbers collectedor as a picture of the results. Once you make this decision, you can create a table or figureto best represent the data.
Though it is relatively easy to create a table with modern software, it remains important toconsider some basic rules. First, tables provide a means for communicating informationabout data—not storing them (39). For example, a good use of tables is creating normativedata tables for evaluating testing. You can use these tables for communicating informationabout typical results for any given field or laboratory test. When creating a table, followthese rules suggested by Thomas, Nelsen, and Silverman (39):
Table headings should be clearly labeled and easy to follow. To improve readabilityof headings, avoid excessive abbreviation and make formatting easy to follow.Like characteristics should be presented vertically. The columns and rows containedin the table should make sense. For example, columns could contain variables, means,and standard deviations, and each row could represent a specific variable.Readers should not have to refer to the text to understand the content of a table. As arule, a table should stand alone and not require the reader to search for abbreviationsor text to explain what the table is presenting.
Table 1.2 shows an example that meets these rules and presents basic data collected in anexercise physiology laboratory. This tabular format can be modified to fit many data sets.
43

Another way to present data is by using a figure. Deciding whether to place data in table orfigure form depends largely on whether a picture of the results (i.e., a figure) will workbetter than the actual numbers (presented in a table). If the data are better represented as afigure, consider the following rules (39):
Make sure the figure is clearly labeled and easy to read.Present important information so that it is easily evaluated.Create a figure that is free from visual distractions.
Determine what type of figure will best represent the data. Types include bar and columncharts, line graphs, scatter plots, flow charts, and pie charts.
Bar and column charts: These figures are useful when comparing single responses—often a mean or a single most important time point—between treatment groups.Though not the best method for determining trends over time, column charts can beused for comparing amounts over time so that trends can be seen or for comparingvariables between groups. You can often use shading or coloring to distinguishbetween columns and thus help your audience easily interpret the data. You can alsodepict standard deviations and standard errors of the mean in order to make the chartmore descriptive.
44

Line graphs: This type of graphical representation is often used to present longitudinaldata and show how things change over time. When creating charts of this type, timeis often placed on the x-axis and the variable being measured or quantified on the y-axis. When multiple lines are placed on these charts, it is prudent to use shading,differing symbols, and broken or colored lines to allow the reader to easily distinguishbetween variables.
Scatter plots: In this type of chart, each point on the plot represents a data point onthe x-axis and the y-axis. As a result, it is easy to see the patterns of individual scores.Because scatter plots illustrate individual data points, researchers can use them to gaina sense of the spatial distribution of the results and to determine linearity, outliers, orclumps of data. Researchers often facilitate interpretation of the data by usingmultiple colors or symbol shapes to distinguish between groups.
45