Cheaper, faster, cleaner - kirkensnodhjelp.no
74
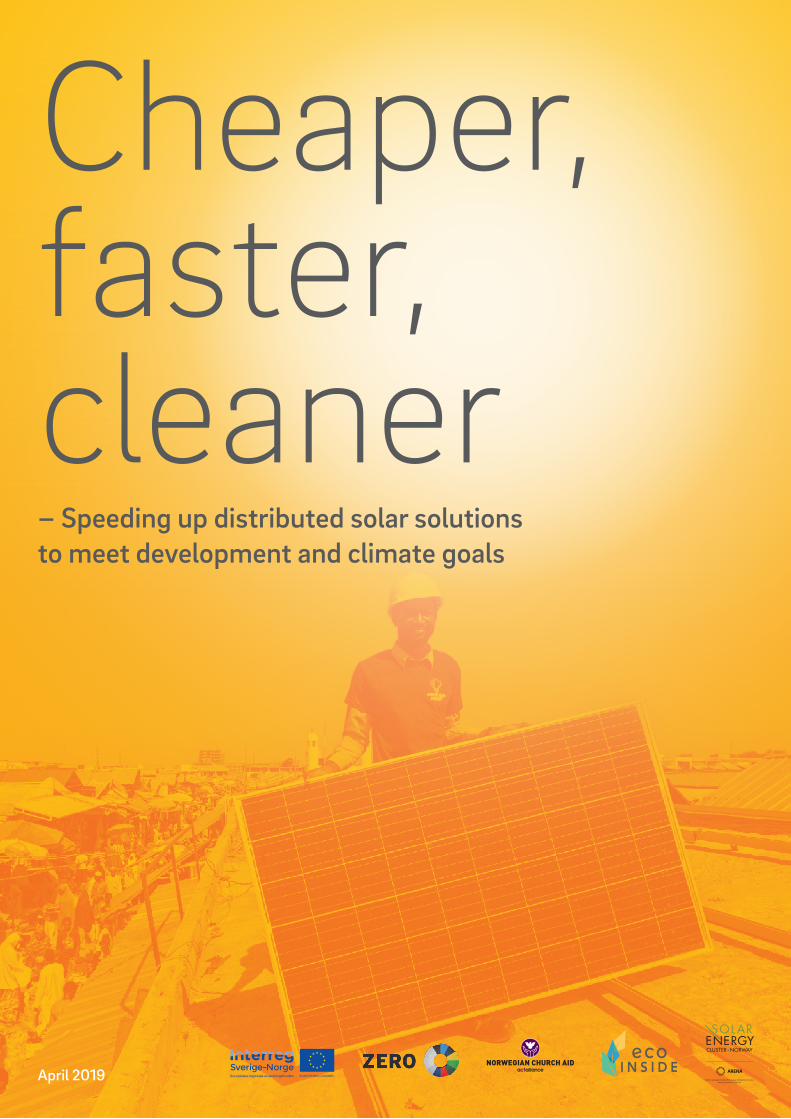
Cheaper, faster, cleaner – Speeding up distributed solar solutions to meet development and climate goals April 2019
Transcript of Cheaper, faster, cleaner - kirkensnodhjelp.no
1
Cheaper, faster, cleaner – Speeding up distributed solar solutions to meet development and climate goals
April 2019
2
Report by (www.differgroup.com) Design by (www.winkel.no)Photos by Alex Kohler
3
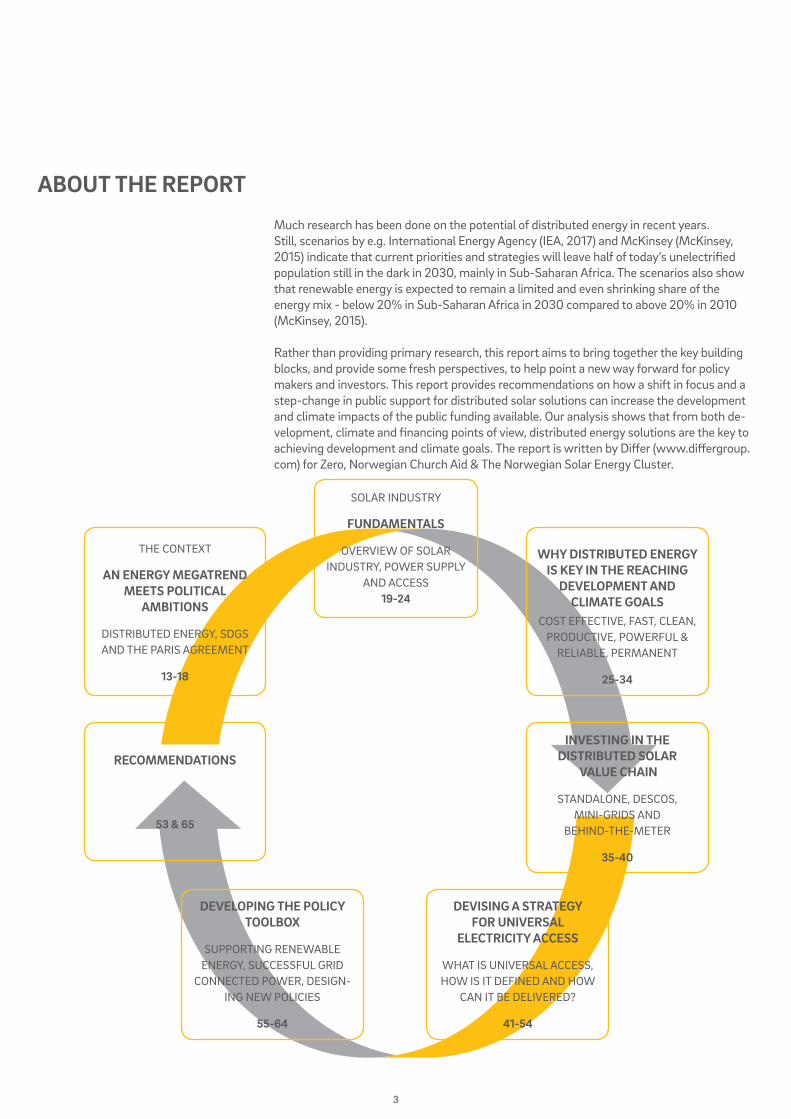
Much research has been done on the potential of distributed energy in recent years. Still, scenarios by e.g. International Energy Agency (IEA, 2017) and McKinsey (McKinsey, 2015) indicate that current priorities and strategies will leave half of today’s unelectrified population still in the dark in 2030, mainly in Sub-Saharan Africa. The scenarios also show that renewable energy is expected to remain a limited and even shrinking share of the energy mix - below 20% in Sub-Saharan Africa in 2030 compared to above 20% in 2010 (McKinsey, 2015).
Rather than providing primary research, this report aims to bring together the key building blocks, and provide some fresh perspectives, to help point a new way forward for policy makers and investors. This report provides recommendations on how a shift in focus and a step-change in public support for distributed solar solutions can increase the development and climate impacts of the public funding available. Our analysis shows that from both de-velopment, climate and financing points of view, distributed energy solutions are the key to achieving development and climate goals. The report is written by Differ (www.differgroup.com) for Zero, Norwegian Church Aid & The Norwegian Solar Energy Cluster.
ABOUT THE REPORT
SOLAR INDUSTRY
FUNDAMENTALS
OVERVIEW OF SOLARINDUSTRY, POWER SUPPLY
AND ACCESS19-24
WHY DISTRIBUTED ENERGY IS KEY IN THE REACHING
DEVELOPMENT AND CLIMATE GOALS
COST EFFECTIVE, FAST, CLEAN, PRODUCTIVE, POWERFUL &
RELIABLE, PERMANENT
25-34
INVESTING IN THE DISTRIBUTED SOLAR
VALUE CHAIN
STANDALONE, DESCOS, MINI-GRIDS AND
BEHIND-THE-METER
35-40
RECOMMENDATIONS
53 & 65
THE CONTEXT
AN ENERGY MEGATREND MEETS POLITICAL
AMBITIONS
DISTRIBUTED ENERGY, SDGS AND THE PARIS AGREEMENT
13-18
DEVISING A STRATEGY FOR UNIVERSAL
ELECTRICITY ACCESS
WHAT IS UNIVERSAL ACCESS, HOW IS IT DEFINED AND HOW
CAN IT BE DELIVERED?
41-54
DEVELOPING THE POLICY TOOLBOX
SUPPORTING RENEWABLE ENERGY, SUCCESSFUL GRID
CONNECTED POWER, DESIGN-ING NEW POLICIES
55-64
3
4
5v
6
EXECUTIVE SUMMARY:
DISTRIBUTED ENERGY SOLUTIONS• Distributed energy is a global megatrend and distributed energy is part of the end game – both in developed and developing countries• Distributed and off-grid renewable energy solutions are fast, clean and cost effective compared with conventional electrification by grid development• Scaling distributed and off-grid energy solutions is key to effectively achieving both development (SDG7) and climate (Paris) goals• Grid extension projects should be limited until power tariffs are cost reflective
NORWAY AND DISTRIBUTED SOLAR SOLUTIONS• Distributed energy will be BIG and Norway should be prepared to take an active role• Norway has strong expertise within solar which has the largest potential in distributed energy • Norway has a strong cluster of distributed energy companies compared to the other Nordic countries• Norway allocates a high share of its ODA budgets to clean energy and has potential to be a global leader in promoting distributed solar solutions in developing countries.
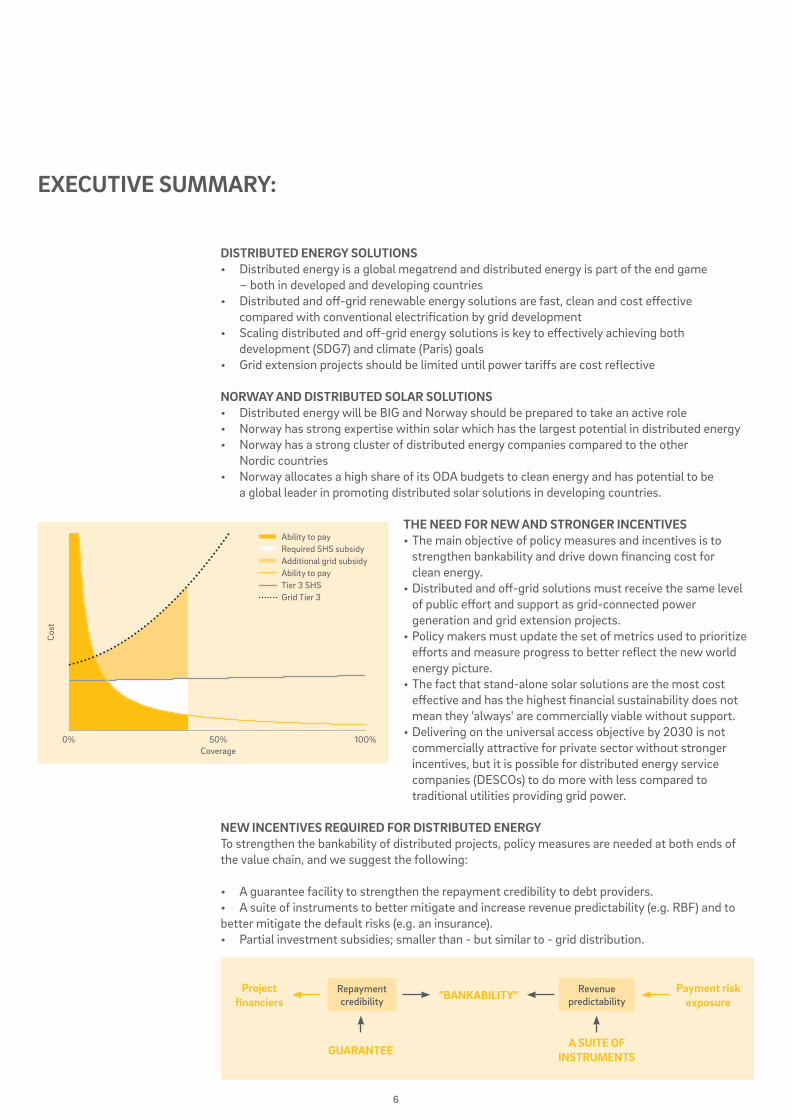
THE NEED FOR NEW AND STRONGER INCENTIVES• The main objective of policy measures and incentives is to strengthen bankability and drive down financing cost for clean energy.• Distributed and off-grid solutions must receive the same level of public effort and support as grid-connected power generation and grid extension projects. • Policy makers must update the set of metrics used to prioritize efforts and measure progress to better reflect the new world energy picture.• The fact that stand-alone solar solutions are the most cost effective and has the highest financial sustainability does not mean they 'always' are commercially viable without support.• Delivering on the universal access objective by 2030 is not commercially attractive for private sector without stronger incentives, but it is possible for distributed energy service companies (DESCOs) to do more with less compared to traditional utilities providing grid power.
NEW INCENTIVES REQUIRED FOR DISTRIBUTED ENERGYTo strengthen the bankability of distributed projects, policy measures are needed at both ends of the value chain, and we suggest the following:
• A guarantee facility to strengthen the repayment credibility to debt providers.• A suite of instruments to better mitigate and increase revenue predictability (e.g. RBF) and to better mitigate the default risks (e.g. an insurance).• Partial investment subsidies; smaller than - but similar to - grid distribution.
GUARANTEE
“BANKABILITY”
A SUITE OFINSTRUMENTS
Payment riskexposure
Project financiers
Revenuepredictability
Repaymentcredibility
6
Cost
0% 50%Coverage
100%
Ability to payRequired SHS subsidyAdditional grid subsidyAbility to payTier 3 SHSGrid Tier 3
7
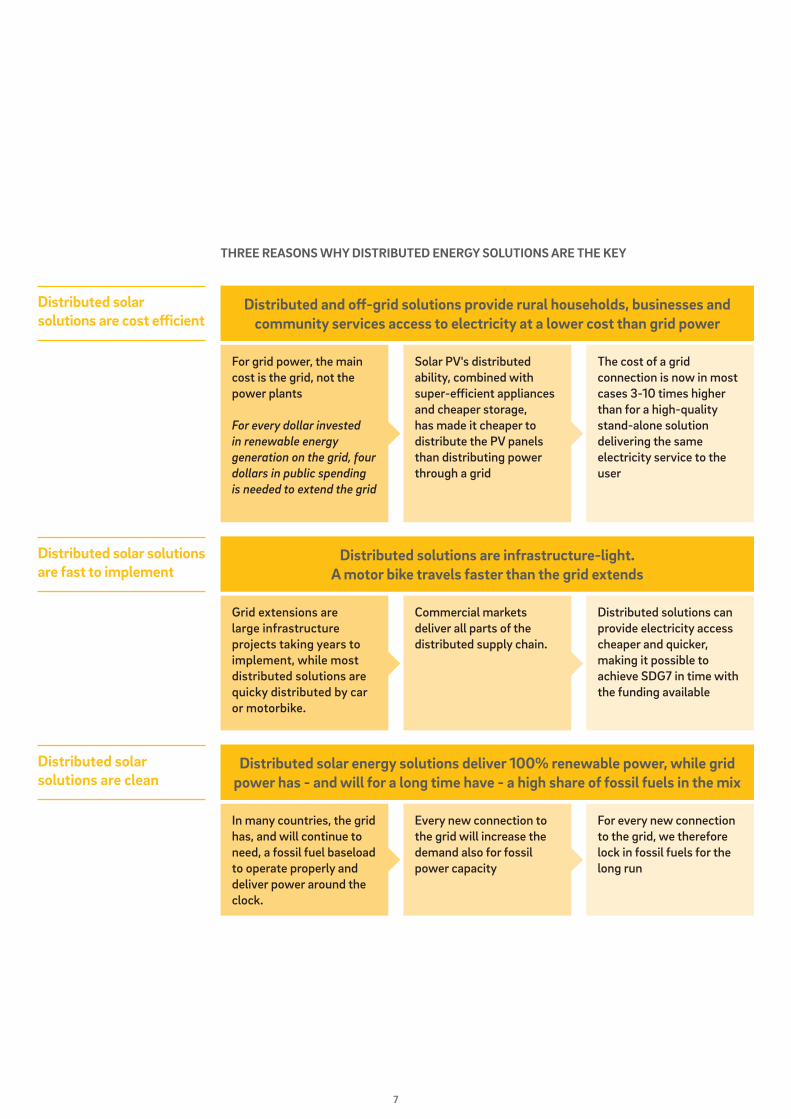
THREE REASONS WHY DISTRIBUTED ENERGY SOLUTIONS ARE THE KEY
Distributed and off-grid solutions provide rural households, businesses and community services access to electricity at a lower cost than grid power
Distributed solutions are infrastructure-light. A motor bike travels faster than the grid extends
Distributed solar energy solutions deliver 100% renewable power, while grid power has - and will for a long time have - a high share of fossil fuels in the mix
For grid power, the main cost is the grid, not the power plants
For every dollar invested in renewable energy generation on the grid, four dollars in public spending is needed to extend the grid
Grid extensions are large infrastructure projects taking years to implement, while most distributed solutions are quicky distributed by car or motorbike.
In many countries, the grid has, and will continue to need, a fossil fuel baseload to operate properly and deliver power around the clock.
Solar PV's distributed ability, combined with super-efficient appliances and cheaper storage, has made it cheaper to distribute the PV panels than distributing power through a grid
Commercial markets deliver all parts of the distributed supply chain.
Every new connection to the grid will increase the demand also for fossil power capacity
The cost of a grid connection is now in most cases 3-10 times higher than for a high-quality stand-alone solution delivering the same electricity service to the user
Distributed solutions can provide electricity access cheaper and quicker, making it possible to achieve SDG7 in time with the funding available
For every new connection to the grid, we therefore lock in fossil fuels for the long run
Distributed solar solutions are cost efficient
Distributed solar solutions are fast to implement
Distributed solar solutions are clean
7
8
PREFACE BY ZERO
PREFACE BY NORWEGIAN CHURCH AID
The world is in a desperate hurry to stop climate change. The poorest countries will suffer the worst consequences, and the next few years will determine whether all the progress made in the fight against poverty will be reversed by the effects of extreme weather, floods and droughts.
At the same time, close to a billion people still lack basic electricity. Access to energy is a precondition to grow out of poverty, but if developing countries follow in the fossil footsteps of countries before them, it will be impossible to stop climate change. Providing a better alternative based on renewable sources should thus be a top priority of our climate and development policies.
Luckily, the fast development and sinking costs of solar energy, batteries, energy efficient appliances and mobile technology open new opportunities for access to energy in a way that is both cheap and fast, and most importantly, clean. Building more large scale renewable power production is still necessary to outcompete fossil alternatives, but distributed solutions will have to play a key role in helping large parts of the world’s population leapfrog to a 100% renewable future in time.
We hope that this report will help governments, businesses and investors to understand the opportunities offered by distributed energy and how we can contribute to speeding up the use of them in our common efforts to solve the greatest challenge of our times.
About ZERO:
The Zero Emission Resource Organization (ZERO) is the leading Norwegian environmental organization dedicated to reducing climate change by promoting zero emission energy solutions, bridging the gap between business and politics.
About Norwegian Church Aid:
Norwegian Church Aid is one of Norway’s biggest aid organization, which provide emergency assistance in disasters, work for long-term development in local communities and address the root causes of poverty. We advocate for just decisions by public authorities, business and religious leaders.
Addressing the issue of increased access to renewable energy is of great importance to not only the fight against climate change, but also the fight against poverty in most developing countries. Much of the world’s poor population live in rural areas without easy access to reliable electricity. Hence, rural electrification is a way for the majority of the population to move towards attaining energy security and enhancing social welfare. The extreme poverty found in rural areas is related to the lack of income opportunities. Productive use of electricity will help reduce this poverty by providing alternative sources of livelihood.
Many rural communities depend on traditional fuels (fuel wood, charcoal, etc.) for their necessary cooking and water heating and on kerosene for lighting. The reliance on fuel wood is having an adverse impact on forests and watersheds, and their access to these energy sources is increasingly limited. At the same time, the burning of these fuels has severe consequences on the health of women and children in particular, through extensive indoor air pollution.
The sources of tomorrow’s greenhouse gas emission are created today. Developing countries are entitled to increase their energy production and consumption considerably. However, with the backdrop of climate change, we must create a viable infrastructure for the use and maintenance of renewable energy sources such as solar energy, also in areas that has been regarded difficult to electrify. This is of great importance, both to the developing countries themselves and to the world as such.
8
9
PREFACE BY NORWEGIAN SOLAR ENERGY CLUSTER
Norway has a long history of electrification in developing countries, within the construction of hydropower and grid extension projects. But the energy landscape is changing, and a mix of different electrification solutions are emerging. Grid extension is no longer always the preferred or most cost optimal alternative. Norway also has a proud and more recent history within the solar industry, being able to deliver silicon with the lowest CO2 footprint in the world. Combined with world class expertise within ICT and digitalization, and a long experience working in Africa, Norwegian companies have a unique opportunity to take a market share in the exciting and growing off-grid market.
The Norwegian off-grid community includes expertise within development of battery and PV technology, developers and distributors of off-grid solar products (lanterns, solar home systems, and mini-grids), software solution providers, consultancy companies, and investor companies focusing on off-grid and impact investments. Our experience is that Norwegian competence within renewable energy is sought-after in our partner countries.
But the off-grid companies need to see public money and support schemes more easily available, and at par with what is provided to traditional large-scale energy projects, and that of more traditional grid solutions, particularly during the scale-up phase. Off-grid businesses are furthermore directly exposed to end-users’ ability to pay, making their revenue model considerably more vulnerable. Employing measures to reduce this risk, would attract more private capital and speed up electrification efforts.
About the Norwegian Solar Energy Cluster:
The Norwegian Solar Energy Cluster is a national cluster for the solar energy sector in Norway, consisting of more than 85 industrial partners, 9 major R&D institutions and public partners within the Norwegian solar energy sector. Our aim is to strengthen the Norwegian partners’ innovation capacity and competitiveness, and to supply both markets at home and abroad with clean, renewable and sustainable solar energy.
9
10
KEYWORDS AND ABBREVATIONS
Keyword Explanation
AI Artificial intelligence
Base load The permanent minimum load that a power supply system is required to deliver
Peak load The maximum of electrical power demand over a defined period of time
Behind-the-meter [solutions] Electricity produced (and consumed) onsite, for example, rooftop PV systems.
CAPEX Capital expenditures. Investment costs
Captive energy Electricity produced and (mainly) consumed at same location. Could be grid connected. See also behind-the-meter
DESCO Distributed energy service company. PAYGO is a DESCO.
Distributed energy Electricity consumed close to where it is produced, usually in many different and small sites.
EPC Engineering – Procurement – Construction. Often in relation to building a power plant
ESMAP multi-tier framework Energy Sector Management Assistance Program's classification of energy access levels. From Tier 0 (no access) to Tier 5 (virtually uninterrupted high power)
FiT Feed-in tariff. Payment per kWh for delivered electricity
FMCG Fast-moving consumer goods
Generation Electricity generation refers to the production of electricity.
Genset Fossil-fueled generator set that produces electricity.
GET FiT Support programme for installation of new power generation using feed-in tariffs.
GHG Greenhouse gas. Gases that have an impact on global warming
CO2 Carbon dioxide. The primary greenhouse gas
GOGLA Global Off-Grid Lighting Association. Umbrella organisation for companies and organisations oper-ating in the off-grid sector.
Grid Electricity grid. Short for centrally produced power delivered though power lines (transmission and distribution networks).
HH Household
I&C Industrial and commercial
IEA International Energy Agency
IoT Internet of things
IPP Independent Power Producer. Power generation company that delivers electricity to utility/grid. Examples are solar powered, coal-fired and nuclear plants
IT Information technology
kW – MW - GW Power output measured in (kilo/Mega/GigaWatt). Denotes magnitude of power generation.
kWh – MWh – GWh (kilo/Mega/Giga)Watt hour. Energy unit referring to one hour at a given power (see kW). Denotes energy produced/delivered.
LCC Lifecycle cost
LCOE Levelised Cost of Electricity. Measure used for consistently comparing cost of different sources of electricity generation to feed a grid.
Lithium Lithium is a chemical element, and the central element in modern lightweight rechargeable batter-ies used in electric vehicles and solar home systems.
MFI Microfinance Institution. Institution providing financial services targeted at individuals and small businesses that lack access to conventional banking and related services.
10
11
Mini-grid Small electricity network powering a limited number of units/households, using one or more elec-tricity sources. Usually not connected to the main grid.
Mobile money Provision of payment services using "accounts" on mobile phones.
NGO Non-governmental organization
O&M Operation and maintenance. Used to denote cost of operating a unit [power plant/grid/stand alone]
Off-grid Electricity that is produced and consumed outside the grid
OPEX Operating expenditures, as opposed to capital expenditures (CAPEX)
Overnight cost The cost of a construction project if no interest was incurred during construction, as if the project was completed "overnight." The overnight cost is frequently used when describing power plants.
PAYGOPay-as-you-go solar company, selling solar home systems via a combination of a limited upfront payment and regular ‘top-ups’ that the customer transfers via mobile money. Business model based on giving credit to customers.
Pico In this context pico solar denotes the smallest, often portable solar photovoltaic system. Pico is an SI unit corresponding to 10−12.
Power evacuation infrastructure Power evacuation is a critical function that allows generated power to be immediately evacuated to the grid for distribution
PPA Power purchase agreement. Agreement that regulates sales of power between IPP and utility.
PPP Public-private partnerships
PV Photovoltaic
RBF
Results-based financing or payment upon delivery of pre-agreed results. A funder disburses funds to all eligible providers of a defined good/service provided that it is independently verified that the provider in question has achieved certain pre-determined results. The fund recipient has flexibility as to how to achieve these results.
REEEP Renewable Energy and Energy Efficiency Partnership. International organisation that advances markets for renewable energy and energy efficiency with an emphasis on emerging markets and developing countries.
Roof-top solar Solar panels installed on a roof.
SDG Sustainable development goals. A collection of 17 global goals set by the United Nations General Assembly in 2015 for the year 2030 concerning social, economic and environmental development issues.
SHSSolar home system. A kit producing electricity from solar energy. A normal kit comprises a solar panel, battery, controller, lights and output for light loads such as mobile charging and radios. Larger SHS kits can power TVs and fans.
SME Small and medium enterprises
SSA Sub-Saharan Africa
Stand-alone A system not integrated with a grid or other systems, for example a SHS, a solar rooftop system or a diesel fired generator/power plant not connected to the grid.
T&D Transmission and distribution. Transmission transfers high-voltage power from power plant to local trans-formers. Distribution transfers medium- and low-voltage power from transformers to end users.
TSO Transmission system operator
UN United Nations
UPS Uninterruptible power supply. Power backup that kicks in when normal power fails.
Weak-grid An electricity grid where carrying loads affect power quality
Wp Watt-peak. Denotes the (max) output power achieved by a solar module under full solar radiation.
11
12
13
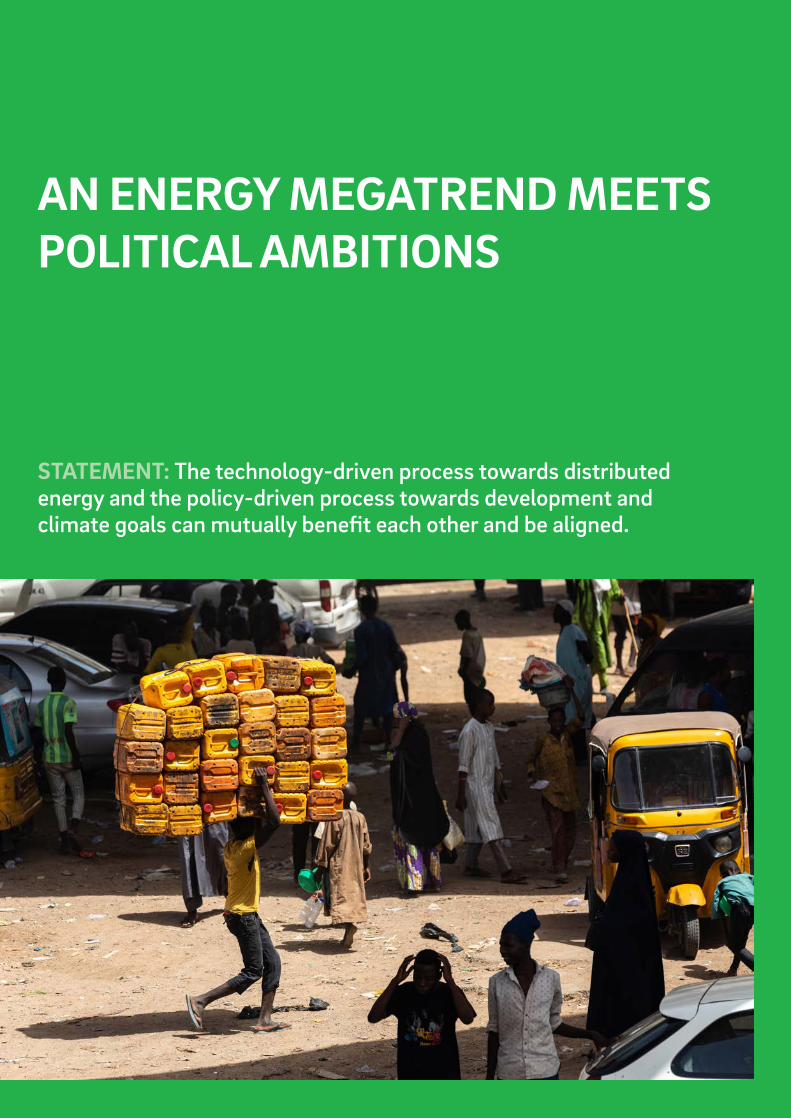
AN ENERGY MEGATREND MEETS POLITICAL AMBITIONS
STATEMENT: The technology-driven process towards distributed energy and the policy-driven process towards development and climate goals can mutually benefit each other and be aligned.
14
The distributed energy megatrendA global megatrend towards distributed energy is here – now. Over the last decade, the world’s energy picture has changed dramatically. Driven by technological innovations and price drops
within solar PV panels, battery storage and other storage technologies, in mobile technology and in IT/IoT/AI/cloud-based device management, distributed energy solutions have become competitive and attractive. The future includes distributed, wireless and clean energy solutions.
The future energy mix includes both large power plants and smaller, distributed solutions. The megatrend has fundamental implications for the way of providing electricity services to end-users and challenges the traditional utility model. In Europe, the US, Australia and other developed countries customers are installing on-site solar solutions (behind the meter) and have two-way integration with their utility. Combining centralized and decentralized power generation increases the robustness and stability of the grid system.
California leads the way in the US. There are currently over 900,000 stand-alone solar installa-tions in California alone, of which around 65% are residential (https://californiadgstats.ca.gov).Residential solar energy surplus can be sold back to the grid for a set tariff. A higher tariff for solar + storage was established in 2017/18 to allow customers to feed up to 1MW battery-backed power into the grid. This opens for substantial distributed generation and storage capacities which in turn reduces utility infrastructure upgrade cost.
Development brought forward by public money and support. Distributed, renewable electricity solutions, specifically in Germany, was initially stimulated heavily by public money and support so that customers started making preferred decisions on e.g. roof-top solar and electric cars. For instance, in Norway, with less annual sun-hours and low electricity prices, the company Otovo is successfully facilitating distributed roof-top behind the meter solar solutions to households.
The combination of these technological advancements has changed the world energy picture. Most of the world’s electricity infrastructure was developed at a time when the amount of electricity to deliver an electricity service to a household was much larger, and distributed genera-tion and storage was extremely expensive compared to large-scale generation and grid distribution. While costs of distributed solutions have fallen by 70-90% (see next page), grid transmission and distribution have not seen the same cost reduction – being more linked to the price of metals like aluminium, steel and copper. In many parts of the world, local generation and storage of electricity has become the cost optimal solution for most of the unelectrified households, as well as for a substantial share of productive and community purposes.
The distributed energy megatrend is also emerging in developing countries. According to Bloomberg New Energy Finance (2018), well situated and equipped wind farms and solar parks are already as cheap as, or cheaper than, fossil fuel alternatives almost everywhere. Clean, distributed solutions are replacing grid as the primary energy source also in grid-connected areas (although diesel generators and/or grid prevail as evening generation and for backup). In weak-grid areas, autonomous power generation increases stability and predictability of the power supply. Moreover, stand-alone (off-grid) systems are sold in increasing numbers to households beyond the grid.
The future includes distributed, wireless and clean energy solutions
15
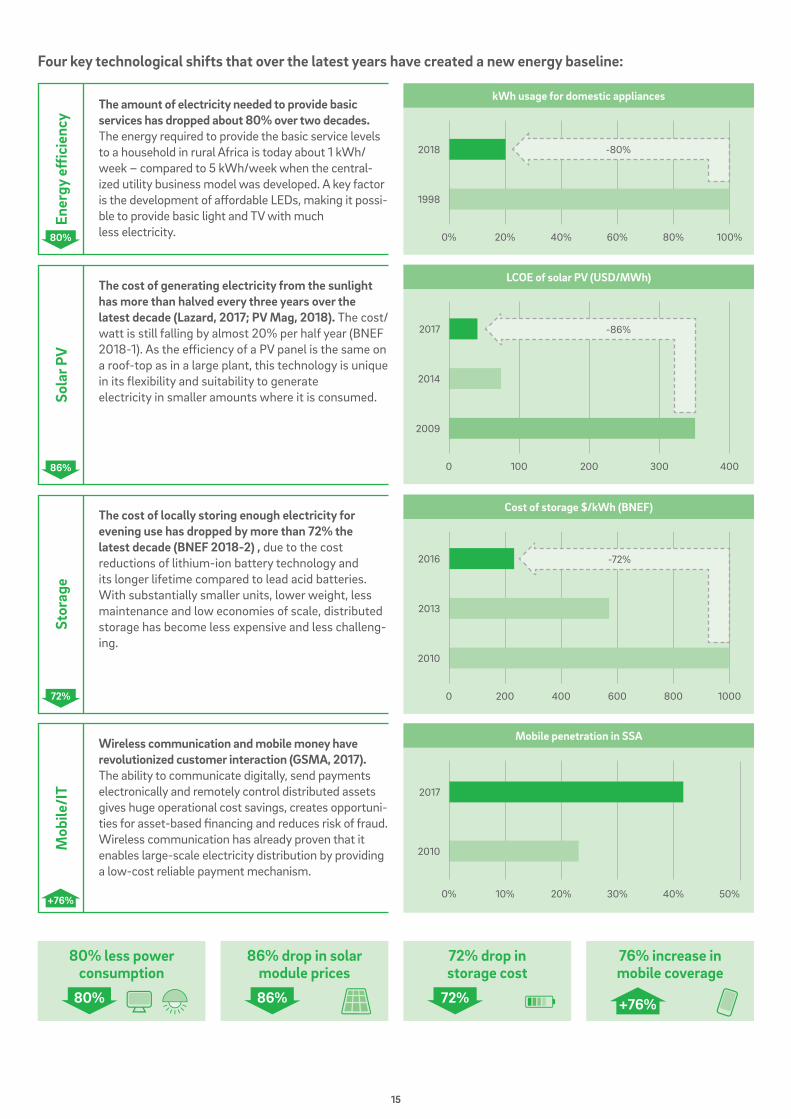
Four key technological shifts that over the latest years have created a new energy baseline:
The amount of electricity needed to provide basic services has dropped about 80% over two decades. The energy required to provide the basic service levels to a household in rural Africa is today about 1 kWh/week – compared to 5 kWh/week when the central-ized utility business model was developed. A key factor is the development of affordable LEDs, making it possi-ble to provide basic light and TV with much less electricity.
The cost of generating electricity from the sunlight has more than halved every three years over the latest decade (Lazard, 2017; PV Mag, 2018). The cost/watt is still falling by almost 20% per half year (BNEF 2018-1). As the efficiency of a PV panel is the same on a roof-top as in a large plant, this technology is unique in its flexibility and suitability to generate electricity in smaller amounts where it is consumed.
The cost of locally storing enough electricity for evening use has dropped by more than 72% the latest decade (BNEF 2018-2) , due to the cost reductions of lithium-ion battery technology and its longer lifetime compared to lead acid batteries. With substantially smaller units, lower weight, less maintenance and low economies of scale, distributed storage has become less expensive and less challeng-ing.
Wireless communication and mobile money have revolutionized customer interaction (GSMA, 2017). The ability to communicate digitally, send payments electronically and remotely control distributed assets gives huge operational cost savings, creates opportuni-ties for asset-based financing and reduces risk of fraud. Wireless communication has already proven that it enables large-scale electricity distribution by providing a low-cost reliable payment mechanism.
Stor
age
Ener
gy e
ffic
ienc
ySo
lar P
VM
obile
/IT
80% less power consumption
86% drop in solar module prices
72% drop in storage cost
76% increase in mobile coverage
2010
2013
2016
0 200 400 600 1000800
-72%
Cost of storage $/kWh (BNEF)
2009
2014
2017
0 100 200 300 400
-86%
LCOE of solar PV (USD/MWh)
2010
2017
0% 10% 20% 30% 40% 50%
Mobile penetration in SSA
1998
2018
0% 20% 40% 60% 80% 100%
-80%
kWh usage for domestic appliances
80%
80%
86%
86%
72%
72%
+76%
+76%
16
The Sustainable Development Goals and the Paris Agreement
The global community made two major policy decisions in 2015 that set a strong guidance for public priorities, representing major changes to business as usual.
THE AGENDA FOR SUSTAINABLE DEVELOPMENT In September 2015, the 2030 Agenda for Sustainable Development was approved by all United Nations member states, including 17 Sustainable Development Goals (SDGs) that shall act as guiding political ambitions. The SDG7 is to “ensure access to
affordable, reliable, sustainable and modern energy for all” and is specified as follows:
• 7.1: By 2030, ensure universal access to affordable, reliable and modern energy services • 7.2: By 2030, increase substantially the share of renewable energy in the global energy mix • 7.3: By 2030, double the global rate of improvement in energy efficiency.
The SDGs are interconnected, and access to electricity is at the core of almost all SDGs. For instance, poverty reduction (SDG1), good health and well-being (SDG3), quality education (SDG4), clean water and sanitation (SDG6), decent work and economic growth (SDG 8) and climate action (SDG13) are all dependent on electricity access.
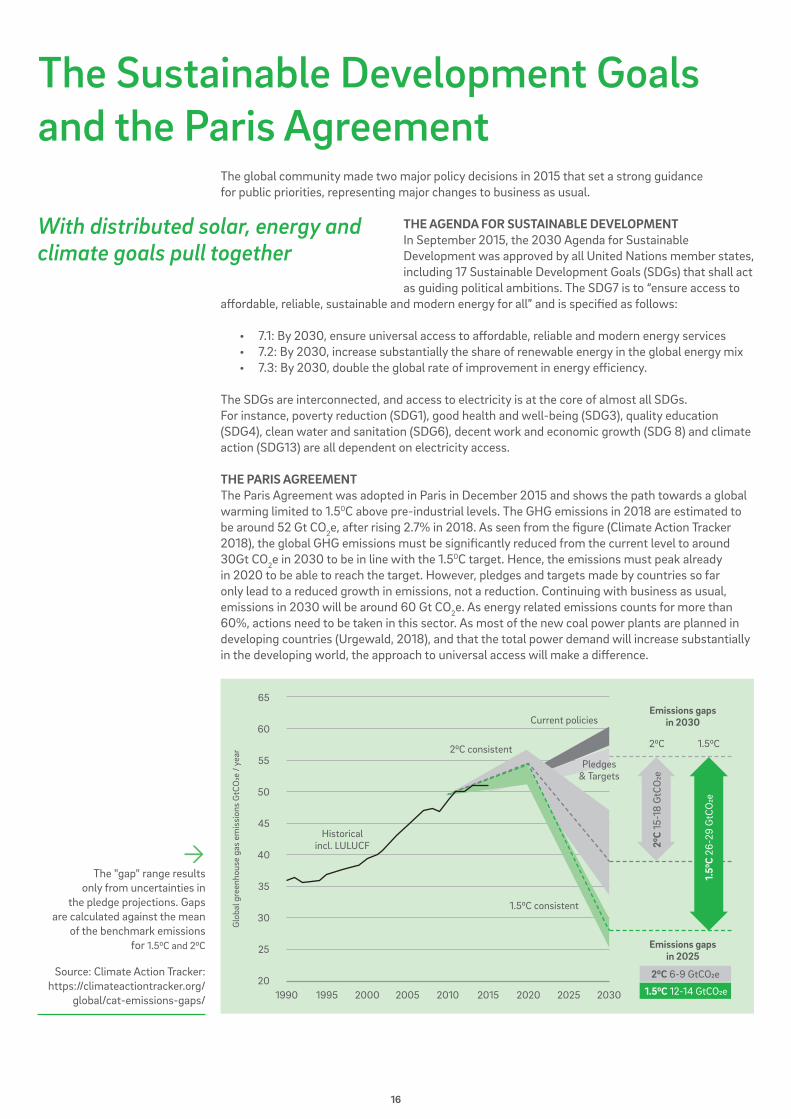
THE PARIS AGREEMENTThe Paris Agreement was adopted in Paris in December 2015 and shows the path towards a global warming limited to 1.50C above pre-industrial levels. The GHG emissions in 2018 are estimated to be around 52 Gt CO2e, after rising 2.7% in 2018. As seen from the figure (Climate Action Tracker 2018), the global GHG emissions must be significantly reduced from the current level to around 30Gt CO2e in 2030 to be in line with the 1.50C target. Hence, the emissions must peak already in 2020 to be able to reach the target. However, pledges and targets made by countries so far only lead to a reduced growth in emissions, not a reduction. Continuing with business as usual, emissions in 2030 will be around 60 Gt CO2e. As energy related emissions counts for more than 60%, actions need to be taken in this sector. As most of the new coal power plants are planned in developing countries (Urgewald, 2018), and that the total power demand will increase substantially in the developing world, the approach to universal access will make a difference.
With distributed solar, energy and climate goals pull together
The "gap" range results
only from uncertainties in the pledge projections. Gaps
are calculated against the mean of the benchmark emissions
for 1.50C and 20C
Source: Climate Action Tracker: https://climateactiontracker.org/
global/cat-emissions-gaps/
Glo
bal g
reen
hous
e ga
s em
issi
ons
GtC
O2e
/ ye
ar
199020
30
25
50
35
55
40
60
45
65
Historicalincl. LULUCF
1.50C consistent
1.50C20C20C consistent
Current policies
1995 2000 2005 2010 2015 20252020 2030
Pledges& Targets
Emissions gaps in 2030
Emissions gaps in 2025
20C
15-1
8 G
tCO
2e
20C 6-9 GtCO2e
1.50C 12-14 GtCO2e
1.50
C 26
-29
GtC
O2e
17
ACHIEVING DEVELOPMENT AND CLIMATE OBJECTIVES IN TANDEMAn estimated 1.3 billion people must obtain access to sustainable electricity services by 2030 if we are to achieve SDG 7 (IEA, 2017). However, our current path means almost 700 million people will still be without access to sustainable electricity in 2030. The main challenge in this respect is Sub-Saharan Africa. In addition, energy demand from commercial and industrial activities in developing countries will increase substantially over the coming decade.
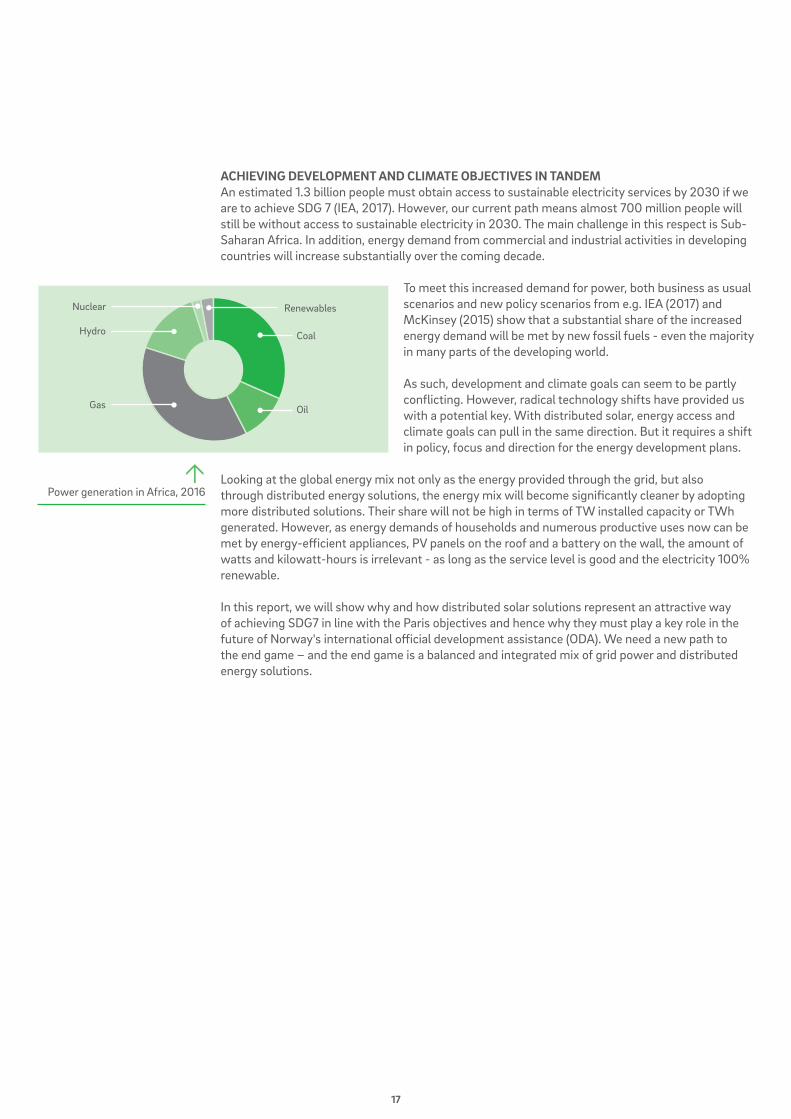
To meet this increased demand for power, both business as usual scenarios and new policy scenarios from e.g. IEA (2017) and McKinsey (2015) show that a substantial share of the increased energy demand will be met by new fossil fuels - even the majority in many parts of the developing world.
As such, development and climate goals can seem to be partly conflicting. However, radical technology shifts have provided us with a potential key. With distributed solar, energy access and climate goals can pull in the same direction. But it requires a shift in policy, focus and direction for the energy development plans.
Looking at the global energy mix not only as the energy provided through the grid, but also through distributed energy solutions, the energy mix will become significantly cleaner by adopting more distributed solutions. Their share will not be high in terms of TW installed capacity or TWh generated. However, as energy demands of households and numerous productive uses now can be met by energy-efficient appliances, PV panels on the roof and a battery on the wall, the amount of watts and kilowatt-hours is irrelevant - as long as the service level is good and the electricity 100% renewable.
In this report, we will show why and how distributed solar solutions represent an attractive way of achieving SDG7 in line with the Paris objectives and hence why they must play a key role in the future of Norway's international official development assistance (ODA). We need a new path to the end game – and the end game is a balanced and integrated mix of grid power and distributed energy solutions.
Nuclear
Hydro
Gas
Renewables
Oil
Coal
Power generation in Africa, 2016
18
19
THE SOLAR INDUSTRY– FOUR FUNDAMENTALS

20
Distributed solar energy technology
Rather than connecting every end-user of energy to one central grid supplied by a number of large power plants, distributed energy is characterized by numerous, small(er) generation units (“stand-alone”) - potentially interlinked to increase the robustness and decrease the vulnerability (“mini-grids”) and potentially also with linked to the grid (“captive”).
Energy solutions are called “distributed” when the generation of power is co-located with the consumption. The ability to distribute smaller physical power generation assets (e.g. PV panels or diesel generators) enables distributed energy solutions2. The less you lose in cost and efficiency by moving the generation closer to the consumption, the more competitive the distributed solutions will be compared to grid power. Solar PV can be set up almost anywhere and its characteristics makes it very suitable for distributed electricity generation.
Distributed energy can be entirely disconnected from the grid or be integrated with it. Distribut-ed energy can be either entirely disconnected (“off-grid”) and avoid transmission and distribution infrastructure, or it can be solutions co-located with consumption, but at the same time interacting with the central grid and optimizing the two sources of electricity. When the grid and distributed solutions co-exist and are interlinked, the distributed solutions are often referred to as “captive power production” or “behind the meter solutions”.
Grid solution Distributed energy solution
Solar plant generation Transmission Distribution CUSTOMERS Own generation
Off-grid
Mini-grid
Captive
Customer Energy source up to now Energy source from now onwards
OFF
-GR
ID
Rural households Candles, kerosene, nothing Pico: Lamps/small lightingSHS: Lighting, fan, TV,fridge, chargingBoth DC and AC
Community buildings, productive use
Diesel gen, lead acid battery Complete 1-50 kW AC PV systems (Lithium) and appliances
GRI
D &
CA
PTIV
E
Commercial & Indus-trial (C&I)
Grid + diesel genset as backup
Roof-top solar. Battery/diesel/grid as backup
Urban and industrial Grid with mainly fossil fuel Grid with fossil fuel and solar and/or roof-top solar in combination
Brief overview of ways to provide electricity and energy services to
customers.
2 Typical sources of distributed energy generation in residential or industrial/commercial contexts include (but are not limited to) solar PV panels, small wind turbines, combined heat and power systems, municipal solid waste incineration, mini- or micro-hydropower, fuel cells, or different types of biomass combustion, or diesel generators. Hybrid solutions involving more than one of these sources also exist. This report concentrates on solar PV.
21
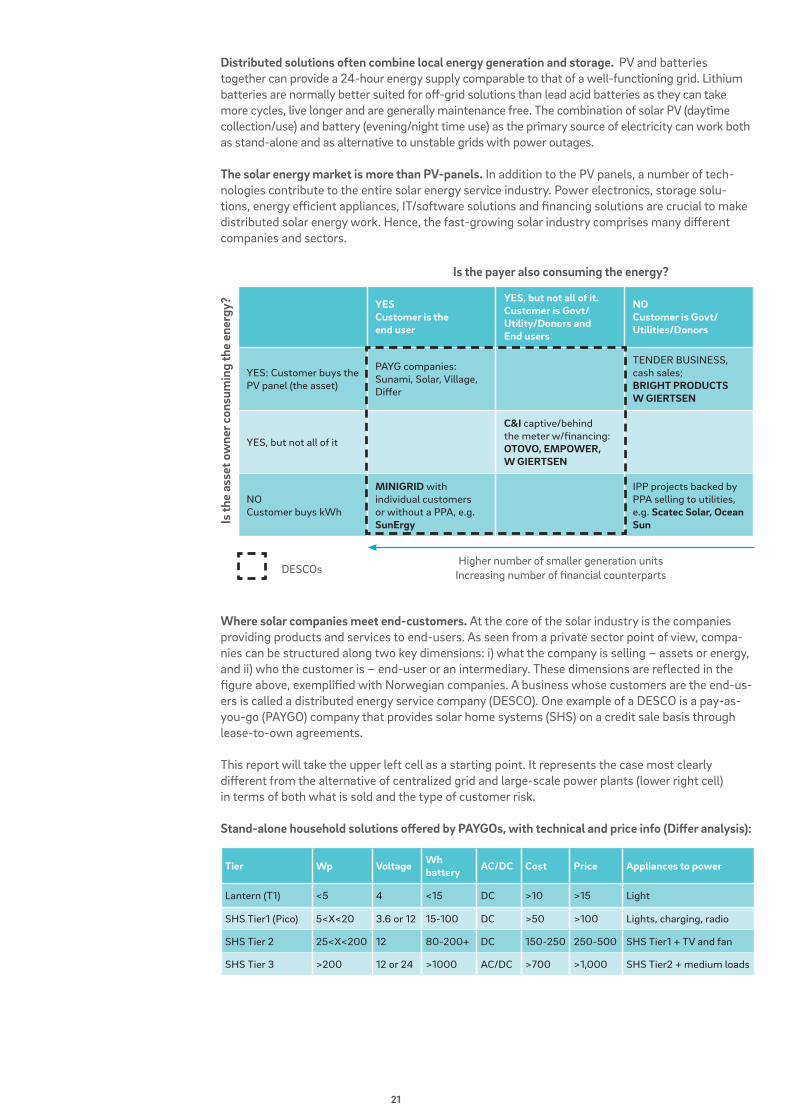
Distributed solutions often combine local energy generation and storage. PV and batteries together can provide a 24-hour energy supply comparable to that of a well-functioning grid. Lithium batteries are normally better suited for off-grid solutions than lead acid batteries as they can take more cycles, live longer and are generally maintenance free. The combination of solar PV (daytime collection/use) and battery (evening/night time use) as the primary source of electricity can work both as stand-alone and as alternative to unstable grids with power outages.
The solar energy market is more than PV-panels. In addition to the PV panels, a number of tech-nologies contribute to the entire solar energy service industry. Power electronics, storage solu-tions, energy efficient appliances, IT/software solutions and financing solutions are crucial to make distributed solar energy work. Hence, the fast-growing solar industry comprises many different companies and sectors.
Where solar companies meet end-customers. At the core of the solar industry is the companies providing products and services to end-users. As seen from a private sector point of view, compa-nies can be structured along two key dimensions: i) what the company is selling – assets or energy, and ii) who the customer is – end-user or an intermediary. These dimensions are reflected in the figure above, exemplified with Norwegian companies. A business whose customers are the end-us-ers is called a distributed energy service company (DESCO). One example of a DESCO is a pay-as-you-go (PAYGO) company that provides solar home systems (SHS) on a credit sale basis through lease-to-own agreements.
This report will take the upper left cell as a starting point. It represents the case most clearly different from the alternative of centralized grid and large-scale power plants (lower right cell) in terms of both what is sold and the type of customer risk.
Stand-alone household solutions offered by PAYGOs, with technical and price info (Differ analysis):
YESCustomer is the end user
YES, but not all of it. Customer is Govt/ Utility/Donors and End users
NO Customer is Govt/ Utilities/Donors
YES: Customer buys the PV panel (the asset)
PAYG companies: Sunami, Solar, Village, Differ
TENDER BUSINESS,cash sales;BRIGHT PRODUCTSW GIERTSEN
YES, but not all of it
C&I captive/behind the meter w/financing: OTOVO, EMPOWER, W GIERTSEN
NOCustomer buys kWh
MINIGRID with individual customers or without a PPA, e.g. SunErgy
IPP projects backed by PPA selling to utilities, e.g. Scatec Solar, Ocean Sun
Is the payer also consuming the energy?
Is th
e as
set o
wne
r con
sum
ing
the
ener
gy?
Higher number of smaller generation unitsIncreasing number of financial counterpartsDESCOs
Tier Wp Voltage Wh battery AC/DC Cost Price Appliances to power
Lantern (T1) <5 4 <15 DC >10 >15 Light
SHS Tier1 (Pico) 5<X<20 3.6 or 12 15-100 DC >50 >100 Lights, charging, radio
SHS Tier 2 25<X<200 12 80-200+ DC 150-250 250-500 SHS Tier1 + TV and fan
SHS Tier 3 >200 12 or 24 >1000 AC/DC >700 >1,000 SHS Tier2 + medium loads

22
Access to electricity at various service level
In developed countries the population has electricity access 24/7 and can use any appliance. No capacity issues and very rare power outages. This is mainly provided by the grid, but more and more distributed solutions are seen in combination with grid (captive/behind the meter power).
Quality of electricity supply should be measured in service levels - independent of technological solution. Access is not either full 24/7 access to everything or nothing; it is more nuanced and a continuum of energy services. The flexibility of distributed solar power – combined with battery storage for night usage – means that distributed solar solutions plays a role at all levels of access.
To stimulate and track progress towards achieving the SDG7 on universal access, Energy Sector Management Assistance Pro-gram (ESMAP) has developed a framework for assessing quality of electricity supply (ESMAP, 2015). The framework defines five different service levels (or tiers) for households, spanning from a
single light source with time-limited access and mobile phone charging possibility (Tier 1), to gener-ally 24/7 access to power any appliance for any duration desirable (Tier 5). The framework also has defined tiers for access to electricity for productive use and community infrastructure where this is applicable.
This report will focus on the SDG7 on universal access, hence concentrate on electrification of households, but with an understanding that an optimal electrification strategy also takes produc-tive use, community services and local context into account.
Access to electricity is not everything or nothing
Tier
defi
nitio
nRe
liabi
lity
Avai
labi
lity
Prod
uctiv
e us
e
Tier 1 Tier 2 Tier 3
Tier 2 + medium power
appliances
4 hrs/day1 hr/evening
3W12Wh
Min 2 hrs
8 hrs/day3 hr/evening
200W1kWh
Min 50% ofworking hrs
4 hrs/day2 hr/evening
50W200Wh
Min 4 hrs
16 hrs/day4 hr/evening
800W3.4kWh
Min 75% ofworking hrs
14 disruptions/week
23 hrs/day4 hr/evening
2kWh8.2kWh
Min 95% ofworking hrs
3 disruptions/week, total
duration <2 hrs
Tier 3 + high powerappliances
Tier 4 + very high power
appliances
Tier 4 Tier 5
Pico
SHS kits
Solar component systems
23
Distributed energy service companies
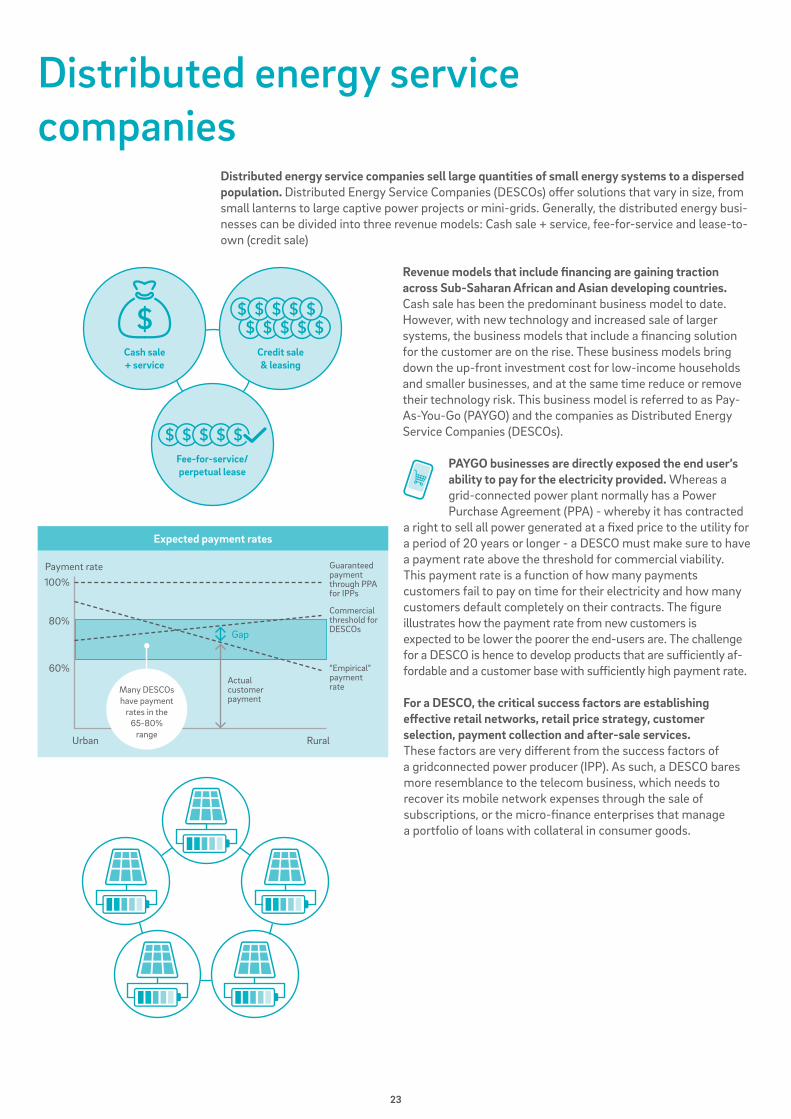
Distributed energy service companies sell large quantities of small energy systems to a dispersed population. Distributed Energy Service Companies (DESCOs) offer solutions that vary in size, from small lanterns to large captive power projects or mini-grids. Generally, the distributed energy busi-nesses can be divided into three revenue models: Cash sale + service, fee-for-service and lease-to-own (credit sale)
Revenue models that include financing are gaining traction across Sub-Saharan African and Asian developing countries. Cash sale has been the predominant business model to date. However, with new technology and increased sale of larger systems, the business models that include a financing solution for the customer are on the rise. These business models bring down the up-front investment cost for low-income households and smaller businesses, and at the same time reduce or remove their technology risk. This business model is referred to as Pay-As-You-Go (PAYGO) and the companies as Distributed Energy Service Companies (DESCOs).
PAYGO businesses are directly exposed the end user’s ability to pay for the electricity provided. Whereas a grid-connected power plant normally has a Power Purchase Agreement (PPA) - whereby it has contracted
a right to sell all power generated at a fixed price to the utility for a period of 20 years or longer - a DESCO must make sure to have a payment rate above the threshold for commercial viability. This payment rate is a function of how many payments customers fail to pay on time for their electricity and how many customers default completely on their contracts. The figure illustrates how the payment rate from new customers is expected to be lower the poorer the end-users are. The challenge for a DESCO is hence to develop products that are sufficiently af-fordable and a customer base with sufficiently high payment rate.
For a DESCO, the critical success factors are establishing effective retail networks, retail price strategy, customer selection, payment collection and after-sale services. These factors are very different from the success factors of a gridconnected power producer (IPP). As such, a DESCO bares more resemblance to the telecom business, which needs to recover its mobile network expenses through the sale of subscriptions, or the micro-finance enterprises that manage a portfolio of loans with collateral in consumer goods.
Cash sale+ service
Fee-for-service/perpetual lease
Credit sale& leasing
60%
80%
100%
Urban
Payment rate
Actual customerpayment
“Empirical”payment rate
Commercial threshold for DESCOs
Guaranteed payment through PPA for IPPs
Gap
Rural
Many DESCOs have payment
rates in the 65-80%
range
Expected payment rates
24
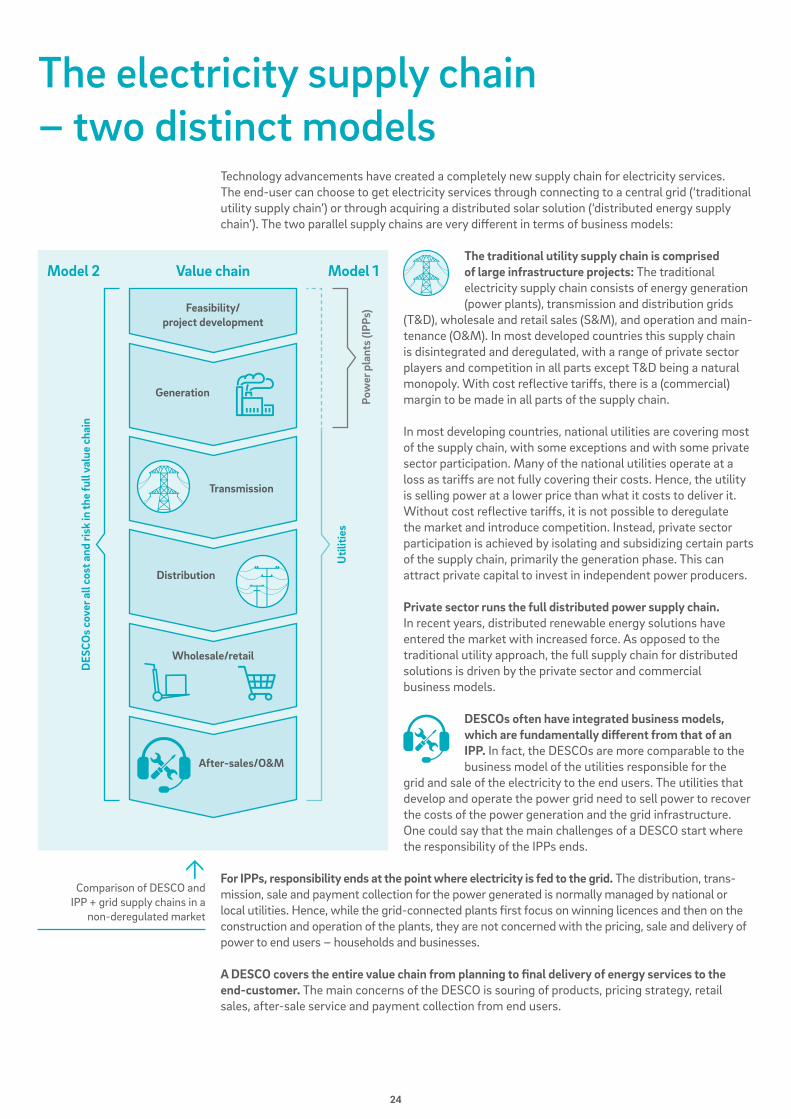
Technology advancements have created a completely new supply chain for electricity services. The end-user can choose to get electricity services through connecting to a central grid (‘traditional utility supply chain’) or through acquiring a distributed solar solution (‘distributed energy supply chain’). The two parallel supply chains are very different in terms of business models:
The traditional utility supply chain is comprised of large infrastructure projects: The traditional electricity supply chain consists of energy generation (power plants), transmission and distribution grids
(T&D), wholesale and retail sales (S&M), and operation and main-tenance (O&M). In most developed countries this supply chain is disintegrated and deregulated, with a range of private sector players and competition in all parts except T&D being a natural monopoly. With cost reflective tariffs, there is a (commercial) margin to be made in all parts of the supply chain.
In most developing countries, national utilities are covering most of the supply chain, with some exceptions and with some private sector participation. Many of the national utilities operate at a loss as tariffs are not fully covering their costs. Hence, the utility is selling power at a lower price than what it costs to deliver it. Without cost reflective tariffs, it is not possible to deregulate the market and introduce competition. Instead, private sector participation is achieved by isolating and subsidizing certain parts of the supply chain, primarily the generation phase. This can attract private capital to invest in independent power producers.
Private sector runs the full distributed power supply chain. In recent years, distributed renewable energy solutions have entered the market with increased force. As opposed to the traditional utility approach, the full supply chain for distributed solutions is driven by the private sector and commercial business models.
DESCOs often have integrated business models, which are fundamentally different from that of an IPP. In fact, the DESCOs are more comparable to the business model of the utilities responsible for the
grid and sale of the electricity to the end users. The utilities that develop and operate the power grid need to sell power to recover the costs of the power generation and the grid infrastructure. One could say that the main challenges of a DESCO start where the responsibility of the IPPs ends.
For IPPs, responsibility ends at the point where electricity is fed to the grid. The distribution, trans-mission, sale and payment collection for the power generated is normally managed by national or local utilities. Hence, while the grid-connected plants first focus on winning licences and then on the construction and operation of the plants, they are not concerned with the pricing, sale and delivery of power to end users – households and businesses.
A DESCO covers the entire value chain from planning to final delivery of energy services to the end-customer. The main concerns of the DESCO is souring of products, pricing strategy, retail sales, after-sale service and payment collection from end users.
The electricity supply chain – two distinct models
Feasibility/project development
Generation
DES
COs
cove
r all
cost
and
risk
in th
e fu
ll va
lue
chai
n
Util
ities
Pow
er p
lant
s (IP
Ps)
Value chainModel 2 Model 1
Transmission
Distribution
Wholesale/retail
After-sales/O&M
Comparison of DESCO and
IPP + grid supply chains in a non-deregulated market
25
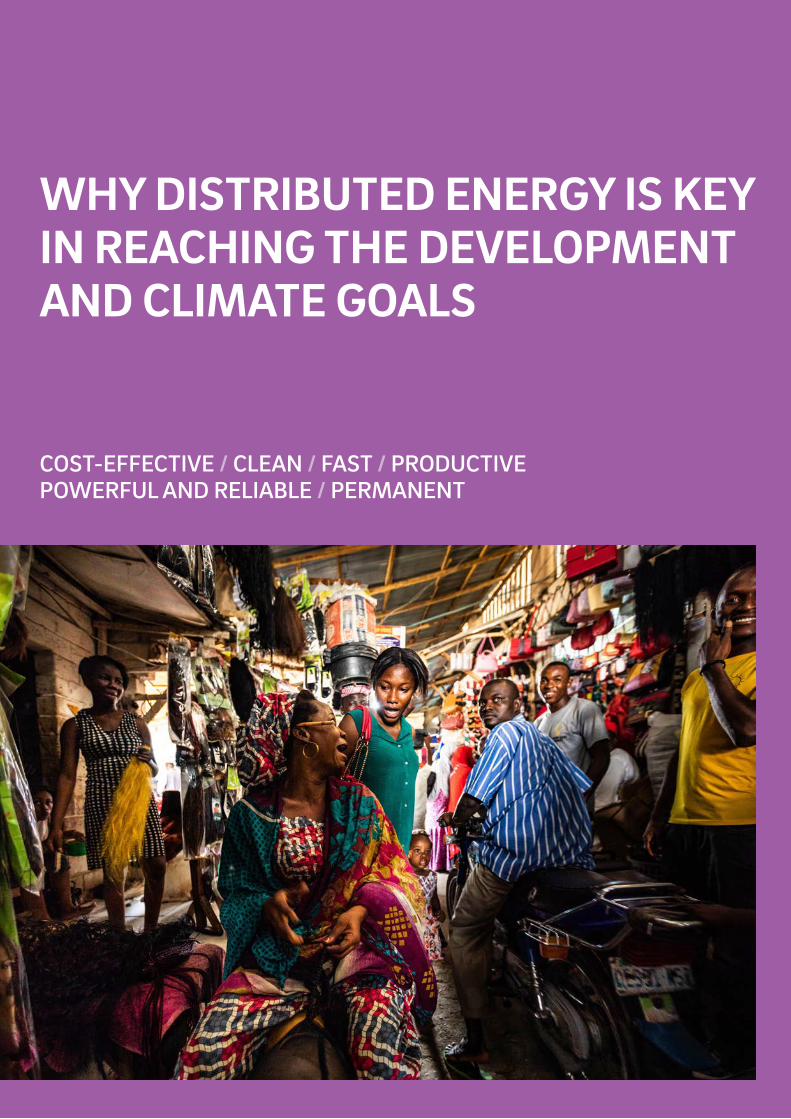
COST-EFFECTIVE / CLEAN / FAST / PRODUCTIVEPOWERFUL AND RELIABLE / PERMANENT
WHY DISTRIBUTED ENERGY IS KEY IN REACHING THE DEVELOPMENT AND CLIMATE GOALS
26
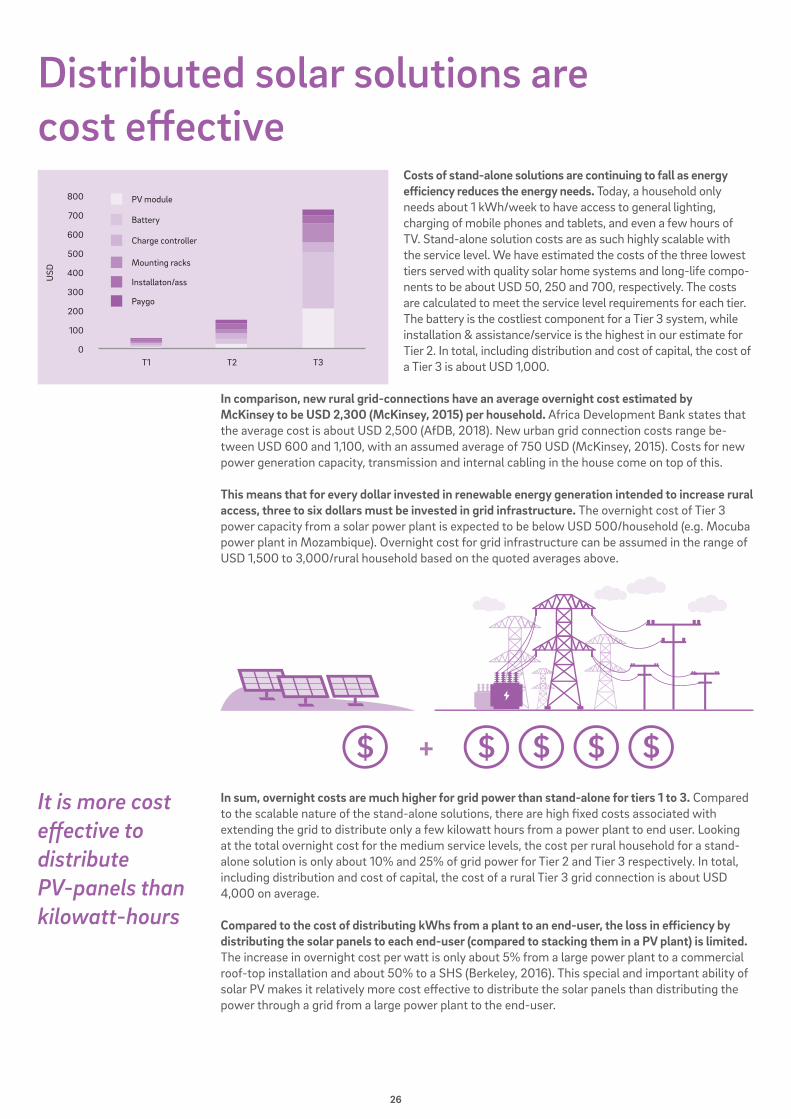
Distributed solar solutions are cost effective
Costs of stand-alone solutions are continuing to fall as energy efficiency reduces the energy needs. Today, a household only needs about 1 kWh/week to have access to general lighting, charging of mobile phones and tablets, and even a few hours of TV. Stand-alone solution costs are as such highly scalable with the service level. We have estimated the costs of the three lowest tiers served with quality solar home systems and long-life compo-nents to be about USD 50, 250 and 700, respectively. The costs are calculated to meet the service level requirements for each tier. The battery is the costliest component for a Tier 3 system, while installation & assistance/service is the highest in our estimate for Tier 2. In total, including distribution and cost of capital, the cost of a Tier 3 is about USD 1,000.
In comparison, new rural grid-connections have an average overnight cost estimated by McKinsey to be USD 2,300 (McKinsey, 2015) per household. Africa Development Bank states that the average cost is about USD 2,500 (AfDB, 2018). New urban grid connection costs range be-tween USD 600 and 1,100, with an assumed average of 750 USD (McKinsey, 2015). Costs for new power generation capacity, transmission and internal cabling in the house come on top of this.
This means that for every dollar invested in renewable energy generation intended to increase rural access, three to six dollars must be invested in grid infrastructure. The overnight cost of Tier 3 power capacity from a solar power plant is expected to be below USD 500/household (e.g. Mocuba power plant in Mozambique). Overnight cost for grid infrastructure can be assumed in the range of USD 1,500 to 3,000/rural household based on the quoted averages above.
In sum, overnight costs are much higher for grid power than stand-alone for tiers 1 to 3. Compared to the scalable nature of the stand-alone solutions, there are high fixed costs associated with extending the grid to distribute only a few kilowatt hours from a power plant to end user. Looking at the total overnight cost for the medium service levels, the cost per rural household for a stand-alone solution is only about 10% and 25% of grid power for Tier 2 and Tier 3 respectively. In total, including distribution and cost of capital, the cost of a rural Tier 3 grid connection is about USD 4,000 on average.
Compared to the cost of distributing kWhs from a plant to an end-user, the loss in efficiency by distributing the solar panels to each end-user (compared to stacking them in a PV plant) is limited. The increase in overnight cost per watt is only about 5% from a large power plant to a commercial roof-top installation and about 50% to a SHS (Berkeley, 2016). This special and important ability of solar PV makes it relatively more cost effective to distribute the solar panels than distributing the power through a grid from a large power plant to the end-user.
It is more cost effective to distribute PV-panels than kilowatt-hours
+
800
600
400
PV module
Battery
Charge controller
Mounting racks
Installaton/ass
Paygo
500
200
700
300
100
0
USD
T1 T2 T3
27
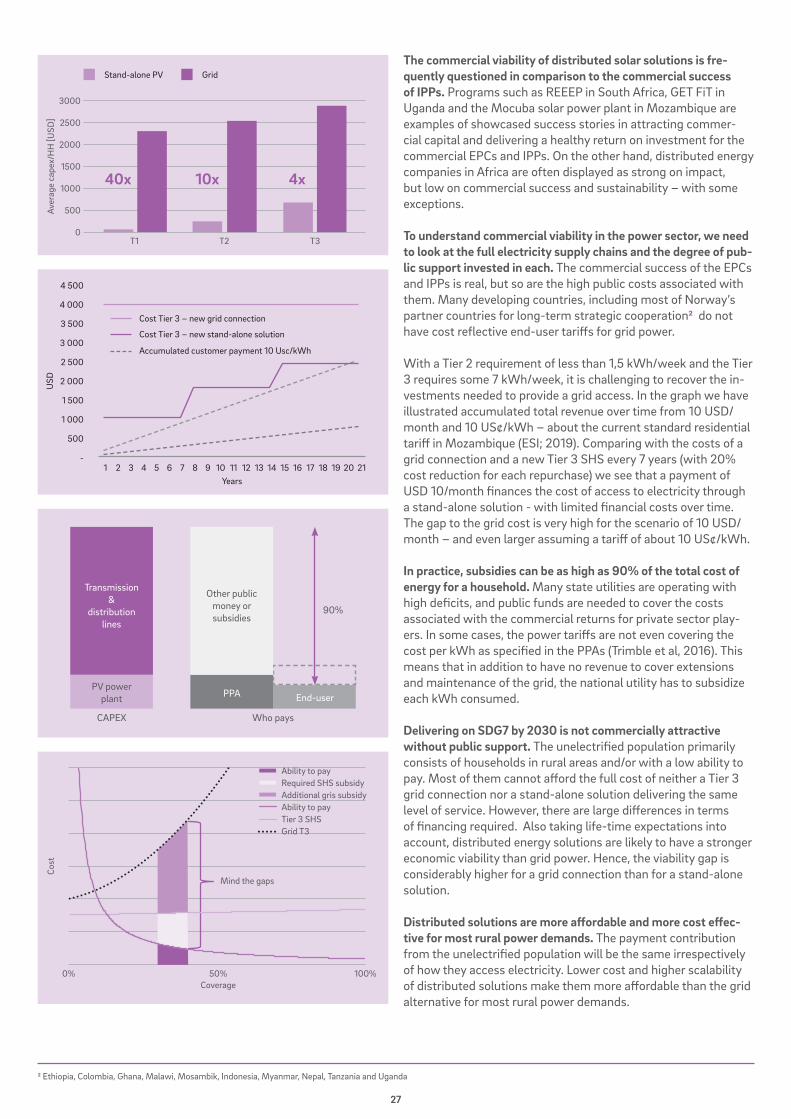
The commercial viability of distributed solar solutions is fre-quently questioned in comparison to the commercial success of IPPs. Programs such as REEEP in South Africa, GET FiT in Uganda and the Mocuba solar power plant in Mozambique are examples of showcased success stories in attracting commer-cial capital and delivering a healthy return on investment for the commercial EPCs and IPPs. On the other hand, distributed energy companies in Africa are often displayed as strong on impact, but low on commercial success and sustainability – with some exceptions.
To understand commercial viability in the power sector, we need to look at the full electricity supply chains and the degree of pub-lic support invested in each. The commercial success of the EPCs and IPPs is real, but so are the high public costs associated with them. Many developing countries, including most of Norway’s partner countries for long-term strategic cooperation2 do not have cost reflective end-user tariffs for grid power.
With a Tier 2 requirement of less than 1,5 kWh/week and the Tier 3 requires some 7 kWh/week, it is challenging to recover the in-vestments needed to provide a grid access. In the graph we have illustrated accumulated total revenue over time from 10 USD/month and 10 US¢/kWh – about the current standard residential tariff in Mozambique (ESI; 2019). Comparing with the costs of a grid connection and a new Tier 3 SHS every 7 years (with 20% cost reduction for each repurchase) we see that a payment of USD 10/month finances the cost of access to electricity through a stand-alone solution - with limited financial costs over time. The gap to the grid cost is very high for the scenario of 10 USD/month – and even larger assuming a tariff of about 10 US¢/kWh.
In practice, subsidies can be as high as 90% of the total cost of energy for a household. Many state utilities are operating with high deficits, and public funds are needed to cover the costs associated with the commercial returns for private sector play-ers. In some cases, the power tariffs are not even covering the cost per kWh as specified in the PPAs (Trimble et al, 2016). This means that in addition to have no revenue to cover extensions and maintenance of the grid, the national utility has to subsidize each kWh consumed.
Delivering on SDG7 by 2030 is not commercially attractive without public support. The unelectrified population primarily consists of households in rural areas and/or with a low ability to pay. Most of them cannot afford the full cost of neither a Tier 3 grid connection nor a stand-alone solution delivering the same level of service. However, there are large differences in terms of financing required. Also taking life-time expectations into account, distributed energy solutions are likely to have a stronger economic viability than grid power. Hence, the viability gap is considerably higher for a grid connection than for a stand-alone solution.
Distributed solutions are more affordable and more cost effec-tive for most rural power demands. The payment contribution from the unelectrified population will be the same irrespectively of how they access electricity. Lower cost and higher scalability of distributed solutions make them more affordable than the grid alternative for most rural power demands.
2 Ethiopia, Colombia, Ghana, Malawi, Mosambik, Indonesia, Myanmar, Nepal, Tanzania and Uganda
Cost
0% 50%Coverage
Mind the gaps
100%
Ability to payRequired SHS subsidyAdditional gris subsidyAbility to payTier 3 SHSGrid T3
Aver
age
cape
x/H
H [U
SD]
0
500
1000
2000
3000
2500
1500
40x 10x 4x
T2T1 T3
Stand-alone PV Grid
CAPEX Who pays
Transmission&
distributionlines
PV powerplant PPA End-user
90%
Other publicmoney orsubsidies
4 000
4 500
3 000
2 000
2 500
1 000
3 500
1 500
500
-
USD
1 4 7 10 13 16 192 5 8 11 14 17 203 6 9 12 15 18 21Years
Cost Tier 3 – new grid connection
Cost Tier 3 – new stand-alone solution
Accumulated customer payment 10 Usc/kWh
28
Modern electrification plans need a modern approach to levelized cost of electricity
Levelized cost of electricity must include distribution cost
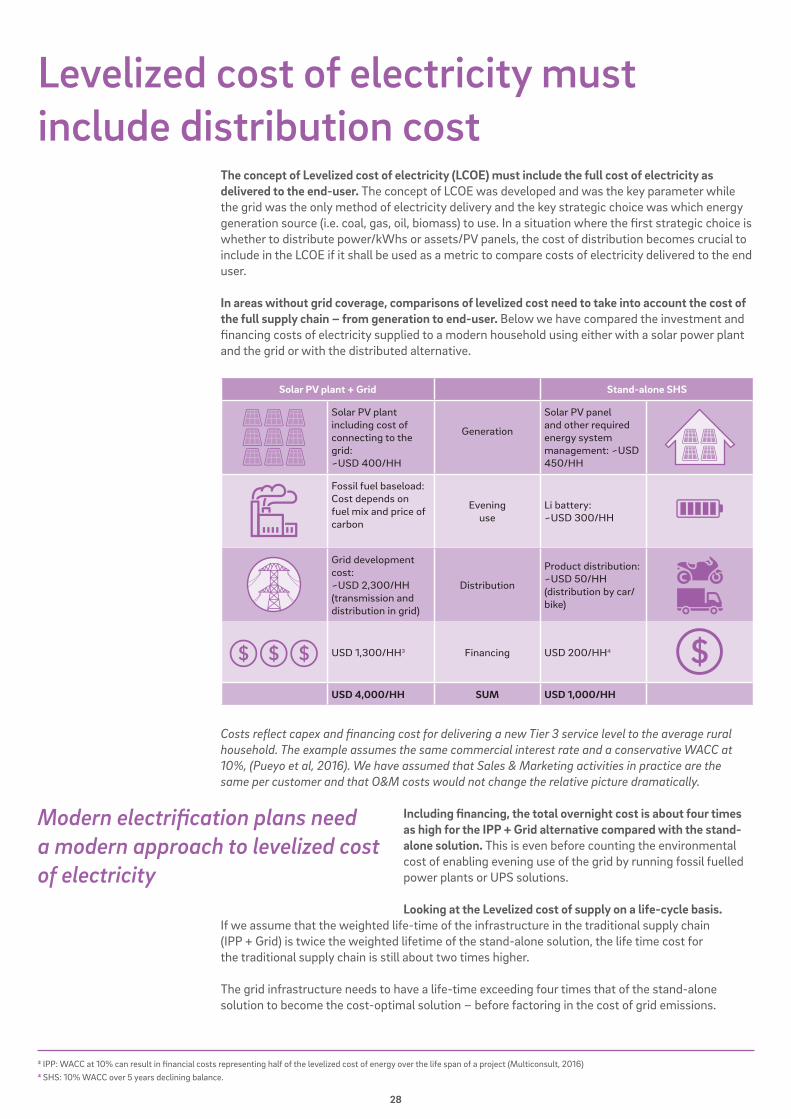
The concept of Levelized cost of electricity (LCOE) must include the full cost of electricity as delivered to the end-user. The concept of LCOE was developed and was the key parameter while the grid was the only method of electricity delivery and the key strategic choice was which energy generation source (i.e. coal, gas, oil, biomass) to use. In a situation where the first strategic choice is whether to distribute power/kWhs or assets/PV panels, the cost of distribution becomes crucial to include in the LCOE if it shall be used as a metric to compare costs of electricity delivered to the end user.
In areas without grid coverage, comparisons of levelized cost need to take into account the cost of the full supply chain – from generation to end-user. Below we have compared the investment and financing costs of electricity supplied to a modern household using either with a solar power plant and the grid or with the distributed alternative.
Costs reflect capex and financing cost for delivering a new Tier 3 service level to the average rural household. The example assumes the same commercial interest rate and a conservative WACC at 10%, (Pueyo et al, 2016). We have assumed that Sales & Marketing activities in practice are the same per customer and that O&M costs would not change the relative picture dramatically.
Including financing, the total overnight cost is about four times as high for the IPP + Grid alternative compared with the stand-alone solution. This is even before counting the environmental cost of enabling evening use of the grid by running fossil fuelled power plants or UPS solutions.
Looking at the Levelized cost of supply on a life-cycle basis. If we assume that the weighted life-time of the infrastructure in the traditional supply chain (IPP + Grid) is twice the weighted lifetime of the stand-alone solution, the life time cost for the traditional supply chain is still about two times higher.
The grid infrastructure needs to have a life-time exceeding four times that of the stand-alone solution to become the cost-optimal solution – before factoring in the cost of grid emissions.
Solar PV plant + Grid Stand-alone SHS
Solar PV plant including cost of connecting to the grid: ~USD 400/HH
Generation
Solar PV panel and other required energy system management: ~USD 450/HH
Fossil fuel baseload:Cost depends on fuel mix and price of carbon
Evening use
Li battery: ~USD 300/HH
Grid development cost: ~USD 2,300/HH(transmission and distribution in grid)
Distribution
Product distribution:~USD 50/HH(distribution by car/bike)
USD 1,300/HH3 Financing USD 200/HH4
USD 4,000/HH SUM USD 1,000/HH
3 IPP: WACC at 10% can result in financial costs representing half of the levelized cost of energy over the life span of a project (Multiconsult, 2016) 4 SHS: 10% WACC over 5 years declining balance.
29
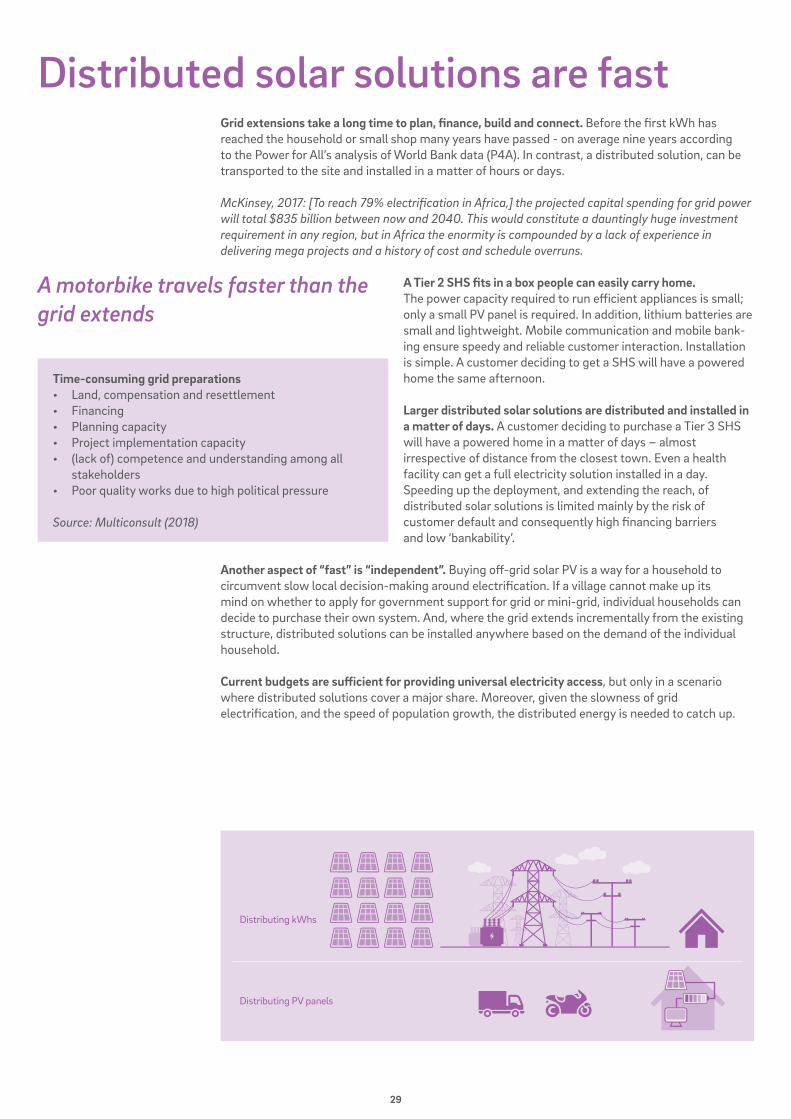
Distributed solar solutions are fastGrid extensions take a long time to plan, finance, build and connect. Before the first kWh has reached the household or small shop many years have passed - on average nine years according to the Power for All’s analysis of World Bank data (P4A). In contrast, a distributed solution, can be transported to the site and installed in a matter of hours or days.
McKinsey, 2017: [To reach 79% electrification in Africa,] the projected capital spending for grid power will total $835 billion between now and 2040. This would constitute a dauntingly huge investment requirement in any region, but in Africa the enormity is compounded by a lack of experience in delivering mega projects and a history of cost and schedule overruns.
A Tier 2 SHS fits in a box people can easily carry home. The power capacity required to run efficient appliances is small; only a small PV panel is required. In addition, lithium batteries are small and lightweight. Mobile communication and mobile bank-ing ensure speedy and reliable customer interaction. Installation is simple. A customer deciding to get a SHS will have a powered home the same afternoon.
Larger distributed solar solutions are distributed and installed in a matter of days. A customer deciding to purchase a Tier 3 SHS will have a powered home in a matter of days – almost irrespective of distance from the closest town. Even a health facility can get a full electricity solution installed in a day. Speeding up the deployment, and extending the reach, of distributed solar solutions is limited mainly by the risk of customer default and consequently high financing barriers and low ‘bankability’.
Another aspect of “fast” is “independent”. Buying off-grid solar PV is a way for a household to circumvent slow local decision-making around electrification. If a village cannot make up its mind on whether to apply for government support for grid or mini-grid, individual households can decide to purchase their own system. And, where the grid extends incrementally from the existing structure, distributed solutions can be installed anywhere based on the demand of the individual household.
Current budgets are sufficient for providing universal electricity access, but only in a scenario where distributed solutions cover a major share. Moreover, given the slowness of grid electrification, and the speed of population growth, the distributed energy is needed to catch up.
A motorbike travels faster than the grid extends
Time-consuming grid preparations• Land, compensation and resettlement• Financing• Planning capacity• Project implementation capacity• (lack of) competence and understanding among all stakeholders• Poor quality works due to high political pressure
Source: Multiconsult (2018)
Distributing kWhs
Distributing PV panels
30
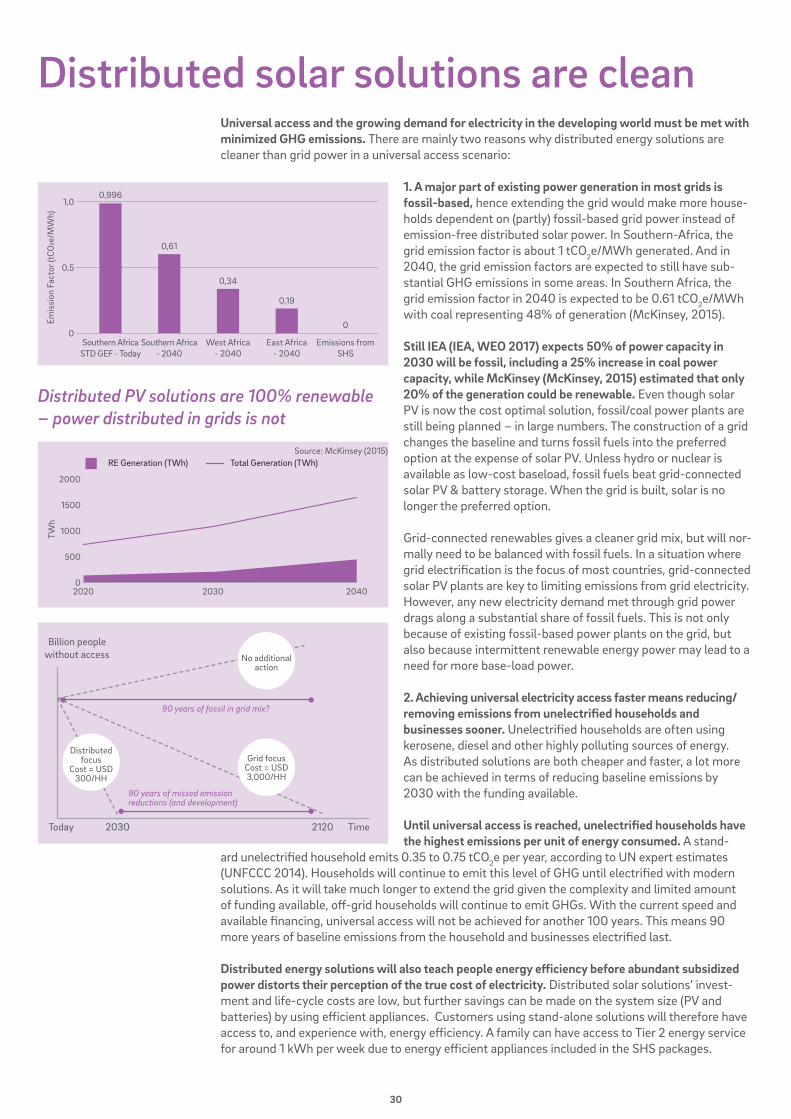
Distributed solar solutions are cleanUniversal access and the growing demand for electricity in the developing world must be met with minimized GHG emissions. There are mainly two reasons why distributed energy solutions are cleaner than grid power in a universal access scenario:
1. A major part of existing power generation in most grids is fossil-based, hence extending the grid would make more house-holds dependent on (partly) fossil-based grid power instead of emission-free distributed solar power. In Southern-Africa, the grid emission factor is about 1 tCO2e/MWh generated. And in 2040, the grid emission factors are expected to still have sub-stantial GHG emissions in some areas. In Southern Africa, the grid emission factor in 2040 is expected to be 0.61 tCO2e/MWh with coal representing 48% of generation (McKinsey, 2015).
Still IEA (IEA, WEO 2017) expects 50% of power capacity in 2030 will be fossil, including a 25% increase in coal power capacity, while McKinsey (McKinsey, 2015) estimated that only 20% of the generation could be renewable. Even though solar PV is now the cost optimal solution, fossil/coal power plants are still being planned – in large numbers. The construction of a grid changes the baseline and turns fossil fuels into the preferred option at the expense of solar PV. Unless hydro or nuclear is available as low-cost baseload, fossil fuels beat grid-connected solar PV & battery storage. When the grid is built, solar is no longer the preferred option.
Grid-connected renewables gives a cleaner grid mix, but will nor-mally need to be balanced with fossil fuels. In a situation where grid electrification is the focus of most countries, grid-connected solar PV plants are key to limiting emissions from grid electricity. However, any new electricity demand met through grid power drags along a substantial share of fossil fuels. This is not only because of existing fossil-based power plants on the grid, but also because intermittent renewable energy power may lead to a need for more base-load power.
2. Achieving universal electricity access faster means reducing/ removing emissions from unelectrified households and businesses sooner. Unelectrified households are often using kerosene, diesel and other highly polluting sources of energy. As distributed solutions are both cheaper and faster, a lot more can be achieved in terms of reducing baseline emissions by 2030 with the funding available.
Until universal access is reached, unelectrified households have the highest emissions per unit of energy consumed. A stand-
ard unelectrified household emits 0.35 to 0.75 tCO2e per year, according to UN expert estimates (UNFCCC 2014). Households will continue to emit this level of GHG until electrified with modern solutions. As it will take much longer to extend the grid given the complexity and limited amount of funding available, off-grid households will continue to emit GHGs. With the current speed and available financing, universal access will not be achieved for another 100 years. This means 90 more years of baseline emissions from the household and businesses electrified last.
Distributed energy solutions will also teach people energy efficiency before abundant subsidized power distorts their perception of the true cost of electricity. Distributed solar solutions’ invest-ment and life-cycle costs are low, but further savings can be made on the system size (PV and batteries) by using efficient appliances. Customers using stand-alone solutions will therefore have access to, and experience with, energy efficiency. A family can have access to Tier 2 energy service for around 1 kWh per week due to energy efficient appliances included in the SHS packages.
Distributed PV solutions are 100% renewable – power distributed in grids is not
0
0,5
1,0
Southern AfricaSTD GEF - Today
Southern Africa- 2040
West Africa- 2040
East Africa- 2040
Emissions fromSHS
Emis
sion
Fac
tor (
tCO
2e/M
Wh)
0,996
0,61
0,34
0,19
0
Today 2030
Billion peoplewithout access
90 years of missed emissionreductions (and development)
90 years of fossil in grid mix?
Time2120
No additional action
Distributed focus
Cost = USD 300/HH
Grid focusCost = USD 3,000/HH
TWh
0
500
1000
1500
2000
2020 20402030
RE Generation (TWh) Total Generation (TWh)Source: McKinsey (2015)
31
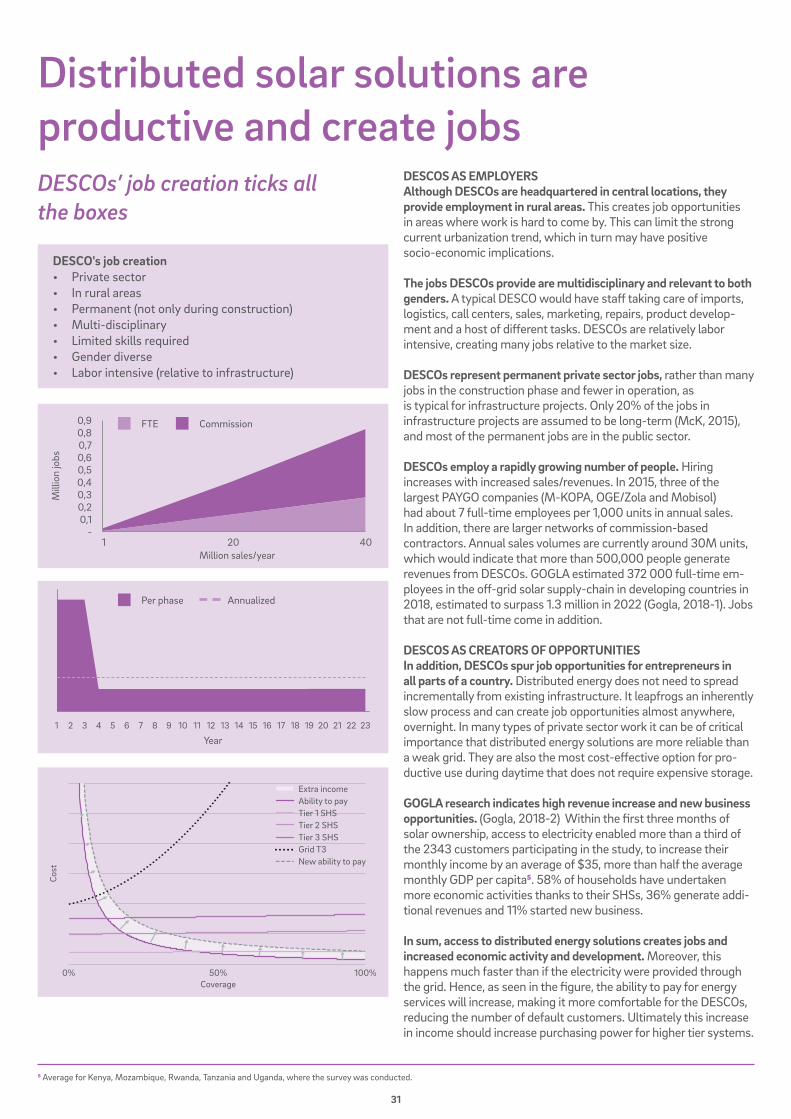
Distributed solar solutions are productive and create jobs
DESCOS AS EMPLOYERSAlthough DESCOs are headquartered in central locations, they provide employment in rural areas. This creates job opportunities in areas where work is hard to come by. This can limit the strong current urbanization trend, which in turn may have positive socio-economic implications.
The jobs DESCOs provide are multidisciplinary and relevant to both genders. A typical DESCO would have staff taking care of imports, logistics, call centers, sales, marketing, repairs, product develop-ment and a host of different tasks. DESCOs are relatively labor intensive, creating many jobs relative to the market size.
DESCOs represent permanent private sector jobs, rather than many jobs in the construction phase and fewer in operation, as is typical for infrastructure projects. Only 20% of the jobs in infrastructure projects are assumed to be long-term (McK, 2015), and most of the permanent jobs are in the public sector.
DESCOs employ a rapidly growing number of people. Hiring increases with increased sales/revenues. In 2015, three of the largest PAYGO companies (M-KOPA, OGE/Zola and Mobisol) had about 7 full-time employees per 1,000 units in annual sales. In addition, there are larger networks of commission-based contractors. Annual sales volumes are currently around 30M units, which would indicate that more than 500,000 people generate revenues from DESCOs. GOGLA estimated 372 000 full-time em-ployees in the off-grid solar supply-chain in developing countries in 2018, estimated to surpass 1.3 million in 2022 (Gogla, 2018-1). Jobs that are not full-time come in addition. DESCOS AS CREATORS OF OPPORTUNITIES In addition, DESCOs spur job opportunities for entrepreneurs in all parts of a country. Distributed energy does not need to spread incrementally from existing infrastructure. It leapfrogs an inherently slow process and can create job opportunities almost anywhere, overnight. In many types of private sector work it can be of critical importance that distributed energy solutions are more reliable than a weak grid. They are also the most cost-effective option for pro-ductive use during daytime that does not require expensive storage.
GOGLA research indicates high revenue increase and new business opportunities. (Gogla, 2018-2) Within the first three months of solar ownership, access to electricity enabled more than a third of the 2343 customers participating in the study, to increase their monthly income by an average of $35, more than half the average monthly GDP per capita5. 58% of households have undertaken more economic activities thanks to their SHSs, 36% generate addi-tional revenues and 11% started new business.
In sum, access to distributed energy solutions creates jobs and increased economic activity and development. Moreover, this happens much faster than if the electricity were provided through the grid. Hence, as seen in the figure, the ability to pay for energy services will increase, making it more comfortable for the DESCOs, reducing the number of default customers. Ultimately this increase in income should increase purchasing power for higher tier systems.
DESCO's job creation• Private sector• In rural areas• Permanent (not only during construction)• Multi-disciplinary• Limited skills required• Gender diverse• Labor intensive (relative to infrastructure)
0,9 FTE Commission
0,7
0,30,4
0,8
0,50,6
0,10,2
-
Mill
ion
jobs
Million sales/year1 20 40
Per phase Annualized
Year2311 2119 2015 16 17 1894 1372 22105 1483 1261
DESCOs’ job creation ticks all the boxes
Cost
0% 50%Coverage
100%
Extra incomeAbility to payTier 1 SHSTier 2 SHSTier 3 SHSGrid T3New ability to pay
5 Average for Kenya, Mozambique, Rwanda, Tanzania and Uganda, where the survey was conducted.
32
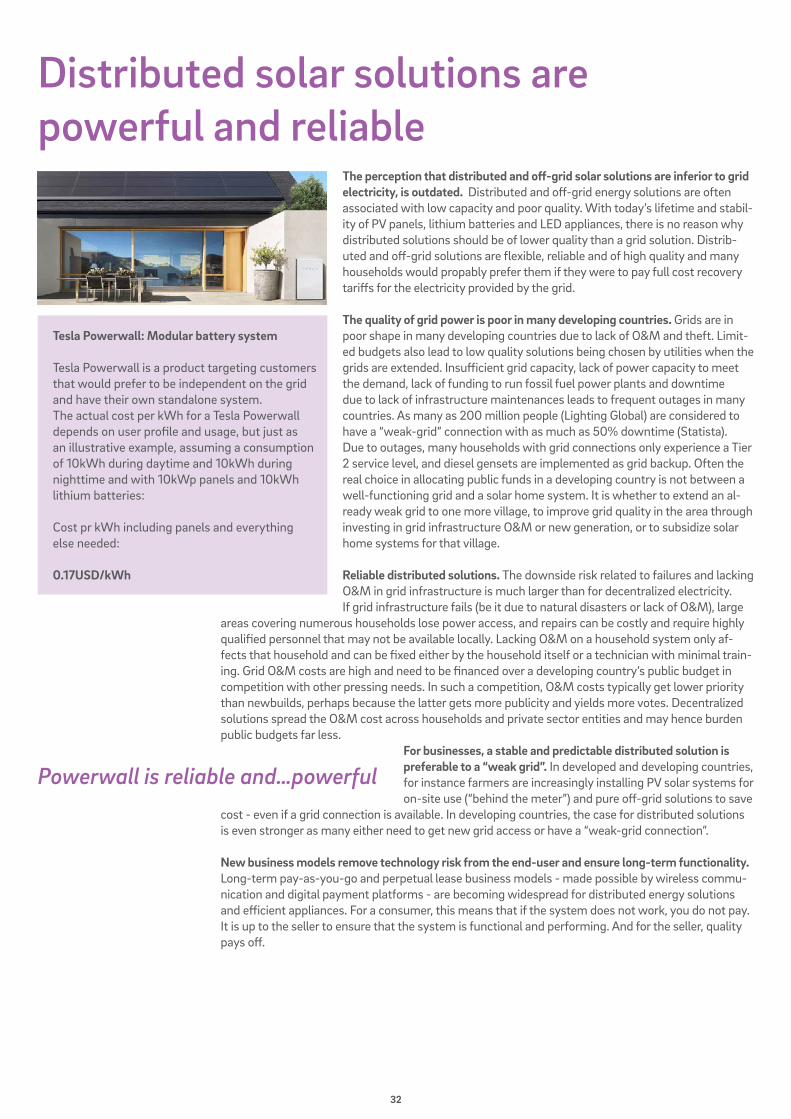
The perception that distributed and off-grid solar solutions are inferior to grid electricity, is outdated. Distributed and off-grid energy solutions are often associated with low capacity and poor quality. With today’s lifetime and stabil-ity of PV panels, lithium batteries and LED appliances, there is no reason why distributed solutions should be of lower quality than a grid solution. Distrib-uted and off-grid solutions are flexible, reliable and of high quality and many households would propably prefer them if they were to pay full cost recovery tariffs for the electricity provided by the grid.
The quality of grid power is poor in many developing countries. Grids are in poor shape in many developing countries due to lack of O&M and theft. Limit-ed budgets also lead to low quality solutions being chosen by utilities when the grids are extended. Insufficient grid capacity, lack of power capacity to meet the demand, lack of funding to run fossil fuel power plants and downtime due to lack of infrastructure maintenances leads to frequent outages in many countries. As many as 200 million people (Lighting Global) are considered to have a “weak-grid” connection with as much as 50% downtime (Statista). Due to outages, many households with grid connections only experience a Tier 2 service level, and diesel gensets are implemented as grid backup. Often the real choice in allocating public funds in a developing country is not between a well-functioning grid and a solar home system. It is whether to extend an al-ready weak grid to one more village, to improve grid quality in the area through investing in grid infrastructure O&M or new generation, or to subsidize solar home systems for that village.
Reliable distributed solutions. The downside risk related to failures and lacking O&M in grid infrastructure is much larger than for decentralized electricity. If grid infrastructure fails (be it due to natural disasters or lack of O&M), large
areas covering numerous households lose power access, and repairs can be costly and require highly qualified personnel that may not be available locally. Lacking O&M on a household system only af-fects that household and can be fixed either by the household itself or a technician with minimal train-ing. Grid O&M costs are high and need to be financed over a developing country’s public budget in competition with other pressing needs. In such a competition, O&M costs typically get lower priority than newbuilds, perhaps because the latter gets more publicity and yields more votes. Decentralized solutions spread the O&M cost across households and private sector entities and may hence burden public budgets far less.
For businesses, a stable and predictable distributed solution is preferable to a “weak grid”. In developed and developing countries, for instance farmers are increasingly installing PV solar systems for on-site use (“behind the meter”) and pure off-grid solutions to save
cost - even if a grid connection is available. In developing countries, the case for distributed solutions is even stronger as many either need to get new grid access or have a “weak-grid connection”.
New business models remove technology risk from the end-user and ensure long-term functionality. Long-term pay-as-you-go and perpetual lease business models - made possible by wireless commu-nication and digital payment platforms - are becoming widespread for distributed energy solutions and efficient appliances. For a consumer, this means that if the system does not work, you do not pay. It is up to the seller to ensure that the system is functional and performing. And for the seller, quality pays off.
Distributed solar solutions are powerful and reliable
Tesla Powerwall: Modular battery system
Tesla Powerwall is a product targeting customers that would prefer to be independent on the grid and have their own standalone system. The actual cost per kWh for a Tesla Powerwall depends on user profile and usage, but just as an illustrative example, assuming a consumption of 10kWh during daytime and 10kWh during nighttime and with 10kWp panels and 10kWh lithium batteries:
Cost pr kWh including panels and everything else needed:
0.17USD/kWh
Powerwall is reliable and…powerful
33
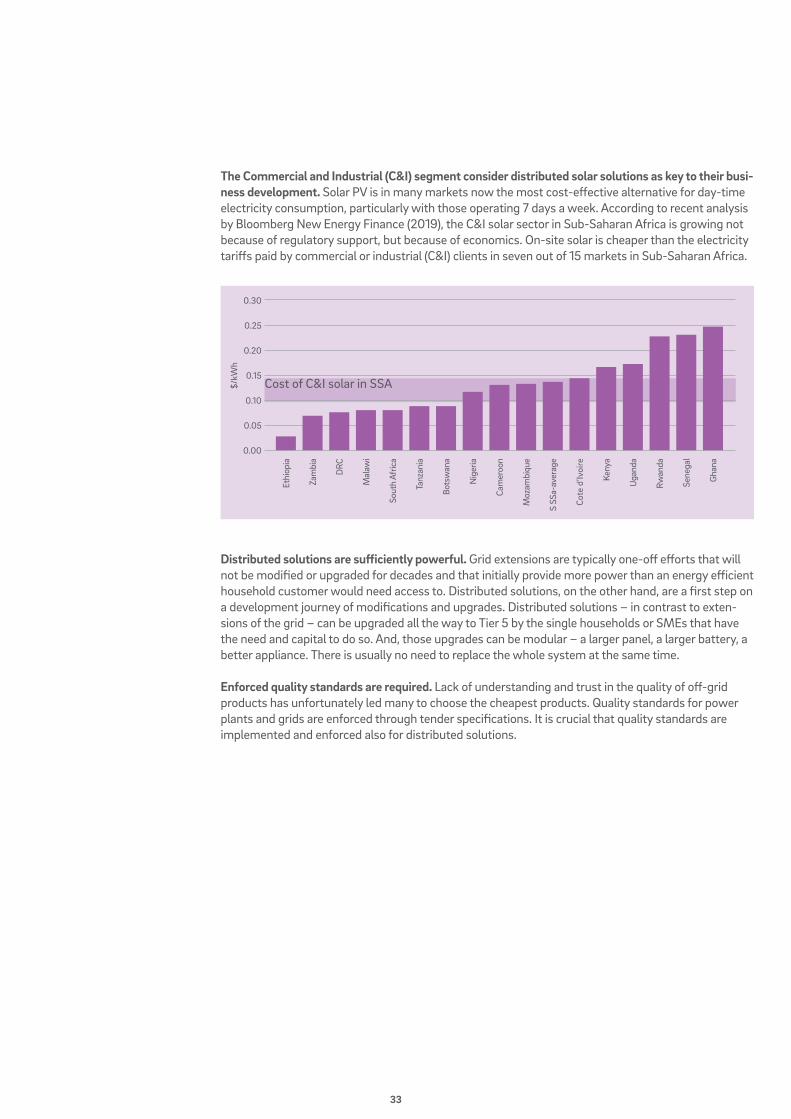
The Commercial and Industrial (C&I) segment consider distributed solar solutions as key to their busi-ness development. Solar PV is in many markets now the most cost-effective alternative for day-time electricity consumption, particularly with those operating 7 days a week. According to recent analysis by Bloomberg New Energy Finance (2019), the C&I solar sector in Sub-Saharan Africa is growing not because of regulatory support, but because of economics. On-site solar is cheaper than the electricity tariffs paid by commercial or industrial (C&I) clients in seven out of 15 markets in Sub-Saharan Africa.
Distributed solutions are sufficiently powerful. Grid extensions are typically one-off efforts that will not be modified or upgraded for decades and that initially provide more power than an energy efficient household customer would need access to. Distributed solutions, on the other hand, are a first step on a development journey of modifications and upgrades. Distributed solutions – in contrast to exten-sions of the grid – can be upgraded all the way to Tier 5 by the single households or SMEs that have the need and capital to do so. And, those upgrades can be modular – a larger panel, a larger battery, a better appliance. There is usually no need to replace the whole system at the same time.
Enforced quality standards are required. Lack of understanding and trust in the quality of off-grid products has unfortunately led many to choose the cheapest products. Quality standards for power plants and grids are enforced through tender specifications. It is crucial that quality standards are implemented and enforced also for distributed solutions.
Cost of C&I solar in SSA
0.00
0.05
0.10
0.15
0.20
0.25
0.30
Ethi
opia
Zam
bia
Mal
awi
Tanz
ania
Nig
eria
Moz
ambi
que
Cote
d’Iv
oire
Uga
nda
Sene
gal
DRC
Sout
h Af
rica
Bots
wan
a
Cam
eroo
n
S SS
a-av
erag
e
Keny
a
Rwan
da
Gha
na
$/kW
h
34
Distributed solar solutions are permanent
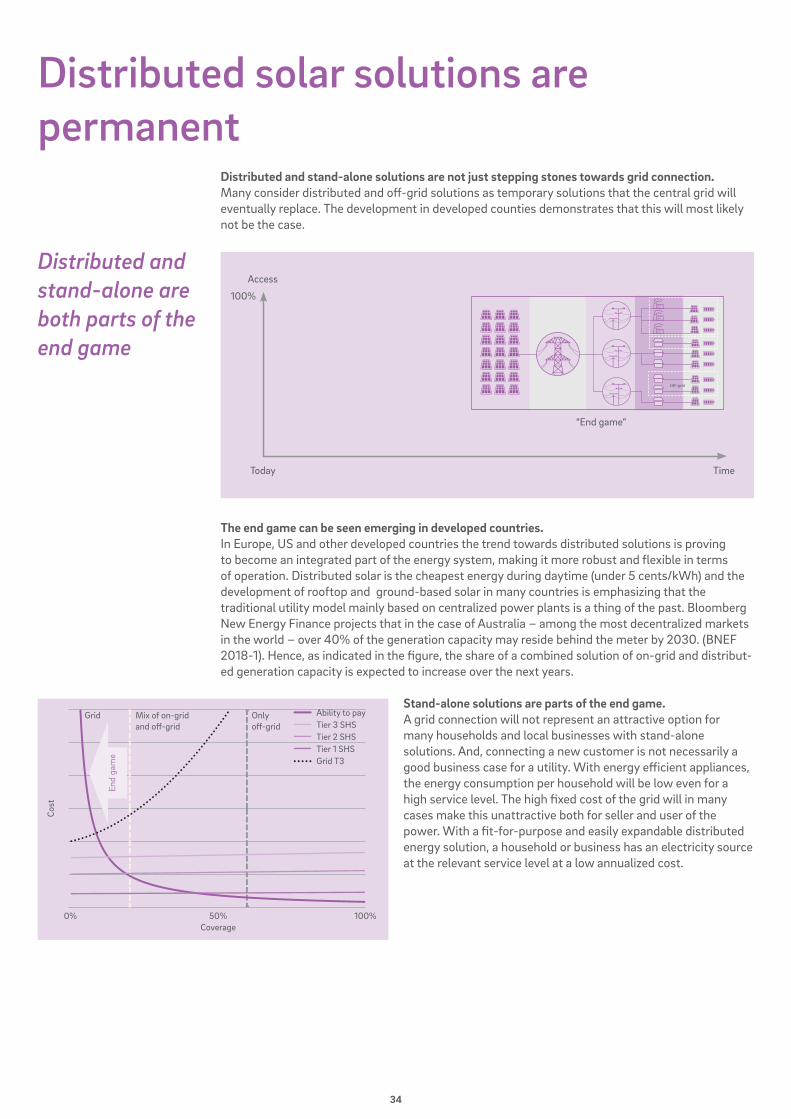
Distributed and stand-alone solutions are not just stepping stones towards grid connection. Many consider distributed and off-grid solutions as temporary solutions that the central grid will eventually replace. The development in developed counties demonstrates that this will most likely not be the case.
The end game can be seen emerging in developed countries. In Europe, US and other developed countries the trend towards distributed solutions is proving to become an integrated part of the energy system, making it more robust and flexible in terms of operation. Distributed solar is the cheapest energy during daytime (under 5 cents/kWh) and the development of rooftop and ground-based solar in many countries is emphasizing that the traditional utility model mainly based on centralized power plants is a thing of the past. Bloomberg New Energy Finance projects that in the case of Australia – among the most decentralized markets in the world – over 40% of the generation capacity may reside behind the meter by 2030. (BNEF 2018-1). Hence, as indicated in the figure, the share of a combined solution of on-grid and distribut-ed generation capacity is expected to increase over the next years.
Stand-alone solutions are parts of the end game. A grid connection will not represent an attractive option for many households and local businesses with stand-alone solutions. And, connecting a new customer is not necessarily a good business case for a utility. With energy efficient appliances, the energy consumption per household will be low even for a high service level. The high fixed cost of the grid will in many cases make this unattractive both for seller and user of the power. With a fit-for-purpose and easily expandable distributed energy solution, a household or business has an electricity source at the relevant service level at a low annualized cost.
Distributed and stand-alone are both parts of the end game
Today
“End game”
Access
100%
Time
Cost
Grid Mix of on-grid and off-grid
Only off-grid
50%Coverage
100%0%
Ability to payTier 3 SHSTier 2 SHSTier 1 SHSGrid T3
End
gam
e
35
INVESTING IN THE DISTRIBUTED SOLAR VALUE CHAIN
WHAT MAKES THESE INVESTMENTS ATTRACTIVE? AND WHAT ARE THE RISKS?
36
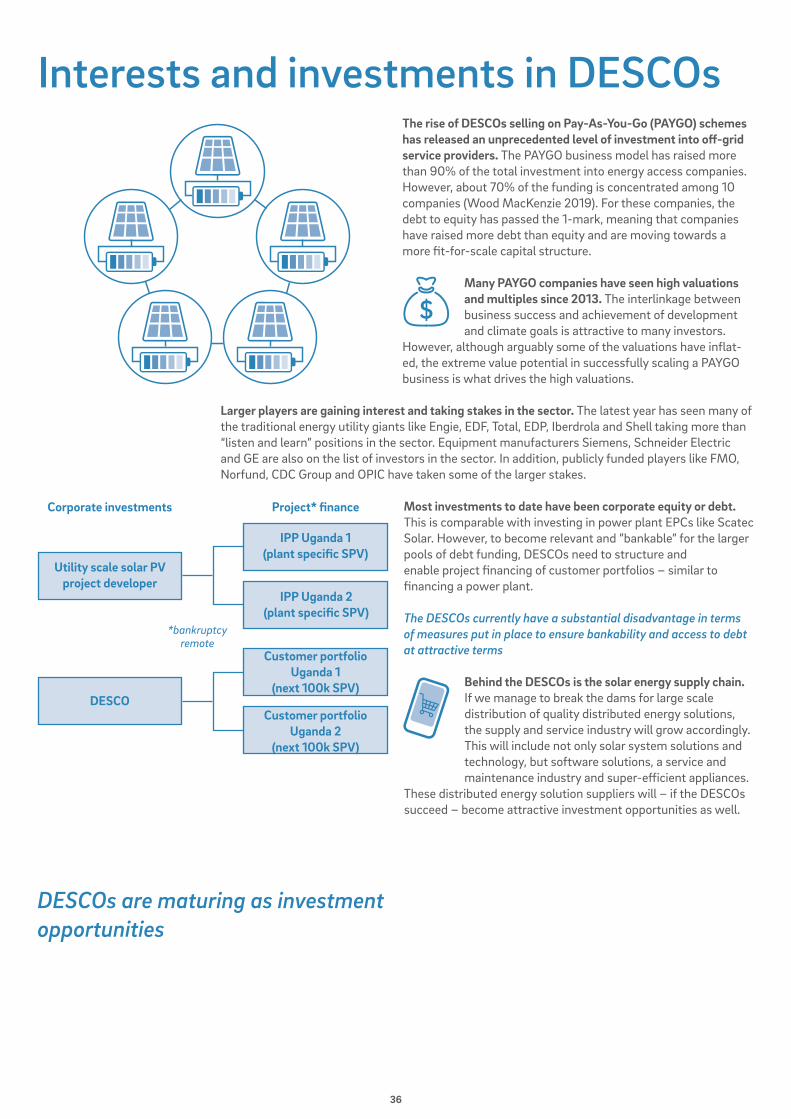
Interests and investments in DESCOsThe rise of DESCOs selling on Pay-As-You-Go (PAYGO) schemes has released an unprecedented level of investment into off-grid service providers. The PAYGO business model has raised more than 90% of the total investment into energy access companies. However, about 70% of the funding is concentrated among 10 companies (Wood MacKenzie 2019). For these companies, the debt to equity has passed the 1-mark, meaning that companies have raised more debt than equity and are moving towards a more fit-for-scale capital structure.
Many PAYGO companies have seen high valuations and multiples since 2013. The interlinkage between business success and achievement of development and climate goals is attractive to many investors.
However, although arguably some of the valuations have inflat-ed, the extreme value potential in successfully scaling a PAYGO business is what drives the high valuations.
Larger players are gaining interest and taking stakes in the sector. The latest year has seen many of the traditional energy utility giants like Engie, EDF, Total, EDP, Iberdrola and Shell taking more than “listen and learn” positions in the sector. Equipment manufacturers Siemens, Schneider Electric and GE are also on the list of investors in the sector. In addition, publicly funded players like FMO, Norfund, CDC Group and OPIC have taken some of the larger stakes.
Most investments to date have been corporate equity or debt. This is comparable with investing in power plant EPCs like Scatec Solar. However, to become relevant and ”bankable” for the larger pools of debt funding, DESCOs need to structure and enable project financing of customer portfolios – similar to financing a power plant.
The DESCOs currently have a substantial disadvantage in terms of measures put in place to ensure bankability and access to debt at attractive terms
Behind the DESCOs is the solar energy supply chain. If we manage to break the dams for large scale distribution of quality distributed energy solutions, the supply and service industry will grow accordingly. This will include not only solar system solutions and technology, but software solutions, a service and maintenance industry and super-efficient appliances.
These distributed energy solution suppliers will – if the DESCOs succeed – become attractive investment opportunities as well.
Utility scale solar PVproject developer
Corporate investments
*bankruptcyremote
Project* finance
IPP Uganda 2(plant specific SPV)
Customer portfolioUganda 1
(next 100k SPV)
Customer portfolioUganda 2
(next 100k SPV)
DESCO
IPP Uganda 1(plant specific SPV)
DESCOs are maturing as investment opportunities
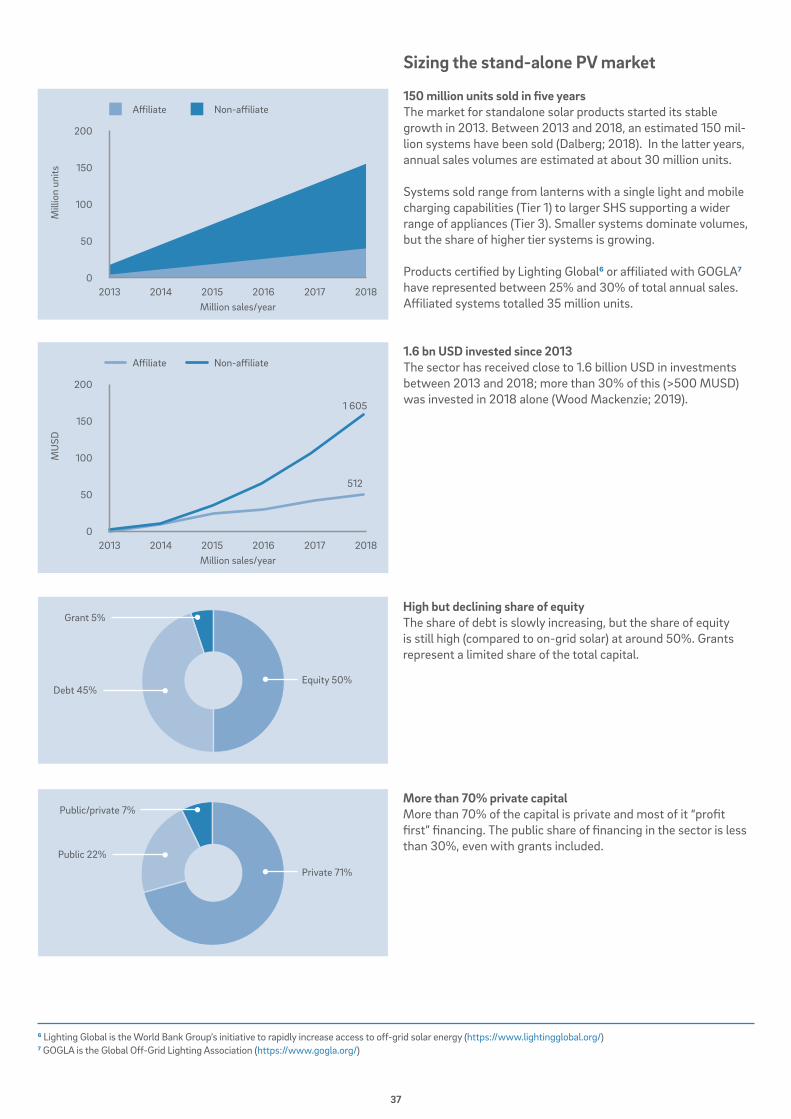
37
Sizing the stand-alone PV market
150 million units sold in five years The market for standalone solar products started its stable growth in 2013. Between 2013 and 2018, an estimated 150 mil-lion systems have been sold (Dalberg; 2018). In the latter years, annual sales volumes are estimated at about 30 million units.
Systems sold range from lanterns with a single light and mobile charging capabilities (Tier 1) to larger SHS supporting a wider range of appliances (Tier 3). Smaller systems dominate volumes, but the share of higher tier systems is growing. Products certified by Lighting Global6 or affiliated with GOGLA7 have represented between 25% and 30% of total annual sales. Affiliated systems totalled 35 million units.
1.6 bn USD invested since 2013The sector has received close to 1.6 billion USD in investments between 2013 and 2018; more than 30% of this (>500 MUSD) was invested in 2018 alone (Wood Mackenzie; 2019).
High but declining share of equityThe share of debt is slowly increasing, but the share of equity is still high (compared to on-grid solar) at around 50%. Grants represent a limited share of the total capital.
More than 70% private capitalMore than 70% of the capital is private and most of it “profit first” financing. The public share of financing in the sector is less than 30%, even with grants included.
6 Lighting Global is the World Bank Group’s initiative to rapidly increase access to off-grid solar energy (https://www.lightingglobal.org/)7 GOGLA is the Global Off-Grid Lighting Association (https://www.gogla.org/)
Affiliate Non-affiliate
100
200
150
50
0
Mill
ion
units
Million sales/year2013 2014 2015 2016 2017 2018
Affiliate Non-affiliate
100
200
150
50
0
MU
SD
Million sales/year2013 2014 2015 2016 2017
512
1 605
2018
Grant 5%
Debt 45%Equity 50%
Public/private 7%
Public 22%
Private 71%
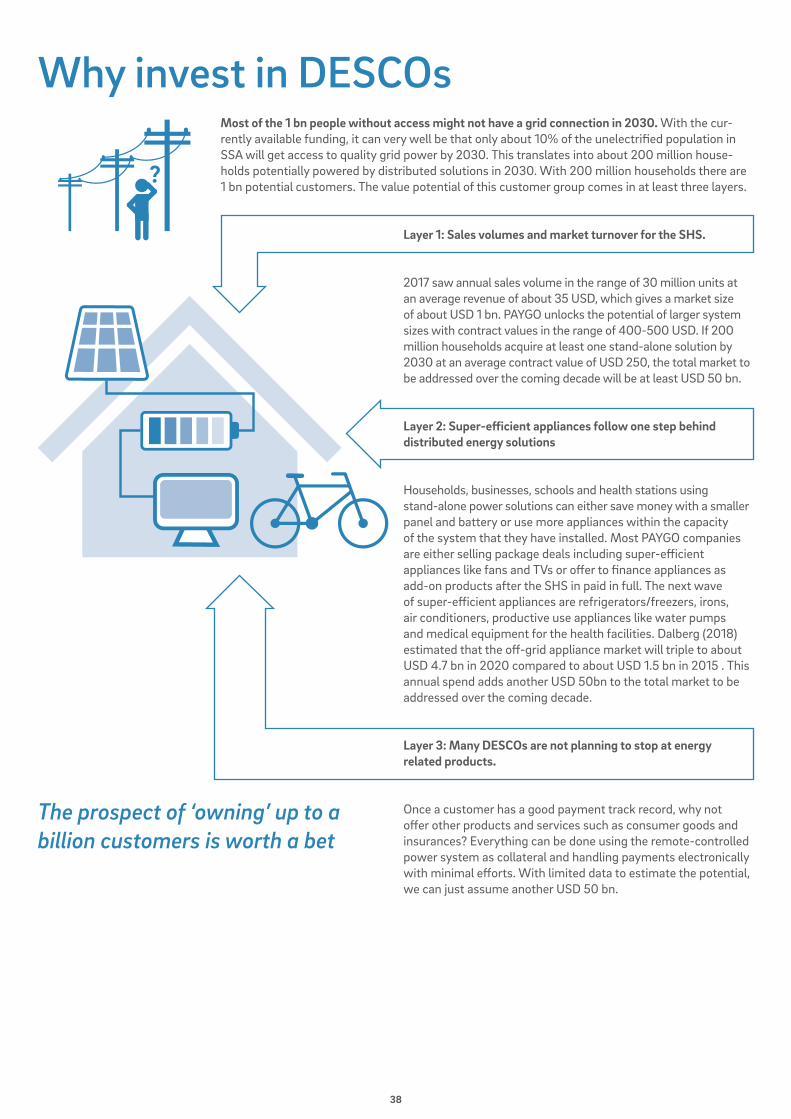
38
Why invest in DESCOsMost of the 1 bn people without access might not have a grid connection in 2030. With the cur-rently available funding, it can very well be that only about 10% of the unelectrified population in SSA will get access to quality grid power by 2030. This translates into about 200 million house-holds potentially powered by distributed solutions in 2030. With 200 million households there are 1 bn potential customers. The value potential of this customer group comes in at least three layers.
Layer 1: Sales volumes and market turnover for the SHS.
2017 saw annual sales volume in the range of 30 million units at an average revenue of about 35 USD, which gives a market size of about USD 1 bn. PAYGO unlocks the potential of larger system sizes with contract values in the range of 400-500 USD. If 200 million households acquire at least one stand-alone solution by 2030 at an average contract value of USD 250, the total market to be addressed over the coming decade will be at least USD 50 bn.
Layer 2: Super-efficient appliances follow one step behind distributed energy solutions
Households, businesses, schools and health stations using stand-alone power solutions can either save money with a smaller panel and battery or use more appliances within the capacity of the system that they have installed. Most PAYGO companies are either selling package deals including super-efficient appliances like fans and TVs or offer to finance appliances as add-on products after the SHS in paid in full. The next wave of super-efficient appliances are refrigerators/freezers, irons, air conditioners, productive use appliances like water pumps and medical equipment for the health facilities. Dalberg (2018)estimated that the off-grid appliance market will triple to about USD 4.7 bn in 2020 compared to about USD 1.5 bn in 2015 . This annual spend adds another USD 50bn to the total market to be addressed over the coming decade.
Layer 3: Many DESCOs are not planning to stop at energy related products.
Once a customer has a good payment track record, why not offer other products and services such as consumer goods and insurances? Everything can be done using the remote-controlled power system as collateral and handling payments electronically with minimal efforts. With limited data to estimate the potential, we can just assume another USD 50 bn.
The prospect of ‘owning’ up to a billion customers is worth a bet
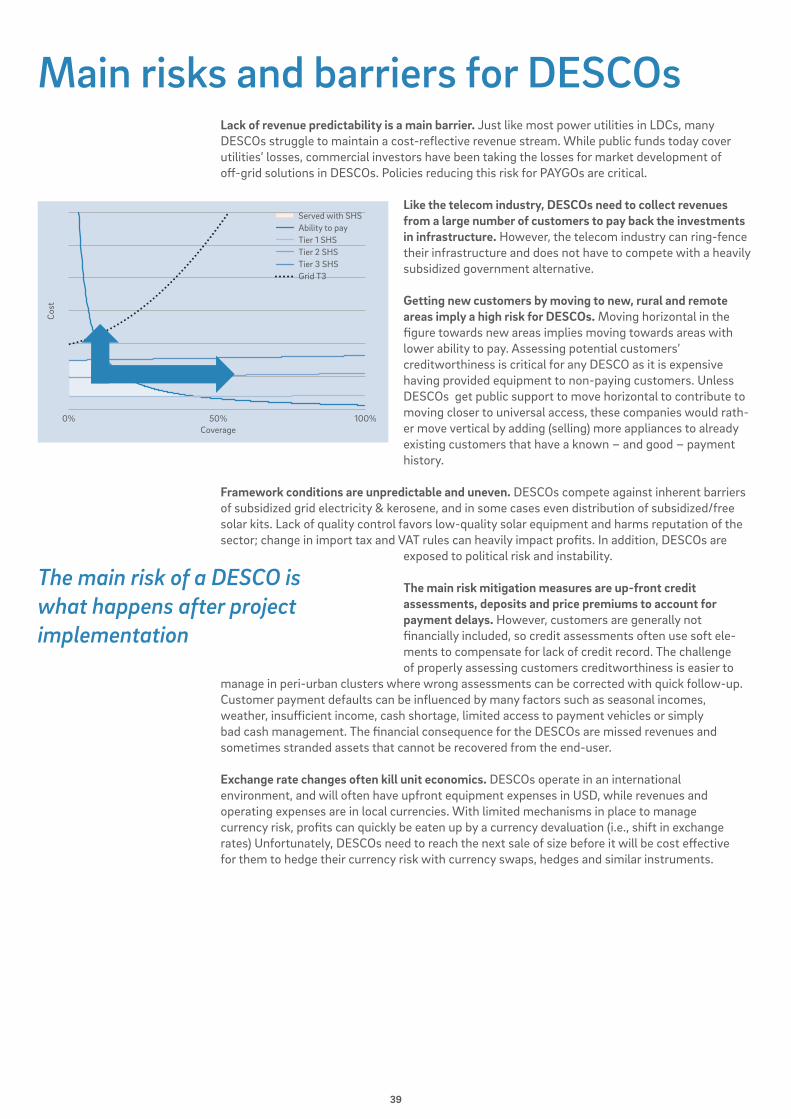
39
Main risks and barriers for DESCOsLack of revenue predictability is a main barrier. Just like most power utilities in LDCs, many DESCOs struggle to maintain a cost-reflective revenue stream. While public funds today cover utilities’ losses, commercial investors have been taking the losses for market development of off-grid solutions in DESCOs. Policies reducing this risk for PAYGOs are critical.
Like the telecom industry, DESCOs need to collect revenues from a large number of customers to pay back the investments in infrastructure. However, the telecom industry can ring-fence their infrastructure and does not have to compete with a heavily subsidized government alternative.
Getting new customers by moving to new, rural and remote areas imply a high risk for DESCOs. Moving horizontal in the figure towards new areas implies moving towards areas with lower ability to pay. Assessing potential customers’ creditworthiness is critical for any DESCO as it is expensive having provided equipment to non-paying customers. Unless DESCOs get public support to move horizontal to contribute to moving closer to universal access, these companies would rath-er move vertical by adding (selling) more appliances to already existing customers that have a known – and good – payment history.
Framework conditions are unpredictable and uneven. DESCOs compete against inherent barriers of subsidized grid electricity & kerosene, and in some cases even distribution of subsidized/free solar kits. Lack of quality control favors low-quality solar equipment and harms reputation of the sector; change in import tax and VAT rules can heavily impact profits. In addition, DESCOs are
exposed to political risk and instability.
The main risk mitigation measures are up-front credit assessments, deposits and price premiums to account for payment delays. However, customers are generally not financially included, so credit assessments often use soft ele-ments to compensate for lack of credit record. The challenge of properly assessing customers creditworthiness is easier to
manage in peri-urban clusters where wrong assessments can be corrected with quick follow-up. Customer payment defaults can be influenced by many factors such as seasonal incomes, weather, insufficient income, cash shortage, limited access to payment vehicles or simply bad cash management. The financial consequence for the DESCOs are missed revenues and sometimes stranded assets that cannot be recovered from the end-user.
Exchange rate changes often kill unit economics. DESCOs operate in an international environment, and will often have upfront equipment expenses in USD, while revenues and operating expenses are in local currencies. With limited mechanisms in place to manage currency risk, profits can quickly be eaten up by a currency devaluation (i.e., shift in exchange rates) Unfortunately, DESCOs need to reach the next sale of size before it will be cost effective for them to hedge their currency risk with currency swaps, hedges and similar instruments.
The main risk of a DESCO is what happens after project implementation
Cost
0% 50%Coverage
100%
Served with SHSAbility to payTier 1 SHSTier 2 SHSTier 3 SHSGrid T3
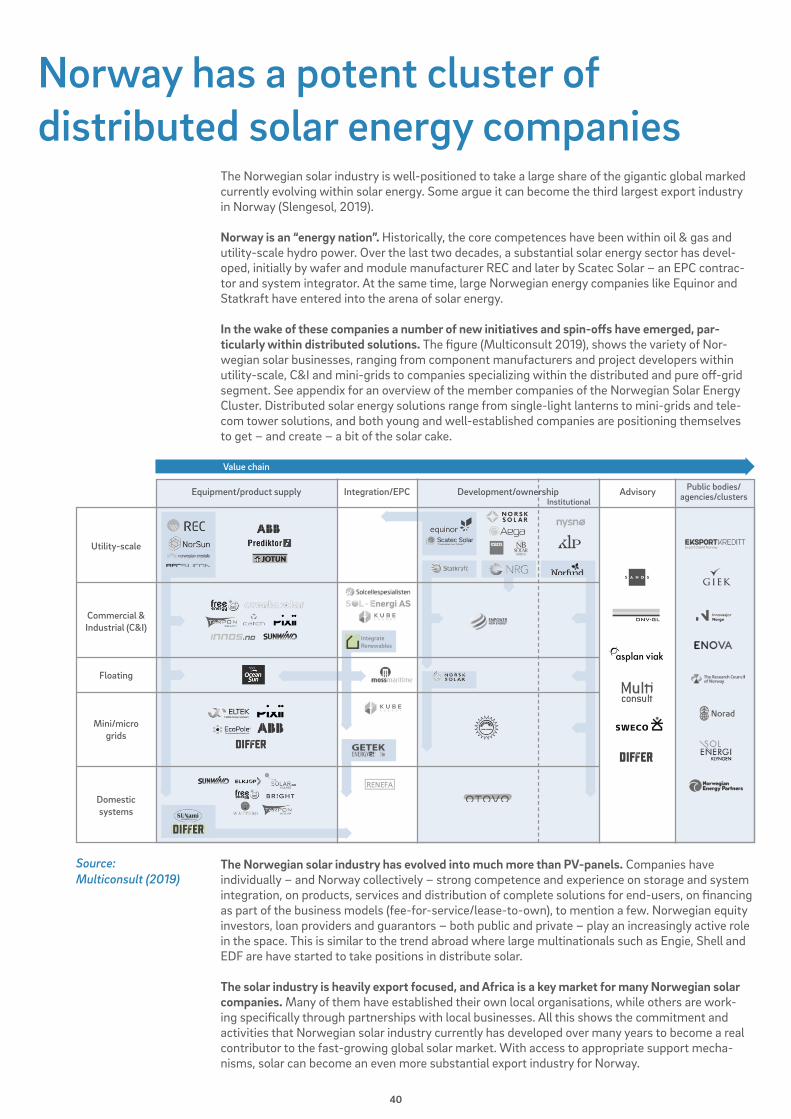
40
Norway has a potent cluster of distributed solar energy companies
The Norwegian solar industry is well-positioned to take a large share of the gigantic global marked currently evolving within solar energy. Some argue it can become the third largest export industry in Norway (Slengesol, 2019).
Norway is an “energy nation”. Historically, the core competences have been within oil & gas and utility-scale hydro power. Over the last two decades, a substantial solar energy sector has devel-oped, initially by wafer and module manufacturer REC and later by Scatec Solar – an EPC contrac-tor and system integrator. At the same time, large Norwegian energy companies like Equinor and Statkraft have entered into the arena of solar energy.
In the wake of these companies a number of new initiatives and spin-offs have emerged, par-ticularly within distributed solutions. The figure (Multiconsult 2019), shows the variety of Nor-wegian solar businesses, ranging from component manufacturers and project developers within utility-scale, C&I and mini-grids to companies specializing within the distributed and pure off-grid segment. See appendix for an overview of the member companies of the Norwegian Solar Energy Cluster. Distributed solar energy solutions range from single-light lanterns to mini-grids and tele-com tower solutions, and both young and well-established companies are positioning themselves to get – and create – a bit of the solar cake.
The Norwegian solar industry has evolved into much more than PV-panels. Companies have individually – and Norway collectively – strong competence and experience on storage and system integration, on products, services and distribution of complete solutions for end-users, on financing as part of the business models (fee-for-service/lease-to-own), to mention a few. Norwegian equity investors, loan providers and guarantors – both public and private – play an increasingly active role in the space. This is similar to the trend abroad where large multinationals such as Engie, Shell and EDF are have started to take positions in distribute solar. The solar industry is heavily export focused, and Africa is a key market for many Norwegian solar companies. Many of them have established their own local organisations, while others are work-ing specifically through partnerships with local businesses. All this shows the commitment and activities that Norwegian solar industry currently has developed over many years to become a real contributor to the fast-growing global solar market. With access to appropriate support mecha-nisms, solar can become an even more substantial export industry for Norway.
Utility-scale
Equipment/product supply
Value chain
Integration/EPC Development/ownershipInstitutional
Advisory Public bodies/agencies/clusters
Commercial &Industrial (C&I)
Floating
Mini/micro grids
Domestic systems
Source: Multiconsult (2019)
41
CONTEXT: Several perspectives impact the strategy
DEVISING A STRATEGY FOR UNIVERSAL ELECTRICITY ACCESS
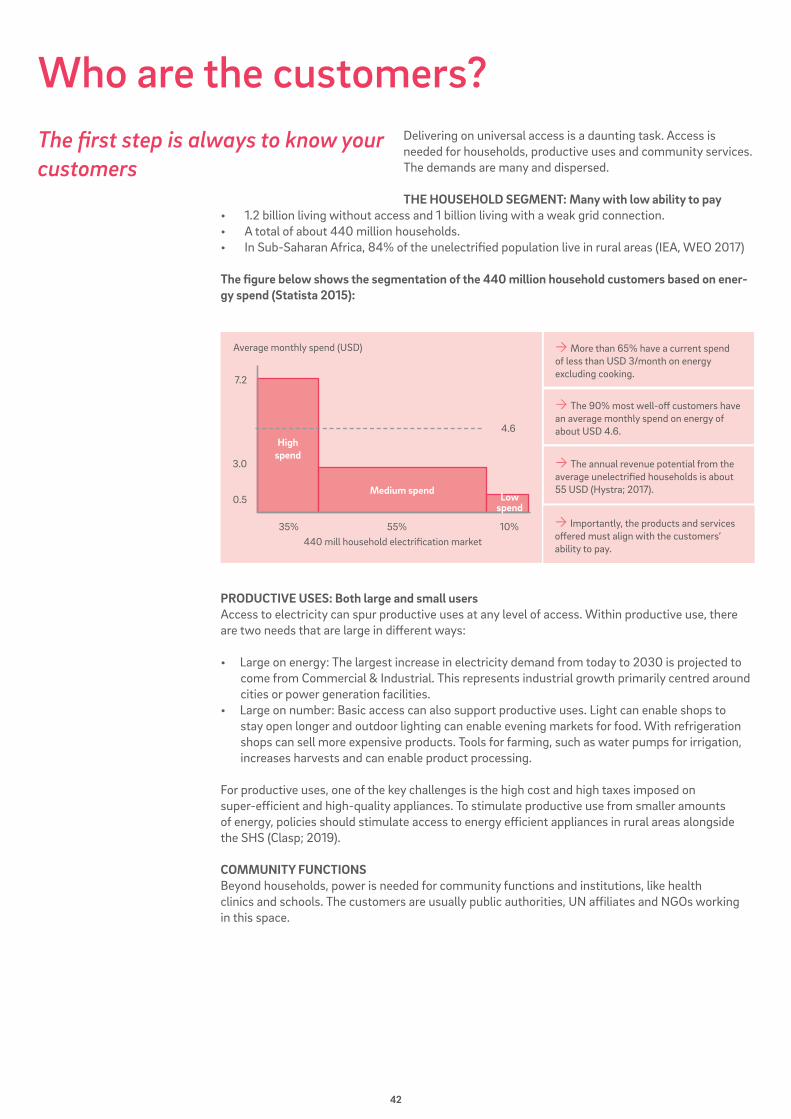
42
Who are the customers?Delivering on universal access is a daunting task. Access is needed for households, productive uses and community services. The demands are many and dispersed.
THE HOUSEHOLD SEGMENT: Many with low ability to pay• 1.2 billion living without access and 1 billion living with a weak grid connection. • A total of about 440 million households.• In Sub-Saharan Africa, 84% of the unelectrified population live in rural areas (IEA, WEO 2017)
The figure below shows the segmentation of the 440 million household customers based on ener-gy spend (Statista 2015):
PRODUCTIVE USES: Both large and small usersAccess to electricity can spur productive uses at any level of access. Within productive use, there are two needs that are large in different ways:
• Large on energy: The largest increase in electricity demand from today to 2030 is projected to come from Commercial & Industrial. This represents industrial growth primarily centred around cities or power generation facilities. • Large on number: Basic access can also support productive uses. Light can enable shops to stay open longer and outdoor lighting can enable evening markets for food. With refrigeration shops can sell more expensive products. Tools for farming, such as water pumps for irrigation, increases harvests and can enable product processing.
For productive uses, one of the key challenges is the high cost and high taxes imposed on super-efficient and high-quality appliances. To stimulate productive use from smaller amounts of energy, policies should stimulate access to energy efficient appliances in rural areas alongside the SHS (Clasp; 2019).
COMMUNITY FUNCTIONSBeyond households, power is needed for community functions and institutions, like health clinics and schools. The customers are usually public authorities, UN affiliates and NGOs working in this space.
The first step is always to know your customers
7.2
3.0
0.5
440 mill household electrification market
Average monthly spend (USD)
35% 55% 10%
4.6High
spend
Low spend
Medium spend
More than 65% have a current spend of less than USD 3/month on energy excluding cooking.
The 90% most well-off customers have an average monthly spend on energy of about USD 4.6.
Importantly, the products and services offered must align with the customers’ ability to pay.
Importantly, the products and services offered must align with the customers’ ability to pay.
Importantly, the products and services offered must align with the customers’ ability to pay.
The annual revenue potential from the average unelectrified households is about 55 USD (Hystra; 2017).
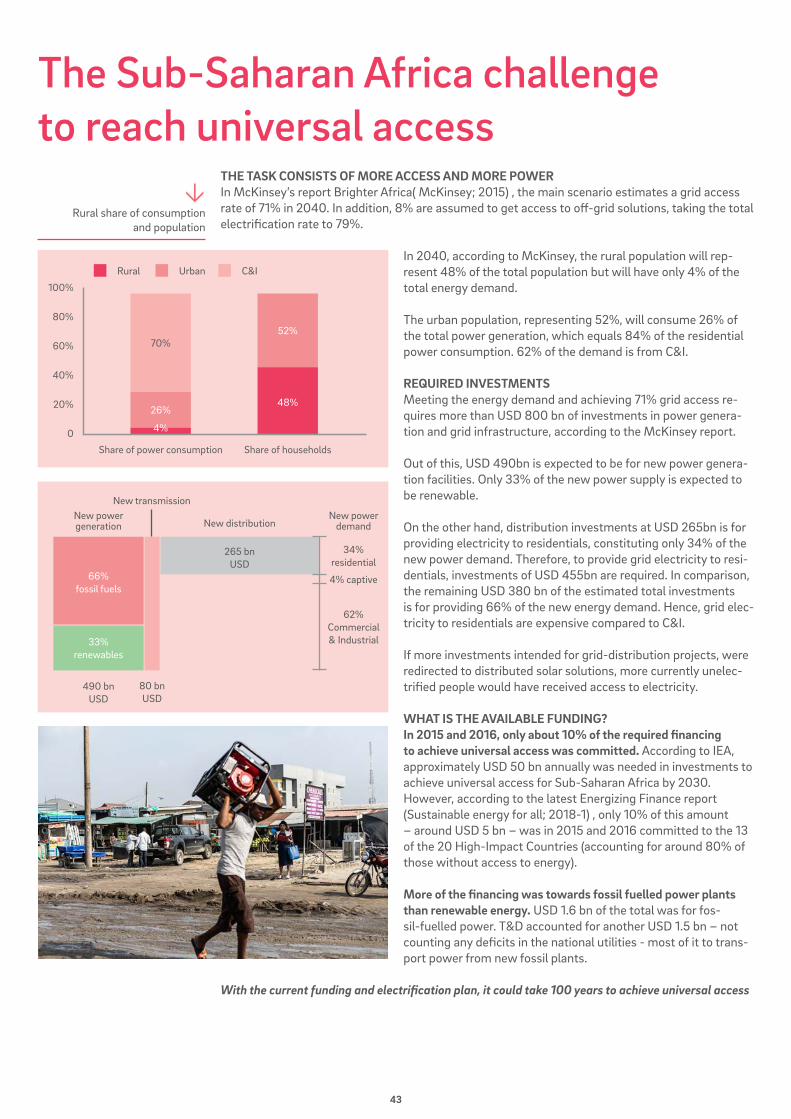
43
The Sub-Saharan Africa challenge to reach universal access
THE TASK CONSISTS OF MORE ACCESS AND MORE POWERIn McKinsey’s report Brighter Africa( McKinsey; 2015) , the main scenario estimates a grid access rate of 71% in 2040. In addition, 8% are assumed to get access to off-grid solutions, taking the total electrification rate to 79%.
In 2040, according to McKinsey, the rural population will rep-resent 48% of the total population but will have only 4% of the total energy demand.
The urban population, representing 52%, will consume 26% of the total power generation, which equals 84% of the residential power consumption. 62% of the demand is from C&I.
REQUIRED INVESTMENTSMeeting the energy demand and achieving 71% grid access re-quires more than USD 800 bn of investments in power genera-tion and grid infrastructure, according to the McKinsey report.
Out of this, USD 490bn is expected to be for new power genera-tion facilities. Only 33% of the new power supply is expected to be renewable.
On the other hand, distribution investments at USD 265bn is for providing electricity to residentials, constituting only 34% of the new power demand. Therefore, to provide grid electricity to resi-dentials, investments of USD 455bn are required. In comparison, the remaining USD 380 bn of the estimated total investments is for providing 66% of the new energy demand. Hence, grid elec-tricity to residentials are expensive compared to C&I.
If more investments intended for grid-distribution projects, were redirected to distributed solar solutions, more currently unelec-trified people would have received access to electricity.
WHAT IS THE AVAILABLE FUNDING?In 2015 and 2016, only about 10% of the required financing to achieve universal access was committed. According to IEA, approximately USD 50 bn annually was needed in investments to achieve universal access for Sub-Saharan Africa by 2030. However, according to the latest Energizing Finance report (Sustainable energy for all; 2018-1) , only 10% of this amount – around USD 5 bn – was in 2015 and 2016 committed to the 13 of the 20 High-Impact Countries (accounting for around 80% of those without access to energy).
More of the financing was towards fossil fuelled power plants than renewable energy. USD 1.6 bn of the total was for fos-sil-fuelled power. T&D accounted for another USD 1.5 bn – not counting any deficits in the national utilities - most of it to trans-port power from new fossil plants.
With the current funding and electrification plan, it could take 100 years to achieve universal access
100%
20%
40%
60%
80%
0
Share of power consumption Share of households
Rural Urban C&I
70%
26%48%
52%
4%
New transmission
490 bn USD
80 bn USD
265 bn USD
New distributionNew power generation
33%renewables
66%fossil fuels
34%residential
4% captive
62%Commercial& Industrial
New powerdemand
Rural share of consumption
and population
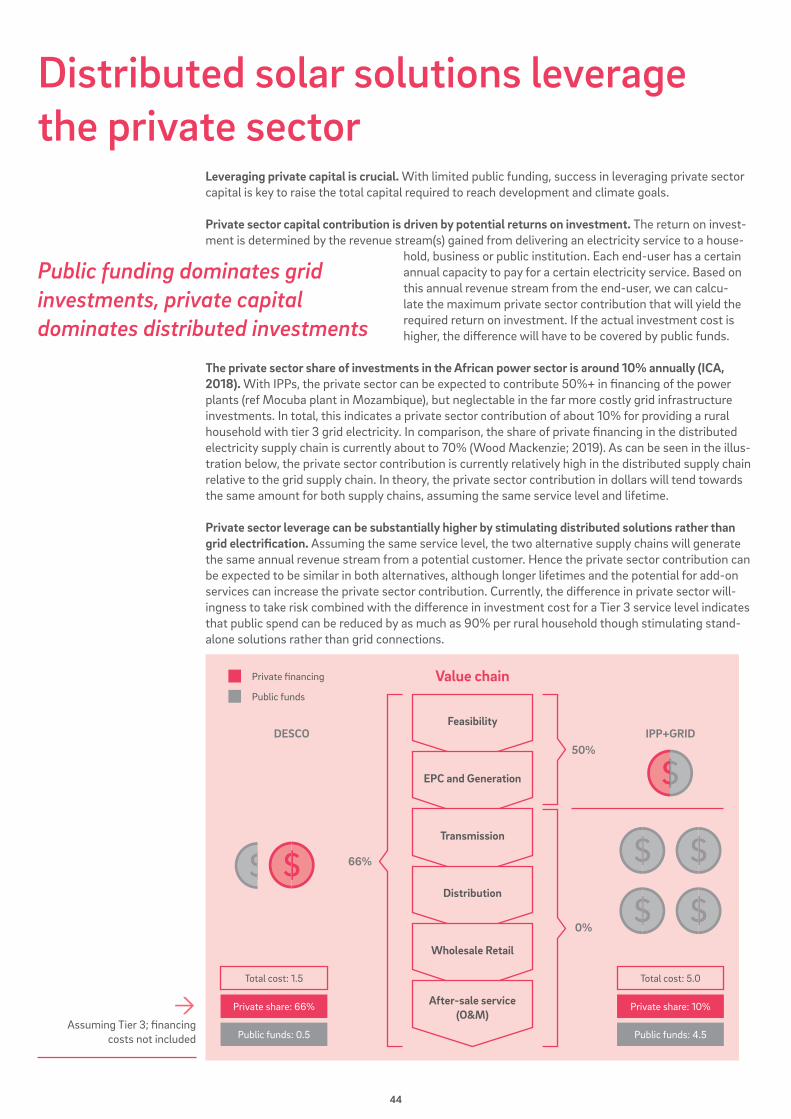
44
Distributed solar solutions leverage the private sector
Leveraging private capital is crucial. With limited public funding, success in leveraging private sector capital is key to raise the total capital required to reach development and climate goals.
Private sector capital contribution is driven by potential returns on investment. The return on invest-ment is determined by the revenue stream(s) gained from delivering an electricity service to a house-
hold, business or public institution. Each end-user has a certain annual capacity to pay for a certain electricity service. Based on this annual revenue stream from the end-user, we can calcu-late the maximum private sector contribution that will yield the required return on investment. If the actual investment cost is higher, the difference will have to be covered by public funds.
The private sector share of investments in the African power sector is around 10% annually (ICA, 2018). With IPPs, the private sector can be expected to contribute 50%+ in financing of the power plants (ref Mocuba plant in Mozambique), but neglectable in the far more costly grid infrastructure investments. In total, this indicates a private sector contribution of about 10% for providing a rural household with tier 3 grid electricity. In comparison, the share of private financing in the distributed electricity supply chain is currently about to 70% (Wood Mackenzie; 2019). As can be seen in the illus-tration below, the private sector contribution is currently relatively high in the distributed supply chain relative to the grid supply chain. In theory, the private sector contribution in dollars will tend towards the same amount for both supply chains, assuming the same service level and lifetime.
Private sector leverage can be substantially higher by stimulating distributed solutions rather than grid electrification. Assuming the same service level, the two alternative supply chains will generate the same annual revenue stream from a potential customer. Hence the private sector contribution can be expected to be similar in both alternatives, although longer lifetimes and the potential for add-on services can increase the private sector contribution. Currently, the difference in private sector will-ingness to take risk combined with the difference in investment cost for a Tier 3 service level indicates that public spend can be reduced by as much as 90% per rural household though stimulating stand-alone solutions rather than grid connections.
Public funding dominates grid investments, private capital dominates distributed investments
Assuming Tier 3; financing
costs not included
Feasibility
EPC and Generation
Transmission
Distribution
Wholesale Retail
After-sale service(O&M)
50%IPP+GRIDDESCO
0%
66%
Value chain
Private share: 10%
Total cost: 5.0
Public funds: 4.5
Private share: 66%
Total cost: 1.5
Public funds: 0.5
Private financing
Public funds
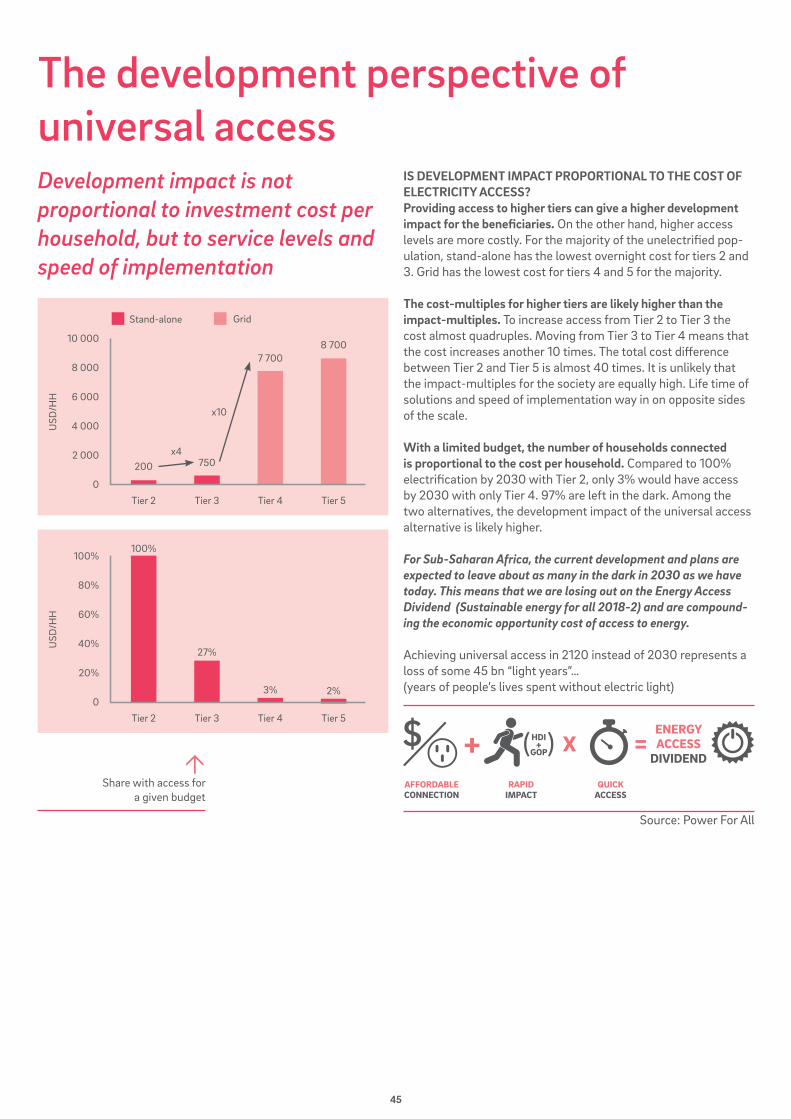
45
The development perspective of universal access
IS DEVELOPMENT IMPACT PROPORTIONAL TO THE COST OF ELECTRICITY ACCESS?Providing access to higher tiers can give a higher development impact for the beneficiaries. On the other hand, higher access levels are more costly. For the majority of the unelectrified pop-ulation, stand-alone has the lowest overnight cost for tiers 2 and 3. Grid has the lowest cost for tiers 4 and 5 for the majority.
The cost-multiples for higher tiers are likely higher than the impact-multiples. To increase access from Tier 2 to Tier 3 the cost almost quadruples. Moving from Tier 3 to Tier 4 means that the cost increases another 10 times. The total cost difference between Tier 2 and Tier 5 is almost 40 times. It is unlikely that the impact-multiples for the society are equally high. Life time of solutions and speed of implementation way in on opposite sides of the scale.
With a limited budget, the number of households connected is proportional to the cost per household. Compared to 100% electrification by 2030 with Tier 2, only 3% would have access by 2030 with only Tier 4. 97% are left in the dark. Among the two alternatives, the development impact of the universal access alternative is likely higher.
For Sub-Saharan Africa, the current development and plans are expected to leave about as many in the dark in 2030 as we have today. This means that we are losing out on the Energy Access Dividend (Sustainable energy for all 2018-2) and are compound-ing the economic opportunity cost of access to energy.
Achieving universal access in 2120 instead of 2030 represents a loss of some 45 bn “light years”… (years of people’s lives spent without electric light)
Source: Power For All
Development impact is not proportional to investment cost per household, but to service levels and speed of implementation
Share with access for
a given budget
10 000
2 000
4 000
6 000
8 000
0
Tier 2
200
Tier 3
x4
x10
750
Tier 4
7 700
Tier 5
8 700
USD
/HH
GridStand-alone
100%
20%
40%
60%
80%
0
Tier 2
100%
Tier 3
27%
Tier 4
3%
Tier 5
2%
USD
/HH
AFFORDABLECONNECTION
RAPIDIMPACT
QUICKACCESS
ENERGYACCESSDIVIDEND
=+ X
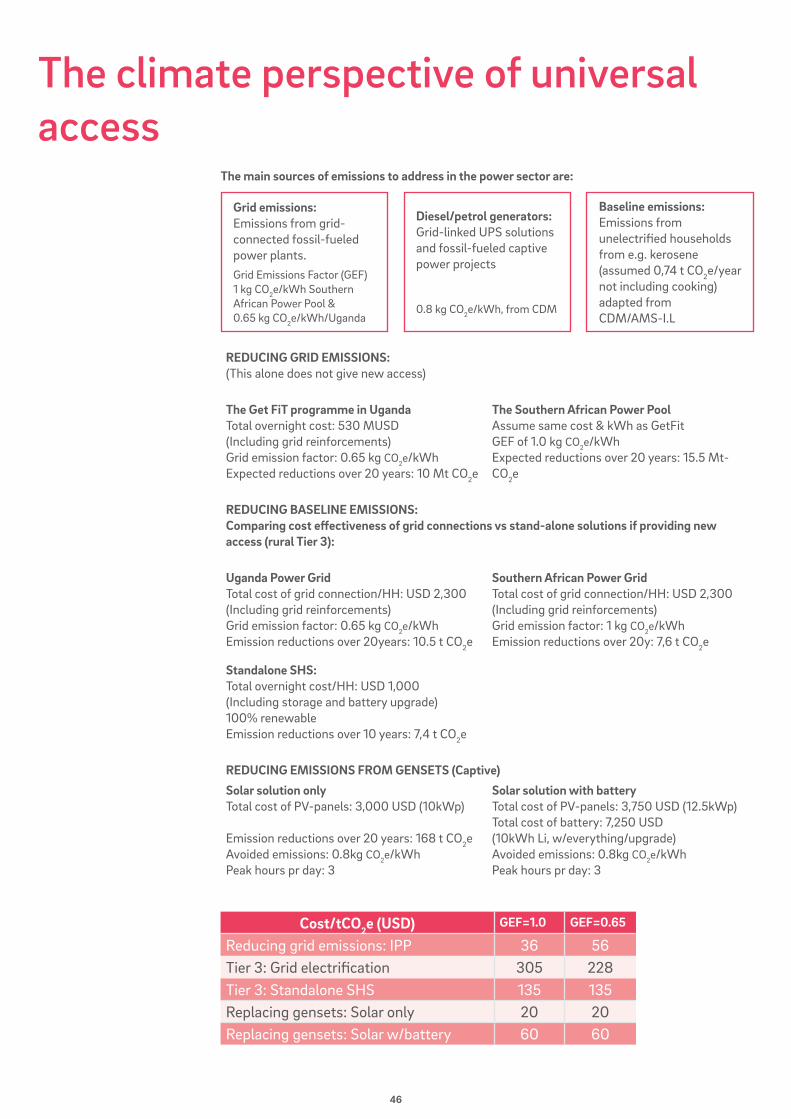
46
The climate perspective of universal access
REDUCING GRID EMISSIONS:(This alone does not give new access)
The Get FiT programme in UgandaTotal overnight cost: 530 MUSD(Including grid reinforcements)Grid emission factor: 0.65 kg CO2e/kWhExpected reductions over 20 years: 10 Mt CO2e
The Southern African Power PoolAssume same cost & kWh as GetFitGEF of 1.0 kg CO2e/kWhExpected reductions over 20 years: 15.5 Mt-CO2e
REDUCING BASELINE EMISSIONS:Comparing cost effectiveness of grid connections vs stand-alone solutions if providing new access (rural Tier 3):
Uganda Power GridTotal cost of grid connection/HH: USD 2,300 (Including grid reinforcements)Grid emission factor: 0.65 kg CO2e/kWhEmission reductions over 20years: 10.5 t CO2e
Southern African Power GridTotal cost of grid connection/HH: USD 2,300 (Including grid reinforcements)Grid emission factor: 1 kg CO2e/kWhEmission reductions over 20y: 7,6 t CO2e
Standalone SHS:Total overnight cost/HH: USD 1,000 (Including storage and battery upgrade)100% renewableEmission reductions over 10 years: 7,4 t CO2e
REDUCING EMISSIONS FROM GENSETS (Captive)Solar solution onlyTotal cost of PV-panels: 3,000 USD (10kWp)
Emission reductions over 20 years: 168 t CO2eAvoided emissions: 0.8kg CO2e/kWh Peak hours pr day: 3
Solar solution with batteryTotal cost of PV-panels: 3,750 USD (12.5kWp)Total cost of battery: 7,250 USD (10kWh Li, w/everything/upgrade)Avoided emissions: 0.8kg CO2e/kWh Peak hours pr day: 3
Cost/tCO2e (USD) GEF=1.0 GEF=0.65
Reducing grid emissions: IPP 36 56Tier 3: Grid electrification 305 228Tier 3: Standalone SHS 135 135Replacing gensets: Solar only 20 20Replacing gensets: Solar w/battery 60 60
Grid emissions: Emissions from grid-connected fossil-fueled power plants. Grid Emissions Factor (GEF) 1 kg CO2e/kWh Southern African Power Pool & 0.65 kg CO2e/kWh/Uganda
Diesel/petrol generators:Grid-linked UPS solutions and fossil-fueled captive power projects
0.8 kg CO2e/kWh, from CDM
Baseline emissions:Emissions from unelectrified households from e.g. kerosene (assumed 0,74 t CO2e/year not including cooking) adapted from CDM/AMS-I.L
The main sources of emissions to address in the power sector are:
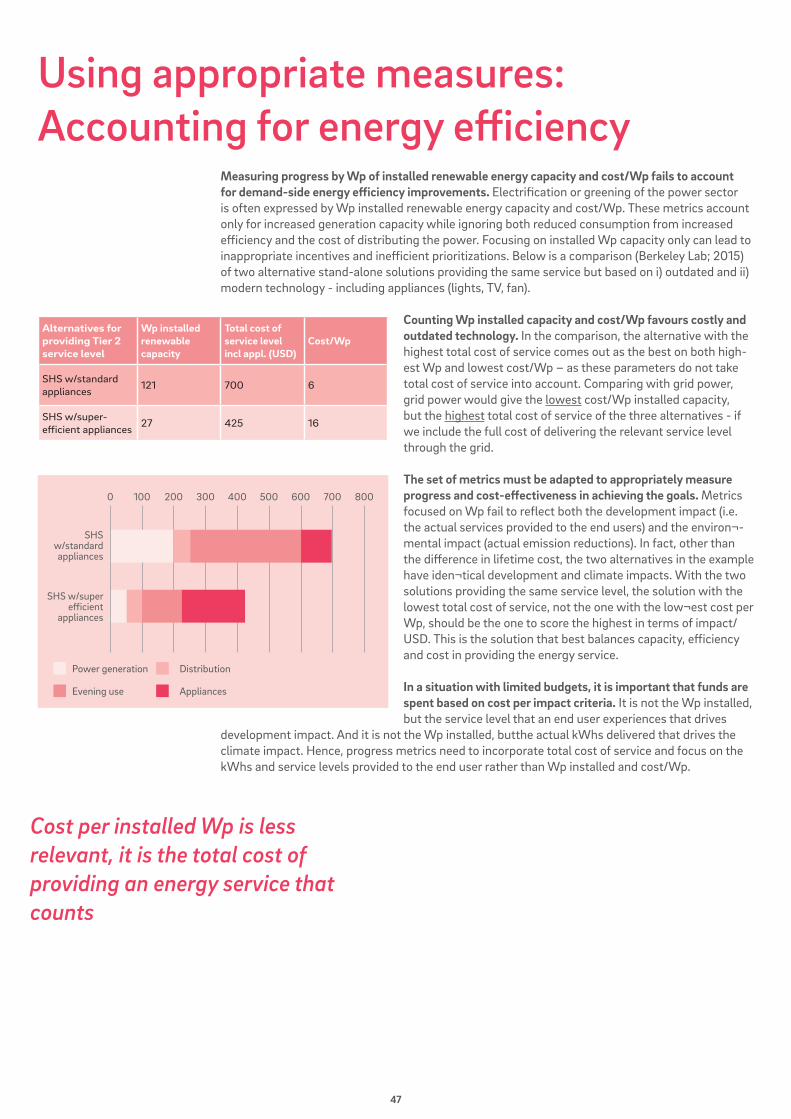
47
Using appropriate measures: Accounting for energy efficiency
Measuring progress by Wp of installed renewable energy capacity and cost/Wp fails to account for demand-side energy efficiency improvements. Electrification or greening of the power sector is often expressed by Wp installed renewable energy capacity and cost/Wp. These metrics account only for increased generation capacity while ignoring both reduced consumption from increased efficiency and the cost of distributing the power. Focusing on installed Wp capacity only can lead to inappropriate incentives and inefficient prioritizations. Below is a comparison (Berkeley Lab; 2015) of two alternative stand-alone solutions providing the same service but based on i) outdated and ii) modern technology - including appliances (lights, TV, fan).
Counting Wp installed capacity and cost/Wp favours costly and outdated technology. In the comparison, the alternative with the highest total cost of service comes out as the best on both high-est Wp and lowest cost/Wp – as these parameters do not take total cost of service into account. Comparing with grid power, grid power would give the lowest cost/Wp installed capacity, but the highest total cost of service of the three alternatives - if we include the full cost of delivering the relevant service level through the grid.
The set of metrics must be adapted to appropriately measure progress and cost-effectiveness in achieving the goals. Metrics focused on Wp fail to reflect both the development impact (i.e. the actual services provided to the end users) and the environ¬-mental impact (actual emission reductions). In fact, other than the difference in lifetime cost, the two alternatives in the example have iden¬tical development and climate impacts. With the two solutions providing the same service level, the solution with the lowest total cost of service, not the one with the low¬est cost per Wp, should be the one to score the highest in terms of impact/USD. This is the solution that best balances capacity, efficiency and cost in providing the energy service.
In a situation with limited budgets, it is important that funds are spent based on cost per impact criteria. It is not the Wp installed, but the service level that an end user experiences that drives
development impact. And it is not the Wp installed, butthe actual kWhs delivered that drives the climate impact. Hence, progress metrics need to incorporate total cost of service and focus on the kWhs and service levels provided to the end user rather than Wp installed and cost/Wp.
Alternatives for providing Tier 2 service level
Wp installedrenewable capacity
Total cost of service level incl appl. (USD)
Cost/Wp
SHS w/standard appliances 121 700 6
SHS w/super-efficient appliances 27 425 16
0 200 400 600100 300 500 700 800
SHS w/super efficient
appliances
SHS w/standard appliances
Power generation
Evening use
Distribution
Appliances
Cost per installed Wp is less relevant, it is the total cost of providing an energy service that counts
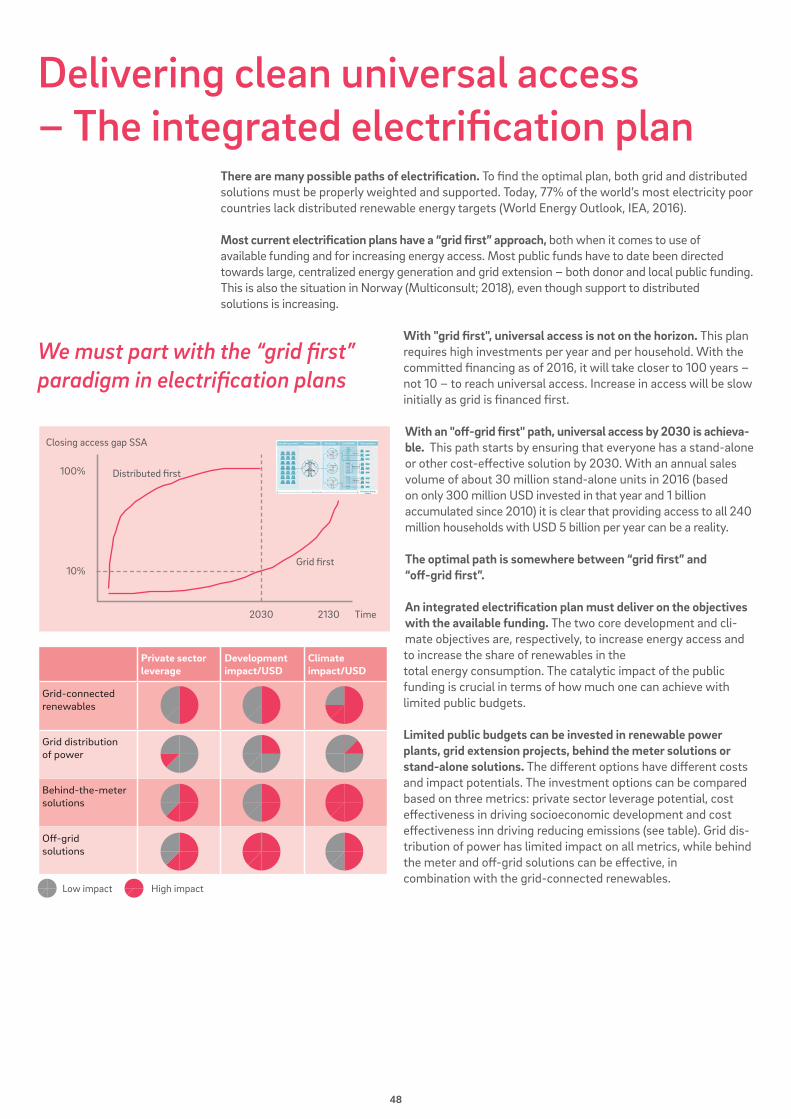
48
Delivering clean universal access – The integrated electrification plan
There are many possible paths of electrification. To find the optimal plan, both grid and distributed solutions must be properly weighted and supported. Today, 77% of the world’s most electricity poor countries lack distributed renewable energy targets (World Energy Outlook, IEA, 2016).
Most current electrification plans have a “grid first” approach, both when it comes to use of available funding and for increasing energy access. Most public funds have to date been directed towards large, centralized energy generation and grid extension – both donor and local public funding. This is also the situation in Norway (Multiconsult; 2018), even though support to distributed solutions is increasing.
With "grid first", universal access is not on the horizon. This plan requires high investments per year and per household. With the committed financing as of 2016, it will take closer to 100 years – not 10 – to reach universal access. Increase in access will be slow initially as grid is financed first.
With an "off-grid first" path, universal access by 2030 is achieva-ble. This path starts by ensuring that everyone has a stand-alone or other cost-effective solution by 2030. With an annual sales volume of about 30 million stand-alone units in 2016 (based on only 300 million USD invested in that year and 1 billion accumulated since 2010) it is clear that providing access to all 240 million households with USD 5 billion per year can be a reality.
The optimal path is somewhere between “grid first” and “off-grid first”.
An integrated electrification plan must deliver on the objectives with the available funding. The two core development and cli-mate objectives are, respectively, to increase energy access and to increase the share of renewables in the total energy consumption. The catalytic impact of the public funding is crucial in terms of how much one can achieve with limited public budgets.
Limited public budgets can be invested in renewable power plants, grid extension projects, behind the meter solutions or stand-alone solutions. The different options have different costs and impact potentials. The investment options can be compared based on three metrics: private sector leverage potential, cost effectiveness in driving socioeconomic development and cost effectiveness inn driving reducing emissions (see table). Grid dis-tribution of power has limited impact on all metrics, while behind the meter and off-grid solutions can be effective, in combination with the grid-connected renewables.
We must part with the “grid first” paradigm in electrification plans
Distributed first
Grid first10%
100%
Closing access gap SSA
2030 2130 Time
Private sectorleverage
Development impact/USD
Climateimpact/USD
Grid-connectedrenewables
Grid distributionof power
Behind-the-metersolutions
Off-grid solutions
Low impact High impact
49
OTHER KEY ELEMENTS OF AN INTEGRATED ELECTRIFICATION STRATEGY
1. Create a level playing field: From a cost effectiveness perspective, public grid and private off-grid service providers should be allowed to compete on more equal terms. Grid power and off-grid are ‘competing’ over the same customer base. Today, grid is the default choice for all the easiest and well-off customers. Distributed solutions are expected to service whatever is left of less commercially viable customers.
A grid electrification program uses public subsidies to capture the most attractive markets and customers from the distributed energy companies. Many customers that would have been commercially attractive for off-grid solutions without subsidies, are offered subsidized grid connections. This creates loose/loose situations whereby the utility takes on another lossmaking customer and the DESCO loses a potentially profitable customer. This makes it even more diffi-cult for a national utility to achieve break-even and even more difficult for a DESCO to grow a profitable portfolio.
2. Keep a focus on energy efficiency as part of the solution. Energy efficiency is crucial to the cost effectiveness of meeting the growth in demand. Currently, super-efficient appliances do not benefit from the same tax exemptions as e.g. solar panels. This means that customers continue to purchase larger systems to combine with outdated appliance technology.
Customers end up with expensive systems and outdated appliances. The limited availability of appropriately priced energy efficient equipment leads customers into systems with higher annualized costs of energy service access. The high up-front costs of long-lasting lithium batteries lead customers to select lead-acid batteries. These batteries have a higher maintenance cost and shorter lifetime, hence significantly higher life cycle cost.
Robust support of a rapidly growing distributed energy sector will of course accelerate the development of super-efficient appliances. This is because developers will see the market potential of energy efficient products with a market potential of up to 1bn customers. On the contrary - without significant capital going into the sector and without sufficient growth, developers of efficient appliances will have no incentive to develop them.
Efficient appliances can also reduce the need for more grid power. Many countries are drastically increasing the grid electricity tariffs to move closer to cost-reflective levels. Higher tariffs increase the financial attractiveness of purchasing super-efficient appliances, as it could ease the cost burden from tariff increases – as a super-efficient household will not use nearly as much energy.
Super-efficient appliances need to be promoted by policies and incentives:• Enforced policies on quality standards, labelling and import regulations.• Financial incentives (The US-based NGO CLASP is also implementing financial incentives to stimulate increased market entry for super-efficient appliances into developing countries.)
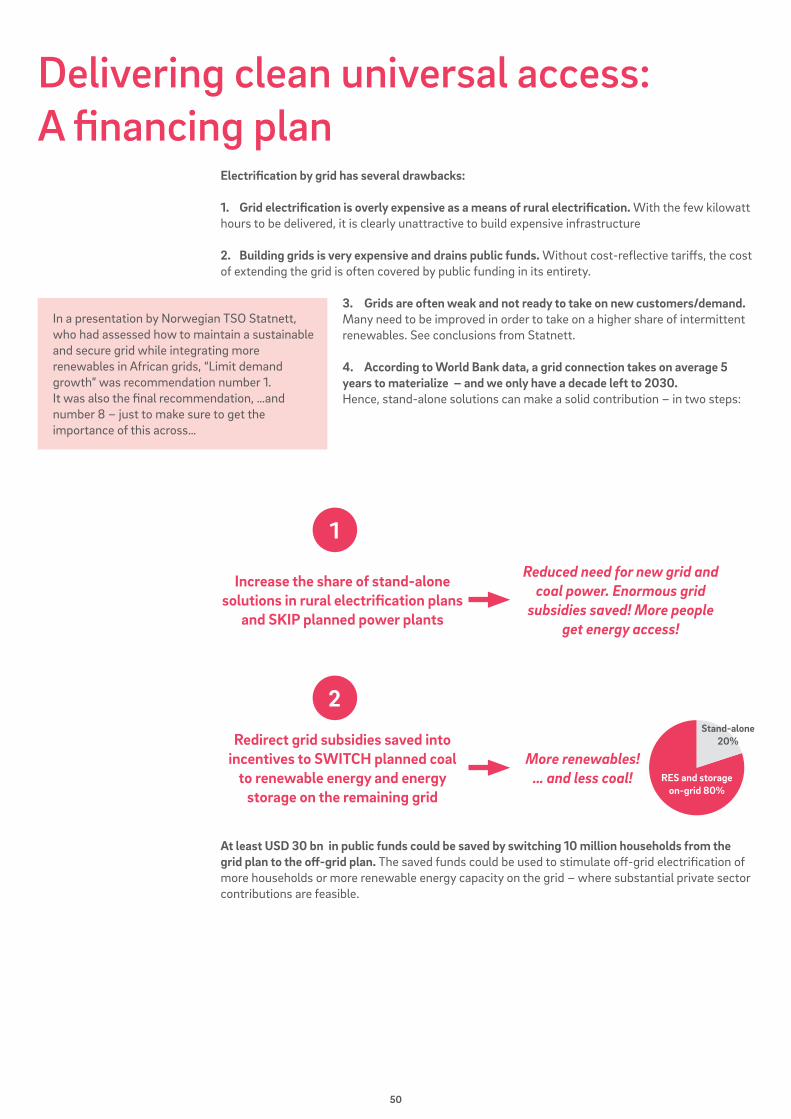
50
Delivering clean universal access: A financing plan
Electrification by grid has several drawbacks:
1. Grid electrification is overly expensive as a means of rural electrification. With the few kilowatt hours to be delivered, it is clearly unattractive to build expensive infrastructure
2. Building grids is very expensive and drains public funds. Without cost-reflective tariffs, the cost of extending the grid is often covered by public funding in its entirety.
3. Grids are often weak and not ready to take on new customers/demand. Many need to be improved in order to take on a higher share of intermittent renewables. See conclusions from Statnett.
4. According to World Bank data, a grid connection takes on average 5 years to materialize – and we only have a decade left to 2030.Hence, stand-alone solutions can make a solid contribution – in two steps:
At least USD 30 bn in public funds could be saved by switching 10 million households from the grid plan to the off-grid plan. The saved funds could be used to stimulate off-grid electrification of more households or more renewable energy capacity on the grid – where substantial private sector contributions are feasible.
In a presentation by Norwegian TSO Statnett, who had assessed how to maintain a sustainable and secure grid while integrating more renewables in African grids, “Limit demand growth” was recommendation number 1. It was also the final recommendation, …and number 8 – just to make sure to get the importance of this across…
Increase the share of stand-alonesolutions in rural electrification plans
and SKIP planned power plants
Reduced need for new grid and coal power. Enormous grid
subsidies saved! More people get energy access!
Redirect grid subsidies saved intoincentives to SWITCH planned coal
to renewable energy and energy storage on the remaining grid
More renewables!… and less coal!
1
2
RES and storage on-grid 80%
Stand-alone20%
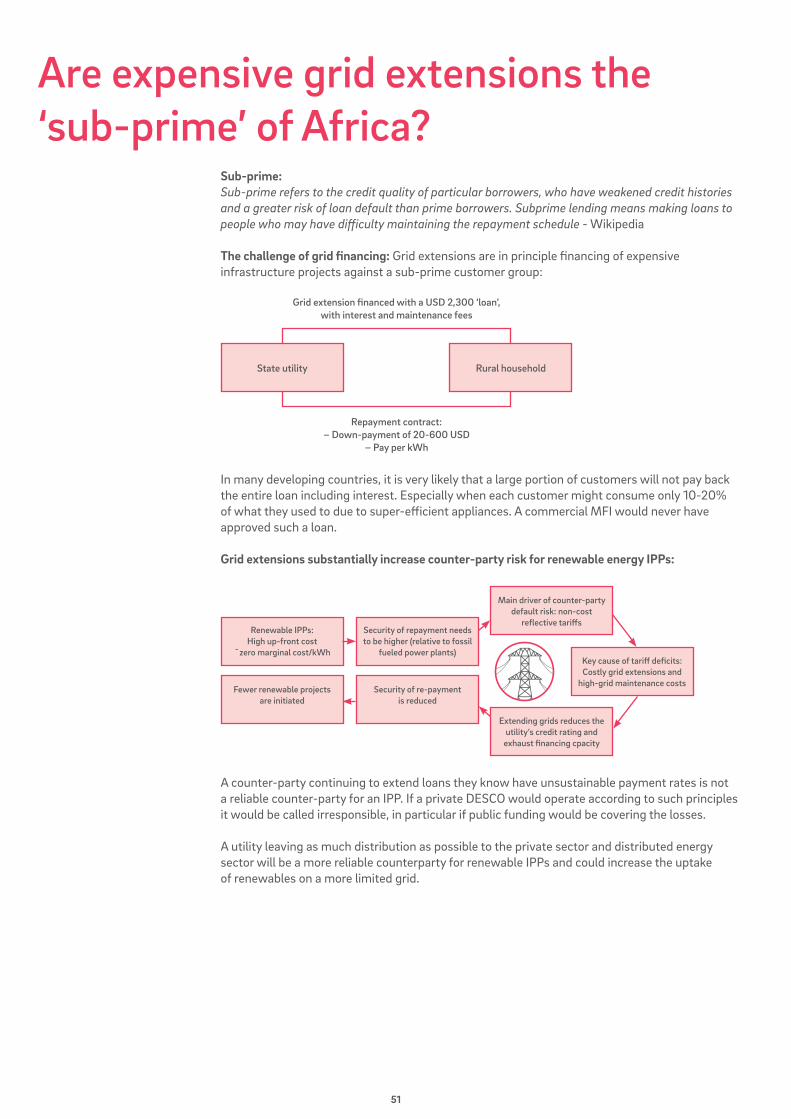
51
Are expensive grid extensions the ‘sub-prime’ of Africa?
Sub-prime: Sub-prime refers to the credit quality of particular borrowers, who have weakened credit histories and a greater risk of loan default than prime borrowers. Subprime lending means making loans to people who may have difficulty maintaining the repayment schedule - Wikipedia
The challenge of grid financing: Grid extensions are in principle financing of expensive infrastructure projects against a sub-prime customer group:
In many developing countries, it is very likely that a large portion of customers will not pay back the entire loan including interest. Especially when each customer might consume only 10-20% of what they used to due to super-efficient appliances. A commercial MFI would never have approved such a loan.
Grid extensions substantially increase counter-party risk for renewable energy IPPs:
A counter-party continuing to extend loans they know have unsustainable payment rates is not a reliable counter-party for an IPP. If a private DESCO would operate according to such principles it would be called irresponsible, in particular if public funding would be covering the losses.
A utility leaving as much distribution as possible to the private sector and distributed energy sector will be a more reliable counterparty for renewable IPPs and could increase the uptake of renewables on a more limited grid.
State utility
Grid extension financed with a USD 2,300 ‘loan’,with interest and maintenance fees
Repayment contract:– Down-payment of 20-600 USD
– Pay per kWh
Rural household
Renewable IPPs:High up-front cost
˜zero marginal cost/kWh
Security of repayment needs to be higher (relative to fossil
fueled power plants)
Main driver of counter-party default risk: non-cost
reflective tariffs
Extending grids reduces the utility’s credit rating and
exhaust financing cpacity
Key cause of tariff deficits: Costly grid extensions and
high-grid maintenance costsFewer renewable projects
are initiatedSecurity of re-payment
is reduced
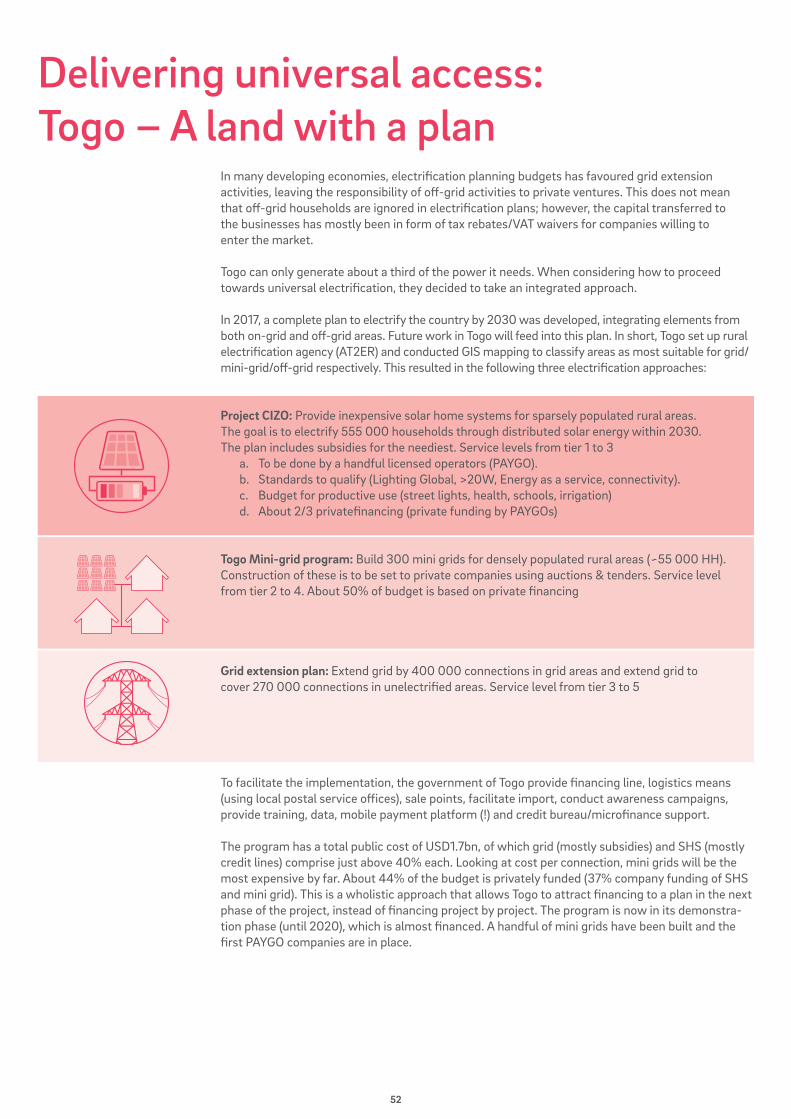
52
Delivering universal access: Togo – A land with a plan
In many developing economies, electrification planning budgets has favoured grid extension activities, leaving the responsibility of off-grid activities to private ventures. This does not mean that off-grid households are ignored in electrification plans; however, the capital transferred to the businesses has mostly been in form of tax rebates/VAT waivers for companies willing to enter the market.
Togo can only generate about a third of the power it needs. When considering how to proceed towards universal electrification, they decided to take an integrated approach.
In 2017, a complete plan to electrify the country by 2030 was developed, integrating elements from both on-grid and off-grid areas. Future work in Togo will feed into this plan. In short, Togo set up rural electrification agency (AT2ER) and conducted GIS mapping to classify areas as most suitable for grid/mini-grid/off-grid respectively. This resulted in the following three electrification approaches:
Project CIZO: Provide inexpensive solar home systems for sparsely populated rural areas. The goal is to electrify 555 000 households through distributed solar energy within 2030. The plan includes subsidies for the neediest. Service levels from tier 1 to 3 a. To be done by a handful licensed operators (PAYGO). b. Standards to qualify (Lighting Global, >20W, Energy as a service, connectivity). c. Budget for productive use (street lights, health, schools, irrigation) d. About 2/3 privatefinancing (private funding by PAYGOs)
Togo Mini-grid program: Build 300 mini grids for densely populated rural areas (~55 000 HH). Construction of these is to be set to private companies using auctions & tenders. Service level from tier 2 to 4. About 50% of budget is based on private financing
Grid extension plan: Extend grid by 400 000 connections in grid areas and extend grid to cover 270 000 connections in unelectrified areas. Service level from tier 3 to 5
To facilitate the implementation, the government of Togo provide financing line, logistics means (using local postal service offices), sale points, facilitate import, conduct awareness campaigns, provide training, data, mobile payment platform (!) and credit bureau/microfinance support.
The program has a total public cost of USD1.7bn, of which grid (mostly subsidies) and SHS (mostly credit lines) comprise just above 40% each. Looking at cost per connection, mini grids will be the most expensive by far. About 44% of the budget is privately funded (37% company funding of SHS and mini grid). This is a wholistic approach that allows Togo to attract financing to a plan in the next phase of the project, instead of financing project by project. The program is now in its demonstra-tion phase (until 2020), which is almost financed. A handful of mini grids have been built and the first PAYGO companies are in place.
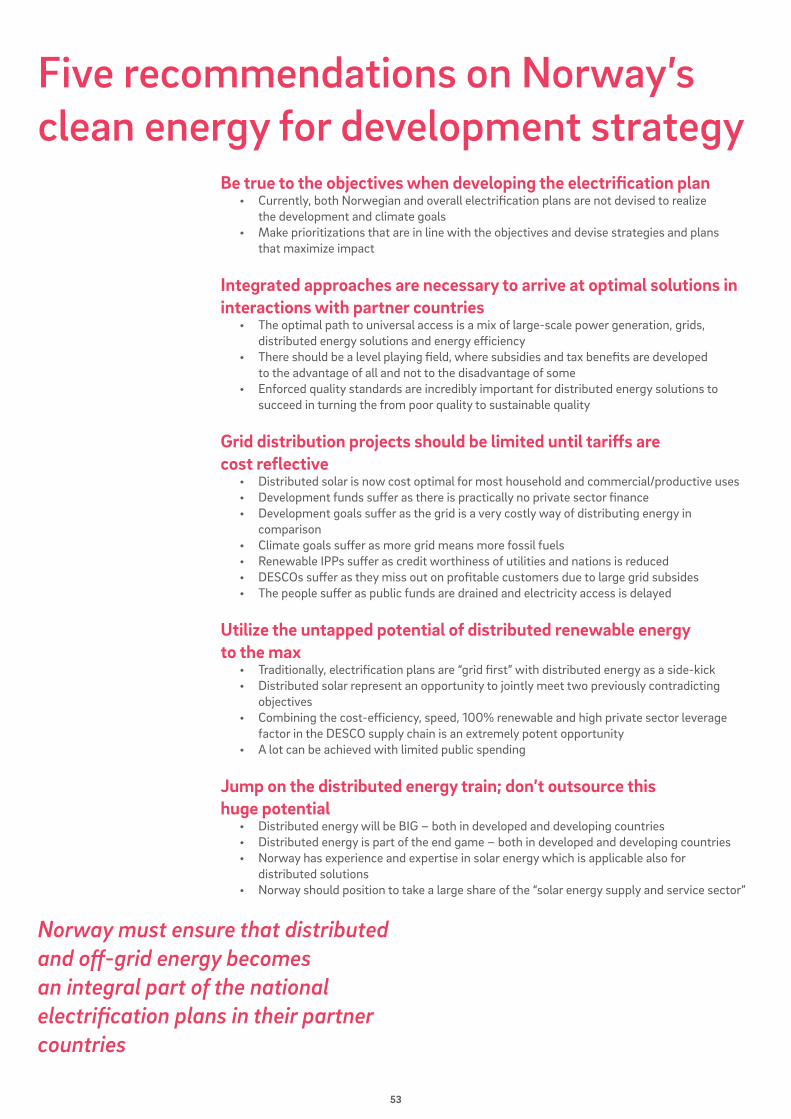
53
Five recommendations on Norway’s clean energy for development strategy
Be true to the objectives when developing the electrification plan • Currently, both Norwegian and overall electrification plans are not devised to realize the development and climate goals • Make prioritizations that are in line with the objectives and devise strategies and plans that maximize impact
Integrated approaches are necessary to arrive at optimal solutions in interactions with partner countries • The optimal path to universal access is a mix of large-scale power generation, grids, distributed energy solutions and energy efficiency • There should be a level playing field, where subsidies and tax benefits are developed to the advantage of all and not to the disadvantage of some • Enforced quality standards are incredibly important for distributed energy solutions to succeed in turning the from poor quality to sustainable quality
Grid distribution projects should be limited until tariffs are cost reflective • Distributed solar is now cost optimal for most household and commercial/productive uses • Development funds suffer as there is practically no private sector finance • Development goals suffer as the grid is a very costly way of distributing energy in comparison • Climate goals suffer as more grid means more fossil fuels • Renewable IPPs suffer as credit worthiness of utilities and nations is reduced • DESCOs suffer as they miss out on profitable customers due to large grid subsides • The people suffer as public funds are drained and electricity access is delayed
Utilize the untapped potential of distributed renewable energy to the max • Traditionally, electrification plans are “grid first” with distributed energy as a side-kick • Distributed solar represent an opportunity to jointly meet two previously contradicting objectives • Combining the cost-efficiency, speed, 100% renewable and high private sector leverage factor in the DESCO supply chain is an extremely potent opportunity • A lot can be achieved with limited public spending
Jump on the distributed energy train; don’t outsource this huge potential • Distributed energy will be BIG – both in developed and developing countries • Distributed energy is part of the end game – both in developed and developing countries • Norway has experience and expertise in solar energy which is applicable also for distributed solutions • Norway should position to take a large share of the “solar energy supply and service sector”
Norway must ensure that distributed and off-grid energy becomes an integral part of the national electrification plans in their partner countries
54
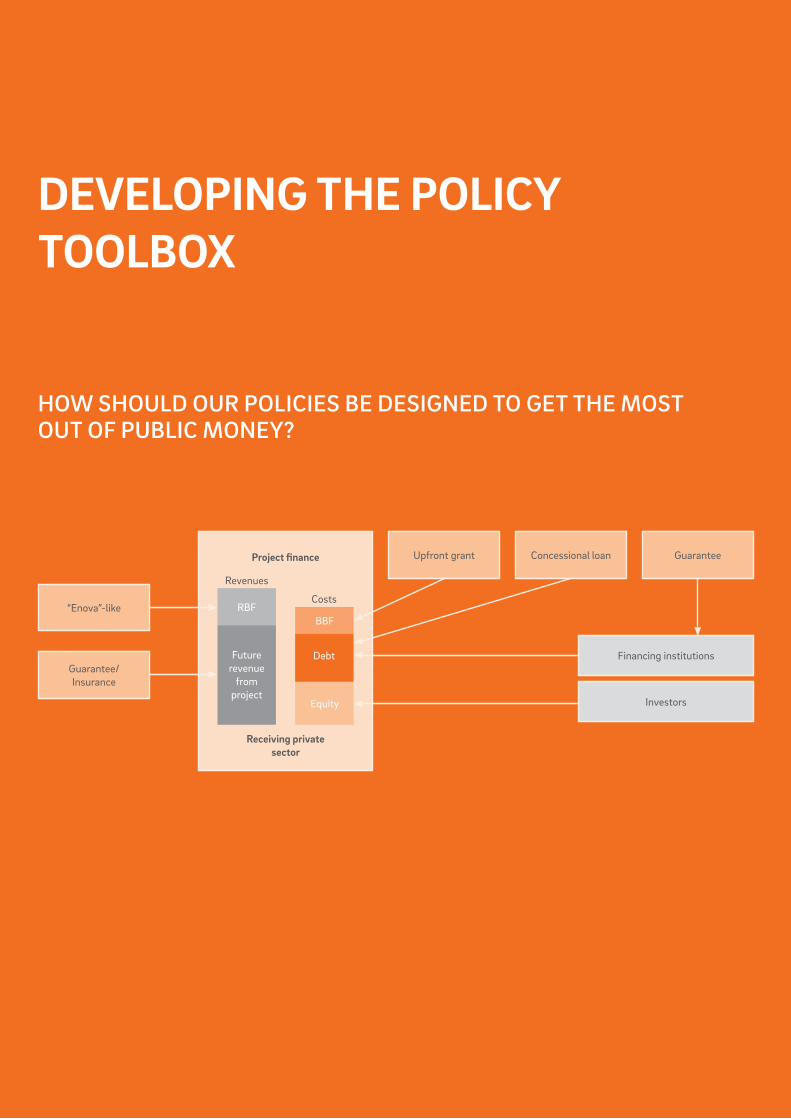
55
DEVELOPING THE POLICY TOOLBOX
HOW SHOULD OUR POLICIES BE DESIGNED TO GET THE MOST OUT OF PUBLIC MONEY?
“Enova”-like
Upfront grant Concessional loan Guarantee
Guarantee/Insurance
Financing institutions
Investors
Receiving privatesector
Project finance
Revenues
RBF
Futurerevenue
fromproject
Costs
BBF
Debt
Equity
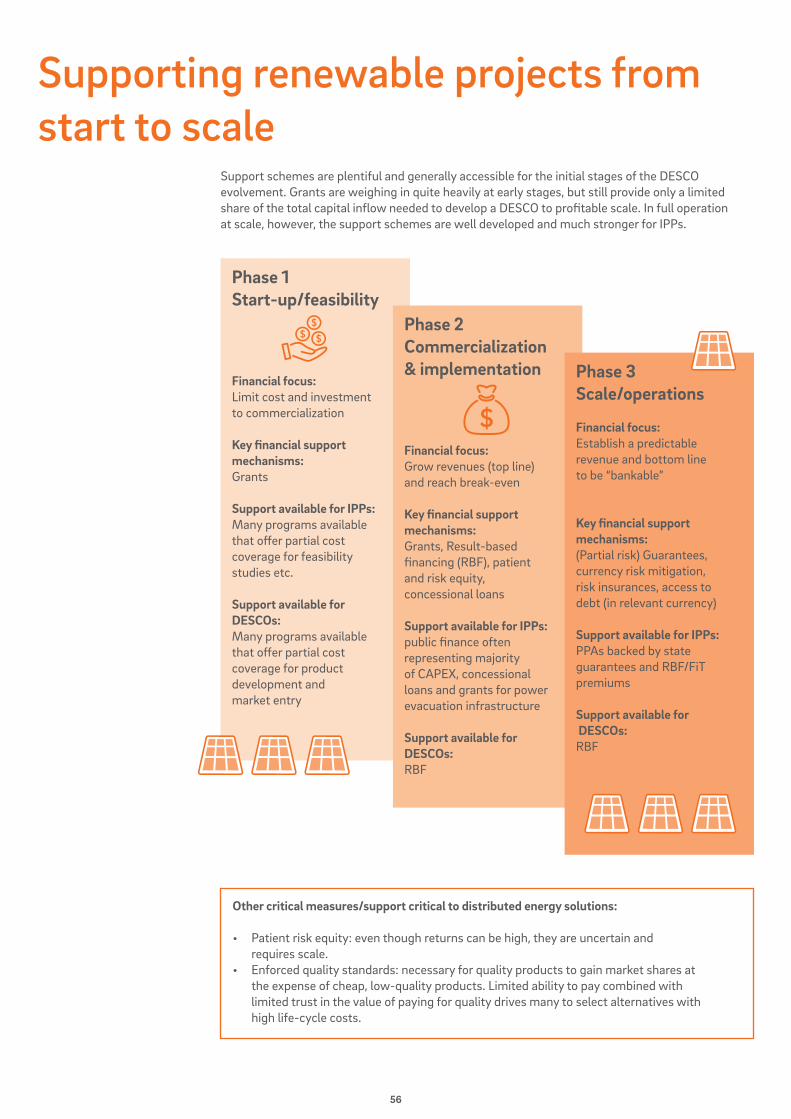
56
Supporting renewable projects from start to scale
Support schemes are plentiful and generally accessible for the initial stages of the DESCO evolvement. Grants are weighing in quite heavily at early stages, but still provide only a limited share of the total capital inflow needed to develop a DESCO to profitable scale. In full operation at scale, however, the support schemes are well developed and much stronger for IPPs.
Phase 1Start-up/feasibility
Financial focus:Limit cost and investment to commercialization
Key financial support mechanisms: Grants
Support available for IPPs: Many programs available that offer partial cost coverage for feasibility studies etc.
Support available for DESCOs: Many programs available that offer partial cost coverage for product development and market entry
Phase 2Commercialization & implementation
Financial focus:Grow revenues (top line) and reach break-even
Key financial support mechanisms: Grants, Result-based financing (RBF), patient and risk equity, concessional loans
Support available for IPPs: public finance often representing majority of CAPEX, concessional loans and grants for power evacuation infrastructure
Support available for DESCOs: RBF
Phase 3Scale/operations
Financial focus:Establish a predictable revenue and bottom line to be “bankable”
Key financial support mechanisms: (Partial risk) Guarantees, currency risk mitigation, risk insurances, access to debt (in relevant currency)
Support available for IPPs:PPAs backed by state guarantees and RBF/FiT premiums
Support available for DESCOs: RBF
Other critical measures/support critical to distributed energy solutions:
• Patient risk equity: even though returns can be high, they are uncertain and requires scale.• Enforced quality standards: necessary for quality products to gain market shares at the expense of cheap, low-quality products. Limited ability to pay combined with limited trust in the value of paying for quality drives many to select alternatives with high life-cycle costs.
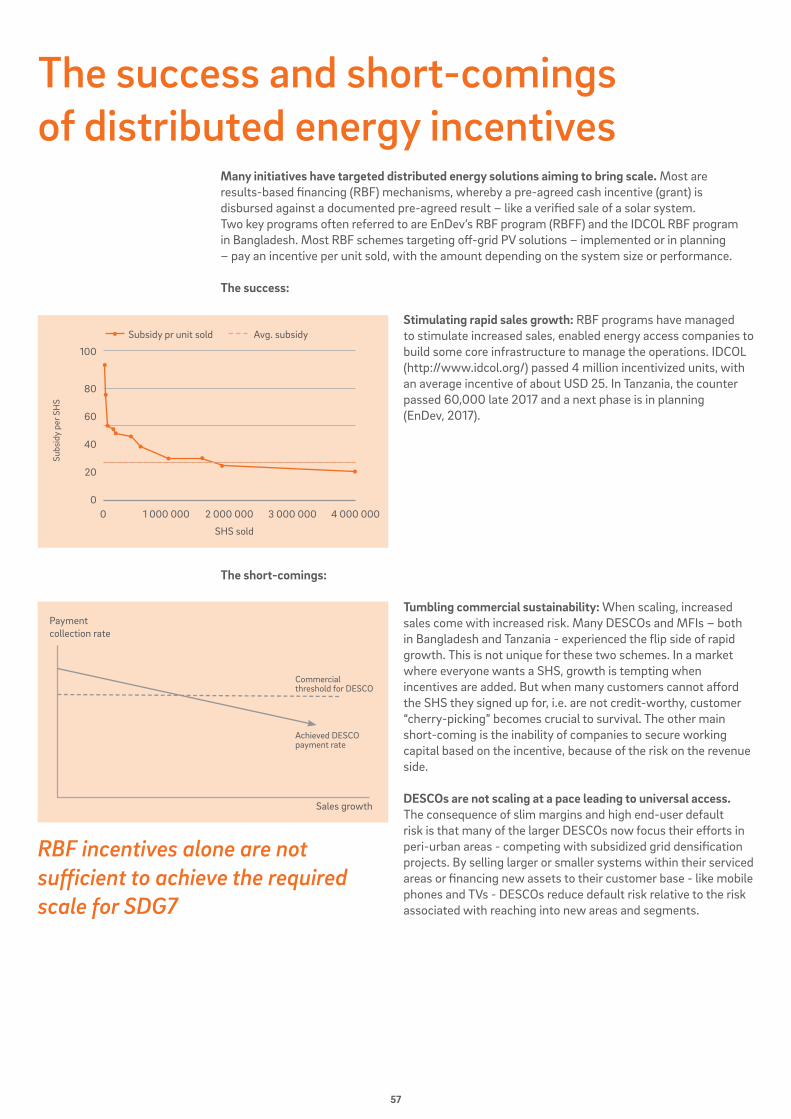
57
The success and short-comings of distributed energy incentives
Many initiatives have targeted distributed energy solutions aiming to bring scale. Most are results-based financing (RBF) mechanisms, whereby a pre-agreed cash incentive (grant) is disbursed against a documented pre-agreed result – like a verified sale of a solar system. Two key programs often referred to are EnDev’s RBF program (RBFF) and the IDCOL RBF program in Bangladesh. Most RBF schemes targeting off-grid PV solutions – implemented or in planning – pay an incentive per unit sold, with the amount depending on the system size or performance.
The success:
Stimulating rapid sales growth: RBF programs have managed to stimulate increased sales, enabled energy access companies to build some core infrastructure to manage the operations. IDCOL (http://www.idcol.org/) passed 4 million incentivized units, with an average incentive of about USD 25. In Tanzania, the counter passed 60,000 late 2017 and a next phase is in planning (EnDev, 2017).
The short-comings:
Tumbling commercial sustainability: When scaling, increased sales come with increased risk. Many DESCOs and MFIs – both in Bangladesh and Tanzania - experienced the flip side of rapid growth. This is not unique for these two schemes. In a market where everyone wants a SHS, growth is tempting when incentives are added. But when many customers cannot afford the SHS they signed up for, i.e. are not credit-worthy, customer “cherry-picking” becomes crucial to survival. The other main short-coming is the inability of companies to secure working capital based on the incentive, because of the risk on the revenue side.
DESCOs are not scaling at a pace leading to universal access. The consequence of slim margins and high end-user default risk is that many of the larger DESCOs now focus their efforts in peri-urban areas - competing with subsidized grid densification projects. By selling larger or smaller systems within their serviced areas or financing new assets to their customer base - like mobile phones and TVs - DESCOs reduce default risk relative to the risk associated with reaching into new areas and segments.
RBF incentives alone are not sufficient to achieve the required scale for SDG7
Subs
idy
per S
HS
4 000 0003 000 0002 000 000
Subsidy pr unit sold Avg. subsidy
1 000 00000
100
80
60
40
20
SHS sold
Paymentcollection rate
Achieved DESCOpayment rate
Commercialthreshold for DESCO
Sales growth
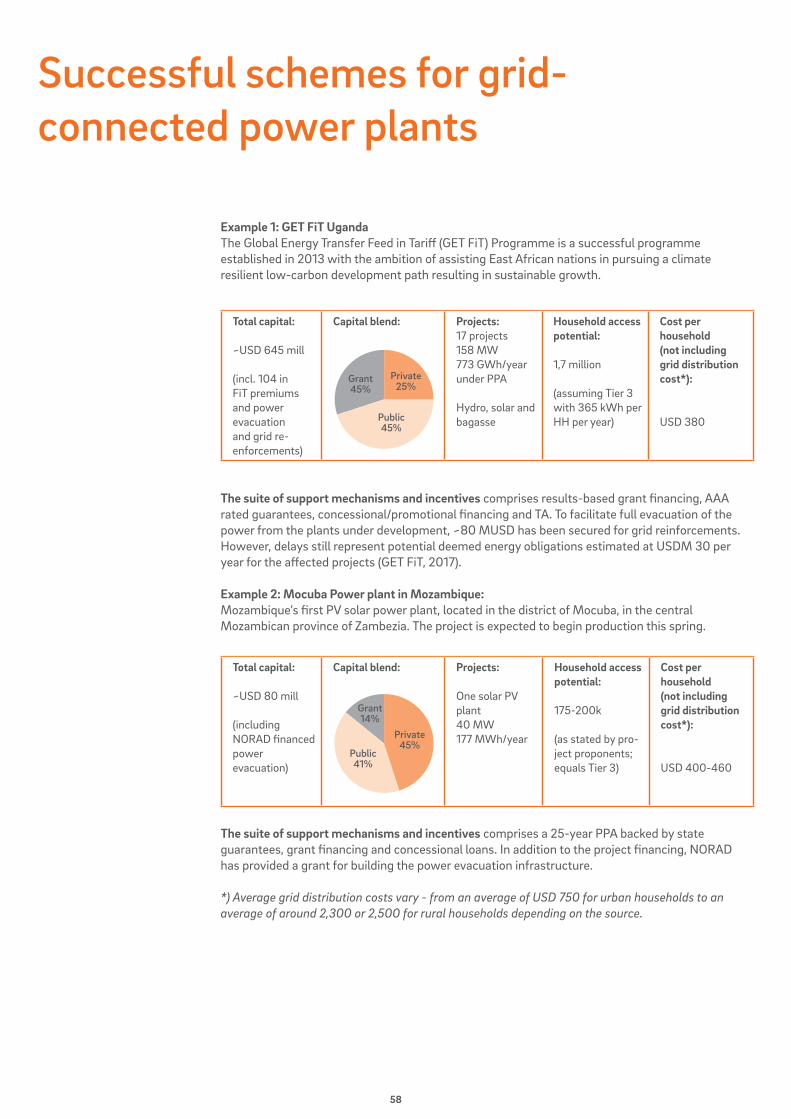
58
Successful schemes for grid-connected power plants
Example 1: GET FiT UgandaThe Global Energy Transfer Feed in Tariff (GET FiT) Programme is a successful programme established in 2013 with the ambition of assisting East African nations in pursuing a climate resilient low-carbon development path resulting in sustainable growth.
The suite of support mechanisms and incentives comprises results-based grant financing, AAA rated guarantees, concessional/promotional financing and TA. To facilitate full evacuation of the power from the plants under development, ~80 MUSD has been secured for grid reinforcements. However, delays still represent potential deemed energy obligations estimated at USDM 30 per year for the affected projects (GET FiT, 2017).
Example 2: Mocuba Power plant in Mozambique: Mozambique’s first PV solar power plant, located in the district of Mocuba, in the central Mozambican province of Zambezia. The project is expected to begin production this spring.
The suite of support mechanisms and incentives comprises a 25-year PPA backed by state guarantees, grant financing and concessional loans. In addition to the project financing, NORAD has provided a grant for building the power evacuation infrastructure.
*) Average grid distribution costs vary - from an average of USD 750 for urban households to an average of around 2,300 or 2,500 for rural households depending on the source.
Total capital:
~USD 645 mill
(incl. 104 in FiT premiums and power evacuation and grid re- enforcements)
Capital blend: Projects:17 projects158 MW773 GWh/year under PPA
Hydro, solar and bagasse
Household access potential:
1,7 million
(assuming Tier 3 with 365 kWh per HH per year)
Cost per household (not including grid distribution cost*):
USD 380
Private25%
Public45%
Grant45%
Total capital:
~USD 80 mill
(including NORAD financed power evacuation)
Capital blend: Projects:
One solar PV plant40 MW177 MWh/year
Household access potential:
175-200k
(as stated by pro-ject proponents; equals Tier 3)
Cost per household (not including grid distribution cost*):
USD 400-460
Private45%
Public41%
Grant14%
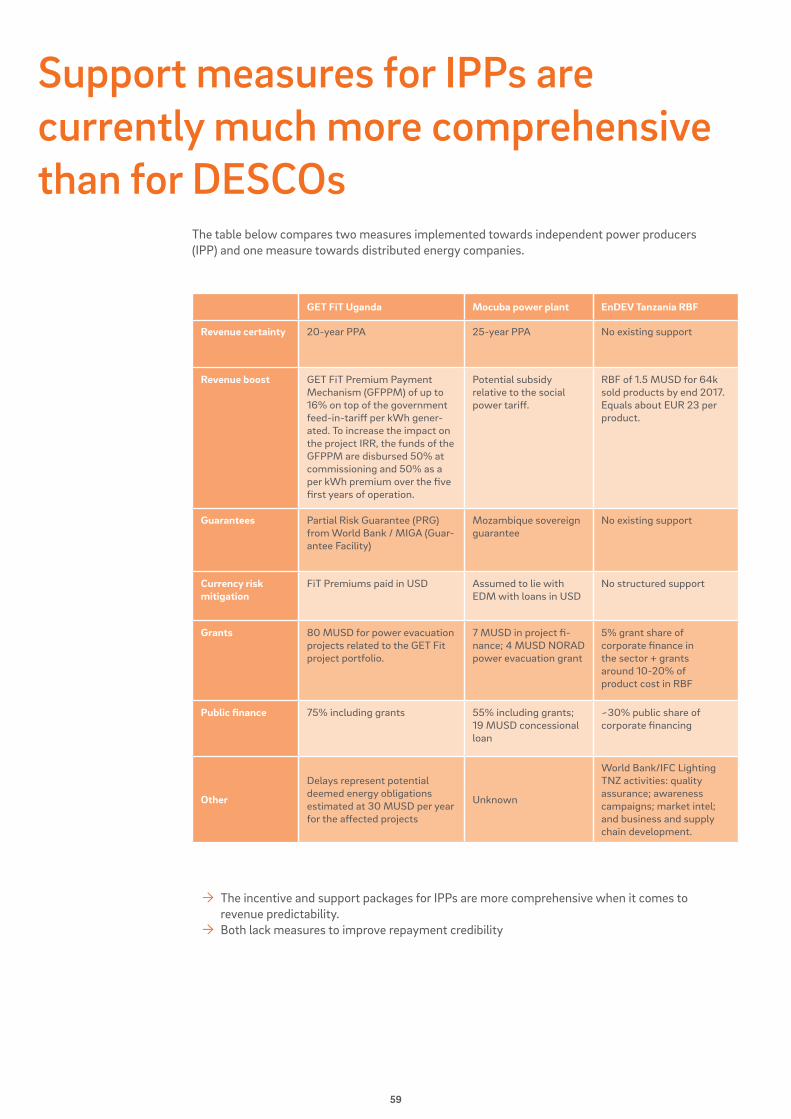
59
Support measures for IPPs are currently much more comprehensive than for DESCOs
The incentive and support packages for IPPs are more comprehensive when it comes to revenue predictability. Both lack measures to improve repayment credibility
GET FiT Uganda Mocuba power plant EnDEV Tanzania RBF
Revenue certainty 20-year PPA 25-year PPA No existing support
Revenue boost GET FiT Premium Payment Mechanism (GFPPM) of up to 16% on top of the government feed-in-tariff per kWh gener-ated. To increase the impact on the project IRR, the funds of the GFPPM are disbursed 50% at commissioning and 50% as a per kWh premium over the five first years of operation.
Potential subsidy relative to the social power tariff.
RBF of 1.5 MUSD for 64k sold products by end 2017. Equals about EUR 23 per product.
Guarantees Partial Risk Guarantee (PRG) from World Bank / MIGA (Guar-antee Facility)
Mozambique sovereign guarantee
No existing support
Currency risk mitigation
FiT Premiums paid in USD Assumed to lie with EDM with loans in USD
No structured support
Grants 80 MUSD for power evacuation projects related to the GET Fit project portfolio.
7 MUSD in project fi-nance; 4 MUSD NORAD power evacuation grant
5% grant share of corporate finance in the sector + grants around 10-20% of product cost in RBF
Public finance 75% including grants 55% including grants; 19 MUSD concessional loan
~30% public share of corporate financing
Other
Delays represent potential deemed energy obligations estimated at 30 MUSD per year for the affected projects
Unknown
World Bank/IFC Lighting TNZ activities: quality assurance; awareness campaigns; market intel; and business and supply chain development.
The table below compares two measures implemented towards independent power producers (IPP) and one measure towards distributed energy companies.
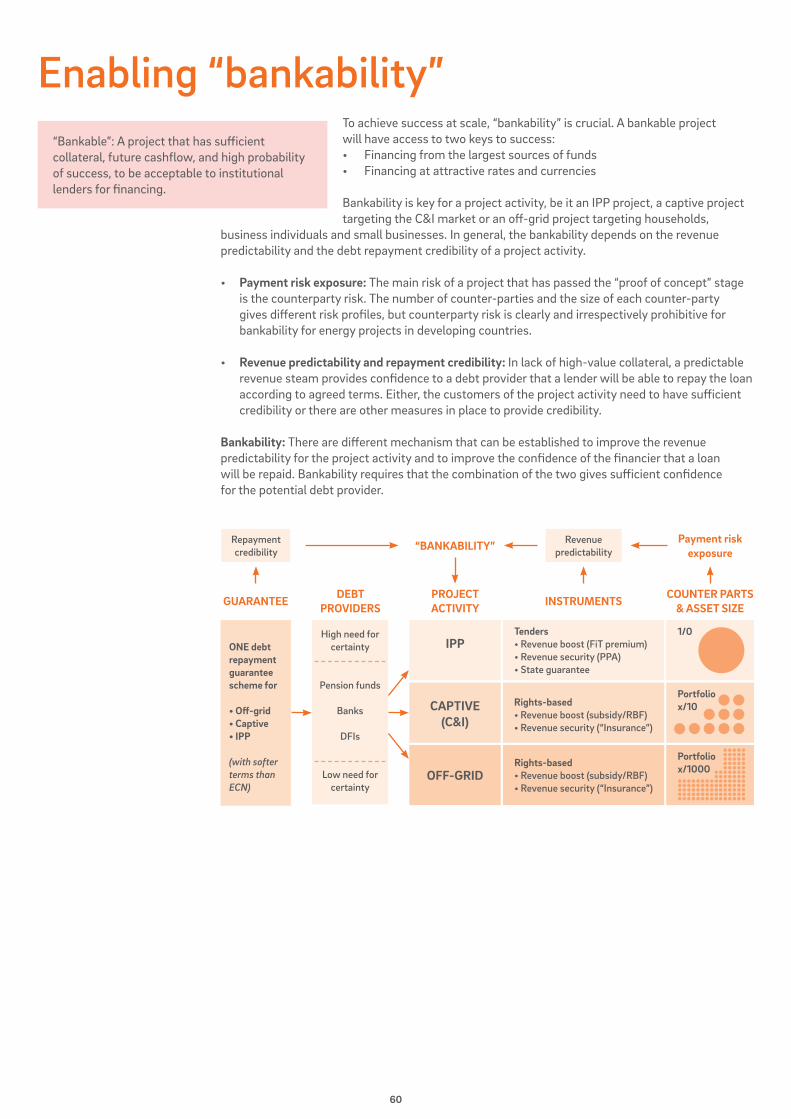
60
Enabling “bankability” To achieve success at scale, “bankability” is crucial. A bankable project will have access to two keys to success: • Financing from the largest sources of funds• Financing at attractive rates and currencies
Bankability is key for a project activity, be it an IPP project, a captive project targeting the C&I market or an off-grid project targeting households,
business individuals and small businesses. In general, the bankability depends on the revenue predictability and the debt repayment credibility of a project activity.
• Payment risk exposure: The main risk of a project that has passed the “proof of concept” stage is the counterparty risk. The number of counter-parties and the size of each counter-party gives different risk profiles, but counterparty risk is clearly and irrespectively prohibitive for bankability for energy projects in developing countries.
• Revenue predictability and repayment credibility: In lack of high-value collateral, a predictable revenue steam provides confidence to a debt provider that a lender will be able to repay the loan according to agreed terms. Either, the customers of the project activity need to have sufficient credibility or there are other measures in place to provide credibility.
Bankability: There are different mechanism that can be established to improve the revenue predictability for the project activity and to improve the confidence of the financier that a loan will be repaid. Bankability requires that the combination of the two gives sufficient confidence for the potential debt provider.
“Bankable”: A project that has sufficient collateral, future cashflow, and high probability of success, to be acceptable to institutional lenders for financing.
IPP
GUARANTEE DEBTPROVIDERS
PROJECT ACTIVITY
“BANKABILITY”
INSTRUMENTS COUNTER PARTS& ASSET SIZE
Payment riskexposure
CAPTIVE(C&I)
OFF-GRID
Tenders• Revenue boost (FiT premium)• Revenue security (PPA)• State guarantee
High need for certainty
Pension funds
Banks
DFIs
Low need for certainty
Revenuepredictability
Repaymentcredibility
ONE debt repayment guarantee scheme for • Off-grid• Captive• IPP
(with softer terms than ECN)
Rights-based• Revenue boost (subsidy/RBF)• Revenue security (“Insurance”)
Rights-based• Revenue boost (subsidy/RBF)• Revenue security (“Insurance”)
1/0
Portfoliox/10
Portfoliox/1000
61
MEASURES TO STRENGTHEN REVENUE PREDICTABILITY:
For IPPs: Very strong incentives are established to create predictable and sufficient revenue streams for IPPs. A long-term PPA with a national utility sets payment at a level which is sufficient for the IPPs to generate the required financial returns. The right to such a PPA is normally tendered and awarded to the best economic offer.
In some cases, the payment agreed in the PPA is higher than what the utility is able to recover in terms of revenues from the end users. Hence, there is often an implicit subsidy to secure revenues for the IPP above the resale value for the utility.
For DESCOs: Currently, neither captive C&I nor residential projects benefit currently from the same level of support as the
IPPs. Sometimes an RBF or similar incentive exists to boost revenues for successful sales. Due to the different risk profiles of DESCOs, RBF incentives are often “right-based”, as the incentive is paid to anyone delivering eligible results. RBF is very well suited as revenue-boosting mechanism for distributed energy service operations. But RBF alone does not do the job. RBF boosts revenues, but does not increase predictability and hence does not have the required impact in terms of providing the scale of attractive inventory financing required for achieving SDG7.
Measures that can improve the revenue predictability do not exist at relevant scale. A large portfolio often has a predictable revenue stream. However, in a growth scenario, the portfolio payment rate that a company will have after doubling the portfolio size is uncertain. Hence, rapid growth can represent a barrier to “bankability”. Options for downside protection, like stop-loss or first-loss, is limited for DESCOs as of today. This clearly limits the financial viability and growth of many DESCOs in practice.
Measures are in place for IPPs, but lack of mechanisms for down-side risk protection is hampering the sustainable growth of DESCOs.
MEASURES TO STRENGTHEN REPAYMENT CREDIBILITY:
For IPPs: Over the later years, the low credit-worthiness of developing country utilities and state treasuries has raised doubts regarding the security of the revenue stream to the project activity. With IPPs struggling to get financing despite having won PPAs and achieved a high degree of revenue reliability, the need for measures increasing the repayment credibility for a debt provider has risen.
For DESCOs: Given the lack of mechanisms to limit the downside for DESCOs, many struggle to secure financing at attractive terms and many grow very carefully focusing only on the most credit worthy customers. Access to financing at appropriate scale, terms and currency first requires measures to increase revenue predictability but will also repayment credibility as for IPPs. Lately, many DESCOs have had to resort to crowd financing as their main source of debt.
There is a clear need for a guarantee facility – both for IPPs and for DESCOs.
Can we mirror support levels of IPPs to stimulate stronger growth of DESCOs?
62
Norway can lead the way towards climate friendly universal access
Norway is well-positioned to take the lead in creating framework conditions that lead to a substantial directional shift – from today’s path of electrifying only a peri-urban fraction of the unelectrified population to a path leading towards universal access. The proposed guarantee mechanism will stimulate IPP activity, but the costs and challenges with the grids will remain and limit progress towards SDG7.
The development of a guarantee facility for distributed renewable energy solutions should not be postponed. The size of the asset base can be as large for a DESCO as for a grid-scale power plant. Assuming that the new facility will offer guarantees at subsidized terms, by the use of ODA, the facility must be made accessible for both supply chains of energy services, not just one of them. A one-sided focus on IPPs risks enforces the focus on
grid as the default way of electrification. It will again be subsidizing the grid model at the expense of the distributed model. This is in turn is likely to jeopardize the chances of achieving SDG7, as financing an expanding grid remains as a challenge.
Recently, we have seen signs of portfolio structuring in the DESCO market that better matches a future guarantee scheme. E.g. SunFunder has structured several blended finance deals and had raised USD 62 million by the end of 2017 (SunFunder; 2018). But we need to move from millions to billions. A guarantee mechanism can make that possible. The potential in the DESCOs and the solar energy supply chain is gigantic, however the repayment risk limits the larger pools of funds from
entering the space.
Measures to strengthen the revenue predictability must come first. Whether the risk hampering the growth of DESCOs is real or perceived is yet to be determined. It is not necessarily so that more remote customers are less creditworthy or will represent higher default rates. But the uncertainty is enough to direct DESCOs to start financing new layers for the existing customer base – and in current geographies - rather than growing and
expanding at the rate required.
Norway is one of the sponsors of the multi-donor partnership program Energising Development (EnDev), promoting sustainable access to modern energy services for households, social institutions and small to medium-sized enterprises in developing countries in Africa, Asia and Latin America. EnDev has over the latest years operated a pilot program testing different RBF mechanisms for DESCOs. Although an insurance-like mechanism is different in nature from what EnDev has been implementing to date, EnDev has the required experience both with the distributed energy sector and the local market conditions in many relevant countries. EnDev would be a fit for purpose vehicle for implementing new downside risk protection mechanism.
With appropriate measures to increase the revenue predictability as a basis, a guarantee mechanism that can bring the required confidence of the debt providers.
Norwegian guarantee scheme under development: In Norway’s latest budget agreement, the Government was instructed to assess different models for and provide an assessment of a guarantee facility for renewable energy in developing countries”
A guarantee facility for IPPs will be good for the climate, but DESCOs must be included to also stimulate increased access.
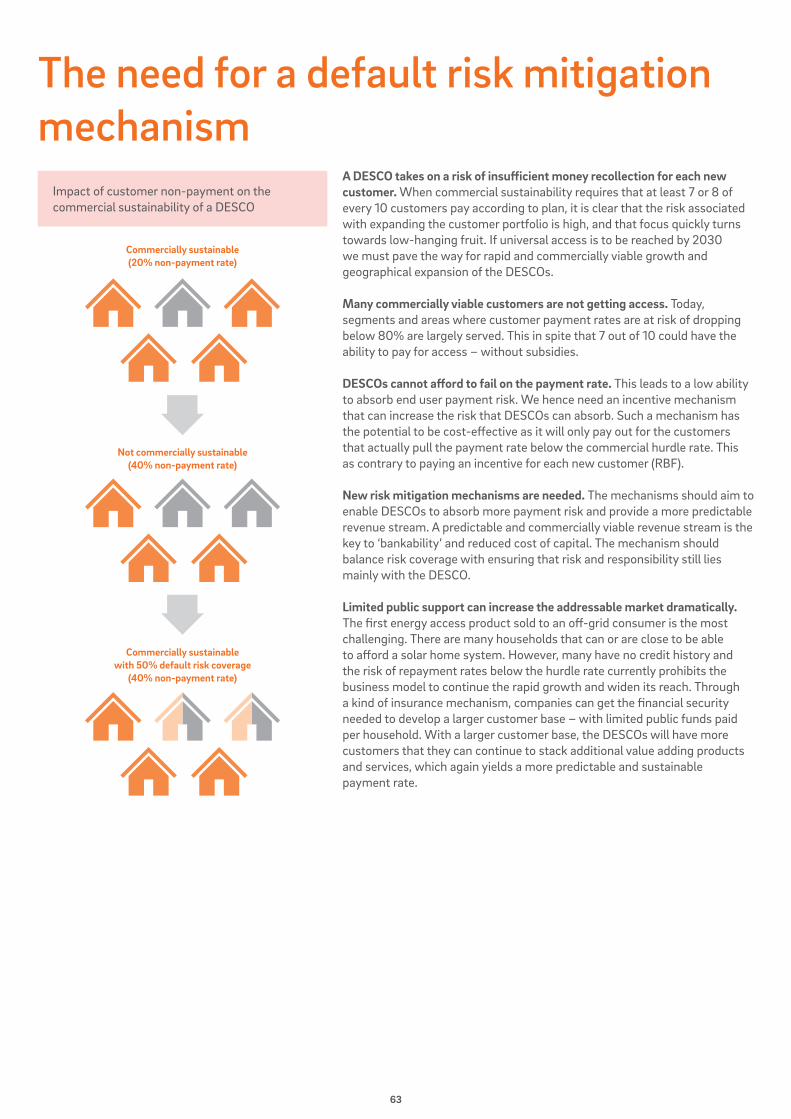
63
The need for a default risk mitigation mechanism
A DESCO takes on a risk of insufficient money recollection for each new customer. When commercial sustainability requires that at least 7 or 8 of every 10 customers pay according to plan, it is clear that the risk associated with expanding the customer portfolio is high, and that focus quickly turns towards low-hanging fruit. If universal access is to be reached by 2030 we must pave the way for rapid and commercially viable growth and geographical expansion of the DESCOs.
Many commercially viable customers are not getting access. Today, segments and areas where customer payment rates are at risk of dropping below 80% are largely served. This in spite that 7 out of 10 could have the ability to pay for access – without subsidies.
DESCOs cannot afford to fail on the payment rate. This leads to a low ability to absorb end user payment risk. We hence need an incentive mechanism that can increase the risk that DESCOs can absorb. Such a mechanism has the potential to be cost-effective as it will only pay out for the customers that actually pull the payment rate below the commercial hurdle rate. This as contrary to paying an incentive for each new customer (RBF).
New risk mitigation mechanisms are needed. The mechanisms should aim to enable DESCOs to absorb more payment risk and provide a more predictable revenue stream. A predictable and commercially viable revenue stream is the key to ‘bankability’ and reduced cost of capital. The mechanism should balance risk coverage with ensuring that risk and responsibility still lies mainly with the DESCO.
Limited public support can increase the addressable market dramatically. The first energy access product sold to an off-grid consumer is the most challenging. There are many households that can or are close to be able to afford a solar home system. However, many have no credit history and the risk of repayment rates below the hurdle rate currently prohibits the business model to continue the rapid growth and widen its reach. Through a kind of insurance mechanism, companies can get the financial security needed to develop a larger customer base – with limited public funds paid per household. With a larger customer base, the DESCOs will have more customers that they can continue to stack additional value adding products and services, which again yields a more predictable and sustainable payment rate.
Impact of customer non-payment on the commercial sustainability of a DESCO
Commercially sustainable(20% non-payment rate)
Not commercially sustainable(40% non-payment rate)
Commercially sustainablewith 50% default risk coverage
(40% non-payment rate)

64
65
Five recommendations on Norwegian policy actions
Level efforts between grid power and distributed energy solutions to make both “bankable”• To date, focus and funding has been skewed towards grids and large-scale power plants where there has been a willingness to “do what it takes” • Grants and soft loans available to grid distribution should be mirrored (although at lower cost per HH) to off-grid distribution
Develop one common guarantee facility to counter insufficient customer credit worthiness• A guarantee facility is expected to have a very high catalytic impact• To ensure that all opportunities are seized and benchmarked, the both grid-connected and distributed they should all be channeled through the same framework• Distributed opportunities are currently few and small, but distributed will be BIG and the facility should be prepared
Increase support and promote additional measures for mitigation of the end user risk exposure for DESCOs• IPPs have a quite standardized and very strong protection towards end-user payment risk• DESCOs have limited options to limit down-side risk• The fact that IEA finds that decentralized renewables offer the least-cost solution for three-quarters of additional electricity connections needed in sub-Saharan Africa does not mean that they are commercially attractive• Unless downside risk is addressed, DESCOs will not scale at the necessary speed and the guarantee mechanism will carry higher risk
Utilize the potential and experience of Energizing Development • EnDev have substantial and world-leading experience that can be leveraged• Funding should be substantial and bring the facility out of the pilot phase• New programs should be wide-reaching
Provide patient and risk-tolerant equity to Norwegian DESCOs• The DESCO sector is in a commercialization phase and needs patient and risk-tolerant equity• The newly established equity investment fund Nysnø should play a catalytic role in the Norwegian distributed energy sector
The suite of incentives for distributed should show the same willingness and effort to achieve bankability as incentives implemented for the IPPs

66
67
African Development Bank (2018): Technology and innovative finance key to reaching end users - http://www.intelligentcio.com/afri-ca/2018/10/16/technology-and-innovative-finance-key-to-reaching-end-users/
Berkeley Lab (2015): Powering a Home with Just 25 Watts of Solar PV - https://www.sun-connect-news.org/fileadmin/DATEIEN/Dateien/New/GlobalLEAP-PoweringAHome__1_.pdf
Berkeley Lab (2016): Is Bigger Best in Renewable Energy? - https://ilsr.org/report-is-bigger-best/
Bloomberg New Energy Finance (2018-1): New energy outlook 2018 - https://about.bnef.com/new-energy-outlook/
Bloomberg New Energy Finance (2018-2): Tumbling Costs for Wind, Solar, Batteries Are Squeezing - https://about.bnef.com/blog/ tumbling-costs-wind-solar-batteries-squeezing-fossil-fuels/
Bloomberg New Energy Finance (2019): Solar for Businesses in Sub-Saharan Africa - https://data.bloomberglp.com/professional/sites/24/BNEF_responsAbility-report-Solar-for-Businesses-in-Sub-Saharan-Africa.pdf
Clasp (2019): Getting to know off- and weak-grid consumers: The unforeseen impacts of energy efficient off-grid appliances - https://clasp.ngo/updates/2019/getting-to-know-off-and-weak-grid-consumers-the-unforeseen-impacts-of-energy-efficient- off-grid-appliances
Climate Action Tracker (2018): CAT Emissions Gaps - https://climateactiontracker.org/global/cat-emissions-gaps/
Dalberg (2018): 2018 Global Off-Grid Solar Market Trends - https://www.dalberg.com/our-ideas/2018-global-grid-solar-market-trends-report-released
Differ (2013): The way towards universal access - Putting value on electricity services. http://www.differgroup.com/analysis/ ESI Africa (2019): Mozambique introduces sharp electricity tariff increase - https://www.esi-africa.com/industry-sectors/ finance-and-policy/mozambique-introduces-sharp-electricity-tariff-increase/
ESMAP (2015): Beyond Connections: Energy Access Redefined - https://www.esmap.org/node/55526
Get Fit (2017): GET FiT Uganda Annual Report 2017 - https://www.getfit-reports.com/2017/
GGGI (2019): Off-grid solar power in Mozambique: opportunities for universal energy access and barriers to private sector participation
Gogla (2018-1): Employment opportunities in an evolving market - https://www.gogla.org/sites/default/files/resource_docs/job_crea-tion_in_the_og_sector_-_policy_note_1.pdf
Gogla (2018-2): Powering Opportunity: The Economic Impact of Off-Grid Solar - https://www.gogla.org/sites/default/files/resource_docs/gogla_powering_opportunity_report.pdf
Gogla - https://www.gogla.org
GSMA (2017): The Mobile Economy: Sub-Saharan Africa 2017 - https://www.gsmaintelligence.com/research/?file=7b-f3592e6d750144e58d9dcfac6adfab&download
Hystra (2017): Reaching scale in access to energy: Lessons from practitioners. - https://static1.squarespace.com/static/51bef-39fe4b010d205f84a92/t/594a8a4f86e6c05c7d651eb1/1498057514242/Energy_Report+%28ADB+excluded+%2B+license%29.pdf
IDCOL - http://www.idcol.org/
International Energy Agency (2016): 2016 data - https://www.iea.org/statistics/
International Energy Agency (2017): New Policy Scenarios, World Energy Outlook 2017 - https://www.iea.org/weo2017/
LIST OF REFERENCES
68
International Energy Agency (2016): World Energy Outlook 2016 - https://www.iea.org/weo/
Lazard (2017): Lazard's levelized cost of energy analysis - version 11.0 - https://www.lazard.com/media/450337/lazard-levelized-cost-of-energy-version-110.pdf
Lighting Africa (2018): Off-Grid Solar Market Trends Report 2018 - https://www.lightingafrica.org/wp-content/uploads/2018/02/2018_Off_Grid_Solar_Market_Trends_Report_Full.pdf
Lighting Global - https://www.lightingglobal.org
McKinsey (2015): Brighter Africa – The growth potential of the sub-Saharan electricity sector - https://www.mckinsey.com/~/media/
McKinsey/dotcom/client_service/EPNG/PDFs/Brighter_Africa-The_growth_potential_of_the_sub-Saharan_electricity_sector.ashx
Multiconsult (2018): Private Investments in Renewable Energy in Developing Countries - https://zero.no/wp-content/uploads/2018/12/ZERO-Norfund-Solklyngen_Report.pdf
Multiconsult (2019): Norwegian Industry Participation in the International Solar Market - https://www.eksportkreditt.no/wp-content/uploads/2019/03/Norwegian-Industry-Participation-in-the-International-Solar-Market_Multiconsult_28FEB2019.pdf
PowerForAll/Greentech (2018): Distributed Models for Grid Extension Could Save African Utilities Billions of Dollars - https://www.greentechmedia.com/articles/read/grid-extension-done-right-for-sub-saharan-africas-utilities#gs.3p4enq
Pueyo et al (2016): Cost and returns of renewable energy in Sub-Saharan Africa: a comparison of Kenya and Ghana - http://opendocs.ids.ac.uk/opendocs/bitstream/123456789/11297/1/ER190_CostandReturnsofRenewableEnergyinSubSaharanAfricaAComparisonof KenyaandGhana.pdf
PV Magazine (2018): The path to US$0.015/kWh solar power, and lower - https://www.pv-magazine.com/2018/05/25/ the-path-to-us0-015-kwh-solar-power-and-lower/
Statista (2015): Average duration of electricity outages per month in Africa as of 2015, by select country (in hours) - https://www.statista.com/statistics/617570/average-monthly-electricity-outage-africa-by-select-country/
Sustainable energy for all (2018-1): Energizing Finance: Understanding the Landscape 2018 - https://www.seforall.org/ EnergizingFinance2018
Sustainable energy for all (2018-2): Why Wait? Seizing the Energy Access Dividend - https://www.seforall.org/whywait
Teknisk Ukeblad (2019) (2019): Den norske solbransjen kan bli like stor som Norges tredje største eksportindustri - https://www.tu.no/artikler/den-norske-solbransjen-kan-bli-like-stor-som-norges-tredje-storste-eksportindustribr/459327?utm_source=newsletter&utm_medium=email&utm_campaign=newsletter-2019-03-02
Tesla (2019): Powerwall - https://www.tesla.com/powerwall
The Infrastructure Consortium for Africa (2017): Energy Financing Trends - https://www.icafrica.org/en/topics-programmes/energy/ energy-financing-trends/
Uganda Electricity Regulation Authoritiy (2018): GetFit Power Purchase Agreement - http://www.era.or.ug/index.php/resource-centre/regulatory-instruments/forms-templates/97-standardised-power-purchase-agreement-ppa-for-the-getfit-program/download
Urgewald (2018): NGOs Release List of World’s Top Coal Plant Developers. https://urgewald.org/medien/ngos-release-list-worlds-top-coal-plant-developers
UNFCCC (2014): AMS-I.L: Electrification of rural communities using renewable energy Version 3.0 - https://cdm.unfccc.int/ methodologies/DB/CCZKY3FSL1T28BNEGDRSCKS0CY0WVA
Wood Mackenzie (2019): How off-grid energy access is shaping the energy transition. https://www.woodmac.com/news/feature/how-off-grid-energy-access-is-shaping-the-energy-transition/
World Bank (2014): World Bank Group Support to Electricity Access, FY2000-2014. http://documents.worldbank.org/curated/en/416421468196746577/pdf/96812-v1-revised-Box394854B-PUBLIC-Electricity-Access.pdf
World Bank/Tibmerle et al (2016): Financial Viability of Electricity Sectors in Sub-Saharan Africa. https://openknowledge.worldbank.org/handle/10986/24869
69
Partner companies in the Solar Energy Cluster Norway that are active in the off-grid sector
For a full overview of all partners in the Norwegian Solar Energy Cluster, please visit our webpage: http://solenergiklyngen.no/partnerskap/
70
BRIGHT Products BRIGHT is a Norwegian solar product company catering to anyone who needs to be less dependent on the electrical grid, whether by choice or by living in off-grid or bad-grid communities. We believe that by spreading knowledge about the benefits of clean solar energy and by innovating products, distribution and financing of efficient small-scale solar products, we can solve the lighting and charging needs of millions of individuals.
Children use BRIGHT solar lamps to do homework at night. Women illuminate their paths for safety. Families power their homes. Travelers light up the dark. Entrepreneurs run their businesses and charge their phones.Four years after launch more than 2 million BRIGHT lamps are solving everyday problems for more than 8 million people.
www.bright-products.com
Solar Village Solar Village is a Norwegian company on a mission to improve African smallholder farmers' yields and standard of living. We develop, manufacture, distribute and finance smart solar energy solutions tailored to the needs and aspirations of smallholder farmers in Africa.
Our main product is the Battery Stick™. The stick powers two herbicide, insecticide, and fungicide sprayers of Micron, a leading man-ufacturer of specialist sprayers and weed control equipment. These sprayers have been developed specifically for the African small-holder user and are safe and highly labour and water saving. At home, the Battery Stick™ is a power source for a range of desirable household appliances (e.g. lamps, TV and fan).
Solar Village has been active in Zambia since 2015, working with two cotton companies, Alliance Ginneries and Parrogate, organising more than 100,000 farmers. Product trials with other cotton companies in 4 additional markets in West, East and Southern African markets are currently ongoing.
hwww.solarvillage.no
SUNami Solar SUNami Solar brings clean and affordable solar energy to off-grid homes and micro enterprises in Eastern Africa. Our core product is a solar home system with a proprietary integrated pay-as-you-go software platform. We offer our customers solar packages on a lease-to-own model, including income generating appliances, thereby contributing to creating new jobs, reduce poverty and increase societal inclusion.
SUNami Solar is an international company originated in Norway with offices in Norway, Kenya and Uganda, and a pilot in Malawi. We provide high-end services that not only gives access to solar energy and job appliance packages, but also to awareness building, entrepreneurship training, and free installation and on-site support of the product during its life span. Our vision is to bring electricity to every home in the rural areas of East-Africa at an affordable rate and build awareness of income generating opportunities with solar energy.
www.sunamisolar.com
Wattero Wattero is working to enable energy sharing in rural West Africa. We identify areas without connection to the power grid and offer affordable and high-quality solar solutions with flexible payment plans. We currently have one project running in Ivory Coast, project Godjiboué - securing 350 people affordable solar energy.
We are motivated by the possibility of providing affordable, solar energy to people who need it, enabling development, empowerment, and sustainability.
www.wattero.com
Current Solar Current Solar AS is a Norwegian developer of on and off – grid floating PV solutions on fresh water dams and reservoirs. The company can provide cost effective modular floating solutions in scale from 3.5 KW to several MW based on a proprietary composite mounting struc-ture which is combined with locally available HDPE pipes. The systems can be assembled locally with low cost and easy installation. An off – grid demo units has been in operation at a fish farm in Singapore since the summer of 2017. A 50 KW grid connected floating system will be installed at the University of Jaffna, Sri Lanka during 2019. www.currentsolar.no
Eltek Eltek is a world leading manufacturer of modular power conversion solutions. The larger portion of Eltek’s revenue is within power solutions for telecom infrastructure, including solar and solar-hybrid solutions. Eltek also offers a wide range of modular solutions for rural electrification and solar micro grids. With modular solutions the systems can easily be adapted to various energy and power requirements from below 1 kW to well above 100kW, for poor grid or off grid appli-cations. Through our parent company, Delta Electronics, Eltek do also have access to a full range of grid tied solar inverters.With offices in 40 countries and business in more than 100 countries, Eltek is in a position to provide complete turn key solutions.
www.eltek.com
GETEK Getek is offering both grid connected PV-solar systems and off grid solar hybrid systems. With our 30 years of experience we have proven to be a long-term solution for renewable energy. We have done projects in Antarctica, at the Bouvet Island, Uganda, Kuwait, Norway, among other countries.With our unique container-based APS (Autonomously Power System), for off grid and micro grid power supply, we offer electrical power wherever it is needed.GETEK is a full-service provider, as we are certified both to design and to install PV systems.
It is important for us to have a solid knowledge about our products, and by testing, installation and maintenance we are ensuring quality in every step of the way.
www.getek.no
Pico Solutions and Solar Home Systems
Micro-/mini-grid and commercial installations
GETEK
71
Asplan Viak Asplan Viak AS is one of the most experienced companies regarding solar energy in Norway, and has extensive experience with building integrated solar systems. We have participated in various building projects with solar energy in all phases form conceptual to follow up after construction, including the tendering process. We are also regarded as nationally leading on Life cycle assessment (LCA) and envi-ronmental analysis. We are experts in integrating solar energy into the concept of a building to achieve optimal solutions. We are also also partners in the Powerhouse collaboration and tenants in Powerhouse, www.powerhouse.no, and have first-hand experience with the daily operation and use of an energy positive building with solar cells.
www.asplanviak.no
Multiconsult Multiconsult is one of the leading firms of consulting engineers and designers in Norway and Scandinavia, with 2,850 permanent staff and expertise spanning a wide range of disciplines.
Multiconsult has the biggest and most qualified group of solar energy experts in Norway. Our experienced solar professionals work on national and international projects for a range of different clients (industry, utilities, EPCs, project developers, investors, IPPs, financing groups and governmental bodies) and of various sizes: from home systems and off-grid installations to multi MW-scale grid-connected power plants (ground-mounted, floating or on rooftops). We provide advisory services in all phases of solar projects, from early strate-gic guidance to feasibility assessments and detailed design, construction supervision, commissioning and monitoring.
www.multiconsultgroup.com
Norconsult Norconsult is Norways largest multidisciplinary consultancy firm, and one of the leading ones in the Nordic region. With innovative and targeted advice, we help customers achieve economic growth and success – for a sustainable and healthy society.
We find effective and renewable energy solutions to be important. Solar energy is becoming a natural integrated part of these solu-tions, either as solar PV or thermal energy, or both.We provide assistance the entire way from possibility studies, project development, technical design, creation of tender papers, aqqui-sition and take-over.
On the international market, Norconsult operates mainly in Africa.NB Solar Africa is a joint venture company that will develop solar PV /hybrid power plants and offers comprehensive service to inves-tors and large consumers of power and IPPs.
www.norconsult.no
Ressurs & Miljø Resources & Environment (Ressurs & Miljø) was established in January 2010 by experienced specialists within water-, energy- and environmental - sector. We have long experience with energy efficiency and renewable energy in industry as well as service- and commercial buildings in developing countries.
Our main focus is solar energy, which is installed in combination with both other renewables and diesel gensets. We provide support in all phases of the project, from the idea to start up and take over. We work with different technologies, including photovoltaic and solar thermal systems, mounted on ground or on all types of roofs and facades, including BIPV.
Resources & Environment has clients within water, energy and environment. Advising both in Norway and abroad. We work as advisors and dialogue collaborators for industrial companies, commercial buildings and public authorities.
www.where.no
Kube Energy Kube Energy provides international organizations with off-grid solar energy solutions. Our goal is to help these organizations transition from diesel generators to solar to reduce operating costs, improve aid effectiveness and reduce their environmental footprint and CO2 emissions.
Kube Energy finances, installs, owns and maintains the solar systems for a monthly fee, allowing our customers to transition to solar and start realizing cost savings from day one.
www.kubeenergy.com
Sunergy SunErgy is a Norwegian company being active in off grid villages solar electrification in 92 villages with 116 000 families or 600 000 persons in the Southwest region of Cameroon according to agreement with the Republic of Cameroon.
On the same grid SunErgy also offers cable TV and Internet, thus giving the villagers access to the outside world, enabling them to escape poverty, moving into a brighter and more prosperous future through economic growth and development.
SunErgy cooperates and have excellent support from the governments of Norway and Cameroon as well as world recognized and leading equipment suppliers.
www.sunergypower.org
Engineering consultancy and project management
72
Software development and smart solutions
Technology development and production
Aventa Solar Aventa is a Norwegian solar heat company that has developed innovative solar thermal energy solutions for structural integration. The STE-concept gives economically competitive solar energy in the form of roof and/or facade coverage. In addition, we deliver self-circulat-ing (thermal syphon) solar heat systems that are especially viable for creating hot tapwater in refugee camps. The activity encompasses nearly the entire value chain, from product development to installation and follow-up on solar thermal energy systems. The main goal is concept-development and production. We offer complete solutions containing solar thermal energy systems, heat storages, and electronic management systems. In addition, Aventa is in a strong position in research communities, and we are active partners of FoU in large national and international collaboration projects. www.aventa.no
Norsun NorSun specializes in mono crystalline N-type wafers for high efficiency solar cells. Since the start up of the factory in Årdal 10 years ago, NorSun has delivered wafers equivalent to 2,8 GW to tier 1 cell producers such as Sunpower, LGE, Tesla (Solarcity) and Panasonic. Sunpower have set the world record in cell efficiency of 25% with NorSun wafers. The high efficiency has also made NorSun a leader in delivering wafers for roof top applications. Due to sustainable production in Norway and focus on the environmental impact of wafer production, NorSun is able to produce wafers with the world’s lowest CO2 footprint as certified by French authorities.
www.norsun.no
Pixii Pixii is a Norwegian technology company that develops innovative power conversion systems for battery-based energy storage for various applications, both off-grid and grid-tied. The Pixii system can be configured for services such as solar energy optimisation, gen-erator optimisation, and support of the (micro) grid’s power capacity and quality. The power capacity for each complete Pixii system is in the range of 3-120kW. Additional systems can be added in parallel to increase the total capacity. Pixii can provide both complete energy storage systems as well as the power conversion units to other system integrators.
www.pixii.com
REC Founded in Norway in 1996, REC is a leading vertically integrated solar energy company.Through integrated manufacturing from silicon to wafers, cells, high-quality panels and extending to solar solutions with low carbon footprint.
REC provides the world with a reliable source of clean energy. REC’s renowned product quality is supported by the lowest warranty claims rate in the industry.
REC is a Bluestar Elkem company with headquarters in Norway and operational headquarters in Singapore. REC employs more than 2,000 employees worldwide, producing 1.5 GW solar panels annually.
www.recgroup.com
Tarpon Solar Tarpon Solar specializes in flexible thin film solar cells reinforced by membrane technology for commercial, public and private use. Our solar membranes combine the advantages of capturing renewable solar energy with providing protection against the sun, wind and rain.
We can customize the membranes to suit the requirements of every application. Our products are light, strong and long lasting solar membranes with the most suitable solar cell technologies for each project. We are developing an automated and cost-effective production method that enables supply of large and small quantities of products of all shapes, sizes and colors.
The flexible solar membranes can be used as stand-alone structures, on a tent framework, awnings on a building and many other appli-cations where traditional solar panels are not suitable.
www.tarponsolar.no
Eyasys Eyasys provides complete solutions in the crossroads of safety, security, software and if required customized hardware.The founders and management team of Eyasys have a broad experience from the system engineering, IT security and software devel-opment for government sector, oil and gas industry and telecom. We have background from leading global corporations and delivering solutions to demanding customers on all continents.
In Eyasys we focus on providing innovative solutions with high quality. We especially focus on long-term mutually beneficial customer relationships.
www.eyasys.no
mPower Technology AS Development of products with related digital infrastructure, contributing to the establishment of jobs, particularly in developing coun-tries. Distribution and roll-out of mentioned products together with innovative business models, alone or in cooperation with selected partners, with complementary infrastructure and/or products.First product out (under testing/piloting): mPowerStation - a solar driven charging station for mobile phones, with a digital backend and a self-service payment and identification App for the phones to be charged. One mPowerStation in operation = revenue base for one person.
73
Legal advisors
Innovation and investments
Differ Differ's business idea is to help scale up small-scale carbon reduction technologies (e.g. PV and energy efficiency) in developing countries through investing in start-ups (cash and sweat equity), developing our own concepts and companies, and offer considerable advising. Differ also delivers solar systems and services to private households, schools, health clinics, multi-purpose centres and other smaller building constructions in developing countries. Differ is focusing on humanitarian projects, working with both organizations within the UN and NGOs.The company was founded in November 2010 by entrepreneurs that previously have started and developed companies like Renewable Energy Corporation (REC) and Point Carbon.
www.differgroup.com
Empower New Energy Empower New Energy is a renewable impact investment company with a mandate to invest equity and raise climate finance for small and medium scale projects, typically 1-10 MW projects that have a long-term power sales agreement with the energy off-taker. Initially, we are focusing on Africa with the intention to expand to selected markets in North Africa, Asia and South America. We work in close collaboration with our project development partners, preparing the projects for investment by our impact investment fund. Our projects ensure both cost savings and reliable electricity supply for the off-takers and reduce their vulnerability of natural disasters and fluctuating fossil fuel prices. Our value proposition is to provide a lean and flexible financing platform which allows for diverse, medium scale projects to be built around industry, agriculture and commercial activity, with the primary aim to increase the speed of change from fossil energy to a renewable energy society.Our main office and investors are in Norway. Our project office in Kenya, and we have a representative office in Ghana
www.empowernewenergy.com
TechBridge Invest TechBridge Invest builds and invests in scalable, sustainable businesses in East Africa. We create value through training, investments and active ownership.
Our flagship company is SUNami Solar Ltd, where the vision is to bring electricity to every home in Africa. It is made affordable by offering pay-as-you-go leasing services as well as installation and mainantence on site. SUNami also offers job creation packages to generate income to the households.
www.techbridgeinvest.com
Business Law Firm SANDS
SANDS is one of the largest and most well-known business law firms in Norway, with a team of over 160 lawyers. We are a full service business law firm with offices in Oslo, Trondheim, Bergen, Stavanger, Ålesund, Tromsø, and Tønsberg.
SANDS has lawyers with condiderable international experience, and legal or management experience from industry. Our organization is seemless, and provides a wide range of competence regardless of location.
SANDS has a special interest in the energy sector, and renewable energy in particular. We provide assistance to several companies and consider solar energy the most relevant in the field of renewables in the years to come. This should also provide opportunities and growth for those companies.
www.sands.no
EMPOWERNEW ENERGY

74