CHE 102: Chemistry in Context - Gustavus Adolphus...
63
CHE 102: Chemistry in CHE 102: Chemistry in Context Context Amanda Nienow Amanda Nienow Spring 2009 Spring 2009 Some slides have been prepared by Carl E. Heltzel, Environmental Risk Management Consulting Company and are copyrighted by McGraw-Hill
Transcript of CHE 102: Chemistry in Context - Gustavus Adolphus...

CHE 102: Chemistry in CHE 102: Chemistry in ContextContext
Amanda NienowAmanda NienowSpring 2009Spring 2009
Some slides have been prepared by Carl E. Heltzel, Environmental Risk Management Consulting Company and are copyrighted by McGraw-Hill

Today: Feb 10, 2009Today: Feb 10, 2009
IntroductionsIntroductionsSyllabusSyllabus–– Class website and other onClass website and other on--line resourcesline resources–– Course GoalsCourse Goals–– Activities for Participation PointsActivities for Participation PointsGroup Activity Group Activity –– EnvEnv Issues and ChemistryIssues and ChemistryChapter 1: The Air We BreatheChapter 1: The Air We Breathe

3
Group ActivityGroup Activity
Class Class –– come up with a list of environmental come up with a list of environmental issuesissuesWork in groups of 3Work in groups of 3--44List List howhow chemistry is related to your chemistry is related to your environmental issue or environmental issue or whywhy it might be it might be important in solving the problemimportant in solving the problem……

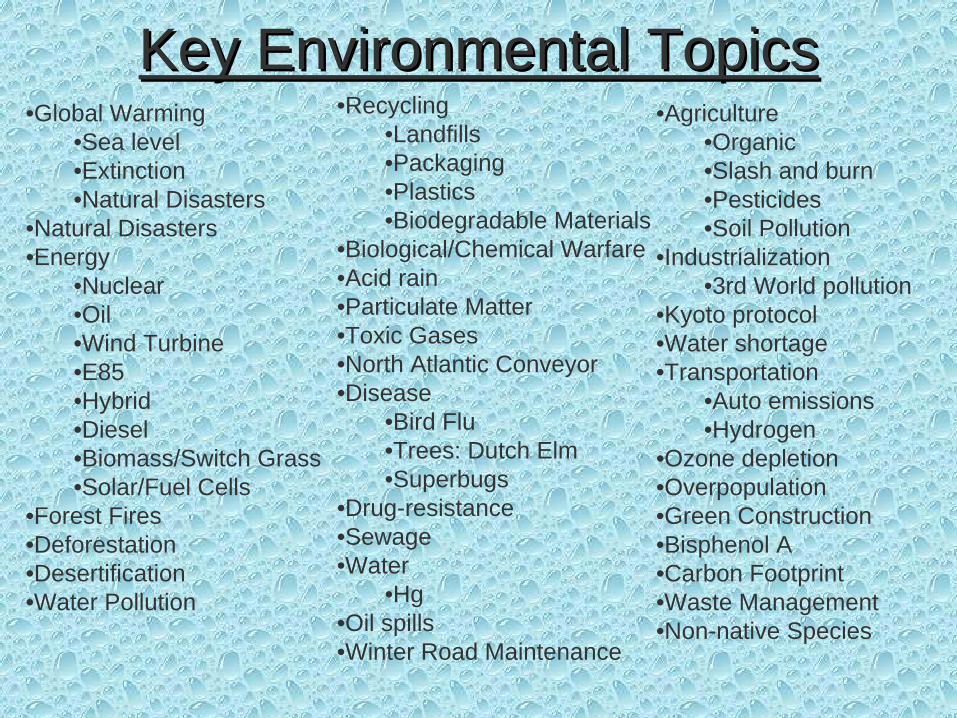
Key Environmental Topics Key Environmental Topics •Recycling
•Landfills•Packaging•Plastics•Biodegradable Materials
•Biological/Chemical Warfare•Acid rain•Particulate Matter•Toxic Gases•North Atlantic Conveyor•Disease
•Bird Flu•Trees: Dutch Elm•Superbugs
•Drug-resistance•Sewage•Water
•Hg•Oil spills•Winter Road Maintenance
•Agriculture•Organic•Slash and burn•Pesticides•Soil Pollution
•Industrialization•3rd World pollution
•Kyoto protocol•Water shortage•Transportation
•Auto emissions•Hydrogen
•Ozone depletion•Overpopulation•Green Construction•Bisphenol A•Carbon Footprint•Waste Management•Non-native Species
•Global Warming•Sea level•Extinction•Natural Disasters
•Natural Disasters•Energy
•Nuclear•Oil•Wind Turbine•E85•Hybrid•Diesel•Biomass/Switch Grass•Solar/Fuel Cells
•Forest Fires•Deforestation•Desertification•Water Pollution

5
Focus topicsFocus topicsEnergyEnergy–– FuelsFuels–– TransportationTransportation–– Alternative technologyAlternative technology
Global Climate ChangeGlobal Climate Change–– DataData–– Public policyPublic policy–– Economic impactEconomic impact
AirAir–– Acid rainAcid rain–– Mercury (Hg)Mercury (Hg)–– Ozone holeOzone hole
WaterWater–– Drinking waterDrinking water–– WastewaterWastewater–– AgricultureAgriculture
Human ActivityHuman Activity–– PopulationPopulation–– Waste ControlWaste Control–– IndustrializationIndustrialization
•Select group of interest
•Gather with group members
•Select subtopic
•Think of pro‐environment
and “smokestack”
orientation
•Scientific, quantitative,
analytical

For Next Time (Thurs 2/12)For Next Time (Thurs 2/12)Review/Print Class SlidesReview/Print Class SlidesRead Chapter 1Read Chapter 1SignSign--Up for AQI updates for your chosen cityUp for AQI updates for your chosen cityDo Do ““Consider ThisConsider This”” 1.6 for Minneapolis area 1.6 for Minneapolis area
For Next Tuesday (2/17)For Next Tuesday (2/17)Prepare for Lab: Read Prepare for Lab: Read ““Some Notes About Some Notes About Laboratory SafetyLaboratory Safety”” and and ““Lab 1: What am I Lab 1: What am I Breathing?Breathing?”” in Lab Manualin Lab Manual

Chapter One
The Air We Breathe
What is in the air that we breathe?
Can air be dangerous to our health?
How can understanding chemistry help us decide?

The Composition of Our Air
It’s a mixture – a physical combination of two or more substances present in variable amounts. 1.2

What’s in a Breath?
Typical Composition of Inhaled and Exhaled Air
Substance Inhaled air (%)
Exhaled air (%)
Nitrogen 78.0 75.0Oxygen 21.0 16.0Argon 0.9 0.9Carbon dioxide
0.04 4.0
Water 0.0 4.0
1.2

What about What about ““otherother””??Argon (Argon (ArAr) inert gas 0.9 %) inert gas 0.9 %Carbon dioxide (COCarbon dioxide (CO22) 0.04 %) 0.04 %Neon (Ne) 18.2 parts per millionNeon (Ne) 18.2 parts per millionHelium (He) 5.2 parts per millionHelium (He) 5.2 parts per millionKrypton (Kr) 1.1 parts per millionKrypton (Kr) 1.1 parts per millionSulfur dioxide (SOSulfur dioxide (SO22) 1.0 parts per million) 1.0 parts per millionMethane (CHMethane (CH44) 2.0 parts per million) 2.0 parts per millionHydrogen (HHydrogen (H22) 0.5 parts per million) 0.5 parts per millionNitrous Oxide (NNitrous Oxide (N22O) 0.5 parts per millionO) 0.5 parts per millionXenon (Xenon (XeXe) 0.09 parts per million) 0.09 parts per millionOzone (OOzone (O33)) 0.07 parts per million0.07 parts per millionNitrogen dioxide Nitrogen dioxide -- NONO2 2 0.02 parts per million0.02 parts per millionIodine (I) 20.01 parts per millionIodine (I) 20.01 parts per millionCarbon monoxide (CO) traceCarbon monoxide (CO) traceRadon (Radon (RnRn) trace) traceAmmonia (NHAmmonia (NH33) trace) traceLead (Lead (PbPb) trace) trace
Argon (Argon (ArAr) inert gas 0.9 %) inert gas 0.9 %Carbon dioxide (COCarbon dioxide (CO22) 0.04 %) 0.04 %Neon (Ne) 0.0018%Neon (Ne) 0.0018%Helium (He) 0.00052%Helium (He) 0.00052%
Criteria PollutantsCriteria Pollutants
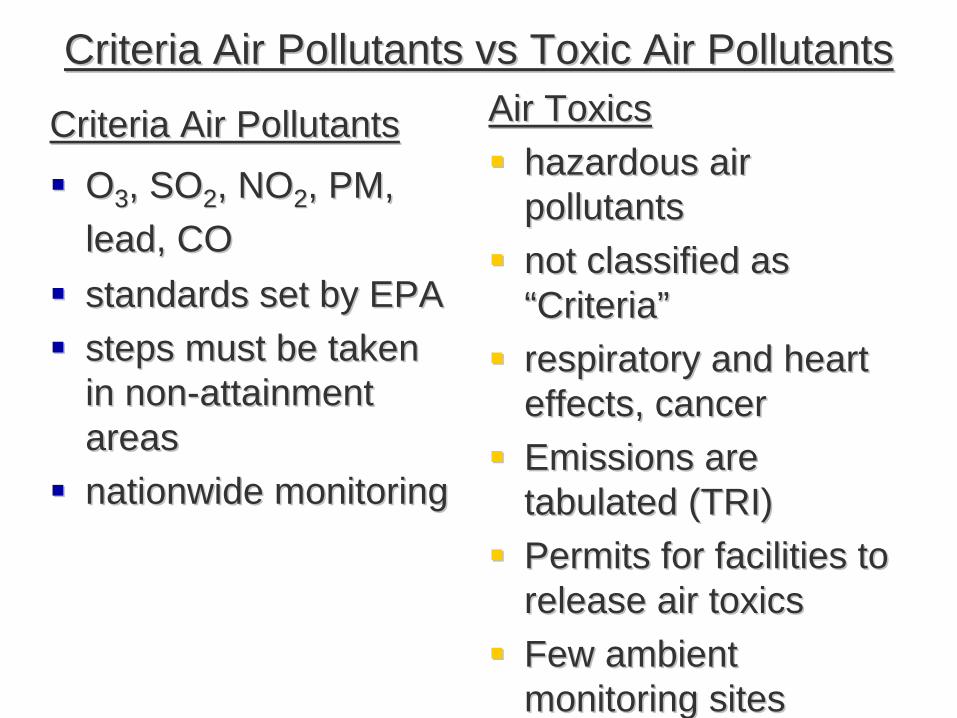
Criteria Air Pollutants Criteria Air Pollutants vsvs Toxic Air PollutantsToxic Air Pollutants
Criteria Air PollutantsCriteria Air Pollutants
OO33, SO, SO22, NO, NO22, PM, , PM, lead, COlead, COstandards set by EPAstandards set by EPAsteps must be taken steps must be taken in nonin non--attainment attainment areasareasnationwide monitoringnationwide monitoring
Air ToxicsAir Toxicshazardous air hazardous air pollutantspollutantsnot classified as not classified as ““CriteriaCriteria””respiratory and heart respiratory and heart effects, cancereffects, cancerEmissions are Emissions are tabulated (TRI)tabulated (TRI)Permits for facilities to Permits for facilities to release air toxicsrelease air toxicsFew ambient Few ambient monitoring sitesmonitoring sites
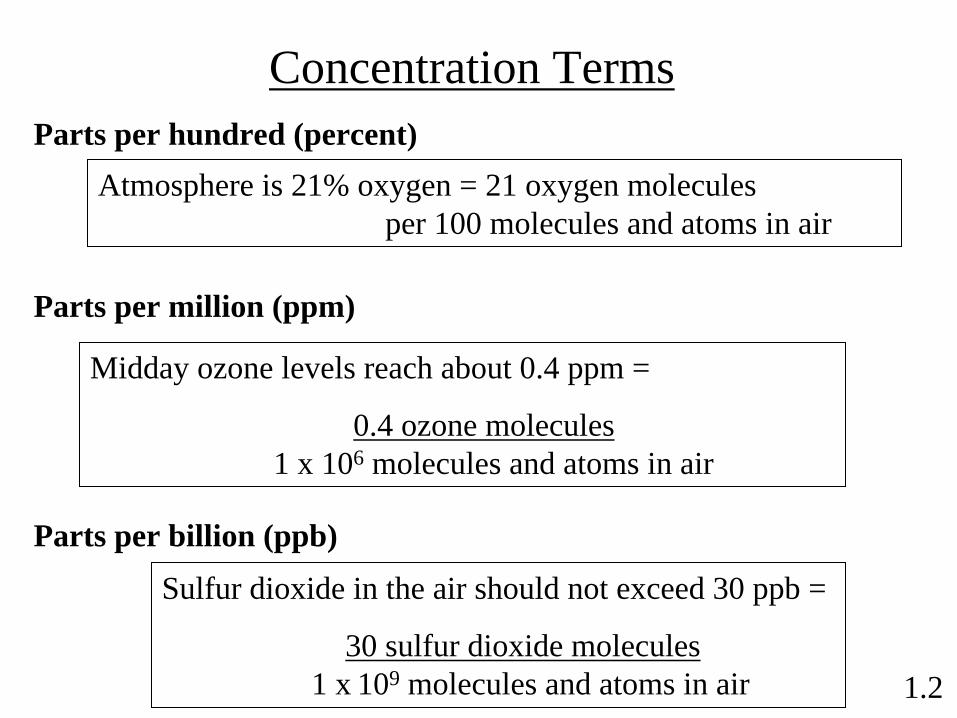
Concentration TermsParts per hundred (percent)
Parts per million (ppm)
Parts per billion (ppb)
Atmosphere is 21% oxygen = 21 oxygen molecules per 100 molecules and atoms in air
Midday ozone levels reach about 0.4 ppm =
0.4 ozone molecules 1 x 10⁶ molecules and atoms in air
Sulfur dioxide in the air should not exceed 30 ppb =
30 sulfur dioxide molecules 1 x 10⁹ molecules and atoms in air 1.2
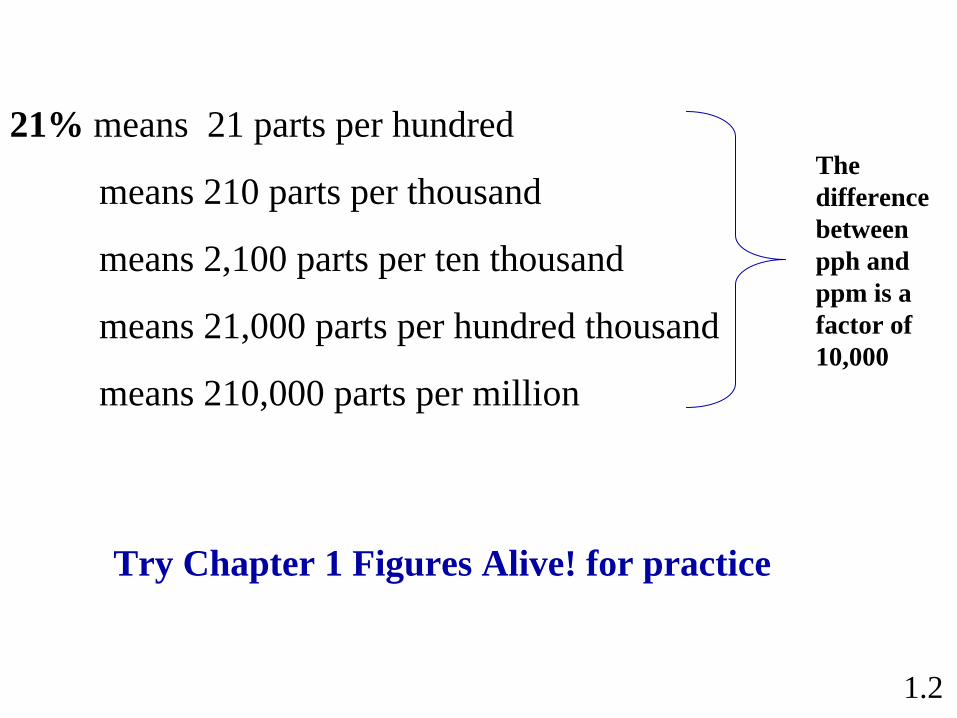
21% means 21 parts per hundred
means 210 parts per thousand
means 2,100 parts per ten thousand
means 21,000 parts per hundred thousand
means 210,000 parts per million
The difference between pph and ppm is a factor of 10,000
Try Chapter 1 Figures Alive! for practice
1.2

Scientific Notation: A review11000 =
1.4
0.00021 =
1.1 x 10⁴
2.1 x 10⁻⁴
1.021 x 10-30.001021 =
1730 =
6.022 x 10-23 = 0.000,000,000,000,000,000,000,06022
602,200,000,000,000,000,000,000 = 6.022 x 10²³
Note: same number of significant figures on both sides of each example.
1.73 x 10³

The Bad Gases
Carbon monoxideOzoneSulfur oxides and nitrogen oxidesParticulate matter, PM
1.3
We’ll take a closer look at each of these each in turn…

EPA’s Air Quality Index
Air Quality Index (AQI) Values
Levels of Health Concern
Colors
When the AQI is in this range:
...air quality conditions are:
...as symbolized by this color:
0−50 Good Green51–100 Moderate Yellow101–150 Unhealthy for
sensitive groupsOrange
151–200 Unhealthy Red201–300 Very unhealthy Purple301–500 Hazardous Maroon
1.3

Year Good(0–50)
Moderate(51–100)
Unhealthy for Sensitive Groups
(101–150)
Unhealthy(>150)
1999 223 82 34 262000 166 147 37 162001 180 144 25 162003 196 136 24 92004 175 152 29 102005 138 180 39 72006 77 88 13 4
Table 1.4 Air Quality Index values for Houston
1.3
Variations reflect those in the local weather patterns. Regional events such as forest fires and volcanic eruptions can influence air quality.

The Regions of the Lower Atmosphere
Atmospheric pressure changes with altitude1.5

Temperature in the AtmosphereTemperature in the AtmosphereTroposphere = where we liveTemperature decreases with increasing altitude
StratosphereTemperature increases with increasing altitude
Temperature inversionTemporarily, the temperature in the troposphere increases with increasing altitude… forms a “cap” so pollution can’t escape

The Regions of the Atmosphere
1.5
Have you ever been in a plane landing in Denver, CO?
You may have experienced being thrust forward as the plane uses more energy to stop. There are fewer air molecules at that height, reducing the amount of friction, so a greater amount of energy is needed to stop the plane.
Why does it take longer to cook an egg in Denver than it does in New Orleans?
There is less air pressure at higher altitudes. Water boils when the vapor pressure of the water molecules exceeds that of the localized air pressure. Because there is less air pressure at higher altitudes, more energy must be supplied (longer time) to get the temperature of the water high enough to cook the egg.

Today: Feb 12, 2009Today: Feb 12, 2009
Projects: Meet with Focus GroupsProjects: Meet with Focus GroupsChapter 1 Notes (Chapter 1 Notes (ConCon’’tt))InIn--class Worksheetclass WorksheetFurther discussion/description of AQI Further discussion/description of AQI monitoringmonitoringNewspaper Presentation by Dr. Newspaper Presentation by Dr. NienowNienowDiscussion of LabDiscussion of Lab
Key Environmental Topics Key Environmental Topics •Recycling
•Landfills•Packaging•Plastics•Biodegradable Materials
•Biological/Chemical Warfare•Acid rain•Particulate Matter•Toxic Gases•North Atlantic Conveyor•Disease
•Bird Flu•Trees: Dutch Elm•Superbugs
•Drug-resistance•Sewage•Water
•Hg•Oil spills•Winter Road Maintenance
•Agriculture•Organic•Slash and burn•Pesticides•Soil Pollution
•Industrialization•3rd World pollution
•Kyoto protocol•Water shortage•Transportation
•Auto emissions•Hydrogen
•Ozone depletion•Overpopulation•Green Construction•Bisphenol A•Carbon Footprint•Waste Management•Non-native Species
•Global Warming•Sea level•Extinction•Natural Disasters
•Natural Disasters•Energy
•Nuclear•Oil•Wind Turbine•E85•Hybrid•Diesel•Biomass/Switch Grass•Solar/Fuel Cells
•Forest Fires•Deforestation•Desertification•Water Pollution

23
Focus topicsFocus topicsEnergyEnergy–– FuelsFuels–– TransportationTransportation–– Alternative technologyAlternative technology
Global Climate ChangeGlobal Climate Change–– DataData–– Public policyPublic policy–– Economic impactEconomic impact
AirAir–– Acid rainAcid rain–– Mercury (Hg)Mercury (Hg)–– Ozone holeOzone hole
WaterWater–– Drinking waterDrinking water–– WastewaterWastewater–– AgricultureAgriculture
Human ActivityHuman Activity–– PopulationPopulation–– Waste ControlWaste Control–– IndustrializationIndustrialization
•Select group of interest
•Gather with group members
•Select subtopic
•Think of pro‐environment
and “smokestack”
orientation
•Scientific, quantitative,
analytical

Classifying Matter All Matter
Pure Substances Mixtures
Can it be separated by a physical process?
CompoundsElements
YESNO
Can it be broken down into simpler ones by chemical means?
NO YES
1.6

Classifying MatterClassify each of these as an element, a compound, or a mixture:
carbon dioxide
nickel
cocaine
water
compound
element
compound
compound
fluorine
table salt
soap
sea water
element
compound
mixture
mixture
1.6

Group
Period
The Periodic Table
http://www.privatehand.com/flash/elements.html

A space filling model for a water molecule, H2 O
Oxygen atom
Two hydrogen atoms
A molecule is a fixed number of atoms held together by chemical bonds in a certain spatial arrangement.
The chemical formula symbolically represents the type and number of each element present.
1.7

Many nonmetals occur as diatomic
(made up of two atoms) molecules.
H2 N2 O2 Cl2
1.7

2. Prefixes are used to designate the number of each type of element:
Naming Binary Compounds
number of atoms prefix1 mono2 di3 tri4 tetra5 penta6 hexa7 hepta8 octa9 nona10 deca
1.8

2. Prefixes are used to designate the number of each type of element:
Naming Binary Compounds of Nonmetals
1.8
N2 O = dinitrogen monoxide (laughing gas)
P2 O5 =diphosphorous pentoxideNotice the dropped “a” from “penta” –when both the prefix and suffix (in this case “oxide”) end and start, respectively, in a vowel, the vowel of the prefix is typically dropped; pentoxide rather than pentaoxide.
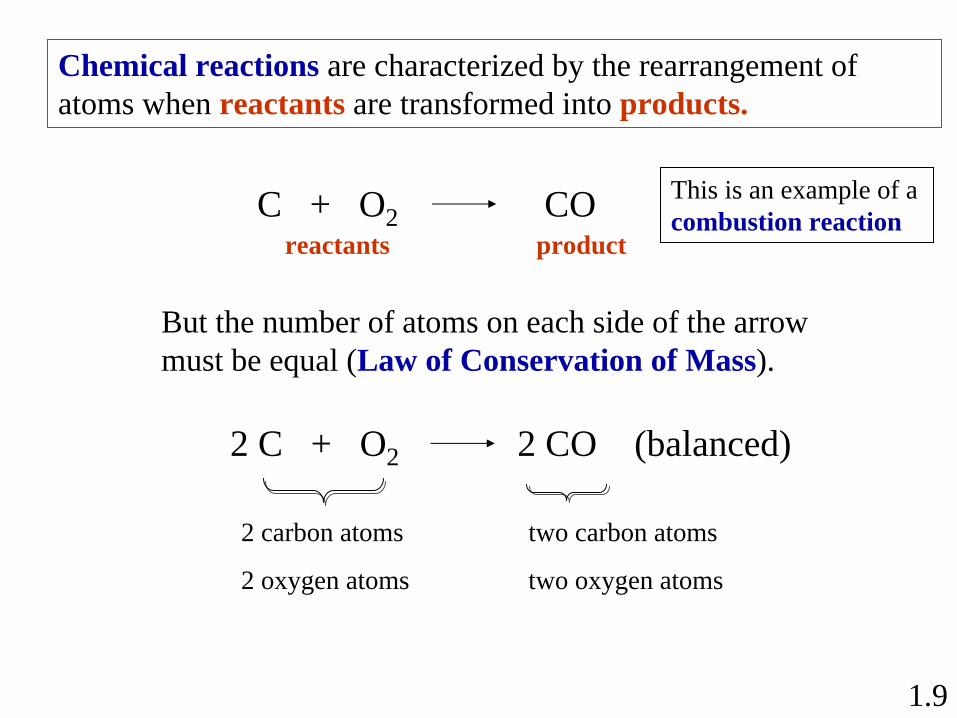
Chemical reactions are characterized by the rearrangement of atoms when reactants are transformed into products.
C + O2 COreactants product
But the number of atoms on each side of the arrow must be equal (Law of Conservation of Mass).
2 C + O2 2 CO (balanced)
2 carbon atoms two carbon atoms
2 oxygen atoms two oxygen atoms
This is an example of a combustion reaction
1.9

2 C + O2 2 CO
1.9
Another look, pictorially – using space-filling models

Balancing equations:
-if an element is present in just one compound on each side, balance it first
-balance anything that exists as a free element last
-check when done – same number of atoms, and same total charge (if any) on both sides
C3 H8 + O2 CO2 + H2 O
C3 H8 + 5 O2 3 CO2 + 4 H2 O
3 C atoms8 H atoms
10 O atoms
3 C atoms8 H atoms
10 O atoms1.10

HydrocarbonsHydrocarbons
Compounds of hydrogen and carbonCompounds of hydrogen and carbonNaming hydrocarbons: Naming hydrocarbons: MMother other EEats ats PPeanut eanut BButterutter–– MethaneMethane–– EthaneEthane–– PropanePropane–– ButaneButane
1 Carbon1 Carbon2 Carbons2 Carbons3 Carbons3 Carbons4 Carbons4 Carbons

Combustion ReactionsCombustion ReactionsHydrocarbons combust in the presence of Hydrocarbons combust in the presence of oxygen (and ignition source)oxygen (and ignition source)
CHCH44 + O+ O22 COCO22 + H+ H22OO
CHCH44 + O+ O22 CO + HCO + H22OO
CHCH44 + O+ O22 C + HC + H22OO
Complete CombustionComplete Combustion
Incomplete CombustionIncomplete Combustion
““VeryVery”” Incomplete CombustionIncomplete Combustion
Soot
In an automobile engine, some combination of these reactions occIn an automobile engine, some combination of these reactions occurs. urs.
Reactions Unbalanced!

Consider This 1.6 Consider This 1.6 …… MSPMSPDoes MSP have better or worse Air Quality Does MSP have better or worse Air Quality than Houston? than Houston? What are the major pollutants for MSP? What are the major pollutants for MSP?

Consider This 1.6Consider This 1.6…… MSPMSP
20072007
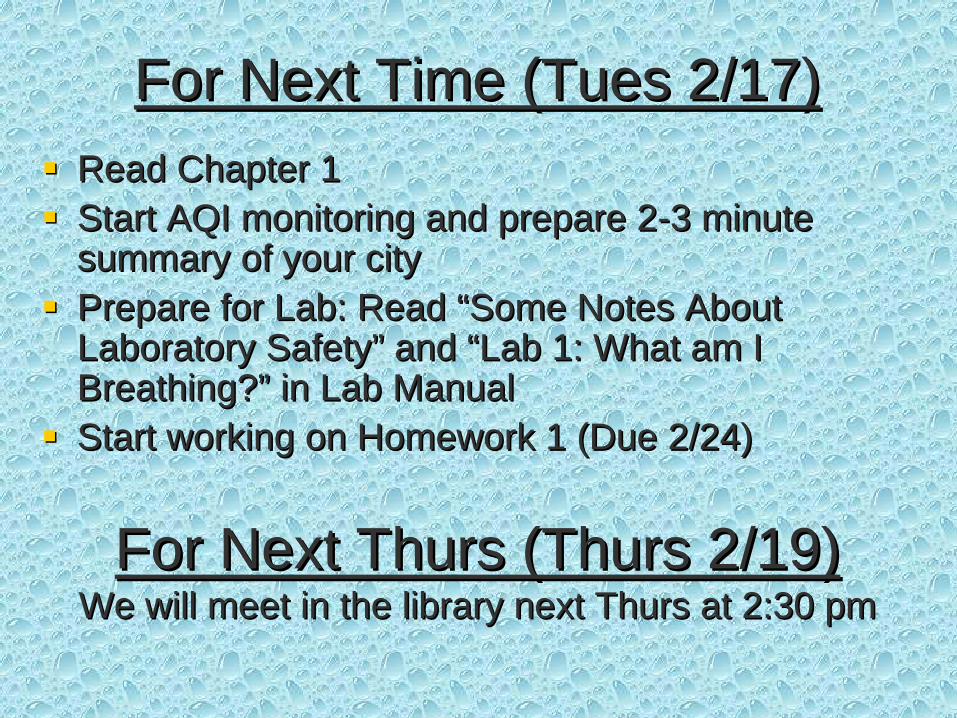
For Next Time (Tues 2/17)For Next Time (Tues 2/17)Read Chapter 1Read Chapter 1Start AQI monitoring and prepare 2Start AQI monitoring and prepare 2--3 minute 3 minute summary of your citysummary of your cityPrepare for Lab: Read Prepare for Lab: Read ““Some Notes About Some Notes About Laboratory SafetyLaboratory Safety”” and and ““Lab 1: What am I Lab 1: What am I Breathing?Breathing?”” in Lab Manualin Lab ManualStart working on Homework 1 (Due 2/24)Start working on Homework 1 (Due 2/24)
For Next Thurs (Thurs 2/19)For Next Thurs (Thurs 2/19) We will meet in the library next Thurs at 2:30 pmWe will meet in the library next Thurs at 2:30 pm

Today: Feb 17, 2009Today: Feb 17, 2009
Newspaper Presentations: Ally Newspaper Presentations: Ally PeltonPelton and and Ricardo TorresRicardo TorresTips for AQI City Tips for AQI City ““PresentationsPresentations””Finish Chapter 1 NotesFinish Chapter 1 NotesLab 1: What am I Breathing? Lab 1: What am I Breathing?

The Bad Gases
Carbon monoxideSulfur oxides and nitrogen oxidesOzoneParticulate matter, PM
1.3
We’ll take a closer look at each of these each in turn…
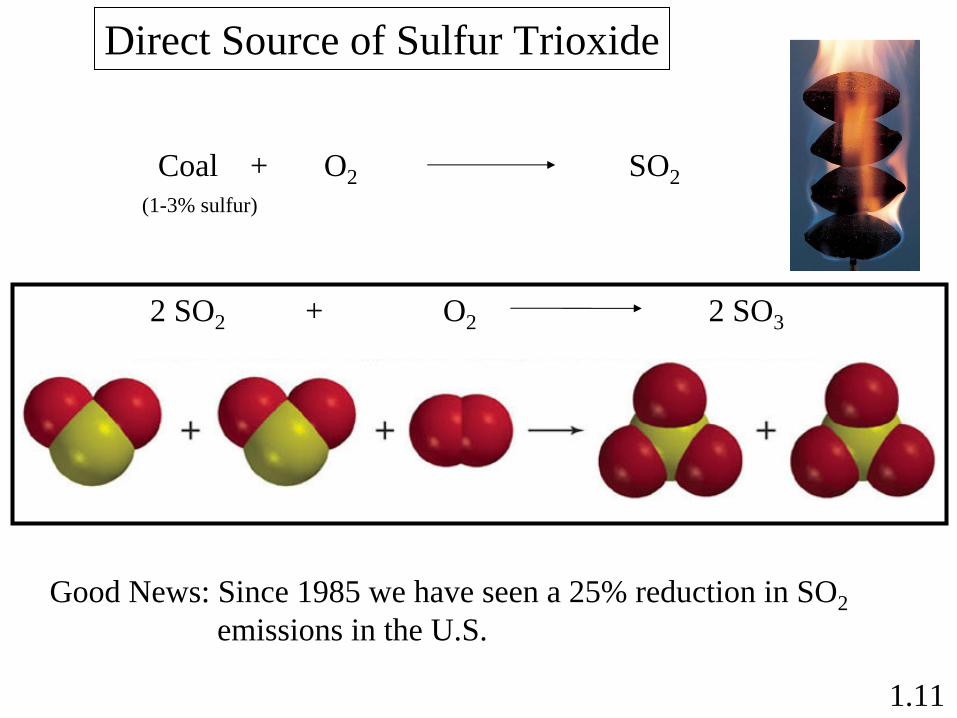
Coal + O2 SO2(1-3% sulfur)
1.11
2 SO2 + O2 2 SO3
Direct Source of Sulfur Trioxide
Good News: Since 1985 we have seen a 25% reduction in SO2 emissions in the U.S.

1.11
Direct Source of Nitrogen Oxides
N2 + O2 + high temp 2 NO(nitrogen oxide)
High temperatures from auto engine or
coal-fired power plant
NO is very reactive:
2 NO + O2 2 NO2
Simplified version of chemistry that occurs

1.12
Formation of Tropospheric Ozone
NO2 NO + O
O + O2 O3
sunlight O3 is not directly emitted, it is a secondary pollutant- produced from other pollutants.
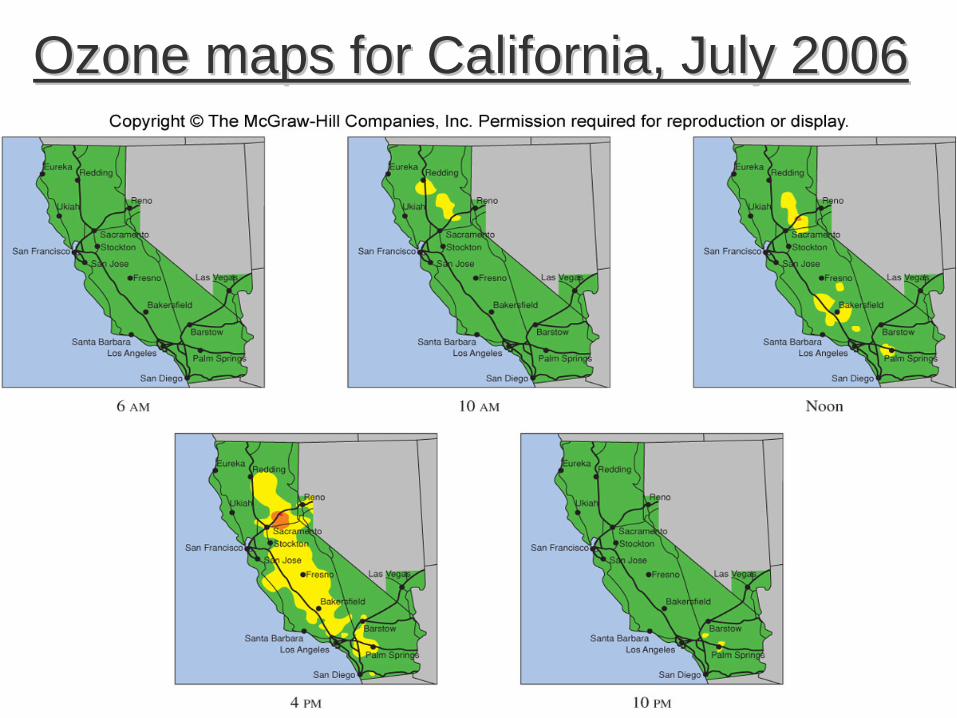
Ozone maps for California, July 2006Ozone maps for California, July 2006

Ozone (O3 )
If one breath of air contains 2 x 10²² molecules and atoms, and the acceptable ozone level is 0.12 ppm, how many molecules of O3 are in each breath?
2 x 10²² molecules and atoms in a breath of air x 0.12 O3 molecules1 x 106 molecules and atoms in air
= 2 x 10¹⁵ O3 molecules in a breath
How many oxygen atoms are in each breath?
2 x 10¹⁵ O3 molecules x 3 O atoms___1 O3 molecules = 6 x 10¹⁵ O atoms
1.12

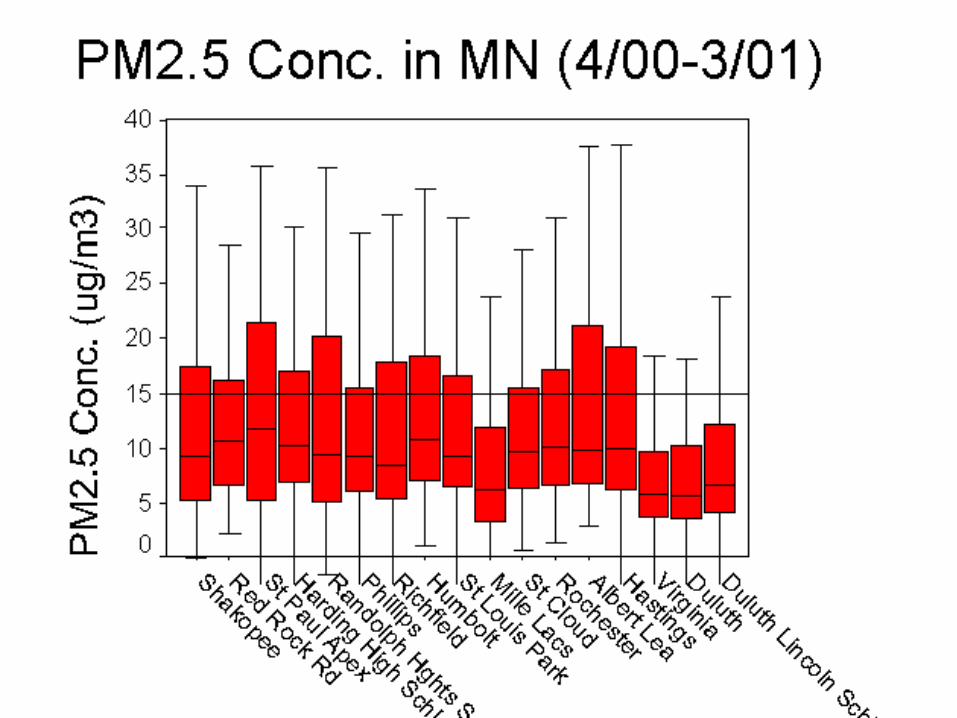
What is Particulate Matter (PM)?What is Particulate Matter (PM)?Mixture of solid particles and liquid droplets Mixture of solid particles and liquid droplets composed of many individual chemicalscomposed of many individual chemicals–– Generally a solid core with chemicals on the Generally a solid core with chemicals on the
surfacesurface
PMPM1010 -- particulate matter < 10 micrometers particulate matter < 10 micrometers
PMPM2.5 2.5 -- particulate matter < 2.5 micrometersparticulate matter < 2.5 micrometers
Diameter of average human hair is 100 micrometersDiameter of average human hair is 100 micrometers

5 35

National Ambient Air Quality National Ambient Air Quality Standards (NAAQS)Standards (NAAQS)
PMPM2.52.5
––1515 μμg/mg/m33 annual averageannual average––65 65 μμg/mg/m33 2424--hour average hour average PMPM1010
––50 50 μμg/mg/m33 annual averageannual average––150 150 μμg/mg/m33 2424--hour averagehour average

Albert Lea Air Toxic
Site
Annual standard
US background
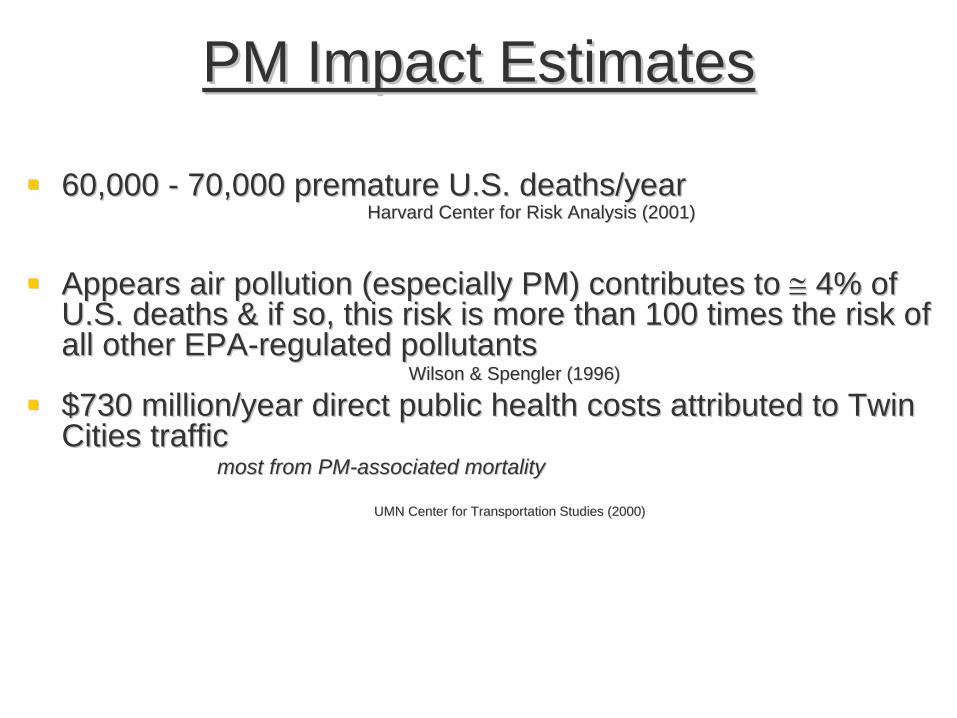
PM Impact EstimatesPM Impact Estimates
60,000 60,000 -- 70,000 premature U.S. deaths/year70,000 premature U.S. deaths/yearHarvardHarvard Center for Risk Analysis (2001)Center for Risk Analysis (2001)
Appears air pollution (especially PM) contributes to Appears air pollution (especially PM) contributes to ≅≅ 4% of 4% of U.S. deaths & if so, this risk is more than 100 times the risk oU.S. deaths & if so, this risk is more than 100 times the risk of f all other EPAall other EPA--regulated pollutants regulated pollutants
Wilson & Spengler (1996)Wilson & Spengler (1996)
$730 million/year direct public health costs attributed to Twin $730 million/year direct public health costs attributed to Twin Cities traffic Cities traffic
most from PMmost from PM--associated mortality associated mortality
UMN CentUMN Center for Transportation Studies (2000)er for Transportation Studies (2000)

Major US Sources of Fine PMMajor US Sources of Fine PMCoal combustion in power plants and boilersCoal combustion in power plants and boilersGasoline and diesel combustionGasoline and diesel combustion----onon-- & off& off--road road vehicles vehicles Waste, wood and other biomass burning Waste, wood and other biomass burning Fugitive dust from road surfaces, construction Fugitive dust from road surfaces, construction & agriculture& agricultureLivestockLivestock
Green ChemistryGreen ChemistryDesigning of chemical products and Designing of chemical products and processes that reduce or eliminate the use or processes that reduce or eliminate the use or generation of hazardous substancesgeneration of hazardous substances
Presidential Green Chemistry Challenge Presidential Green Chemistry Challenge Award: 1996Award: 1996--presentpresent–– New dryNew dry--cleaning methodscleaning methods–– New materials for disposable diapersNew materials for disposable diapers–– Cheaper, less wasteful, and less toxic production Cheaper, less wasteful, and less toxic production
of chemicals (like ibuprofen, pesticides, etc). of chemicals (like ibuprofen, pesticides, etc).
Air Toxics in MNAir Toxics in MN

Criteria Air Pollutants Criteria Air Pollutants vsvs Toxic Air PollutantsToxic Air Pollutants
Criteria Air PollutantsCriteria Air Pollutants
OO33, SO, SO22, NO, NO22, PM, , PM, lead, COlead, COstandards set by EPAstandards set by EPAsteps must be taken steps must be taken in nonin non--attainment attainment areasareasnationwide monitoringnationwide monitoring
Air ToxicsAir Toxicshazardous air hazardous air pollutantspollutantsnot classified as not classified as ““CriteriaCriteria””respiratory and heart respiratory and heart effects, cancereffects, cancerEmissions are Emissions are tabulatedtabulatedPermits for facilities to Permits for facilities to release air toxicsrelease air toxicsFew ambient Few ambient monitoring sitesmonitoring sites

Air toxics exceeding health benchmarks in MNAir toxics exceeding health benchmarks in MN
FormaldehydeFormaldehydeBenzeneBenzeneCarbon Carbon TetrachlorideTetrachlorideChloroformChloroform
••Ethylene Ethylene dibromidedibromide••1,3 1,3 ––butadienebutadiene••AcroleinAcrolein••ArsenicArsenic••NickelNickel••ChromiumChromium••Particulate organic Particulate organic matter (POM)matter (POM)

Cumulative Exposure Project (CEP) for Cumulative Exposure Project (CEP) for air toxicsair toxics
EPA project to inform Americans about potential EPA project to inform Americans about potential cancer risks due to breathing cancer risks due to breathing outdooroutdoor airairEPA EPA modeledmodeled concentrations of 148 toxics concentrations of 148 toxics compounds in air throughout the U.S. compounds in air throughout the U.S. Modeled concentrations can be compared to Modeled concentrations can be compared to health standardshealth standardsMinnesota is one of the few states that monitors Minnesota is one of the few states that monitors any of these compounds (MPCA monitors 75 air any of these compounds (MPCA monitors 75 air toxics) toxics) MinnesotaMinnesota’’s monitoring generally supported CEP s monitoring generally supported CEP modeled air toxic levelsmodeled air toxic levelsOutdoor air Outdoor air maymay represent minimum exposuresrepresent minimum exposures

Monitoring Air Toxics in MNMonitoring Air Toxics in MN

Example Example –– AcroleinAcrolein in in
MNMN•Modeled concentrations

Metro Area Metro Area -- Formaldehyde Formaldehyde Concentrations (EPA Concentrations (EPA -- CEP)CEP)
Formaldehyde conc. (ug/m3)0 - 0.80.8 - 1.51.5 - 2.52.5 - 3.53.5 - 6.5
formaldehydehealth benchmark= 0.8 ug/m3

FormaldehydeFormaldehyde
213615360535561585956594857855720515231952002068827420350N =
Dul
uth7
549
Hib
bing
Zum
brot
aR
oche
ster
Gra
nite
Falls
Pip
esto
neE
lkR
iver
Littl
eFal
lsW
arro
adA
lexa
ndria
Ferg
usFa
llsS
ands
tone
I_Fa
lls12
41I_
Falls
1240
Mha
haA
cad
Mpl
sLib
rary
Har
ding
Hi
Bus
hSt
Hol
man
Fld
Ash
land
StP
aulP
ark
Koc
h426
Koc
h423
Koc
h420
Ply
mou
th
FOR
MA
LDE
HY
DE
(ug/
m3)
6
5
4
3
2
1
0

Conclusions Conclusions -- Air ToxicsAir ToxicsCEP: Cumulative Exposure Project by EPA CEP: Cumulative Exposure Project by EPA to identify excess cancer risk due to breathing to identify excess cancer risk due to breathing outdooroutdoor airairMobile sources are the main source of riskMobile sources are the main source of risk–– cars, trucks, etc.cars, trucks, etc.–– greater risks in urban areasgreater risks in urban areas
In Minnesota ten air toxics exceed health In Minnesota ten air toxics exceed health benchmarksbenchmarksUpper bound estimated cancer risks = 2 Upper bound estimated cancer risks = 2 -- 141 141 per 100,000 in MN due to air toxicsper 100,000 in MN due to air toxics

For Next Time (Thurs 2/19)For Next Time (Thurs 2/19)Bring topic for project to library at 2:30Bring topic for project to library at 2:30Bring summary of city for AQI project to Bring summary of city for AQI project to classroom at 3:30classroom at 3:30…… 11--2 minutes only!2 minutes only!Finish reading Chapter 1Finish reading Chapter 1Start working on Homework #1 (Due 2/24)Start working on Homework #1 (Due 2/24)
For Next Tues (Tues 2/24)For Next Tues (Tues 2/24)Homework #1 DueHomework #1 DueStart Reading Chapter 2Start Reading Chapter 2Prepare for lab: Read Exp 4 in lab manualPrepare for lab: Read Exp 4 in lab manual


![PIANO CONCERTO IN F 2nd Movement for Clarinets · 102 102 102 102 102 102 102 102 102 102 102 10 44 [Title]](https://static.fdocuments.us/doc/165x107/5e3946b540eed0696e2e90d2/piano-concerto-in-f-2nd-movement-for-clarinets-102-102-102-102-102-102-102-102-102.jpg)