Chayanika Ranasinghe Key Highlights - CT CLSA
9
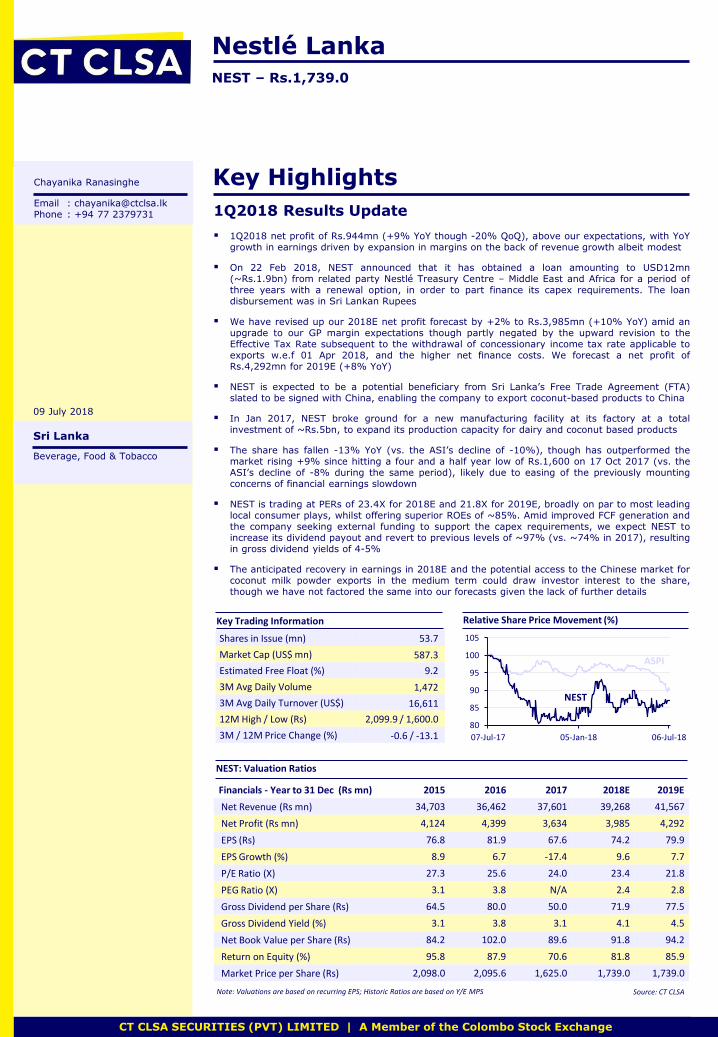
EQUITY REPORT TITLE | Date 1 CT CLSA SECURITIES (PVT) LIMITED | A Member of the Colombo Stock Exchange Nestlé Lanka NEST – Rs.1,739.0 CT CLSA SECURITIES (PVT) LIMITED | A Member of the Colombo Stock Exchange Chayanika Ranasinghe Key Highlights Email : [email protected] Phone : +94 77 2379731 1Q2018 Results Update 1Q2018 net profit of Rs.944mn (+9% YoY though -20% QoQ), above our expectations, with YoY growth in earnings driven by expansion in margins on the back of revenue growth albeit modest On 22 Feb 2018, NEST announced that it has obtained a loan amounting to USD12mn (~Rs.1.9bn) from related party Nestlé Treasury Centre – Middle East and Africa for a period of three years with a renewal option, in order to part finance its capex requirements. The loan disbursement was in Sri Lankan Rupees We have revised up our 2018E net profit forecast by +2% to Rs.3,985mn (+10% YoY) amid an upgrade to our GP margin expectations though partly negated by the upward revision to the Effective Tax Rate subsequent to the withdrawal of concessionary income tax rate applicable to exports w.e.f 01 Apr 2018, and the higher net finance costs. We forecast a net profit of Rs.4,292mn for 2019E (+8% YoY) NEST is expected to be a potential beneficiary from Sri Lanka’s Free Trade Agreement (FTA) slated to be signed with China, enabling the company to export coconut-based products to China In Jan 2017, NEST broke ground for a new manufacturing facility at its factory at a total investment of ~Rs.5bn, to expand its production capacity for dairy and coconut based products The share has fallen -13% YoY (vs. the ASI’s decline of -10%), though has outperformed the market rising +9% since hitting a four and a half year low of Rs.1,600 on 17 Oct 2017 (vs. the ASI’s decline of -8% during the same period), likely due to easing of the previously mounting concerns of financial earnings slowdown NEST is trading at PERs of 23.4X for 2018E and 21.8X for 2019E, broadly on par to most leading local consumer plays, whilst offering superior ROEs of ~85%. Amid improved FCF generation and the company seeking external funding to support the capex requirements, we expect NEST to increase its dividend payout and revert to previous levels of ~97% (vs. ~74% in 2017), resulting in gross dividend yields of 4-5% The anticipated recovery in earnings in 2018E and the potential access to the Chinese market for coconut milk powder exports in the medium term could draw investor interest to the share, though we have not factored the same into our forecasts given the lack of further details Key Trading Information Sri Lanka Beverage, Food & Tobacco 09 July 2018 Shares in Issue (mn) 53.7 Market Cap (US$ mn) 587.3 Estimated Free Float (%) 9.2 3M Avg Daily Volume 1,472 3M Avg Daily Turnover (US$) 16,611 12M High / Low (Rs) 2,099.9 / 1,600.0 3M / 12M Price Change (%) -0.6 / -13.1 Relative Share Price Movement (%) NEST ASPI NEST: Valuation Ratios Note: Valuations are based on recurring EPS; Historic Ratios are based on Y/E MPS Financials - Year to 31 Dec (Rs mn) 2015 2016 2017 2018E 2019E Net Revenue (Rs mn) 34,703 36,462 37,601 39,268 41,567 Net Profit (Rs mn) 4,124 4,399 3,634 3,985 4,292 EPS (Rs) 76.8 81.9 67.6 74.2 79.9 EPS Growth (%) 8.9 6.7 -17.4 9.6 7.7 P/E Ratio (X) 27.3 25.6 24.0 23.4 21.8 PEG Ratio (X) 3.1 3.8 N/A 2.4 2.8 Gross Dividend per Share (Rs) 64.5 80.0 50.0 71.9 77.5 Gross Dividend Yield (%) 3.1 3.8 3.1 4.1 4.5 Net Book Value per Share (Rs) 84.2 102.0 89.6 91.8 94.2 Return on Equity (%) 95.8 87.9 70.6 81.8 85.9 Market Price per Share (Rs) 2,098.0 2,095.6 1,625.0 1,739.0 1,739.0 Source: CT CLSA 80 85 90 95 100 105 07-Jul-17 05-Jan-18 06-Jul-18
Transcript of Chayanika Ranasinghe Key Highlights - CT CLSA
EQUITY REPORT TITLE | Date 1 CT CLSA SECURITIES (PVT) LIMITED | A Member of the Colombo Stock Exchange
Nestlé Lanka NEST – Rs.1,739.0
CT CLSA SECURITIES (PVT) LIMITED | A Member of the Colombo Stock Exchange
Chayanika Ranasinghe Key Highlights Email : [email protected] Phone : +94 77 2379731 1Q2018 Results Update
1Q2018 net profit of Rs.944mn (+9% YoY though -20% QoQ), above our expectations, with YoY
growth in earnings driven by expansion in margins on the back of revenue growth albeit modest
On 22 Feb 2018, NEST announced that it has obtained a loan amounting to USD12mn (~Rs.1.9bn) from related party Nestlé Treasury Centre – Middle East and Africa for a period of three years with a renewal option, in order to part finance its capex requirements. The loan disbursement was in Sri Lankan Rupees
We have revised up our 2018E net profit forecast by +2% to Rs.3,985mn (+10% YoY) amid an upgrade to our GP margin expectations though partly negated by the upward revision to the Effective Tax Rate subsequent to the withdrawal of concessionary income tax rate applicable to exports w.e.f 01 Apr 2018, and the higher net finance costs. We forecast a net profit of Rs.4,292mn for 2019E (+8% YoY)
NEST is expected to be a potential beneficiary from Sri Lanka’s Free Trade Agreement (FTA) slated to be signed with China, enabling the company to export coconut-based products to China
In Jan 2017, NEST broke ground for a new manufacturing facility at its factory at a total investment of ~Rs.5bn, to expand its production capacity for dairy and coconut based products
The share has fallen -13% YoY (vs. the ASI’s decline of -10%), though has outperformed the market rising +9% since hitting a four and a half year low of Rs.1,600 on 17 Oct 2017 (vs. the ASI’s decline of -8% during the same period), likely due to easing of the previously mounting concerns of financial earnings slowdown
NEST is trading at PERs of 23.4X for 2018E and 21.8X for 2019E, broadly on par to most leading local consumer plays, whilst offering superior ROEs of ~85%. Amid improved FCF generation and the company seeking external funding to support the capex requirements, we expect NEST to increase its dividend payout and revert to previous levels of ~97% (vs. ~74% in 2017), resulting in gross dividend yields of 4-5%
The anticipated recovery in earnings in 2018E and the potential access to the Chinese market for coconut milk powder exports in the medium term could draw investor interest to the share, though we have not factored the same into our forecasts given the lack of further details
Key Trading Information
Sri Lanka
Beverage, Food & Tobacco
09 July 2018
Shares in Issue (mn) 53.7
Market Cap (US$ mn) 587.3
Estimated Free Float (%) 9.2
3M Avg Daily Volume 1,472
3M Avg Daily Turnover (US$) 16,611
12M High / Low (Rs) 2,099.9 / 1,600.0
3M / 12M Price Change (%) -0.6 / -13.1
Relative Share Price Movement (%)
NEST
ASPI
NEST: Valuation Ratios
Note: Valuations are based on recurring EPS; Historic Ratios are based on Y/E MPS
Financials - Year to 31 Dec (Rs mn) 2015 2016 2017 2018E 2019E
Net Revenue (Rs mn) 34,703 36,462 37,601 39,268 41,567
Net Profit (Rs mn) 4,124 4,399 3,634 3,985 4,292
EPS (Rs) 76.8 81.9 67.6 74.2 79.9
EPS Growth (%) 8.9 6.7 -17.4 9.6 7.7
P/E Ratio (X) 27.3 25.6 24.0 23.4 21.8
PEG Ratio (X) 3.1 3.8 N/A 2.4 2.8
Gross Dividend per Share (Rs) 64.5 80.0 50.0 71.9 77.5
Gross Dividend Yield (%) 3.1 3.8 3.1 4.1 4.5
Net Book Value per Share (Rs) 84.2 102.0 89.6 91.8 94.2
Return on Equity (%) 95.8 87.9 70.6 81.8 85.9
Market Price per Share (Rs) 2,098.0 2,095.6 1,625.0 1,739.0 1,739.0
Source: CT CLSA
0
100
200
300
70
80
90
100
110
120
22-Feb-17 22-Aug-17 21-Feb-18
Tho
usa
nd
s
ASPI NEST Share Volume ('000) - RHS
80
85
90
95
100
105
07-Jul-17 05-Jan-18 06-Jul-18
EQUITY REPORT TITLE | Date A CT HOLDINGS GROUP AND CLSA GROUP COMPANY 2
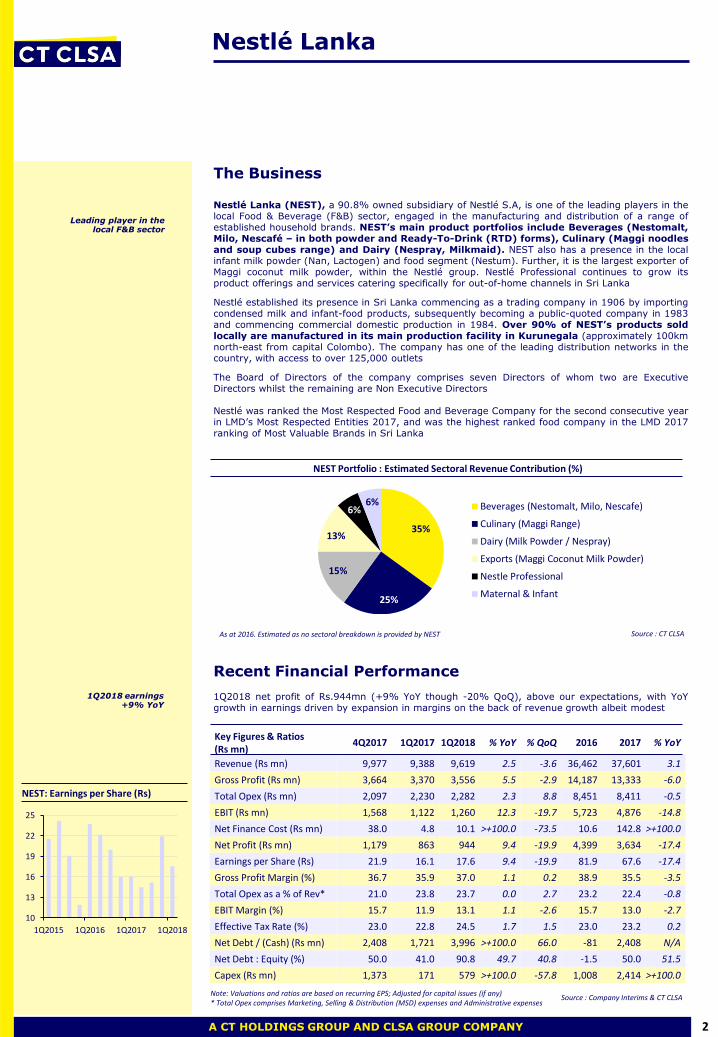
Nestlé Lanka
Leading player in the local F&B sector
Source: LION
1Q2018 earnings +9% YoY
NEST Portfolio : Estimated Sectoral Revenue Contribution (%)
35%
25%
15%
13%
6% 6% Beverages (Nestomalt, Milo, Nescafe)
Culinary (Maggi Range)
Dairy (Milk Powder / Nespray)
Exports (Maggi Coconut Milk Powder)
Nestle Professional
Maternal & Infant
Source : CT CLSA As at 2016. Estimated as no sectoral breakdown is provided by NEST
Key Figures & Ratios (Rs mn) 4Q2016 4Q2017 % YoY % QoQ 2016 2017 % YoY
Revenue (Rs mn) 9,388 9,619 2.5 -3.6 36,462 37,601 3.1
Gross Profit (Rs mn) 3,370 3,556 5.5 -2.9 14,187 13,333 -6.0
Total Opex (Rs mn) 2,230 2,282 2.3 8.8 8,451 8,411 -0.5
EBIT (Rs mn) 1,122 1,260 12.3 -19.7 5,723 4,876 -14.8
Net Finance Cost (Rs mn) 4.8 10.1 >+100.0 -73.5 10.6 142.8 >+100.0
Net Profit (Rs mn) 863 944 9.4 -19.9 4,399 3,634 -17.4
Earnings per Share (Rs) 16.1 17.6 9.4 -19.9 81.9 67.6 -17.4
Gross Profit Margin (%) 35.9 37.0 1.1 0.2 38.9 35.5 -3.5
Total Opex as a % of Revenue* 23.8 23.7 0.0 2.7 23.2 22.4 -0.8
EBIT Margin (%) 11.9 13.1 1.1 -2.6 15.7 13.0 -2.7
Effective Tax Rate (%) 22.8 24.5 1.7 1.5 23.0 23.2 0.2
Net Debt / (Cash) (Rs mn) 1,721 3,996 132.1 66.0 -81 2,408 N/A
Net Debt : Equity (%) 41.0 90.8 49.7 40.8 -1.5 50.0 51.5
Capex (Rs mn) 171 579 >+100.0 -57.8 1,008 2,414 >+100.0
Note: Valuations and ratios are based on recurring EPS; Adjusted for capital issues (if any) * Total Opex comprises Marketing, Selling & Distribution (MSD) expenses and Administrative expenses
Source : Company Interims & CT CLSA
The Business Nestlé Lanka (NEST), a 90.8% owned subsidiary of Nestlé S.A, is one of the leading players in the local Food & Beverage (F&B) sector, engaged in the manufacturing and distribution of a range of established household brands. NEST’s main product portfolios include Beverages (Nestomalt, Milo, Nescafé – in both powder and Ready-To-Drink (RTD) forms), Culinary (Maggi noodles and soup cubes range) and Dairy (Nespray, Milkmaid). NEST also has a presence in the local infant milk powder (Nan, Lactogen) and food segment (Nestum). Further, it is the largest exporter of Maggi coconut milk powder, within the Nestlé group. Nestlé Professional continues to grow its product offerings and services catering specifically for out-of-home channels in Sri Lanka
Nestlé established its presence in Sri Lanka commencing as a trading company in 1906 by importing condensed milk and infant-food products, subsequently becoming a public-quoted company in 1983 and commencing commercial domestic production in 1984. Over 90% of NEST’s products sold locally are manufactured in its main production facility in Kurunegala (approximately 100km north-east from capital Colombo). The company has one of the leading distribution networks in the country, with access to over 125,000 outlets
The Board of Directors of the company comprises seven Directors of whom two are Executive Directors whilst the remaining are Non Executive Directors Nestlé was ranked the Most Respected Food and Beverage Company for the second consecutive year in LMD’s Most Respected Entities 2017, and was the highest ranked food company in the LMD 2017 ranking of Most Valuable Brands in Sri Lanka
Recent Financial Performance 1Q2018 net profit of Rs.944mn (+9% YoY though -20% QoQ), above our expectations, with YoY growth in earnings driven by expansion in margins on the back of revenue growth albeit modest
NEST: Earnings per Share (Rs)
10
13
16
19
22
25
1Q2015 1Q2016 1Q2017 1Q2018
Key Figures & Ratios (Rs mn)
4Q2017 1Q2017 1Q2018 % YoY % QoQ 2016 2017 % YoY
Revenue (Rs mn) 9,977 9,388 9,619 2.5 -3.6 36,462 37,601 3.1
Gross Profit (Rs mn) 3,664 3,370 3,556 5.5 -2.9 14,187 13,333 -6.0
Total Opex (Rs mn) 2,097 2,230 2,282 2.3 8.8 8,451 8,411 -0.5
EBIT (Rs mn) 1,568 1,122 1,260 12.3 -19.7 5,723 4,876 -14.8
Net Finance Cost (Rs mn) 38.0 4.8 10.1 >+100.0 -73.5 10.6 142.8 >+100.0
Net Profit (Rs mn) 1,179 863 944 9.4 -19.9 4,399 3,634 -17.4
Earnings per Share (Rs) 21.9 16.1 17.6 9.4 -19.9 81.9 67.6 -17.4
Gross Profit Margin (%) 36.7 35.9 37.0 1.1 0.2 38.9 35.5 -3.5
Total Opex as a % of Rev* 21.0 23.8 23.7 0.0 2.7 23.2 22.4 -0.8
EBIT Margin (%) 15.7 11.9 13.1 1.1 -2.6 15.7 13.0 -2.7
Effective Tax Rate (%) 23.0 22.8 24.5 1.7 1.5 23.0 23.2 0.2
Net Debt / (Cash) (Rs mn) 2,408 1,721 3,996 >+100.0 66.0 -81 2,408 N/A
Net Debt : Equity (%) 50.0 41.0 90.8 49.7 40.8 -1.5 50.0 51.5
Capex (Rs mn) 1,373 171 579 >+100.0 -57.8 1,008 2,414 >+100.0

EQUITY REPORT TITLE | Date 3 CT CLSA SECURITIES (PVT) LIMITED | A Member of the Colombo Stock Exchange
Nestlé Lanka
Quarterly Highlights 1Q2018 revenue rose +3% YoY (whilst down -4% QoQ from a record high revenue of Rs.9,977mn in 4Q2017); YoY growth likely driven by price increases of key select products and product portfolio extensions NEST increased prices of its key select products, largely in response to higher input costs
o Prices of Maggi Coconut Milk Powder were increased by a total of +44% in 2017 by
way of three price hikes. Further, price increases were implemented for Nestomalt (~7%) and Maggi noodles (~10%)
We anticipate revenue from NEST’s exports segment, primarily comprising Maggi coconut milk
powder, to have contributed strongly during the quarter, generating higher yields on the back of increased pricing. Further, the depreciation of the local currency is likely to have boosted revenue earned. NEST is the only manufacturer of coconut milk powder in the Nestlé Group and is among the largest exporters of coconut milk powder in the world. Revenue from exports segment amounted to Rs.5,984mn in 2017 (+18% YoY, 16% of total revenue)
Overall local volumes likely continued to remain subdued amid consumer demand remaining sluggish, mainly on the back of contracting disposable income amid fiscal tightening measures and a pickup in overall cost of living, as seen across the local FMCG and consumer space
Meanwhile, we assume that select product categories such as under Nestlé Nutrition (Growing up Milk – Nangrow) and Maggi coconut milk powder witnessed positive growth momentum, mainly attributable to lower penetration levels o Coconut milk powder segment penetration levels are assumed to still be in the single digit
levels, offering much scope for growth. Maggi coconut milk powder in particular tends to enjoy higher demand at periods when local coconut prices are high, as has been the case over the recent past. Other main player in the coconut milk powder segment is listed entity, Renuka Agri Foods (RAL). Renuka coconut milk powder 300g pack retails locally at Rs.490, which is currently at a premium to NEST (retailing at Rs.460), subsequent to the last round of price increases in Nov 2017
o The main categories in which NEST operates (eg. RTD Milo, Nestomalt, Maggi noodles) are
already relatively mature with high penetration levels
In addition to weak consumer sentiment, we expect NEST to have faced pressure on sales volumes due to increased competition, with several players also entering the key categories
NEST seems to have taken a more aggressive stance recently in an effort to revamp and extend its product portfolio, likely in an effort to spur sale volume growth and establish its market positioning amid rising competitive pressures o Jan 2018 : Launched Maggi Pazzta and entered the value added pasta category o Feb 2018 : Launched Nespray Coco-Up, Sri Lanka’s first dairy milk beverage with coconut,
also being a first-of-its-kind product for Nestle worldwide o Feb 2018 : Nestomalt RTD variant launched Nestomalt Gold - the new product now comes
with a unique taste profile and appealing modern packaging, to cater to young adults o Mar 2018 : Milkmaid added a variant in its portfolio, Milkmaid Choco Topping, which can
be used in a range of food and drinks o Apr 2018 : Launched Sri Lanka’s first ever noodle meal kit, Maggi Creations, providing
consumers with pre-portioned food ingredients under Nasigoreng and Biriyani flavours
In 2017, NEST’s product portfolio expansion took place via the launch of “Nestomalt Plus” in end-Jul 2017 as a brand extension of the beverage Nestomalt with the addition of oats. NEST commands a leading market position in the local malt beverage category with Nestomalt, one of NEST’s top selling products in Sri Lanka for its popularity as a relatively lower priced tea whitener substitute
Furthermore, NEST relaunched Maggi noodles with a new packaging and enhanced seasoning packets on the back of the launch of Maggi Daiya Chicken Flavoured Noodles in 2016 - a spicy offering catering to the local palette, extending the spicy offerings under the Maggi Devilled range. Launches in 2016 included “Nespray Everyday” - milk powder, “Nestum All Family Cereal” - a breakfast offering for all ages and “Nespray FortiGrow” - a nutritionally enhanced vanilla flavoured milk drink, tailor-made for school-going children (5-12 years range), and “Ceregrow”, the only toddler cereal in the market with probiotics
Aggressive stance recently to revamp
product portfolio
o Only NEST, state-owned Milk Industries of Lanka Company (MILCO) and unlisted Pelwatte Dairy locally produce milk powder. MILCO (Highland) and state-owned “Sathosa” brand – imported full cream milk powder – are selling at a discount, yet the market share and distribution network of both are believed to be modest
NEST: Revenue & YoY Growth
NEST: Revenue & YoY Growth Sri Lanka Coconut (Rs/Nut)
Source : Department of Census and Statistics
0
5
10
15
20
6.9
7.9
8.9
9.9
1Q2013 1Q2014 1Q2015 1Q2016
Revenue (Rs bn) - LHS Var YoY (%)
35
40
45
50
55
Jan-13 Jan-14 Jan-15 Jan-16
Launch of “Nestomalt Plus”
Sri Lanka Food & Bev Growth (%)
Source : Nielsen Sri Lanka, April 2018
-10
-5
0
5
10
15
20
8
9
10
11
1Q2015 3Q2016 1Q2018
Revenue (Rs bn) - LHS
Var YoY (%)
11.0
6.8 8.6
8.0
1.3 2.6
1.4
-3.0 -3.8 -4
0
4
8
12
1Q
201
6
3Q
201
6
1Q
201
7
3Q
201
7
1Q
201
8
Volume Change
Price Change
Overall growth

EQUITY REPORT TITLE | Date A CT HOLDINGS GROUP AND CLSA GROUP COMPANY 4
Nestlé Lanka
Quarterly Highlights 1Q2018 GP margin amounted to 37.0% (vs. 35.9% in 1Q2017 and 36.7% in 4Q2017), with the partial recovery mainly on the back of product price increases Prices of the majority of NEST’s key raw materials softened, primarily on a YoY basis. As per
Fonterra’s Global Dairy Trade auction, skimmed milk powder prices fell -23% YoY to an average of US$1,870/MT in 1Q2018 – recording the fourth consecutive quarterly YoY decline. Prices however rose +5% QoQ, with a general uptick witnessed since quarter end o NEST imports skimmed milk powder for several of its dairy based products, whilst it sources
100% of its fresh milk requirements locally for its Nespray milk powder production. Only NEST, state-owned Milk Industries of Lanka Company (MILCO) and unlisted Pelwatte Dairy produce milk powder locally
o In response to the pickup in input costs, on the back of the weaker local currency, the
Government of Sri Lanka (GoSL) revised up local retail full cream milk power prices on 05 May 2018 by Rs.20 to Rs.345 for a 400g pack and by Rs.50 to Rs.860 for a 1kg pack. Meanwhile, a 400g of NEST’s locally produced full cream milk powder retails at Rs.315 post price increase. The latest price increase is likely to provide some relief to NEST, which was previously impacted subsequent to the introduction of 15% VAT on milk powder (previously VAT exempt) w.e.f 01 Nov 2016, yet the GoSL did not allow for product price increases
o Sri Lanka’s dairy industry has called for a price formula to replace the Government price control of milk powder. According to the All Island Dairy Association (AIDA), local dairy supply increased +67% to 327mn litres, yet still only meet ~40% of the local growing demand, with the balance being catered through imports
Local coconut prices rose +30% YoY to an average of Rs.78/nut in 1Q2018 due to
weather related supply side constraints, which is assumed to have been a contributor to the rise in NEST’s production costs. Meanwhile, local coconut prices seemed to have broadly stabilised at current levels, with a possible easing in the near term from the previous highs o In 2017, NEST kicked off the second phase of its Nestlé Coconut Plan, conducted together
with the Coconut Cultivation Board, working with the local farmers to increase overall coconut supply. The company’s total contribution to the rural economy in 2017 was Rs.8.3bn for procurement of milk and coconut
Average Sri Lankan Rupee (LKR) depreciated 3% YoY 1% QoQ during 1Q2018 to Rs.154.8 per
US$. Weaker currency expected to result in higher import related costs, given ~50% of NEST’s raw materials are estimated to be imported
Marketing, Selling & Distribution (MSD) expenses rose +1% YoY (and +14% QoQ); 17.5% of revenue in 1Q2018 (vs. 17.7% in 1Q2017 and 14.8% in 4Q2017) EBIT margin +115bps YoY to 13.1% as a result of the improvement of the GP margin filtering
through (whilst down from 15.7% in 4Q2017) NEST has been incurring relatively high MSD on a range from advertising, consumer
communication and outreach and in-store promotions, likely in an effort to spur sales growth in the sluggish environment coupled with stiffening industry competition
LKR per US$ (Average Quarterly Rate)
Average Quarterly Exchange Rate Appreciation / Depreciation
% YoY % QoQ
-18.6 -9.1
-7.8 -6.6
-20.5 -1.5
-15.5 2.3
-6.3 1.9
2.6 0.0
0.2 -4.0
-1.4 0.6
-3.1 0.2
-3.0 0.2
118
123
128
133
1Q2012 2Q2012 3Q2012 4Q2012 1Q2013 2Q2013 3Q2013 4Q2013 1Q2014 2Q2014
Source: HSBC Mid Exchange Rates
NEST: Net Debt Position
Rs.1,300mn
-25
0
25
50
75
-200
0
200
400
600
800
1Q2013 1Q2014 1Q2015
Net Debt / (Cash) (Rs mn) - LHSNet Debt : Equity (%)
NEST: Profit Margins
Source : Global Dairy Trade Info
Sugar (US$ cents/Pound)
Source : World Bank
Source : World Bank
Sri Lanka Coconut (Rs/Nut)
Source : Department of Census and Statistics
NEST: EBIT Margin (%)
Skim Milk Powder (US$/MT) Sugar (US$/Kg) Source : World Bank
Source : Department of Census and Statistics
Palm Oil (US$/MT)
Sri Lanka Coconut (Rs/Nut)
NEST: Total Opex
NEST: COS (Rs bn) & GP Margin (%)
450
550
650
750
850
950
Jan-13 Jan-14 Jan-15 Jan-16
35
40
45
50
55
Jan-13 Jan-14 Jan-15 Jan-16
NEST: Total Opex
16
20
24
28
32
0
1
2
3
1Q2014 3Q2015 1Q2017
Admix Exp. (Rs bn)MSD Exp. (Rs bn)Total Opex (as a % of Rev) - RHS
Palm Oil (US$/MT)
Source : World Bank
Sri Lanka Coconut (Rs/Nut)
Source : Department of Census & Statistics
16
20
24
28
32
0
1
2
3
3Q2014 3Q2015 3Q2016 3Q2017
Admin Exp. (Rs bn)
MSD as a % pf Rev - RHS
Total Opex (as a % of Rev) - RHS
8
10
12
14
16
18
20
3Q2014 3Q2015 3Q2016 3Q2017
1,500
1,750
2,000
2,250
2,500
2,750
Jun-16 Feb-17 Oct-17 Jun-18
0.25
0.30
0.35
0.40
0.45
0.50
Apr-16 Dec-16 Aug-17 Apr-18
550
600
650
700
750
Apr-16 Dec-16 Aug-17 Apr-18
40
50
60
70
80
Jun-16 Feb-17 Oct-17 Jun-18
33
35
37
39
41
4.9
5.2
5.5
5.8
6.1
6.4
1Q2015 3Q2016 1Q2018
COS GP Margin - RHS
NEST: Total Opex
16
20
24
28
32
0
1
2
3
1Q2015 3Q2016 1Q2018
Admin Exp. (Rs bn)
MSD as a % pf Rev - RHS
Total Opex (as a % of Rev) - RHS
EQUITY REPORT TITLE | Date 5 CT CLSA SECURITIES (PVT) LIMITED | A Member of the Colombo Stock Exchange
Nestlé Lanka
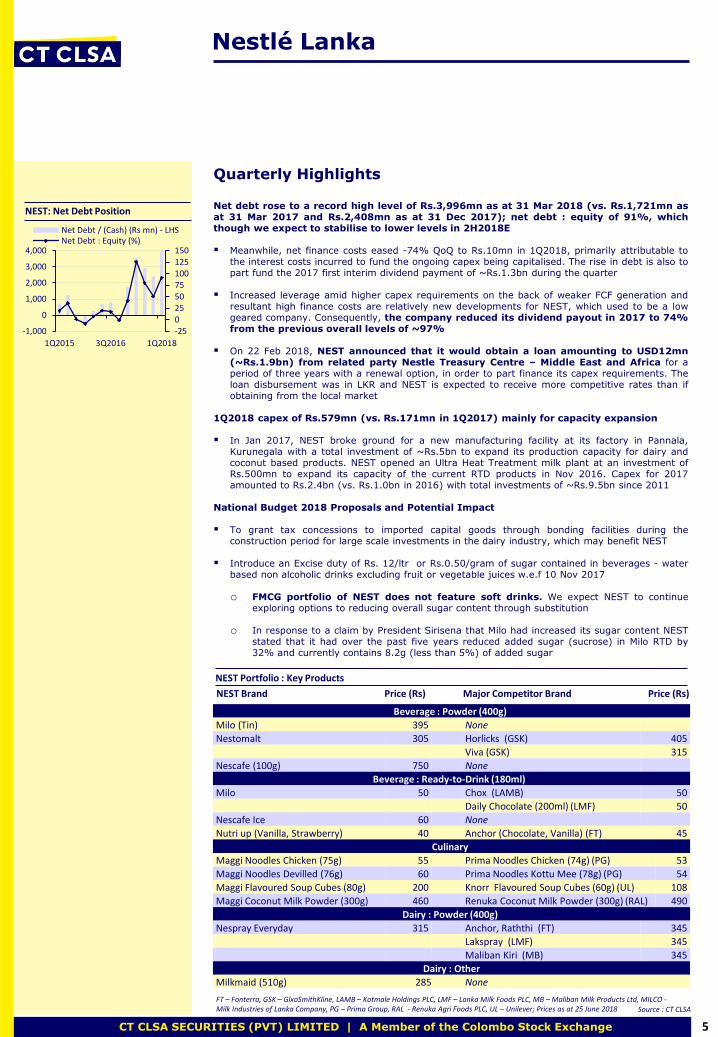
Quarterly Highlights Net debt rose to a record high level of Rs.3,996mn as at 31 Mar 2018 (vs. Rs.1,721mn as at 31 Mar 2017 and Rs.2,408mn as at 31 Dec 2017); net debt : equity of 91%, which though we expect to stabilise to lower levels in 2H2018E Meanwhile, net finance costs eased -74% QoQ to Rs.10mn in 1Q2018, primarily attributable to
the interest costs incurred to fund the ongoing capex being capitalised. The rise in debt is also to part fund the 2017 first interim dividend payment of ~Rs.1.3bn during the quarter
Increased leverage amid higher capex requirements on the back of weaker FCF generation and resultant high finance costs are relatively new developments for NEST, which used to be a low geared company. Consequently, the company reduced its dividend payout in 2017 to 74% from the previous overall levels of ~97%
On 22 Feb 2018, NEST announced that it would obtain a loan amounting to USD12mn (~Rs.1.9bn) from related party Nestle Treasury Centre – Middle East and Africa for a period of three years with a renewal option, in order to part finance its capex requirements. The loan disbursement was in LKR and NEST is expected to receive more competitive rates than if obtaining from the local market
1Q2018 capex of Rs.579mn (vs. Rs.171mn in 1Q2017) mainly for capacity expansion In Jan 2017, NEST broke ground for a new manufacturing facility at its factory in Pannala,
Kurunegala with a total investment of ~Rs.5bn to expand its production capacity for dairy and coconut based products. NEST opened an Ultra Heat Treatment milk plant at an investment of Rs.500mn to expand its capacity of the current RTD products in Nov 2016. Capex for 2017 amounted to Rs.2.4bn (vs. Rs.1.0bn in 2016) with total investments of ~Rs.9.5bn since 2011
National Budget 2018 Proposals and Potential Impact To grant tax concessions to imported capital goods through bonding facilities during the
construction period for large scale investments in the dairy industry, which may benefit NEST
Introduce an Excise duty of Rs. 12/ltr or Rs.0.50/gram of sugar contained in beverages - water based non alcoholic drinks excluding fruit or vegetable juices w.e.f 10 Nov 2017
o FMCG portfolio of NEST does not feature soft drinks. We expect NEST to continue
exploring options to reducing overall sugar content through substitution
o In response to a claim by President Sirisena that Milo had increased its sugar content NEST stated that it had over the past five years reduced added sugar (sucrose) in Milo RTD by 32% and currently contains 8.2g (less than 5%) of added sugar
Beverage : Powder (400g)
Milo (Tin) 395 None
Nestomalt 305 Horlicks (GSK) 405
Viva (GSK) 315
Nescafe (100g) 750 None
Beverage : Ready-to-Drink (180ml)
Milo 50 Chox (LAMB) 50
Daily Chocolate (200ml) (LMF) 50
Nescafe Ice 60 None
Nutri up (Vanilla, Strawberry) 40 Anchor (Chocolate, Vanilla) (FT) 45
Culinary
Maggi Noodles Chicken (75g) 55 Prima Noodles Chicken (74g) (PG) 53
Maggi Noodles Devilled (76g) 60 Prima Noodles Kottu Mee (78g) (PG) 54
Maggi Flavoured Soup Cubes (80g) 200 Knorr Flavoured Soup Cubes (60g) (UL) 108
Maggi Coconut Milk Powder (300g) 460 Renuka Coconut Milk Powder (300g) (RAL) 490
Dairy : Powder (400g)
Nespray Everyday 315 Anchor, Raththi (FT) 345
Lakspray (LMF) 345
Maliban Kiri (MB) 345
Dairy : Other
Milkmaid (510g) 285 None
NEST Portfolio : Key Products
NEST Brand Price (Rs) Major Competitor Brand Price (Rs)
FT – Fonterra, GSK – GlxoSmithKline, LAMB – Kotmale Holdings PLC, LMF – Lanka Milk Foods PLC, MB – Maliban Milk Products Ltd, MILCO - Milk Industries of Lanka Company, PG – Prima Group, RAL - Renuka Agri Foods PLC, UL – Unilever; Prices as at 25 June 2018
Source : CT CLSA
NEST: Net Debt Position
-250255075100125150
-1,000
0
1,000
2,000
3,000
4,000
1Q2015 3Q2016 1Q2018
Net Debt / (Cash) (Rs mn) - LHSNet Debt : Equity (%)
EQUITY REPORT TITLE | Date A CT HOLDINGS GROUP AND CLSA GROUP COMPANY 6
Nestlé Lanka
Outlook & Valuations We have revised up our 2018E net profit forecast by +2% to Rs.3,985mn (+10% YoY) amid an upgrade to our GP margin expectations though partly negated by the upward revision to the Effective Tax Rate (ETR) subsequent to the withdrawal of concessionary income tax rate applicable to exports w.e.f 01 Apr 2018, and the higher net finance costs. We forecast a net profit of Rs.4,292mn for 2019E (+8% YoY) Net revenue forecast for 2018E broadly maintained at Rs.39,268mn (+4% YoY) and forecast
Rs.41,567mn for 2019E (+6% YoY), driven by product price increases and increased contribution from higher yielding exports segment. Consumer demand is expected to gradually pickup albeit at modest levels in the near term on the back of improving macro factors
GP margin forecast revised up by 50bps to 37.0% for 2018E (vs. 35.5% in 2017 and 37.0% in 1Q2018) amid higher value contribution, though being cognisant of upward pressure on global commodity prices and pressure from the weakening local currency. We expect NEST to selectively pass on cost hikes by way of price increases on its key products, as already witnessed, whilst keeping under consideration the overall pressure on volumes. 2019E GP margin forecast at 37.5% from enhancement of the portfolio mix and a softening in coconut prices o The LKR spot rate is forecast to depreciate 5% to Rs.161/US$ in 2018E and 4% to
Rs.168/US$ in 2019E. Improved US$ revenue from export sales to partly cushion import related costs
MSD expenses as a % of revenue maintained at 16.1% for both 2018E and 2019E (unchanged from 2017), for NEST’s effort to increase consumer outreach and promotion and spur sales growth. EBIT margins forecast at 14.5% for 2018E (vs. 13.0% for 2017) and 15.0% for 2019E
Net finance costs forecast at Rs.244mn for 2018E (+68% YoY) and Rs.272mn for 2019E (+12% YoY), with net debt levels forecast at ~Rs.3.4bn, inclusive of the recently obtained group loan
Effective tax rate forecast revised up an blended rate of 27.1% for 2018E (vs. 23.2% previously and applicable in 2017) and 28.0% for 2019E, subsequent to the withdrawal of concessionary income tax rate applicable to exports as part of the new Inland Revenue Act w.e.f 01 Apr 2018. Meanwhile, the company may receive capital relief on the investments being made though we have not factored the same into our forecasts given the lack of details available
We forecast capex of ~Rs.2bn per year for both 2018E and 2019E (vs. Rs.2,414mn in 2017) to improve production capacity and optimise efficiency levels
NEST is expected to be a potential beneficiary from Sri Lanka’s Free Trade Agreement with China slated to be signed in the near to medium term, which would enable the company to export coconut-based products to China. Countries such as Philippines and Indonesia have received such preferential tariff rates from China. Coconut farming and NEST’s manufacturing plants have undergone significant transformation in the recent past and are therefore likely in a position of meeting the potential demand from the Chinese market
Despite the main categories in which NEST operates domestically being in a relatively mature state with high penetration levels, Sri Lanka provides NEST with the potential to offer an enhanced portfolio focusing on greater value addition, which the company has been more forthcoming recently with product portfolio extensions. Amid stiffening industry competition, NEST may also need to launch new products or enter new sectors to regain momentum, for which the company has the expertise, distribution network and global strength
Nevertheless, NEST may likely be more selective and prudent in its investments vs. its local competitors, to ensure potential investments meet the group’s global levels of compliance and minimum hurdle requirement rates, particularly given the limited scale of the Sri Lankan market. The local market scope for growth mainly in terms of volume is relatively limited vs. other global markets in which Nestlé operates
The share has fallen -13% YoY (vs. the ASI’s decline of -10%), though has outperformed the market rising +9% since hitting a four and a half year low of Rs.1,600 on 17 Oct 2017 (vs. the ASI’s decline of -8% during the same period), likely due to easing of the previously mounting concerns of financial earnings slowdown
NEST is trading at PERs of 23.4X for 2018E and 21.8X for 2019E, broadly on par to most leading local consumer plays, whilst offering superior ROEs of ~85%. Amid improved FCF generation and the company seeking external funding to support the capex requirements, we expect NEST to increase its dividend payout and revert to previous levels of ~97% (vs. ~74% in 2017), resulting in gross dividend yields of 4-5%
The anticipated recovery in earnings in 2018E and the potential access to the Chinese market for coconut milk powder exports in the medium term could draw investor interest to the share, though we have not factored the same into our forecasts given the lack of further details.
*DPS Rs.68.5 declared for 2014 maintaining NEST’s usual ~97% dividend payout Source: CT CLSA
Super Gain Tax (SGT) Impact Scenarios
Key Figures SGT Scenario Liability 2015E DPS (Rs)
2013 (Rs mn) Total (Rs mn) Per Share (Rs) 2014* 2015E
Income Tax Paid 767 None N/A N/A 68.5 75.8
Net Profit 3,317 25% of 2013 Net Profit 829 15.4 68.5 60.8
Taxable Profit 2,617 25% of 2013 Taxable Profit 654 12.2 68.5 63.9
NEST: 10-Yr (2008 – 2018E) Revenue CAGR of 8%
NEST GP margin expanded an avg ~90bps p.a. during past 5 years and 10
years upto 2014
May need to launch new products or enter new
sectors to regain momentum
NEST: Revenue & YoY Growth
NEST: Gross Profit Margin (%)
Potential exports to China
NEST: Trailing Twelve Month PER (X): 2015 – 2018YTD
0
5
10
15
20
15
25
35
45
2010 2013 2016 2019E
Revenue (Rs bn) - LHS
Revenue (% YoY)
31
33
35
37
39
41
2010 2013 2016 2019E
23
26
29
32
35
02-Jan-15 07-Oct-16 06-Jul-18
EQUITY REPORT TITLE | Date 7 CT CLSA SECURITIES (PVT) LIMITED | A Member of the Colombo Stock Exchange
Nestlé Lanka
Note: Total annual return for NEST includes dividends; ASI annual return excludes market dividends
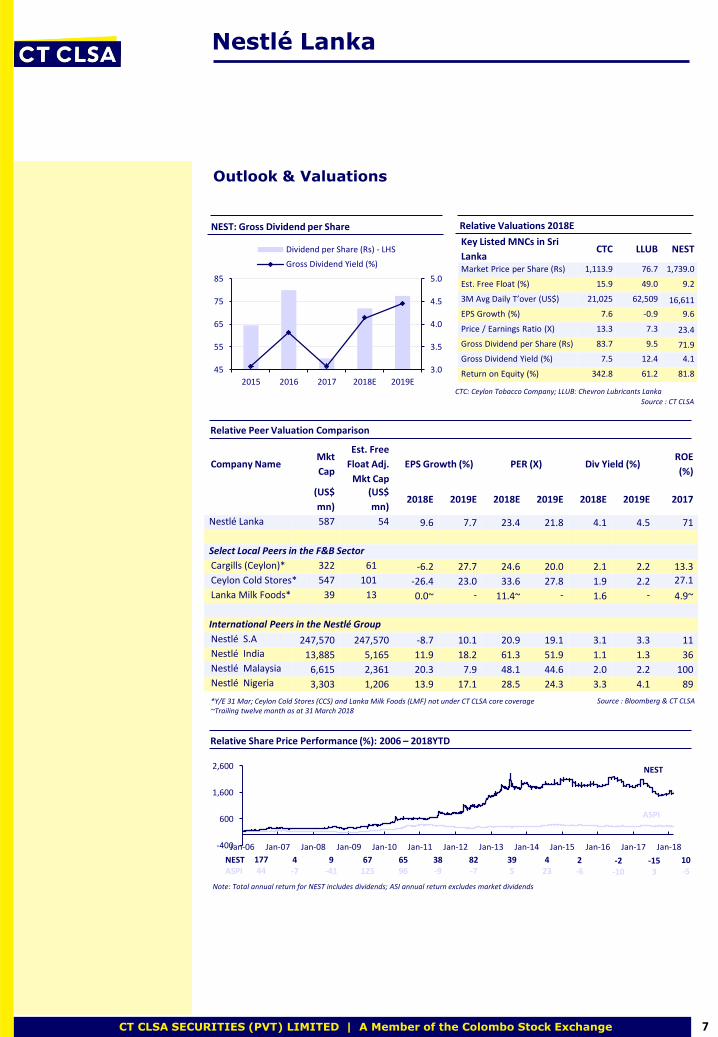
Outlook & Valuations
Relative Peer Valuation Comparison
Company Name Mkt Cap
Est. Free
Float Adj.
Mkt Cap
EPS Growth (%) PER (X) Div Yield (%) ROE
(%)
(US$ mn) (US$ mn) 2014E 2015E 2014E 2015E 2014E 2015E 2013
Nestlé Lanka 874 80 26.7 14.1 27.3 23.9 3.5 4.1 83
Nestlé S.A 240,734 240,734 26.7 14.1 27.3 23.9 3.5 4.1 16
Nestlé India 3,576 3,576 -4.3 8.6 21.1 19.4 3.1 3.3 54
Nestlé Malaysia 1,309 1,309 2.4 16.6 49.1 42.1 1.1 1.5 72
Nestlé Nigeria 1,483 1,483 1.3 7.7 27.1 25.2 3.6 3.8 60
Source : Bloomberg & CT CLSA
NEST ASPI
177 44
4 -7
9 -41
67 125
65 96
38 -9
82 -7
39 5
4 23
Key Listed MNCs in Sri
Lanka CTC LLUB NEST
Market Price per Share (Rs) 1,113.9 76.7 1,739.0
Est. Free Float (%) 15.9 49.0 9.2
3M Avg Daily T’over (US$) 21,025 62,509 16,611
EPS Growth (%) 7.6 -0.9 9.6
Price / Earnings Ratio (X) 13.3 7.3 23.4
Gross Dividend per Share (Rs) 83.7 9.5 71.9
Gross Dividend Yield (%) 7.5 12.4 4.1
Return on Equity (%) 342.8 61.2 81.8
CTC: Ceylon Tobacco Company; LLUB: Chevron Lubricants Lanka
NEST ASPI : 10-Yr CAGR of 10%
Company Name Mkt
Cap
Est. Free
Float Adj.
Mkt Cap
EPS Growth (%) PER (X) Div Yield (%) ROE
(%)
(US$
mn)
(US$
mn) 2018E 2019E 2018E 2019E 2018E 2019E 2017
Nestlé Lanka 587 54 9.6 7.7 23.4 21.8 4.1 4.5 71
Select Local Peers in the F&B Sector
Cargills (Ceylon)* 322 61 -6.2 27.7 24.6 20.0 2.1 2.2 13.3
Ceylon Cold Stores* 547 101 -26.4 23.0 33.6 27.8 1.9 2.2 27.1
Lanka Milk Foods* 39 13 0.0~ - 11.4~ - 1.6 - 4.9~
International Peers in the Nestlé Group
Nestlé S.A 247,570 247,570 -8.7 10.1 20.9 19.1 3.1 3.3 11
Nestlé India 13,885 5,165 11.9 18.2 61.3 51.9 1.1 1.3 36
Nestlé Malaysia 6,615 2,361 20.3 7.9 48.1 44.6 2.0 2.2 100
Nestlé Nigeria 3,303 1,206 13.9 17.1 28.5 24.3 3.3 4.1 89
*Y/E 31 Mar; Ceylon Cold Stores (CCS) and Lanka Milk Foods (LMF) not under CT CLSA core coverage ~Trailing twelve month as at 31 March 2018
Source : Bloomberg & CT CLSA
NEST: 10-Yr CAGR of 21%
ASPI
2 -6
Source : CT CLSA
Relative Valuations 2018E NEST: Gross Dividend per Share
Relative Peer Valuation Comparison
Relative Share Price Performance (%): 2006 – 2018YTD
-2 -10
-15 3
-400
600
1,600
2,600
Jan-06 Jan-07 Jan-08 Jan-09 Jan-10 Jan-11 Jan-12 Jan-13 Jan-14 Jan-15 Jan-16 Jan-17 Jan-18
10 -5
3.0
3.5
4.0
4.5
5.0
45
55
65
75
85
2015 2016 2017 2018E 2019E
Dividend per Share (Rs) - LHS
Gross Dividend Yield (%)
EQUITY REPORT TITLE | Date A CT HOLDINGS GROUP AND CLSA GROUP COMPANY 8
Nestlé Lanka
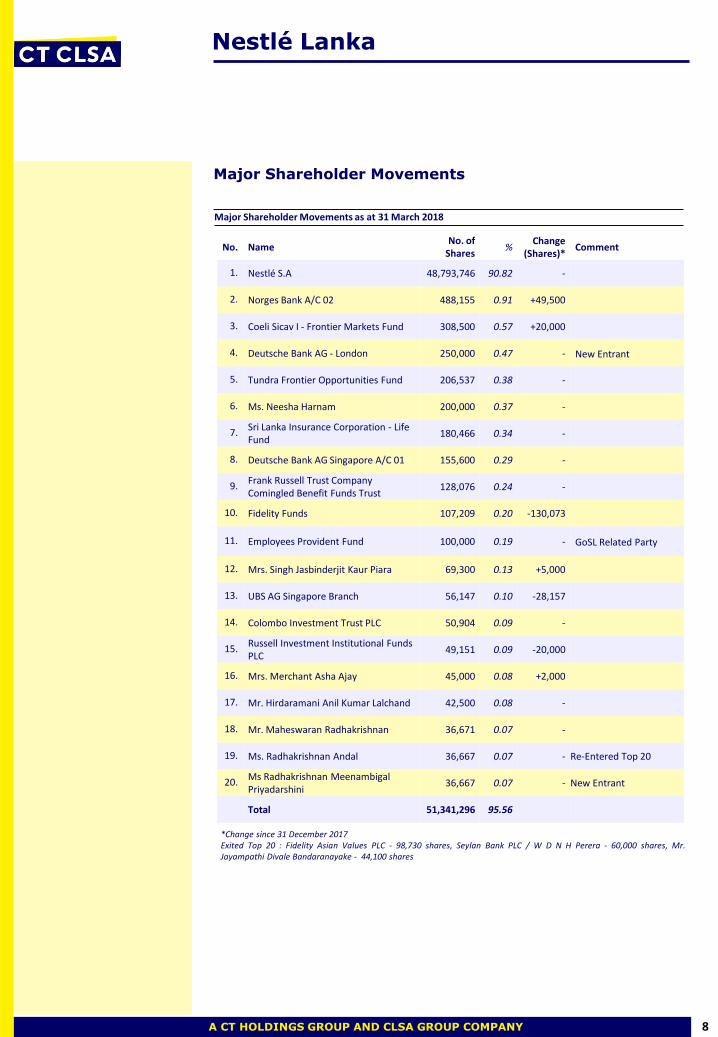
Major Shareholder Movements
No. Name No. of
Shares %
Change (Shares)*
Comment
1. Nestlé S.A 48,793,746 90.82 -
2. Norges Bank A/C 02 488,155 0.91 +49,500
3. Coeli Sicav I - Frontier Markets Fund 308,500 0.57 +20,000
4. Deutsche Bank AG - London 250,000 0.47 - New Entrant
5. Tundra Frontier Opportunities Fund 206,537 0.38 -
6. Ms. Neesha Harnam 200,000 0.37 -
7. Sri Lanka Insurance Corporation - Life Fund
180,466 0.34 -
8. Deutsche Bank AG Singapore A/C 01 155,600 0.29 -
9. Frank Russell Trust Company Comingled Benefit Funds Trust
128,076 0.24 -
10. Fidelity Funds 107,209 0.20 -130,073
11. Employees Provident Fund 100,000 0.19 - GoSL Related Party
12. Mrs. Singh Jasbinderjit Kaur Piara 69,300 0.13 +5,000
13. UBS AG Singapore Branch 56,147 0.10 -28,157
14. Colombo Investment Trust PLC 50,904 0.09 -
15. Russell Investment Institutional Funds PLC
49,151 0.09 -20,000
16. Mrs. Merchant Asha Ajay 45,000 0.08 +2,000
17. Mr. Hirdaramani Anil Kumar Lalchand 42,500 0.08 -
18. Mr. Maheswaran Radhakrishnan 36,671 0.07 -
19. Ms. Radhakrishnan Andal 36,667 0.07 - Re-Entered Top 20
20. Ms Radhakrishnan Meenambigal Priyadarshini
36,667 0.07 - New Entrant
Total 51,341,296 95.56
*Change since 31 December 2017 Exited Top 20 : Fidelity Asian Values PLC - 98,730 shares, Seylan Bank PLC / W D N H Perera - 60,000 shares, Mr. Jayampathi Divale Bandaranayake - 44,100 shares
Major Shareholder Movements as at 31 March 2018
Trading & Sales
Lasantha Iddamalgoda [email protected] +94 11 255 2295 +94 77 778 2103 Dyan Morris [email protected] +94 11 255 2320 +94 77 722 4951 Manura Hemachandra [email protected] +94 77 261 4797 Rosco Todd [email protected] +94 77 262 7233 Dhammika de Silva [email protected] +94 77 356 2699
Arusha Michael [email protected] +94 77 395 6765
Nuwan Madusanka [email protected] +94 76 858 9722 Ryan Jansz [email protected] +94 77 547 9233
CT CLSA SECURITIES (PVT) LTD A Member of the Colombo Stock Exchange
4-14 Majestic City, 10 Station Road, Colombo 4, Sri Lanka
General: +94 11 255 2290 to 2294 Facsimile: +94 11 255 2289 Email: [email protected] Web: www.ctclsa.lk
A CT HOLDINGS GROUP AND CLSA GROUP COMPANY
Disclaimer : This document has been prepared and issued by CT CLSA Securities (Pvt) Ltd. on the basis of publicly available information, internally developed data and other sources, believed to be reliable. Whilst all reasonable care has been taken to ensure that the facts stated are accurate and the opinions given are fair and reasonable, neither CT CLSA Securities (Pvt) Ltd. nor any director, officer or employee, shall in any way be responsible for the contents. CT CLSA Securities (Pvt) Ltd. may act as a Broker in the investments which are the subject of this document or in related investments and may have acted upon or used the information contained in this document, or the research or analysis on which it is based, before its publication. CT CLSA Securities (Pvt) Ltd., its directors, officers or employees may also have a position or be otherwise interested in the investments referred to in this document. This is not an offer to buy or sell the investments referred to in this document. It is not intended to provide professional, investment or any other type of advice or recommendation and does not take into account the particular investment objectives, financial situation or needs of individual recipients. Before acting on any information in this publication/communication, you should consider whether it is suitable for your particular circumstances and, if appropriate, seek your own professional advice, including tax advice. The markets in which CT CLSA Securities (Pvt) Ltd. operates may not have regulation governing conflict of interest over preparation and publication of research reports (including but not limited to disclosure of perceived or actual conflict of interest) as may be found in more developed markets. Please contact your investment advisor / analyst should you require further information over the relevant regulation and particular disclosure over perceived or actual conflict of interest.
Research
Sanjeewa Fernando [email protected] +94 77 742 7439 Chayanika Ranasinghe [email protected] +94 77 237 9731 Yasas Wijethunga [email protected] +94 77 053 2059 Shahan de Silva [email protected] +94 11 255 2290 Subecca Sothylingam [email protected] +94 11 255 2290 Shahana Kanagaratnam [email protected] +94 11 255 2290 Madhusha Sivanathan [email protected] +94 11 255 2290
Consultant / Sales
Rohan Fernando [email protected] +94 11 255 2297 +94 76 778 2101