Charts on 3rd Quarter 2010/11 - thyssenkrupp.com · • Schindler Marine Systems Elevator...
74
Charts on 3rd Quarter 2010/11 August 12, 2011 Dr. Heinrich Hiesinger, CEO Guido Kerkhoff, CFO
Transcript of Charts on 3rd Quarter 2010/11 - thyssenkrupp.com · • Schindler Marine Systems Elevator...

Charts on 3rd Quarter 2010/11August 12, 2011
Dr. Heinrich Hiesinger, CEOGuido Kerkhoff, CFO

Charts on 3rd Quarter 2010/11August 12, 2011
1 Developing the future.
Strategic Development Program at ThyssenKrupp
Group Performance and Financials
Business Area Performance
Group Outlook
Agenda

Charts on 3rd Quarter 2010/11August 12, 2011
2 Developing the future.
Q3 2010/11 Key Messages – GroupOn Track to Achieve Ambitious Targets
Growth
Profitability& Cash
• Highest order intake & sales in over 2 years
• Book-to-bill > 1
• Further improvement in EBIT
• Lowest capex in over 4 years
• First positive FCF in 6 quarters
• Behind NFD peak
• Strategic Development in progress
• Group EBIT adj. ~ €2 bn
• Steel Americas: Negative EBIT in higher 3-digit €m range
Execution
Targets

Charts on 3rd Quarter 2010/11August 12, 2011
3 Developing the future.
Q3 2010/11 Key Messages – Business Areas
• Steel Europe: Higher average revenues/t offset input cost increases
• Steel Americas: Progress in ramp-up and loss reduction
• Stainless Global: Positive underlying EBIT (excl. negative EBIT Stainless USA)
• Materials Services: Earnings support by robust real consumption
• Elevator Technology: Higher earnings despite weaker US & Southern European business
• Plant Technology: Highest order intake in 6 quarters
• Components Technology: Highest EBIT in 2 years
• Marine Systems: Major submarine order received

Charts on 3rd Quarter 2010/11August 12, 2011
4 Developing the future.
Company
Positioning
ThyssenKrupp – Strategic Way Forward
FinancialStabilization
Financing Capacities
Positive FCF
Reduce NFD
Investment-Grade
Dividend
Grow Core Businesses
StrategicPush
Expand market position
Smaller acquisitions: Technologies & Services
Increase R&D spending
Performance Orientation
ChangeManagement
Portfolio Optimization ++ +
Profit & CashImprovement
Continuous benchmarking
Sales growth(price and volume)
Cost & cash control
Increase capital efficiency
Ramp-up Steel Americas
Leadership &Culture
Leadership
Transparency
Mission Statement
Regional development
Innovation
People
Exit Non-Core Businesses
OngoingMetal FormingXervonCivil shipbuilding
AdditionalStainless GlobalWaupacaTailored Blanks
Strategic development
Bilstein GroupPresta Steering
closed

Charts on 3rd Quarter 2010/11August 12, 2011
5 Developing the future.
Customers & Markets
Innovation & Technology People & Development
Performance & Portfolio
Cornerstones of Corporate Program “impact”
Commitment of executive board Full integration into financial management
Sustainable Value Creation
Berlien Eichler
ClaassenLabonteHiesinger
Hiesinger Kerkhoff
Monthly progress reviewby top management
Integrationinto
operationalplanning
Definition of measures
Four impact initiatives with dedicated sponsorship by executive board members
Progress controlling based on “degrees-of-implementation” logic

Charts on 3rd Quarter 2010/11August 12, 2011
6 Developing the future.
Execution UpdateSelected Measures
Sale Metal Forming: closed July 20
Exit Stainless Global: new mgmt. lined up, banks mandated
Sale Waupaca & Bilstein (springs, stabilizers): banks mandated
Sale Tailored Blanks: market approach in preparation
Sale Xervon & civil shipbuilding: progressing
Strat. Develop. Bilstein/Presta Steering: new management lined up
Group-wide roll-out of process for mission statementdevelopment
Global Technology Forum conducted in July with 150 top managers
Assessment of 2nd & 3rd management level
Remuneration system of 2nd & 3rd management level under review
Roll-out of LTI (share price performance-based compensation) to 2,000 senior managers in preparation
Customers & Markets
Innovation & Technology People & Development
Performance & Portfolio
Sustainable Value Creation
Berlien Eichler
ClaassenLabonteHiesinger
Hiesinger Kerkhoff

Charts on 3rd Quarter 2010/11August 12, 2011
7 Developing the future.
Systematic Benchmarking Aiming at Best-in-Class OperationsSelected Peers / Relevant Peer Segments
• Chemicals: Maire Tecnimont / Oil, Gas & Petrochem.
• Cement & Minerals: FLSmidth
• Mining Equipment: Sandvik / Mining & Construction
• Automotive components:Continental (GER); NSK (JPN); TRW (USA)
• Industrial & construction machinery:Kaydon (USA, Friction Control); SKF (SWE, Industrial); Titan Europe (UK, Undercarriage)
• DCNS (F)• Navantia (E)• Damen (NL)
• UTC / Otis• KONE• Schindler
Marine Systems
Elevator Technology
Plant Technology
Components Technology
Steel Europe • ArcelorMittal / Flat Carbon Europe
• Salzgitter / Steel• Tata Steel / Europe• Voestalpine / Steel
• AK Steel• ArcelorMittal / Flat Carbon Americas• US Steel / Flat-Rolled• Nucor
Steel Americas
• Acerinox• Aperam• Outokumpu• Allegheny
Stainless Global
• ArcelorMittal / Distribution Solutions• Klöckner• Reliance
Materials Services

Charts on 3rd Quarter 2010/11August 12, 2011
8 Developing the future.
ThyssenKrupp – “Diversified Industrial Company”
Diversification over business cycles
Stable earnings &cash flow profile
Financialstability & flexibility
Cross-operational synergies
Efficient capital allocation based on clearly defined key figures
Focus oncore activities with leading
market positions
Best-in-class performance within all businesses
Leading Engineering CompetenceInfrastructure Resources

Charts on 3rd Quarter 2010/11August 12, 2011
9 Developing the future.
Agenda
Strategic Development Program at ThyssenKrupp
Group Performance and Financials
Business Area Performance
Group Outlook

Charts on 3rd Quarter 2010/11August 12, 2011
10 Developing the future.
Q3 2010/11: Further Improvement in Group Earnings
• Highest in over 2 years
• Book-to-bill > 1
• Further improvement in earnings
• Progress in ramp-up and loss reduction
• Lowest capex in over 4 years
• Behind the peak
• Significant positive FCF in Q4 expected
• Order intake €12.8 bn €14.1 bn
Sales €12.3 bn €12.9 bn
• EBIT adj. €497 m €566 mMargin 4.1% 4.4%
thereof
Steel Americas €(319) m €(190) m
• Capex €656 m €516 m
• NFD €6.49 bn €6.25 bn
Q2 Q3
Charts on 3rd Quarter 2010/11August 12, 2011
11 Developing the future.
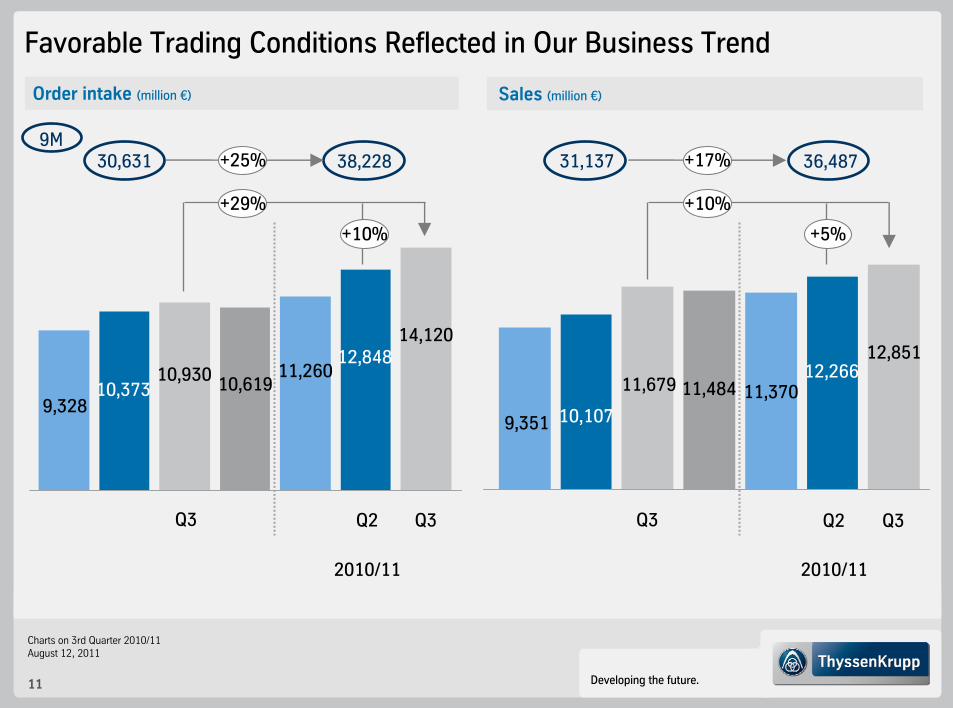
Favorable Trading Conditions Reflected in Our Business Trend
Order intake (million €)
Q3
Sales (million €)
31,13730,6319M
10,37310,930 10,619
11,260
Q2 Q3 Q2
10,107
11,679 11,484 11,370
12,84812,266
2010/11 2010/11
9,3289,351
38,228 36,487
Q3
14,120
Q3
12,851
+29%
+10%
+25% +17%
+10%
+5%

Charts on 3rd Quarter 2010/11August 12, 2011
12 Developing the future.
Strengthening Structural Earning Power
EBIT adjusted development (million €)
Q3
EBIT adj. Groupexcl. Steel Americas
EBIT adj. Steel Americas
EBIT adj. Group
372
293
(79)(130)
696
566
(320)
105
425
Q2(378)
273
651
(319)
497
816
2010/11
348
277
(71)
(190)
566
756
Q3
qoq Δ €(60) m explained by:Stainless Global €(59) m
Charts on 3rd Quarter 2010/11August 12, 2011
13 Developing the future.
2009/10
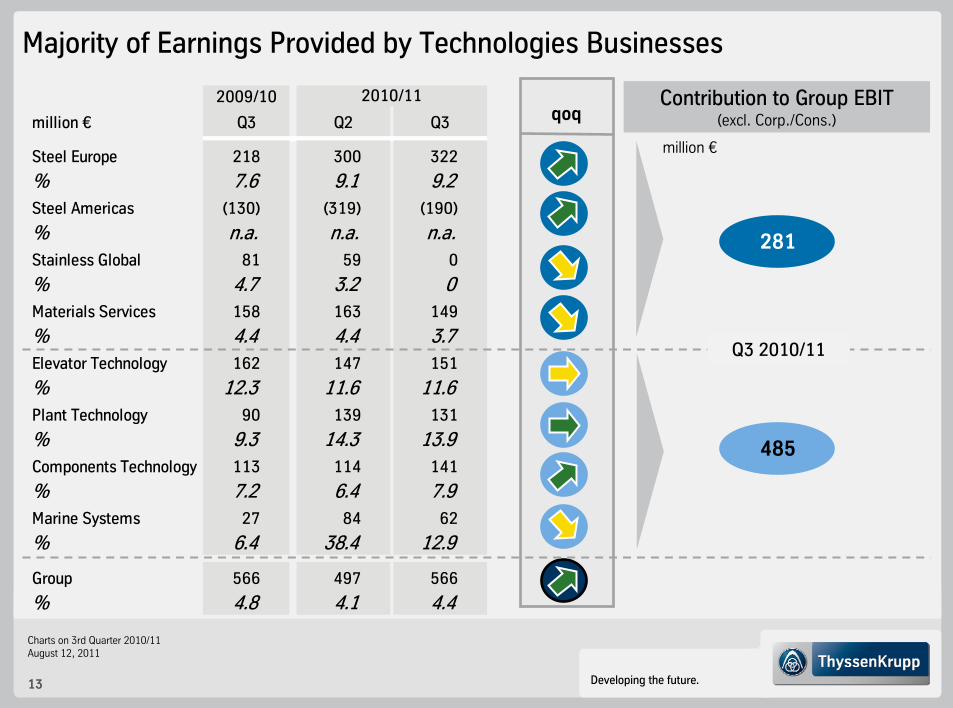
million € Q3 Q2 Q3
Steel Europe 218 300 322
% 7.6 9.1 9.2Steel Americas (130) (319) (190)
% n.a. n.a. n.a.Stainless Global 81 59 0
% 4.7 3.2 0Materials Services 158 163 149
% 4.4 4.4 3.7Elevator Technology 162 147 151
% 12.3 11.6 11.6Plant Technology 90 139 131
% 9.3 14.3 13.9Components Technology 113 114 141
% 7.2 6.4 7.9Marine Systems 27 84 62
% 6.4 38.4 12.9
Group 566 497 566
% 4.8 4.1 4.4
2010/11
Majority of Earnings Provided by Technologies Businesses
qoqContribution to Group EBIT
(excl. Corp./Cons.)
million €
Q3 2010/11
281
485

Charts on 3rd Quarter 2010/11August 12, 2011
14 Developing the future.
Further Improvements in EBIT
EBT (million €)
Q3
EBIT (million €)
278
500
215
1,131
Q2
273
9M
Q3
Net income (million €)
Q2
234298
200
727
101
Q3
191
414
217
918
Q2
145
EPS (€)
Q3 Q2
0.450.58
0.39
1.38
0.31
2010/11
497
2010/11
352
233
2010/11
0.58
2010/11
353 313
195 0.35
1,315 904
604 1.35
545
Q3*
407
Q3*
270
Q3 Q3
0.46
+16% -2%
-17% -2%
+10% +16%
+16% -21%
* Q3 impacted by special item of €(21) m * Q3 impacted by special item of €(21) m

Charts on 3rd Quarter 2010/11August 12, 2011
15 Developing the future.
Q3 2010/11 (million €)
Positive OCF Driven by Strong Performance of Technologies Businesses
OCF
449D/A
Netincome
Deferred taxes
270(64)
(7)
Change in
accruedpensions
3Others
Inventories(623)
Trade accounts receivable
31
Trade accounts payable(101)
(24)
Other provisions
775 1)
Other assets/
liabilities*
* not related to investing or financing activities1) including prepayments mainly from submarine order
709
thereof:• Steel Europe (265) • Steel Americas (265)• Stainless Global (117)
thereof:• Elevator Technology 87• Plant Technology 129 • Components Technology 146• Marine Systems 1) 612

Charts on 3rd Quarter 2010/11August 12, 2011
16 Developing the future.
NFD: Now Behind the Peak
FCF: 198
Capex*NFD
Mar 2011
NFDJun 2011
(6,249)
(516)
Gearing57.6%
OCF
709
(6,492)
Gearing60.6%
5
Divestments
Others
Q3 2010/11 (million €)
* Capex for property, plant & equipment, financial & intangible assets and financial investments
45
thereof:• Steel Americas (472)• Stainless Global (194)
(~ €4.6 bn)
NFDpro forma
After sale of treasury shares
(~ €1.6 bn)

Charts on 3rd Quarter 2010/11August 12, 2011
17 Developing the future.
Tight Capex Management Going Forward
2005/06 2007/082006/07 2008/09
Capex
Divestments
2009/10 2010/11E
3.5
Steel and StainlessAmericas Projects
2011/12E
4.14.2
3.0
2.0
0.30.7
0.3 0.2
Depreciation
Cash flows from investing activities (billion €)
0.6
9M 2010/11 (billion €)
1.95
0.15

Charts on 3rd Quarter 2010/11August 12, 2011
18 Developing the future.
FCF Development: Focus on Progressively Improving FCF Generation
2008/09 2009/10 2010/11
FCF Groupexcl. Steel Americas
FCFSteel Americas
FCF Group(2.1)
1.9
(0.2)
(2.9)
0.8
(2.1)
2011/12 et seq. aim at NFD reduction
Significant positive FCF in Q4 2010/11
2011/12E
(2.1)
(1.0)
(1.1)
Q1 Q2 Q4E
(0.7)
(0.8)
0.1
Q3
0.2
(0.5)
0.7

Charts on 3rd Quarter 2010/11August 12, 2011
19 Developing the future.
Agenda
Strategic Development Program at ThyssenKrupp
Group Performance and Financials
Business Area Performance
Group Outlook

Charts on 3rd Quarter 2010/11August 12, 2011
20 Developing the future.
21 %41 %
38 %
59 %18 %
23 %250 km
500 km
> 500 km
Sales volume
Customers
DuisburgDuisburg
Steel Europe – Q3 2010/11 Highlights
Q3
Order intake in €m
Current trading conditions
2,706
Q2
2,781
Shipments in 1,000 t
3,216 3,093
Q3 Q2
Higher average revenues per ton and further increase of raw material costs
Continuing robust consumption at key customer sectors
Slowdown in orders reflecting cautious stocking into summer months and market waiting for price direction
Best owner process Metal Forming
2010/11
2,929
2010/11
3,142
EBIT in €m; EBIT margin in %
Q3
218193
258
Q2
2010/11
3,7213,431 300
closed
Q3
3,006
Efficient operations & customer proximity
Q3
3,431
Q3
3226.6
8.79.1
9.2120 129
7.6
Multiple
Niches
Large
Scale
Multiple
Niches
Large
Scale
indexed (Q1 2004/05=100) Ø rev/t
130 135 140
* hot-rolled and cold-rolled

Charts on 3rd Quarter 2010/11August 12, 2011
21 Developing the future.
Steel Americas – Q3 2010/11 HighlightsOrder intake in €m
Current trading conditions
Production & shipments in 1,000 t
CSA: ramp-up of coke plant battery B; continuous optimization of specific consumption rates and expansion of grade structures
Steel USA: first volumes being tested by OEMs from the auto, pipe & tube, white & yellow goods industries
Cont’d gradual improvement of real demand
Service Centers with moderate inventories and low months of supply
EBIT in €m
1st Coil from 3rd HDGL on July 15th
Q3 Q2
24
Q3
22
2010/11
84
268
504Q4
Slab productionCSA
Q1
36
430
Q4
ShipmentsSteel USA
Q1
2115
Q2
2010/11
651
Q2
2010/11
306
880
Q3
Q3
403
Q3
(130)
(320)
Q2
(378)
Q3
2010/11
(319)
(190)

Charts on 3rd Quarter 2010/11August 12, 2011
22 Developing the future.
0
20
40
60
80
100
Jan-08 May Sep Jan-09 May Sep Jan-10 May Sep Jan-11 May0
5,00010,000
15,00020,000
25,00030,000
35,000% US$/t
Order intake EU29 (cold-rolled)NickelLong-term average of order intake (2004-2010)
Stainless Global – Q3 2010/11 HighlightsOrder intake in €m
Current trading conditions
Shipments* in 1,000 t EBIT in €m; EBIT margin in %
Nickel price development and order intake (Jan 08=100%)
Q3 Q2
1,317
Q3
1,301
2010/11
1,4831,790
1,360 534456
Q3 Q2 Q3
2010/11
482520 460
Q3
81
5Q2
7
Q3
2010/11
59
EBIT Stainless USA
(7) (18)(10) (11)
0
(29)
Weaker order intake and shipments qoq driven by Ni-price decline despite robust demand from end customers
Slightly decreasing transaction prices in Europe and Asia mainly due to lower alloy surcharges
EBIT Stainless USA: €(29) m
Imports (mainly from Asia) have to be monitored
Moderate inventory levels and Christmas-driven consumption increase bode well for market recovery
4.7
0.3 0.4
3.2
0.0
Source: Eurofer; CRU July 2011, Metalprices (NICKEL) July 2011
125 120
indexed (Q1 2004/05=100)
122 131 129
* hot-rolled and cold-rolled
Ø transaction price/t

Charts on 3rd Quarter 2010/11August 12, 2011
23 Developing the future.
2010/112009/102008/09
0
100
200
300
400
500
600
700
800
900
1,000
O N D J F M A M J J A S O N D J F M A M J J A S O N D J F M A M J J A S
Cold rolled sheetsGalvanized sheetsQuarto plates (R37-2)
J
940
Materials Services – Q3 2010/11 HighlightsOrder intake* in €m
Current trading conditions
Materials warehousing shipments in 1,000 t EBIT in €m; EBIT margin in %
Q3 Q2
3,695
Q3
3,370
2010/11
3,2593,918 3,973 1,252 1,223
Q3 Q2 Q3
2010/11
1,2561,473
1,431
Q3
158
10885
Q2
2010/11
163
Q3
149
4.43.1 2.6
4.4 3.7
Continuing strong demand from automotive, engineering and aerospace industry
Ongoing robust demand from Western and Eastern Europe as well as from North America, Southern Europe more subdued
Stable volumes, but softer pricing since April
Uncertainty regarding further price development
Inventories in Europe and US at moderate levels
*thereof materials warehousing business ~ 60% ROCE in %
20.0
13.610.4
19.117.1
Rolled steel price development (€/t)
Source: Purchase Price ThyssenKrupp Materials International, Product Mgmt Rolled Steel
855
800 650630
600

Charts on 3rd Quarter 2010/11August 12, 2011
24 Developing the future.
Elevator Technology – Q3 2010/11 HighlightsOrder intake in €m
Current trading conditions
Units under Maintenance EBIT in €m; EBIT margin in %
Recent major orders
Q3 Q2
1,390
Q3
1,264
2010/11
1,3061,358 1,320
Q3
162156
171
Q2
2010/11
147
Q3
151
12.3
10.9
13.2
11.6 11.6
Brazil and China remain growth driversfor new equipment
Diverse picture for new equipment demand in Europe (stable in the north, weaker in the south)
Recovery of US demand for new equipment with delays
Modernization supports business growth inmature markets
Maintenance business with growth across all regions
Dalian, China (MOD)First two TWIN elevators in China
Xi‘an Subway Line, China (NE)133 escalators
Metro Sofia, Bulgaria (NE)19 elevators, 31 escalators
New Parkland Hospital, Dallas (NE)40 elevators
Frankfurt Airport, Germany (NE)18 PBB
New Parkland HospitalDallas, USA
04/05 09/10
c.800,000
1,000,000ytd book-to-bill: 1.03

Charts on 3rd Quarter 2010/11August 12, 2011
25 Developing the future.
Plant Technology – Q3 2010/11 HighlightsOrder intake in €m
Current trading conditions
Order backlog in €m EBIT in €m; EBIT margin in %
Largest order intake Q3 2010/11
Q3 Q2
800
Q3
911
2010/11
1,016896
1,097 6,473
6,217
Q3 Q2 Q3
2010/11
6,2266,255 6,369
Highest order intake since Q1 2009/10
Strong order intake with cement plants, larger new orders from Indonesia and Mexico
New projects awarded also from minerals industry, e.g. in Brazil and Peru
EBIT margin at 13.9% continues on exceptionally high levels, accumulation of PoC milestones for EBIT realization of some higher-margin orders
Greenfield project
Capacity: 4,000 tpd
Turnkey delivery
Order value: ~ €200 m
Commissioning: 2013
(Picture shows comparable project)
Cement plant for Holcim, Indonesia:
Q3
90 102107
Q2
2010/11
139
Q3
131
9.3 9.6
11.9
14.3 13.9
ytd book-to-bill: 1.07

Charts on 3rd Quarter 2010/11August 12, 2011
26 Developing the future.
Components Technology – Q3 2010/11 HighlightsOrder intake in €m Quarterly order intake auto components EBIT in €m; EBIT adj. margin in %
Q3 Q2
1,584
Q3
1,563
2010/11
1,6021,795
1,811
Q3
66
56
127
Q2
2010/11
114
Q3
141
7.2
3.7
7.9
6.4
7.9
Order intake and sales continue on high levels, supported by strong demand from automotive and industrial components
Production especially in most of the auto supply businesses close to maximum capacity levels
EBIT margin back to Q1 level (EBIT in Q2 was negatively impacted by ~€20 m warranty provisions)
113
58
EBIT adjustedEBIT
Increasing customer orders require reopening of US facility for automotive casting components (e.g. brake drums) in Q2 2011/12
Facility had been idled in January 2010
Results in positive impairment reversal of ~ €40 m(will be booked as special item in Q4 2010/11)
Current trading conditionsReopening of iron foundry in Etowah, TN, USA
Q4Q3Q2Q1
2008/09
Q3Q2Q1
2009/10
Q4Q3
2007/08
Q4 Q1
2010/11
Q2 Q3
Q3 2010/11: ~20% above pre-crisis level(average of FY 2007/08)
ytd book-to-bill: 1.01

Charts on 3rd Quarter 2010/11August 12, 2011
27 Developing the future.
Marine Systems – Q3 2010/11 HighlightsOrder intake in €m
Current trading conditions
EBIT in €m; EBIT adj. margin in %
Q3 Q2
108
Q3
174
2010/11
426
149
2,155
Q3
8
103
46
Q2
2010/11
84
Q3
626.4
(3.6)
9.1
38.4
12.9
First sales realized for Turkish submarines
Q3 EBIT impacted by several aperiodic items from project execution/cancellation
Efforts with Abu Dhabi MAR ceased to form JV for naval & non-naval shipbuilding business of Blohm+Voss, Hamburg
Strategy unchanged to focus on naval shipbuilding (submarines and naval surface vessels) and to divest civil shipbuilding activities
27
(9)
EBIT adjustedEBIT
Order backlog in €m
5,3685,315
Q3 Q2 Q3
2010/11
5,358 5,290
6,958
Order intake Q3 2010/11
6 submarine material packages for class U 214
Customer: Turkish Navy
Order intake Q3: ~ €2 bn
Delivery of 1st submarine: 2018
Contribution to capacity utilization at HDW in Kiel for the next 10 years
ytd book-to-bill: 2.27

Charts on 3rd Quarter 2010/11August 12, 2011
28 Developing the future.
Agenda
Strategic Development Program at ThyssenKrupp
Group Performance and Financials
Business Area Performance
Group Outlook
Charts on 3rd Quarter 2010/11August 12, 2011
29 Developing the future.
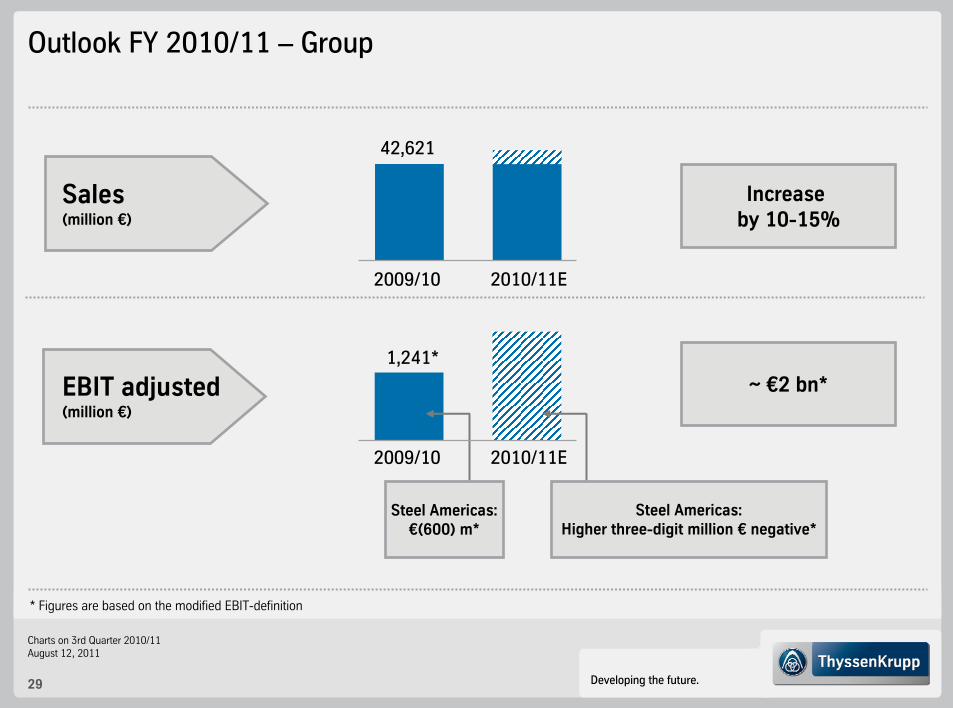
Outlook FY 2010/11 – Group
Sales(million €)
Increase by 10-15%
EBIT adjusted(million €)
* Figures are based on the modified EBIT-definition
2009/10 2010/11E
42,621
2009/10 2010/11E
1,241*
~ €2 bn*
Steel Americas:€(600) m*
Steel Americas:Higher three-digit million € negative*

Charts on 3rd Quarter 2010/11August 12, 2011
30 Developing the future.
Ramp-upSteel Americas
Our Value Creation Program
FinancialStabilization
Financing Capacities
GrowCore
Businesses
Strategic Push
Performance Orientation
Profit & Cash Improvement
Leadership & Culture
ChangeManagement
Portfolio Optimization
ExitNon-Core
Businesses
++ +
+
Positioning of ThyssenKrupp

Charts on 3rd Quarter 2010/11August 12, 2011
31 Developing the future.
Q&A
Agenda

Charts on 3rd Quarter 2010/11August 12, 2011
32 Developing the future.
Financial Calendar – FY 2010/11 and FY 2011/12 (I)
August Roadshows
London (15th), London (16th – Japanese investors),
Edinburgh (17th), Dublin (18th)
September Roadshows
Frankfurt (9th), Zurich (13th)
Conferences
Commerzbank “Sector Conference Week”, Frankfurt (2nd)
Credit Suisse “Capital Goods & Aerospace and Defence Conference”, London (15th)
UBS “Best of Germany Conference”, New York (14th-15th)
Deutsche Bank “5th German Corporate Conference”, San Francisco (19th)
Credit Suisse “Global Steel & Mining Conference”, London (21st)
UniCredit “German Investment Conference”, Munich (28th)

Charts on 3rd Quarter 2010/11August 12, 2011
33 Developing the future.
Financial Calendar – FY 2010/11 and FY 2011/12 (II)
October Plant Tour Brazil (12th-14th)
Conferences
Commerzbank “Corporate Days”, London (20th)
November Conferences
Deutsche Bank “BRICS Metals & Mining Conference”, London (3rd)
December Conference Call FY 2010/11 (6th)
Capital Markets Day “Technologies”, Essen (7th)
Phone: +49 201 844-536464 E-mail: [email protected]: www.thyssenkrupp.com
Contact Details:ThyssenKrupp AGThyssenKrupp Allee 145143 Essen - Germany

Charts on 3rd Quarter 2010/11August 12, 2011
34 Developing the future.
Contact Details ThyssenKrupp Corporate Center Investor Relations
Phone numbers +49 201-844-
Dr. Claus Ehrenbeck -536464 Rainer Hecker -538830Head of Investor Relations Senior IR Manager
Stefanie Bensch -536480 Christian Schulte -536966Assistant Senior IR Manager
Iris aus der Wieschen -536367 Sabine Berger -536420Team Assistant IR Manager
Ute Kaatz -536466 Klaudia Kelch -538371Event Manager IR Manager
Hartmut Eimers -538382 Tim Lange -536309IR Manager IR Manager
To be added to the IR mailing list,
send us a brief e-mail with your details!
E-mail: [email protected]

Charts on 3rd Quarter 2010/11August 12, 2011
35 Developing the future.
Appendix
Agenda
Charts on 3rd Quarter 2010/11August 12, 2011
36 Developing the future.
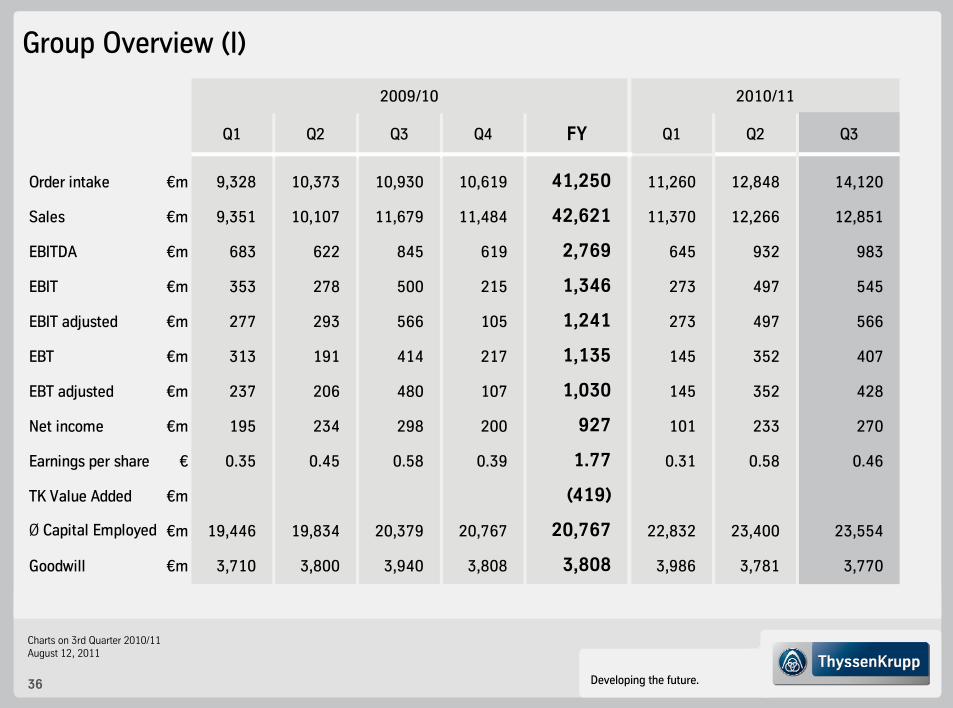
Group Overview (I)
Q1 Q2 Q3 Q4 FY Q1 Q2 Q3
Order intake €m 9,328 10,373 10,930 10,619 41,250 11,260 12,848 14,120
Sales €m 9,351 10,107 11,679 11,484 42,621 11,370 12,266 12,851
EBITDA €m 683 622 845 619 2,769 645 932 983
EBIT €m 353 278 500 215 1,346 273 497 545
EBIT adjusted €m 277 293 566 105 1,241 273 497 566
EBT €m 313 191 414 217 1,135 145 352 407
EBT adjusted €m 237 206 480 107 1,030 145 352 428
Net income €m 195 234 298 200 927 101 233 270
Earnings per share € 0.35 0.45 0.58 0.39 1.77 0.31 0.58 0.46
TK Value Added €m (419)
Ø Capital Employed €m 19,446 19,834 20,379 20,767 20,767 22,832 23,400 23,554
Goodwill €m 3,710 3,800 3,940 3,808 3,808 3,986 3,781 3,770
2009/10 2010/11

Charts on 3rd Quarter 2010/11August 12, 2011
37 Developing the future.
Group Overview (II)
* incl. financial investments
Q1 Q2 Q3 Q4 FY Q1 Q2 Q3
Capital expenditures* €m 777 738 942 1,053 3,510 778 656 516
Depreciation/amort. €m 331 346 348 412 1,437 380 447 449
Operating cash flow €m (308) 184 (23) 1,015 868 (1,435) (79) 709
Cash flow from divestm. €m 488 17 15 32 552 125 17 5
Cash flow from investm. €m (777) (738) (942) (1,053) (3,510) (778) (656) (516)
Free cash flow €m (597) (537) (950) (6) (2,090) (2,088) (718) 198
Cash and cash equivalents (incl. short-term securities) €m
5,073 4,614 3,914 3,681 3,681 2,869 2,022 1,877
Net financial debt €m 2,130 2,652 3,753 3,780 3,780 5,814 6,492 6,249
Employees 174,763 172,576 174,541 177,346 177,346 178,291 180,412 182,425
2009/10 2010/11

Charts on 3rd Quarter 2010/11August 12, 2011
38 Developing the future.
EBIT 2010/11 (million €) Special items (million €)
Reconciliation of EBIT Adjusted by Special Items
(21)
(21)
--Group
• Retroactive purchaseprice adjustment
Corporate
Q1 Q21,315
EBIT EBIT adjusted
Q3: (21)Q3
273
497
545
Q1
Q2
Q3
273
497
566
1,3369M

Charts on 3rd Quarter 2010/11August 12, 2011
39 Developing the future.
Pension and Similar Obligations: Further Decrease in Q3
Expected Normalized* Development of Accrued Pension and Similar Obligations (in € m)
“Patient” long-term debt, no immediate redemption in one go
Interest cost independent of ratings, covenants etc.
Mainly funded by TK’s operating assets
Decrease in pension obligations in Q3 mainly driven by cash-out for pension payments and change disposal group
>90% of pension provision in Germany; German pension system requires no mandatory funding of plan assets
Accrued pension liability Germany
Accrued postretire-ment oblig. other than pensions
Other accruedpension-related obl.
Q2 10/11
Accrued Pension and Similar Obligations(in € m)
Q3 10/11
5,416
4621,155
7,155
Accrued pension liability outside GER
234
5,878
Discount rateGermany
5.10 5.10
8,086
09/10 10/11 11/12 12/13 13/14 14/15 …
- 100-200 p.a.
* Assumption: unchanged discount rate
Number of plan participants steadily decreasing
>70% of obligations owed to retired employees,average age ~73 years
Declining pension obligations over time(short-term variation possible, mainly due to change indiscount rate)
Declining cash-out from pension benefit payments in medium to long term(2009/10: €569 m; exp. 10 year average from 2010/11 onwards: €557 m)
(112) (152) Reclassification liabilities associated with assets held for sale
1,136
7,049213
5,8525,399
453

Charts on 3rd Quarter 2010/11August 12, 2011
40 Developing the future.
Pension payments higher than pension cost:Indicator for mature pension schemes
Pension Obligations: TK with Mature Pension Schemes
Interestcost
Net Periodic Pension Cost vs. Pension Benefit Payments(Defined Benefit Obligations; FY 2009/10; in € m)
398
(119)
Expected returnon plan assets
108
387
Net periodic pension cost
(Past) Service cost,other P+L effects*
569
Pension benefitpayments
Shown inP&L as:
Interest income/expense Personnel expenses(functional P&L lines)
* Other P+L effects includesettlement/curtailment gains/losses
and termination benefits

Charts on 3rd Quarter 2010/11August 12, 2011
41 Developing the future.
55.2%
7,671
177
8,327
4,235
2,833
34.0% 2.2%
Balance Sheet Structure
Equity
Net financialposition
(8.4)%
Sep 2006Sep 2005Sep 2004Sep 2003
8,927
(747)*
7,944
10,447
(223)*
Sep 2008
(2.1)%
Sep 2007
11,489
1,584
13.8%
25.4% 26.7% 22.1% 24.5% 27.4% 27.6% Equity ratio
Gearing
* Net financial receivables
Sep 2009
21.2%
23.4%
9,696
2,059
Net financial position, equity and ratios (million €)
June 2011
10,388
3,780
57.6%
24.3%
Sep 2010
10,840
6,249
36.4%
23.8%

Charts on 3rd Quarter 2010/11August 12, 2011
42 Developing the future.
5,730
Solid Financial Situation – No Short-Term Refinancing Needs
4th quarter2010/11
2011/12 2012/13 2013/14 after2014/15
Available committed credit facilities
Cash and cash equivalents
362 461
2,078
1,089
2,217
3,853
1,919
1,877*
* incl. securities of €6 million
Total: 8,126
Liquidity analysis and maturity profile of gross financial debt as of June 30, 2011 (million €)
2014/15

Charts on 3rd Quarter 2010/11August 12, 2011
43 Developing the future.
Long term- Short term- Outlookrating rating
Standard & Poor’s BB+ B stable
Moody’s Baa3 Prime-3 stable
Fitch BBB- F3 stable
Restoring / maintaining investment grade statuswith all three rating agencies is key!
ThyssenKrupp Rating

Charts on 3rd Quarter 2010/11August 12, 2011
44 Developing the future.
Outlook FY 2010/11 – Business Areas
Steel Europe
Continuing good capacity utilization; improvement in shipments and average selling prices
Steel AmericasNegative EBIT in the higher 3-digit million € range, mainly due to higher depreciation, startup losses for the new plants and higher expenditures for input materials at CSA; to improve as the ramp-up progresses
Stainless Global
Improvement in volumes and base prices
Materials Services
Elevator Technology
Continuing high earnings contribution thanks to high orders in hand and steady maintenance business
Plant Technology
Rising earnings and stable sales from high order backlog in project business; rising order intake
Components Technology
Increased sales and earnings from components for the automotive, construction and machinery sectors
Marine Systems
Positive earnings contribution, mainly from strategic core business as system integrator in naval shipbuilding (submarines and naval surface vessels)
Improvement in volumes and selling prices

Charts on 3rd Quarter 2010/11August 12, 2011
45 Developing the future.
Portfolio Optimization: Exit Non-Core Businesses
Current Divestments Strategic DevelopmentAdditional Divestments
Metal Forming Tailored Blanks
Xervon
Stainless Global
BVSS
Waupaca
Bilstein-Gruppe(Shock absorbers)
Presta Steering
Sales: ~€1.1 bn; Employees: ~5,700 Sales: ~€0.6 bn; Employees: ~900
Sales: ~€0.7 bn; Employees: ~9,300
Sales: ~€5.9 bn; Employees: ~11,000
Sales: ~€0.9 bn; Employees: ~3,000
Sales: ~€0.7 bn; Employees: >3,000
Consolidation to achassis-full-service-providerSales: ~€2.2 bn; Employees: ~ 6,500
Sales: ~€0.5 bn; Employees: ~1,600
Tech
nolo
gies
Mat
eria
ls
Steel Europe
StainlessGlobal
MaterialsServices
Com-ponentsTechno-
logy
MarineSystems
Sales: FY 2009/10; Employees: Sep 30, 2010
Bilstein-Gruppe(Automotive Systems Brazil)
Bilstein-Gruppe(Springs & Stabilizers)
closed

Charts on 3rd Quarter 2010/11August 12, 2011
46 Developing the future.
Steel Europe
Key figures
Q1 Q2 Q3 Q4 FY Q1 Q2 Q3
Order intake €m 2,500 2,999 2,706 2,781 10,986 2,929 3,721 3,006
Sales €m 2,281 2,667 2,887 2,935 10,770 2,958 3,287 3,518
EBITDA €m 274 339 359 329 1,301 399 439 458
EBIT €m 127 193 218 193 731 258 300 322
EBIT adjusted €m 127 193 218 193 731 258 300 322
TK Value Added €m 248
Ø Capital Employed €m 5,070 5,212 5,320 5,370 5,370 5,695 5,797 5,830
OCF €m (123) 235 152 329 593 (433) 322 184
CF from divestm. €m 3 (1) 3 4 10 0 14 1
CF for investm. €m (39) (67) (54) (126) (286) (100) (84) (94)
FCF €m (159) 166 102 208 316 (533) 252 91
35,582 34,872 34,434 34,711 34,711 34,204 33,917 33,702Employees
2009/10 2010/11

Charts on 3rd Quarter 2010/11August 12, 2011
47 Developing the future.
Q1
2010/11
3,142
Average revenues per ton*, indexed Q1 2004/2005 = 100
HKM share
873 837
449
410 726 859 789
Q2
Steel Europe: Output, Shipments and Revenues per Metric Ton
Fiscal year
2006/07 2007/08
3,615
Q1
2009/10
2,306
Cold-rolledHot-rolled; incl. slabs
122 130139120
140129
100125
114133
156135
111129 136
116
153
116138
118 118133 134
115 123
150
120
2005/062004/05 2006/07
Q3 Q4
2007/08
2008/09
3,553
Q1
2010/11
2,964
Crude steel output (incl. share in HKM) 1,000 t/quarter Shipments*: Hot-rolled and cold-rolled products 1,000 t/quarter
2008/09
2,742 2,716
1,8582,554 2,601 2,755 2,603 2,677
Fiscal year
2006/07 2007/08 2008/09
3,513
1,048
2,465
3,590
1,093
2,497
* shipments and average revenues per ton until FY 2007/08 relate to former Steel segment
3,3263,614
3,392
Q1 Q2 Q3 Q4Q1 Q2 Q3 Q4 Q1 Q2 Q3 Q4 Q1 Q2 Q3 Q4
Q1
2009/10
2,533
715
1,818
Q2
3,167
2,199
968
3,216
Q3
2,165
1,051
Q4
3,093
2,000
1,093
3,542
Q1 Q2 Q3 Q4 Q1 Q2 Q3 Q4 Q1
2009/10 2010/11
2,335
660
1,675
865
2,107
1,035
2,531
3,385
854
Q2 Q2
3,431
2,221
1,210
Q2
2,563
3,349
786
Q3 Q3
3,431
Q3
1,201
2,230

Charts on 3rd Quarter 2010/11August 12, 2011
48 Developing the future.
0
1
2
3
4
5
6
7
8
9
A 0
7J
07
O 0
7J
08
A 0
8J
08
O 0
8J
09
A 0
9J
09
O 0
9J
10
A 1
0J
10
O 1
0J
11
A 1
1J
11
O 1
1
0.0
0.5
1.0
1.5
2.0
2.5
3.0
J'0
5
J'0
6
J'0
7
J'0
8
J'0
9
J'1
0
J'1
1
1
2
3
4
5
6
7
0
1
2
3
4
5
6
7
8
9
J'0
5
J'0
6
J'0
7
J'0
8
J'0
9
J'1
0
J'1
1
1.5
2.0
2.5
3.0
3.5
4.0
4.5
Steel: Inventories and Months of Supply
InventoriesChina
Inventories and Months of Supply - Europe
Inventories and Months of Supply - USA
Source(s): TKS, EASSC, Credit Suisse, MSCI, UBS, MySteel
Europe: European SSC: Inventories at month end / flat carbon steel w/o quarto
Inventories[m t]
MOS[months]
USA: June MSCI inventories, carbon flat-rolled
Inventories[m st]
MOS[months]
China: flat steel inventory in 23 major cities (HR, CR and Plate)
Inventories[m t]

Charts on 3rd Quarter 2010/11August 12, 2011
49 Developing the future.
Steel Americas
Key figures
Q1 Q2 Q3 Q4 FY Q1 Q2 Q3
Order intake €m 0 23 24 22 69 84 268 504
Sales €m 0 23 24 21 68 86 260 429
EBITDA €m (70) (78) (119) (297) (564) (328) (211) (95)
EBIT €m (71) (79) (130) (320) (600) (378) (319) (190)
EBIT adjusted €m (71) (79) (130) (320) (600) (378) (319) (190)
TK Value Added €m (1,111)
Ø Capital Employed €m 4,620 5,006 5,359 5,678 5,678 7,230 7,430 7,524
OCF €m (171) (93) (221) (361) (847) (585) (360) (269)
CF from divestm. €m 2 1 5 (4) 4 90 1 (6)
CF for investm. €m (455) (447) (622) (530) (2,054) (477) (424) (197)
FCF €m (624) (539) (839) (895) (2,897) (972) (783) (472)
1,794 2,256 2,876 3,319 3,319 3,571 3,748 3,995Employees
2009/10 2010/11

Charts on 3rd Quarter 2010/11August 12, 2011
50 Developing the future.
Stainless Global
Key figures
Q1 Q2 Q3 Q4 FY Q1 Q2 Q3
Order intake €m 943 1,560 1,317 1,301 5,121 1,483 1,790 1,360
Sales €m 1,210 1,461 1,708 1,522 5,901 1,605 1,856 1,586
EBITDA €m (4) (60) 121 46 103 48 103 43
EBIT €m (42) (101) 81 5 (57) 7 59 0
EBIT adjusted €m (42) (101) 81 5 (57) 7 59 0
TK Value Added €m (323)
Ø Capital Employed €m 2,789 2,795 2,864 2,948 2,948 3,362 3,414 3,442
OCF €m (100) 88 (261) 57 (216) (308) 82 (139)
CF from divestm. €m 0 1 1 3 6 6 (4) 0
CF for investm. €m (68) (87) (87) (101) (344) (62) (52) (55)
FCF €m (168) 3 (348) (41) (554) (364) 26 (194)
11,597 11,235 11,150 11,235 11,235 11,196 11,292 11,339Employees
2009/10 2010/11

Charts on 3rd Quarter 2010/11August 12, 2011
51 Developing the future.
Stainless Global: Output, Shipments and Average Transaction Price
2007/08
Shipments Stainless*: Hot-rolled and cold-rolled productsCrude steel output* 1,000 t/quarter
Q1Fiscal year 2009/10
Q2
* including carbon, forging, Ni-Alloys
Q3 Q4 Q1Fiscal year 2009/10
Q2
Cold-rolled, including precision strip Hot-rolled
Q3 Q1Q4
1229598100
82
161
123
9577
94 82
171
123 131 129
7092 98
177
134 125
90118
139122
89
120
2007/08
Q12005/06Q2 Q3 Q4Q1
2004/05
Q2 Q3 Q4 Q1
2006/07
Q2 Q3 Q4
2008/09
Q1
Average transaction price* per ton, indexed Q1 2004/2005 = 100
* consolidated
Q1
2007/08
1,000t/quarter
516 504
2010/11
624560
87
429
147
357
2010/11
2009/10
129
447
576534
412
122
456
92
364
Q1 Q2 Q3 Q4 Q1 Q2 Q3 Q4 Q1 Q2 Q3 Q4
2010/11
474
2008/09
603657 665
492
87
334
421482
78
404
2008/09
652
Q2
520
102
418
Q2
Q2
Q3
578
Q3
90
370
460
Q3
* Base Price Germany, Traders/SSC, and alloy surcharge 304 (1.4301), 2 mm sheet

Charts on 3rd Quarter 2010/11August 12, 2011
52 Developing the future.
0
2,000
4,000
6,000
8,000
0
2,000
4,000
6,000
8,000
Stainless Global: Price Development and Import Situation
22
4252
3645
57 59
3744
40 39 4248
56
25
20
05
20
06
20
07
20
08
20
09
20
10
Jun
Jul
Aug
Sep Oct
Nov Dec
Jan-
11
Feb
Mar
Apr
Asia Americas Others
Development of base price, alloy surcharge and nickel price Cold-rolled imports from third countries into EU [000t/month]
Regional price development*
Source: Eurofer July 2011, SL-NR VV-BDG
63
0
500
1,000
1,500
2,000
2,500
3,000
3,500
4,000
4,500
5,000
Jan-06
Jul Jan-07
Jul Jan-08
Jul Jan-09
Jul Jan-10
Jul Jan-11
Jul
0
5,000
10,000
15,000
20,000
25,000
30,000
35,000
40,000
45,000
50,000
55,000
* Base Price Germany, Traders/SSC, 304 (1.4301)., 2 mm sheetSource: CRU July 2011, Metalprices (NICKEL) August 2011
EUR/t US$/t
Base Price EU*
Alloy Surcharge EUNickel
67
Jan 11
Jan 10
Jan 09
Jan 08
Jan 07
Jan 06
Jan 05
Jan 04
Jan 03
Jan 02
* AISI 304 (1.4301) CR Flat, 2 mmSource: CRU July 2011 (EU+USA), SL-SKS August 2011 (Wuxi Market prices CHINA)
US$/t
China
USA
Europe

Charts on 3rd Quarter 2010/11August 12, 2011
53 Developing the future.
Stainless: Inventories and Stock Reach
Germany (cold-rolled products) USA (hot- and cold-rolled products all shapes)
160
140
120
100
80
60
40
20
0JAN 2011
JAN 2010
JAN 2009
JAN 2008
JAN 2007
JAN 2006
JAN 2005
160
140
120
100
80
60
JAN 2009
JAN 2008
JAN 2007
JAN 2006
JAN 2005
40
20
0JAN 2011
JAN 2010
Source: MSCI July 2011
Average Stock Reach
Source: EHV June 2011
Stock level: INDEX Jan 2005 = 100Stock Reach: Calendar Days
Stock level: INDEX Jan 2005 = 100Stock Reach: Calendar Days
InventoriesStock Reach Average Stock ReachInventoriesStock Reach

Charts on 3rd Quarter 2010/11August 12, 2011
54 Developing the future.
Materials Services
Key figures
Q1 Q2 Q3 Q4 FY Q1 Q2 Q3
Order intake €m 2,681 3,059 3,695 3,370 12,805 3,259 3,918 3,973
Sales €m 2,760 2,881 3,598 3,524 12,763 3,311 3,704 3,980
EBITDA €m 168 101 191 150 610 117 197 181
EBIT €m 129 68 158 108 463 85 163 149
EBIT adjusted €m 48 68 158 108 382 85 163 149
TK Value Added €m 193
Ø Capital Employed €m 3,146 3,094 3,165 3,179 3,179 3,273 3,422 3,485
OCF €m (82) (102) (25) 538 330 (497) 103 (14)
CF from divestm. €m 308 3 1 21 335 10 14 (1)
CF for investm. €m (90) (20) (28) (49) (188) (64) (22) (18)
FCF €m 136 (118) (53) 510 477 (551) 95 (33)
31,972 31,482 32,096 33,856 33,856 34,196 35,391 35,440Employees
2009/10 2010/11

Charts on 3rd Quarter 2010/11August 12, 2011
55 Developing the future.
Elevator Technology
Key figures
Q1 Q2 Q3 Q4 FY Q1 Q2 Q3
Order intake €m 1,230 1,215 1,390 1,264 5,099 1,306 1,358 1,320
Sales €m 1,226 1,221 1,313 1,428 5,188 1,299 1,267 1,298
EBITDA €m 182 180 180 185 727 189 165 168
EBIT €m 165 163 162 156 646 171 147 151
EBIT adjusted €m 165 163 162 156 646 171 147 151
TK Value Added €m 461
Ø Capital Employed €m 2,208 2,254 2,301 2,307 2,307 2,249 2,272 2,260
OCF €m 87 238 74 165 563 53 168 87
CF from divestm. €m 3 (1) 1 2 4 3 2 (1)
CF for investm. €m (15) (8) (20) (36) (78) (18) (16) (26)
FCF €m 75 229 56 131 490 38 154 60
42,926 42,787 43,066 44,024 44,024 44,489 44,937 45,603Employees
2009/10 2010/11
Charts on 3rd Quarter 2010/11August 12, 2011
56 Developing the future.
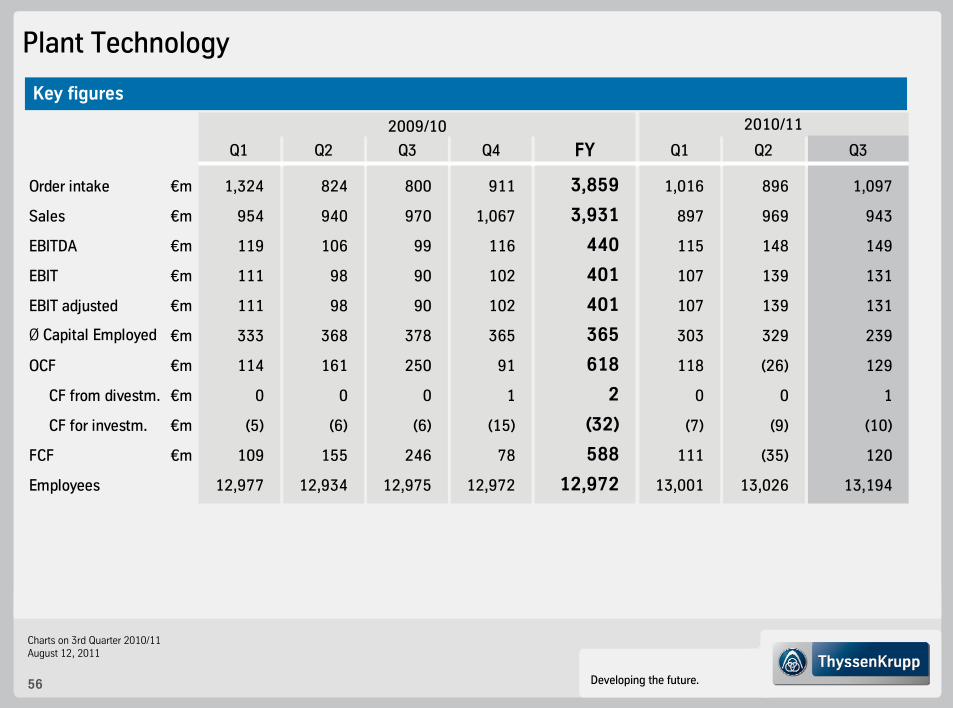
Plant Technology
Key figures
Q1 Q2 Q3 Q4 FY Q1 Q2 Q3
Order intake €m 1,324 824 800 911 3,859 1,016 896 1,097
Sales €m 954 940 970 1,067 3,931 897 969 943
EBITDA €m 119 106 99 116 440 115 148 149
EBIT €m 111 98 90 102 401 107 139 131
EBIT adjusted €m 111 98 90 102 401 107 139 131
Ø Capital Employed €m 333 368 378 365 365 303 329 239
OCF €m 114 161 250 91 618 118 (26) 129
CF from divestm. €m 0 0 0 1 2 0 0 1
CF for investm. €m (5) (6) (6) (15) (32) (7) (9) (10)
FCF €m 109 155 246 78 588 111 (35) 120
12,977 12,934 12,975 12,972 12,972 13,001 13,026 13,194Employees
2009/10 2010/11

Charts on 3rd Quarter 2010/11August 12, 2011
57 Developing the future.
Components Technology
Key figures
Q1 Q2 Q3 Q4 FY Q1 Q2 Q3
Order intake €m 1,169 1,337 1,584 1,563 5,653 1,602 1,795 1,811
Sales €m 1,237 1,344 1,568 1,575 5,724 1,599 1,769 1,779
EBITDA €m 124 144 144 154 566 196 186 220
EBIT €m 57 73 66 56 252 127 114 141
EBIT adjusted €m 57 73 113 58 301 127 114 141
TK Value Added €m 14
Ø Capital Employed €m 2,575 2,603 2,641 2,647 2,647 2,688 2,734 2,760
OCF €m 70 80 211 189 551 (25) 46 146
CF from divestm. €m 2 9 (3) 4 12 4 1 4
CF for investm. €m (64) (50) (47) (125) (288) (33) (55) (90)
FCF €m 8 38 161 67 275 (54) (8) 60
27,997 27,894 28,860 29,144 29,144 29,649 30,080 31,049Employees
2009/10 2010/11

Charts on 3rd Quarter 2010/11August 12, 2011
58 Developing the future.
Marine Systems
Key figures
Q1 Q2 Q3 Q4 FY Q1 Q2 Q3
Order intake €m 110 139 108 174 531 426 149 2,155
Sales €m 254 287 423 247 1,211 504 219 479
EBITDA €m 21 33 19 106 179 51 87 71
EBIT €m 16 18 8 103 145 46 84 62
EBIT adjusted €m 21 33 27 (9) 72 46 84 62
Ø Capital Employed €m 1,151 1,159 1,165 1,174 1,174 1,289 1,335 1,344
OCF €m (124) 145 (83) 31 (31) (26) 48 612
CF from divestm. €m 0 2 0 0 2 11 5 0
CF for investm. €m (2) (1) (1) (4) (8) (1) (3) (3)
FCF €m (126) 146 (84) 27 (36) (16) 50 609
7,593 6,669 6,588 5,488 5,488 5,407 5,372 5,398Employees
2009/10 2010/11

Charts on 3rd Quarter 2010/11August 12, 2011
59 Developing the future.
80%SIAG
100%ThyssenKrupp
(Engineering)20%
ThyssenKrupp
NavalSubmarines
NavalSurface
Mega Yachts Container
Kockums HSY: 75% ADM
100%ThyssenKrupp
(Engineering & Construction)
Submarines
Container
Blohm + Voss Naval(BVN)
Howaldtswerke Deutsche Werft(HDW)
Hamburg Kiel Emden
SIAG
25% TK
100%For Disposal
Mega Yachts(B + V
Shipyards)
Blohm + Voss Shipyards & Services(BVSS)
Hamburg
Service(B + V Repair)
Components(B + V
Industries)
Sale HDW Gaarden(civil shipbuilding) to ADM
Announced(June 2011)
Marine Systems: Target StructureExit from civil shipbuilding; focus on naval engineering and submarines

Charts on 3rd Quarter 2010/11August 12, 2011
60 Developing the future.
Corporate: Overview
Corporate
Q1 Q2 Q3 Q4 FY Q1 Q2 Q3
Order intake €m 31 31 32 38 132 31 33 32
Sales €m 31 31 32 37 131 31 33 32
EBITDA €m (58) (58) (69) (61) (246) (78) (102) (109)
EBIT €m (65) (71) (75) (80) (291) (88) (111) (120)
OCF €m (203) (624) 23 (22) (827) 257 (452) (18)
2,325 2,447 2,496 2,597 2,597 2,578 2,649 2,705Employees
2009/10 2010/11

Charts on 3rd Quarter 2010/11August 12, 2011
61 Developing the future.
Business Area Overview – Quarterly Order Intake
million € Q1 Q2 Q3 Q4 FY Q1 Q2 Q3
Steel Europe 2,500 2,999 2,706 2,781 10,986 2,929 3,721 3,006
Steel Americas 0 23 24 22 69 84 268 504
Stainless Global 943 1,560 1,317 1,301 5,121 1,483 1,790 1,360
Materials Services 2,681 3,059 3,695 3,370 12,805 3,259 3,918 3,973
Elevator Technology 1,230 1,215 1,390 1,264 5,099 1,306 1,358 1,320
Plant Technology 1,324 824 800 911 3,859 1,016 896 1,097
Components Technology 1,169 1,337 1,584 1,563 5,653 1,602 1,795 1,811
Marine Systems 110 139 108 174 531 426 149 2,155
Corporate 31 31 32 38 132 31 33 32
Consolidation (660) (814) (726) (805) (3,005) (876) (1,080) (1,138)
Group 9,328 10,373 10,930 10,619 41,250 11,260 12,848 14,120
2009/10 2010/11
Charts on 3rd Quarter 2010/11August 12, 2011
62 Developing the future.
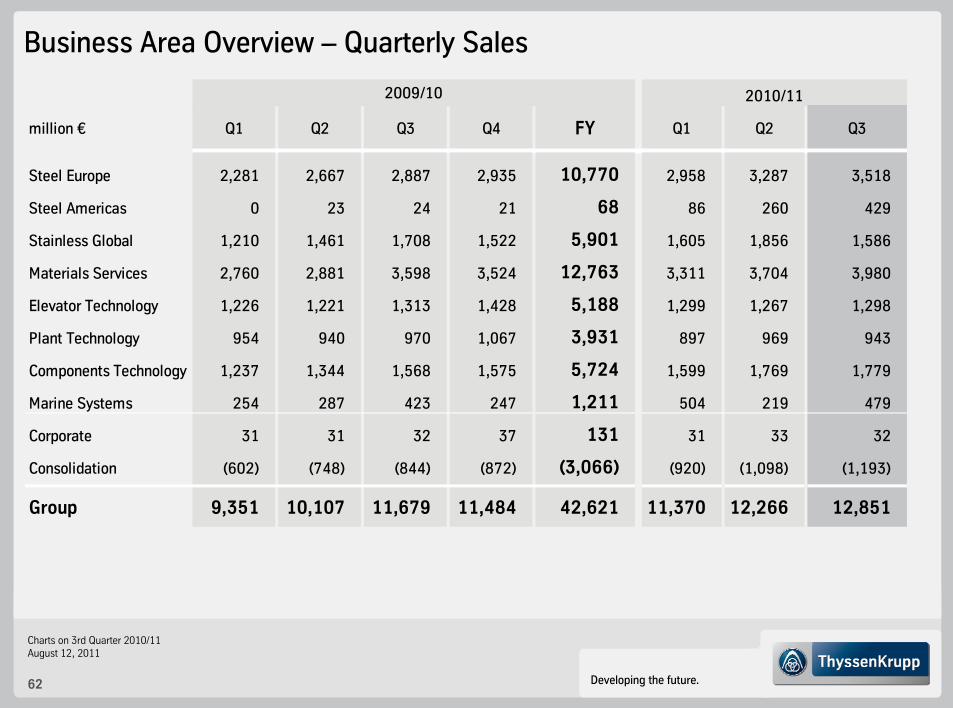
Business Area Overview – Quarterly Sales
million € Q1 Q2 Q3 Q4 FY Q1 Q2 Q3
Steel Europe 2,281 2,667 2,887 2,935 10,770 2,958 3,287 3,518
Steel Americas 0 23 24 21 68 86 260 429
Stainless Global 1,210 1,461 1,708 1,522 5,901 1,605 1,856 1,586
Materials Services 2,760 2,881 3,598 3,524 12,763 3,311 3,704 3,980
Elevator Technology 1,226 1,221 1,313 1,428 5,188 1,299 1,267 1,298
Plant Technology 954 940 970 1,067 3,931 897 969 943
Components Technology 1,237 1,344 1,568 1,575 5,724 1,599 1,769 1,779
Marine Systems 254 287 423 247 1,211 504 219 479
Corporate 31 31 32 37 131 31 33 32
Consolidation (602) (748) (844) (872) (3,066) (920) (1,098) (1,193)
Group 9,351 10,107 11,679 11,484 42,621 11,370 12,266 12,851
2009/10 2010/11

Charts on 3rd Quarter 2010/11August 12, 2011
63 Developing the future.
Business Area Overview – Quarterly EBITDA and Margin
million € Q1 Q2 Q3 Q4 FY Q1 Q2 Q3
Steel Europe 274 339 359 329 1,301 399 439 458
% 12.0 12.7 12.4 11.2 12.1 13.5 13.4 13.0Steel Americas (70) (78) (119) (297) (564) (328) (211) (95)
% n.a. n.a. n.a. n.a. n.a. n.a. n.a. n.a.Stainless Global (4) (60) 121 46 103 48 103 43
% (0.3) (4.1) 7.1 3.0 1.7 3.0 5.5 2.7Materials Services 168 101 191 150 610 117 197 181
% 6.1 3.5 5.3 4.3 4.8 3.5 5.3 4.5Elevator Technology 182 180 180 185 727 189 165 168
% 14.8 14.7 13.7 13.0 14.0 14.5 13.0 12.9Plant Technology 119 106 99 116 440 115 148 149
% 12.5 11.3 10.2 10.9 11.2 12.8 15.3 15.8Components Technology 124 144 144 154 566 196 186 220
% 10.0 10.7 9.2 9.8 9.9 12.3 10.5 12.4Marine Systems 21 33 19 106 179 51 87 71
% 8.3 11.5 4.5 42.9 14.8 10.1 39.7 14.8Corporate (58) (58) (69) (61) (246) (78) (102) (109)
Consolidation (73) (85) (80) (109) (347) (64) (80) (103)
Group 683 622 845 619 2,769 645 932 983% 7.3 6.2 7.2 5.4 6.5 5.7 7.6 7.6
2009/10 2010/11

Charts on 3rd Quarter 2010/11August 12, 2011
64 Developing the future.
Business Area Overview – Quarterly EBIT and Margin
million € Q1 Q2 Q3 Q4 FY Q1 Q2 Q3
Steel Europe 127 193 218 193 731 258 300 322
% 5.6 7.2 7.6 6.6 6.8 8.7 9.1 9.2Steel Americas (71) (79) (130) (320) (600) (378) (319) (190)
% n.a. n.a. n.a. n.a. n.a. n.a. n.a. n.a.Stainless Global (42) (101) 81 5 (57) 7 59 0
% (3.5) (6.9) 4.7 0.3 (1.0) 0.4 3.2 0Materials Services 129 68 158 108 463 85 163 149
% 4.7 2.4 4.4 3.1 3.6 2.6 4.4 3.7Elevator Technology 165 163 162 156 646 171 147 151
% 13.5 13.3 12.3 10.9 12.5 13.2 11.6 11.6Plant Technology 111 98 90 102 401 107 139 131
% 11.6 10.4 9.3 9.6 10.2 11.9 14.3 13.9Components Technology 57 73 66 56 252 127 114 141
% 4.6 5.4 4.2 3.6 4.4 7.9 6.4 7.9Marine Systems 16 18 8 103 145 46 84 62
% 6.3 6.3 1.9 41.7 12.0 9.1 38.4 12.9Corporate (65) (71) (75) (80) (291) (88) (111) (120)
Consolidation (74) (84) (78) (108) (344) (62) (79) (101)
Group 353 278 500 215 1,346 273 497 545% 3.8 2.8 4.3 1.9 3.2 2.4 4.1 4.2
2009/10 2010/11

Charts on 3rd Quarter 2010/11August 12, 2011
65 Developing the future.
million € Q1 Q2 Q3 Q4 FY Q1 Q2 Q3
Steel Europe 127 193 218 193 731 258 300 322
% 5.6 7.2 7.6 6.6 6.8 8.7 9.1 9.2Steel Americas (71) (79) (130) (320) (600) (378) (319) (190)
% n.a. n.a. n.a. n.a. n.a. n.a. n.a. n.a.Stainless Global (42) (101) 81 5 (57) 7 59 0
% (3.5) (6.9) 4.7 0.3 (1.0) 0.4 3.2 0.0Materials Services 48 68 158 108 382 85 163 149
% 1.7 2.4 4.4 3.1 3.0 2.6 4.4 3.7Elevator Technology 165 163 162 156 646 171 147 151
% 13.5 13.3 12.3 10.9 12.5 13.2 11.6 11.6Plant Technology 111 98 90 102 401 107 139 131
% 11.6 10.4 9.3 9.6 10.2 11.9 14.3 13.9Components Technology 57 73 113 58 301 127 114 141
% 4.6 5.4 7.2 3.7 5.3 7.9 6.4 7.9Marine Systems 21 33 27 (9) 72 46 84 62
% 8.3 11.5 6.4 (3.6) 5.9 9.1 38.4 12.9Corporate (65) (71) (75) (80) (291) (88) (111) (99)
Consolidation (74) (84) (78) (108) (344) (62) (79) (101)
Group 277 293 566 105 1,241 273 497 566% 3.0 2.9 4.8 0.9 2.9 2.4 4.1 4.4
2009/10 2010/11
Business Area Overview – Quarterly EBIT adjusted and Margin

Charts on 3rd Quarter 2010/11August 12, 2011
66 Developing the future.
Business Area Overview – Quarterly Operating Cash Flow
million € Q1 Q2 Q3 Q4 FY Q1 Q2 Q3
Steel Europe (123) 235 152 329 593 (433) 322 184
Steel Americas (171) (93) (221) (361) (847) (585) (360) (269)
Stainless Global (100) 88 (261) 57 (216) (308) 82 (139)
Materials Services (82) (102) (25) 538 330 (497) 103 (14)
Elevator Technology 87 238 74 165 563 53 168 87
Plant Technology 114 161 250 91 618 118 (26) 129
Components Technology 70 80 211 189 551 (25) 46 146
Marine Systems (124) 145 (83) 31 (31) (26) 48 612
Corp./Cons. 21 (568) (122) (23) (692) 268 (462) (27)
Group (308) 184 (23) 1,015 868 (1,435) (79) 709
2009/10 2010/11

Charts on 3rd Quarter 2010/11August 12, 2011
67 Developing the future.
Business Area Overview (I)
9M 2009/10
9M 2010/11
9M 2009/10
9M 2010/11
9M 2009/10
9M 2010/11
Steel Europe 8,205 9,656 7,835 9,763 34,434 33,702
Steel Americas 47 856 47 775 2,876 3,995
Stainless Global 3,820 4,633 4,379 5,047 11,150 11,339
Materials Services 9,435 11,150 9,239 10,995 32,096 35,440
Elevator Technology 3,835 3,984 3,760 3,864 43,066 45,603
Plant Technology 2,948 3,009 2,864 2,809 12,975 13,194
Components Technology 4,090 5,208 4,149 5,147 28,860 31,049
Marine Systems 357 2,730 964 1,202 6,588 5,398
Corporate 94 96 94 96 2,496 2,705
Consolidation (2,200) (3,094) (2,194) (3,211) - -
Group 30,631 38,228 31,137 36,487 174,541 182,425
Order Intake (€m) Sales (€m) Employees

Charts on 3rd Quarter 2010/11August 12, 2011
68 Developing the future.
Business Area Overview (II)
9M 2009/10
9M 2010/11
9M 2009/10
9M 2010/11
Steel Europe 972 1,296 538 880
Steel Americas (267) (634) (280) (887)
Stainless Global 57 194 (62) 66
Materials Services 460 495 355 397
Elevator Technology 542 522 490 469
Plant Technology 324 412 299 377
Components Technology 412 602 196 382
Marine Systems 73 209 42 192
Corporate (185) (289) (211) (319)
Consolidation (238) (247) (236) (242)
Group 2,150 2,560 1,131 1,315
EBITDA (€m) EBIT (€m)

Charts on 3rd Quarter 2010/11August 12, 2011
69 Developing the future.
Special Items
Business Area(million €) Q1 Q2 Q3 Q4 FY Q1 Q2 Q3
Materials Services:
Disposal Gain TKIN and Safway 81 81Components Technology:
Restructuring Bilstein (26) (5) (31)Restructuring Berco (17) 2 (15)Restruturing total (43) (3) (46)Impairment Bilstein (3) 1 (2)Impairment Berco (1) (1)Impairment total (4) 1 (3)
Marine Systems:
Hellenic Shipyards (5) (15) (19) 112 73Corporate: (21)
ThyssenKruppRestructuring total (43) (3) (46)Impairment total (4) 1 (3)Special Items 76 (15) (66) 110 105 - - (21)
2009/10 2010/11

Charts on 3rd Quarter 2010/11August 12, 2011
70 Developing the future.
P&L Structure
ThyssenKrupp-specific Key Figures (I): EBIT DefinitionQ3 2010/11: Reconciliation “Income from operations” (P&L Structure) to EBIT
Net sales 12,851
- Cost of sales 1) (10,947)
- SG&A 1) (1,313)
+/- Other operating income/expenses (48)
+/- Gain/loss on disposal of subsidiaries (20)
= Income from operations 523
+/- Income from companies using equity method 19
+/- Interest income/expense (154)incl. capitalized interest exp. of €12 m
+/- Other financial income/expense 19
= EBT 407
EBIT definition
Net sales 12,851
- Cost of sales 1) (10,947)
- SG&A 1) (1,313)
+/- Other operating income/expenses (48)
+/- Gain/loss on disposal of subsidiaries (20)
+/- Income from companies using equity method 19
+/- Operating items in other fin. income/expense 2) (9)
+ Adjustm. for depreciation on cap. interest 12
= EBIT 545
+/- Interest income/expense (154)incl. capitalized interest exp. of €12 m
- Depreciation on capitalized interest (12)
+/- Other financial income/expense 28
= EBT 407
2) Mainly: Interest from long-term provisions, net;Income from other investments1) incl. depreciation on capitalized interest expenses of €(12) m

Charts on 3rd Quarter 2010/11August 12, 2011
71 Developing the future.
P&L Structure
ThyssenKrupp-specific Key Figures (I): EBIT Definition9M 2010/11: Reconciliation “Income from operations” (P&L Structure) to EBIT
Net sales 36,487
- Cost of sales 1) (31,250)
- SG&A 1) (3,919)
+/- Other operating income/expenses (57)
+/- Gain/loss on disposal of subsidiaries (18)
= Income from operations 1,243
+/- Income from companies using equity method 66
+/- Interest income/expense (417)incl. capitalized interest exp. of €71 m
+/- Other financial income/expense 12
= EBT 904
EBIT definition
Net sales 36,487
- Cost of sales 1) (31,250)
- SG&A 1) (3,919)
+/- Other operating income/expenses (57)
+/- Gain/loss on disposal of subsidiaries (18)
+/- Income from companies using equity method 66
+/- Operating items in other fin. income/expense 2) (25)
+ Adjustm. for depreciation on cap. interest 31
= EBIT 1,315
+/- Interest income/expense (417)incl. capitalized interest exp. of €71 m
- Depreciation on capitalized interest (31)
+/- Other financial income/expense 37
= EBT 904
2) Mainly: Interest from long-term provisions, net;Income from other investments1) incl. depreciation on capitalized interest expenses of €(31) m

Charts on 3rd Quarter 2010/11August 12, 2011
72 Developing the future.
ThyssenKrupp Value Added (TKVA)
ThyssenKrupp-specific Key Figures (II): EBIT/EBT adjusted & TKVA
Measurement of value added in a periodat all levels of the Group
TKVA
EBIT
Cost of Capital
Capital Employed
WACCx
-
Reported only on full-year basis
EBIT / EBT adjusted (= Key Performance Indicator of ThyssenKrupp)
Earnings adjusted for special, nonrecurring items:
Special items to be eliminated include disposal gains/losses, restructuring expense, impairment losses, other non-operating expense and other non-operating income. These special items are positive or negative effects that occur only once or infrequently, are of material importance due to their type or amount and thus affect the results of our operating activities.
EBIT increased by an imputed income contribution calculated by assigning a return to the average net advance payments surplus equal to the WACC for the business areas
Capital Employed is also increased by the amount of the net advance payments surpluses
Imputed income contributions in EBIT and increases to Capital Employed are eliminated at Group level during consolidation and therefore not included in the Group's key figures
EBIT & Capital Employed at Business Area level:

Charts on 3rd Quarter 2010/11August 12, 2011
73 Developing the future.
Disclaimer ThyssenKrupp AG
“The information set forth and included in this presentation is not provided in connection with an offer or solicitation for the purchase or sale of a security and is intended for informational purposes only.
This presentation contains forward-looking statements that are subject to risks and uncertainties. Statements contained herein that are not statements of historical fact may be deemed to be forward-looking information. When we use words such as “plan,” “believe,”“expect,” “anticipate,” “intend,” “estimate,” “may” or similar expressions, we are making forward-looking statements. You should not rely on forward-looking statements because they are subject to a number of assumptions concerning future events, and are subject to a number of uncertainties and other factors, many of which are outside of our control, that could cause actual results to differmaterially from those indicated. These factors include, but are not limited to, the following:(i) market risks: principally economic price and volume developments, (ii) dependence on performance of major customers and industries, (iii) our level of debt, management of interest rate risk and hedging against commodity price risks;(iv) costs associated with, and regulation relating to, our pension liabilities and healthcare measures, (v) environmental protection and remediation of real estate and associated with rising standards for real estate environmental protection, (vi) volatility of steel prices and dependence on the automotive industry, (vii) availability of raw materials; (viii) inflation, interest rate levels and fluctuations in exchange rates; (ix) general economic, political and business conditions and existing and future governmental regulation; and (x) the effects of competition. Please note that we disclaim any intention or obligation to update or revise any forward-looking statements whether as a result of new information, future events or otherwise.”