Charts from Todd Williams
26
Employers and citizens voting with their feet The city of Dallas is not participating in its fair share of area growth Collin County Denton County Dallas County City of Dallas 5% 10% 50,105 o 0% Population Added (2000-2012) Population % Growth (2000-2012) 100,000 400,000 0% 66% 334,480 61% 300,000 268,310· 53% 229,000 200,000 35% Source: u.s. Census Bureau I
-
Upload
jeremy-liebbe -
Category
Documents
-
view
14 -
download
0
description
These charts were provided to Rev. Omar Jahwar and his group of South Dallas community leaders during a meeting with Todd Williams on January 29, 2015.
Transcript of Charts from Todd Williams
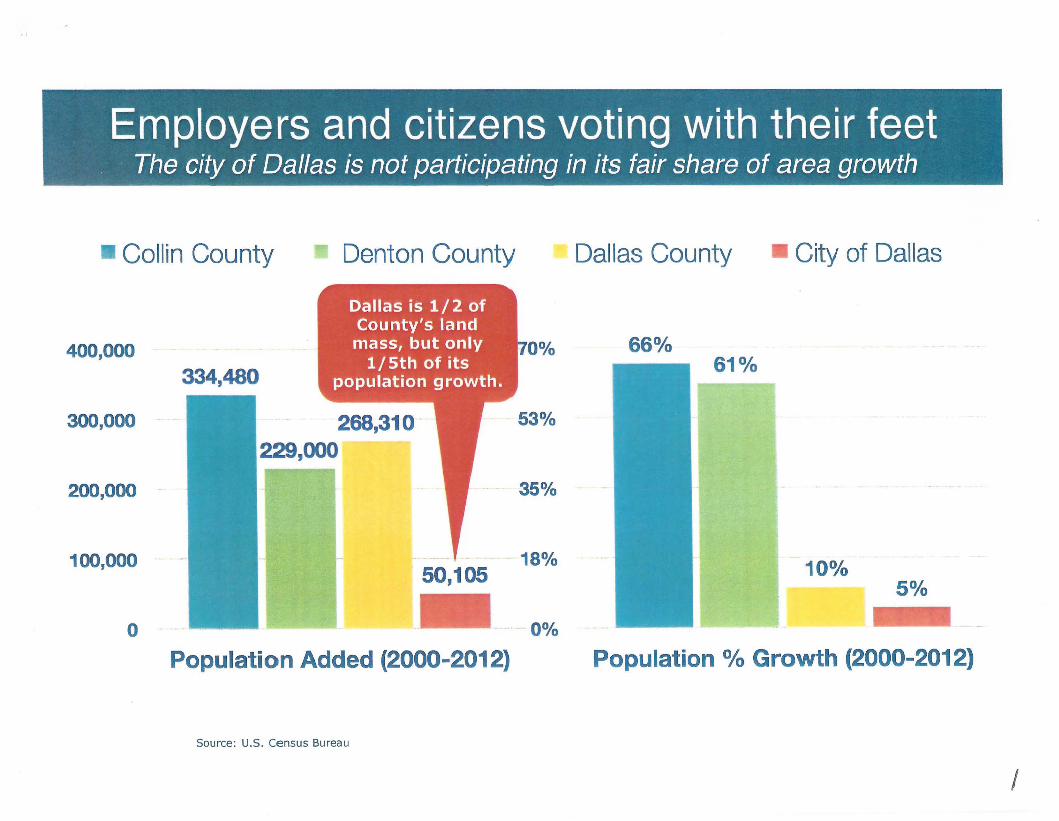
Employers and citizens voting with their feetThe city of Dallas is not participating in its fair share of area growth
Collin County Denton County Dallas County City of Dallas
5%10%50,105
o 0%
Population Added (2000-2012) Population % Growth (2000-2012)
100,000
400,000 0% 66%
334,48061%
300,000 268,310· 53%
229,000
200,000 35%
Source: u.s. Census Bureau
I

Level of Poverty in Dallas vs. Other Large American CitiesDallas residents rank only behind Detroit, Philadelphia and Memphis
Grtlwth in the poorpopulati'on in Dallas41%
Almost 1 in 4 residentslive in poverty
1. Detroit 38.3% 8.3% 705,848
2. Philadelphia 26.8% 7% 1,483,115
3. Memphis 26.7% 8.8% 631,734
4. Dallas 23.9% 5.6% 1,187,486
2000-2012
% Growth in the totalpopulation of Dallas

The company we keepOf 20 largest U.S.cities, Dallas trails only Detroit and Memphis in % of its children living in poverty.
Detroit Memphis Dallas Philadelphia
Almost 4 in 10Dallas children live
in poverty75%
59%60%
45% 380/0 37% 1 Detroit 105,000 59%
30%2 Memphis 71,000 44%
15%3 Dallas 118,000 38%
0%
Pet. of Children Living in Poverty 4 Philadelphia 127,000 37%
Source: u.s. Census Bureau, KIDS COUNT Data Center - Casey Foundation.
3
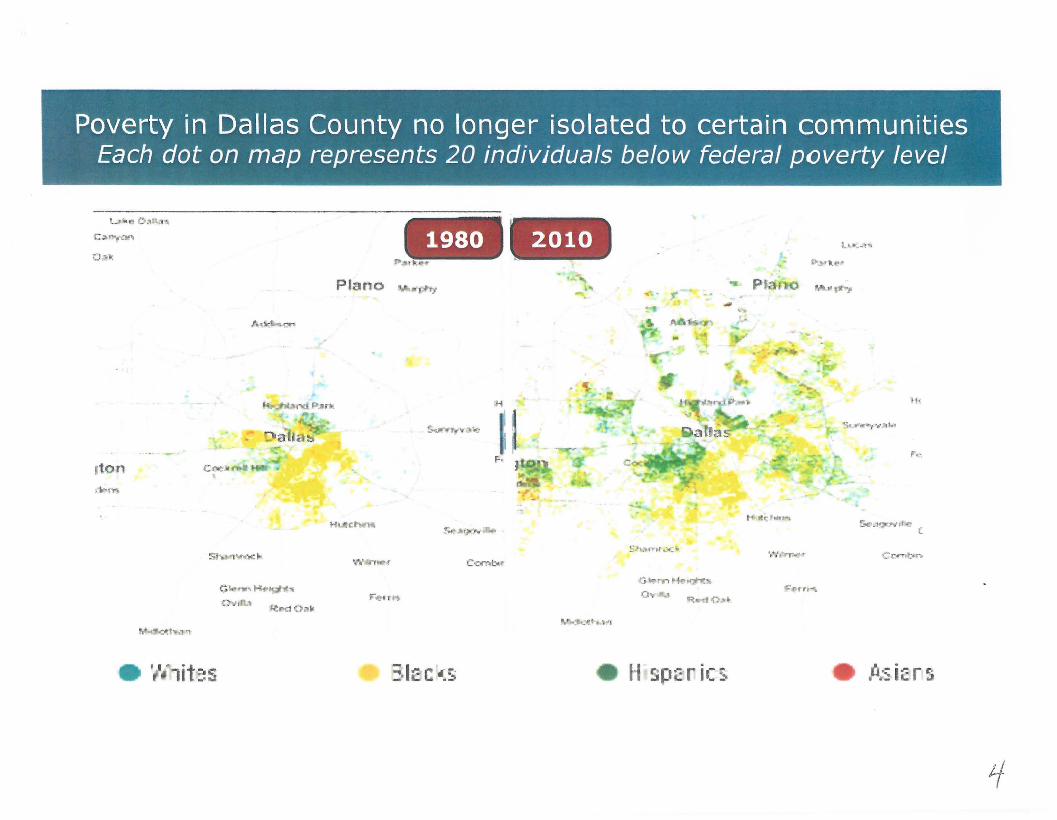
Poverty in Dallas County no longer isolated to certain communitiesEach dot on map represents 20 individuals below federal poverty level
1980 2010'" ......
.. p
rton
Plano
Ih:
'ito.
H r:(
''\'
f" .• n.
H spr:rl(~

Middle Class Parents Voting With Their Feet in Significant Numbers25,200 Non-Ecan. Disadvantaged Students Exiting 0150 Since 2000
II Ecan. Disadvantaged Nan-Ecan. Disadvantaged
20122010200820062004200250,000
2000
75,000
100,000
125,000
150,000
175,000160,47,)t.1::...-__-......--.---~__... ------__. ...J-'1~
School Year Ending May
Source: Texas Education Agency Academic Excellence Indicator System
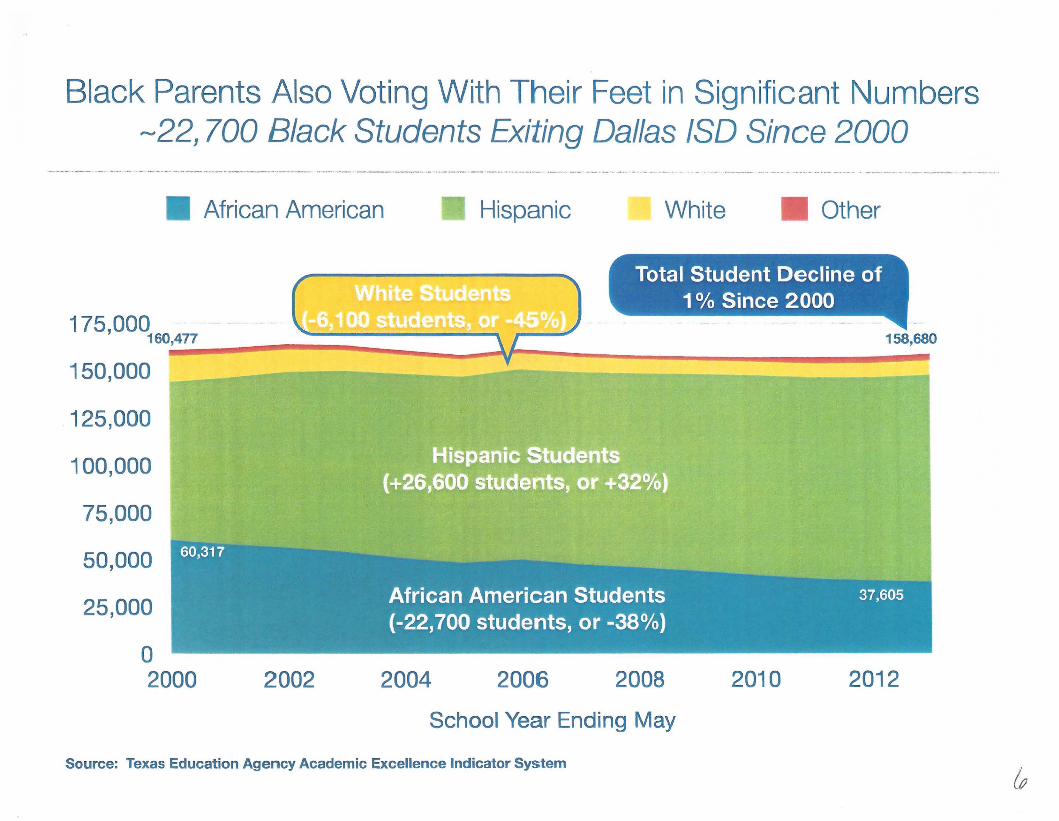
Black Parents Also Voting With Their Feet in Significant Numbers~22, 700 Black Students Exiting Dallas ISO Since 2000
African American Hispanic White Other
20122010
Total Student Decline of1% Since 2000
2008200620042002
175000 .., 160~,47~7 ~{- 1~58~,680
150,000
125,000
100,000
75,000
50,000
25,000
o2000
School Year Ending May
Source: Texas Education Agency Academic Excellence Indicator System
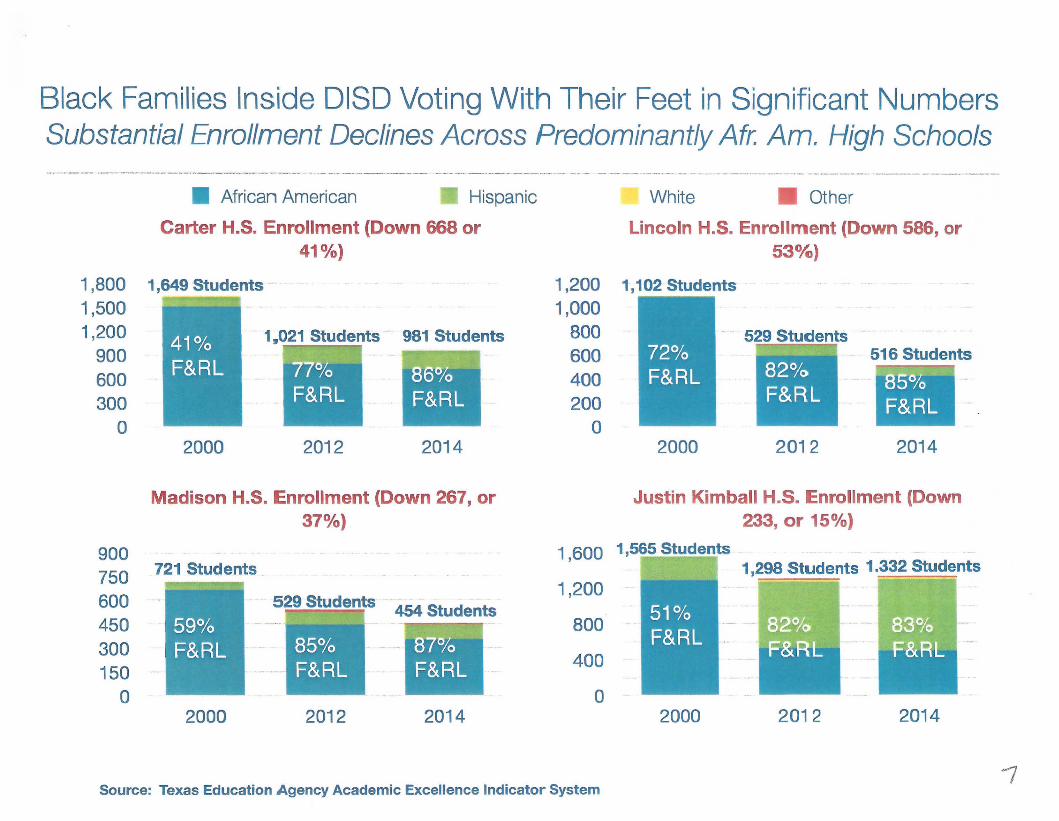
Black Families Inside DISD Voting With Their Feet in Significant NumbersSubstantial Enrollment Declines Across Predominantly Afr. Am. High Schools
• African American Hispanic
Carter H.S. Enrollment (Down 668 or41 %)
White Other
Lincoln H.S. Enrollment (Down 586, or53oAt)
2014
516 Students
1,800 1,649 Students 1,200 1,102 Students
1,500 1,0001,200 1,021 Students 981 Students 800
900 600600 400300 200
0 02000 2012 2014 2000 2012
201420122000
Justin Kimball H.S. Enrollment (Down233, or 15%)
1 ,600 1,565 Students1,298 Students 1.332 Students
1,200
800
400
o20142012
529 Students 454 Students
2000
721 Students
Madison H.S. Enrollment (Down 267, or370/0)
900750600450300150
o
Source: Texas Education Agency Academic Excellence Indicator System
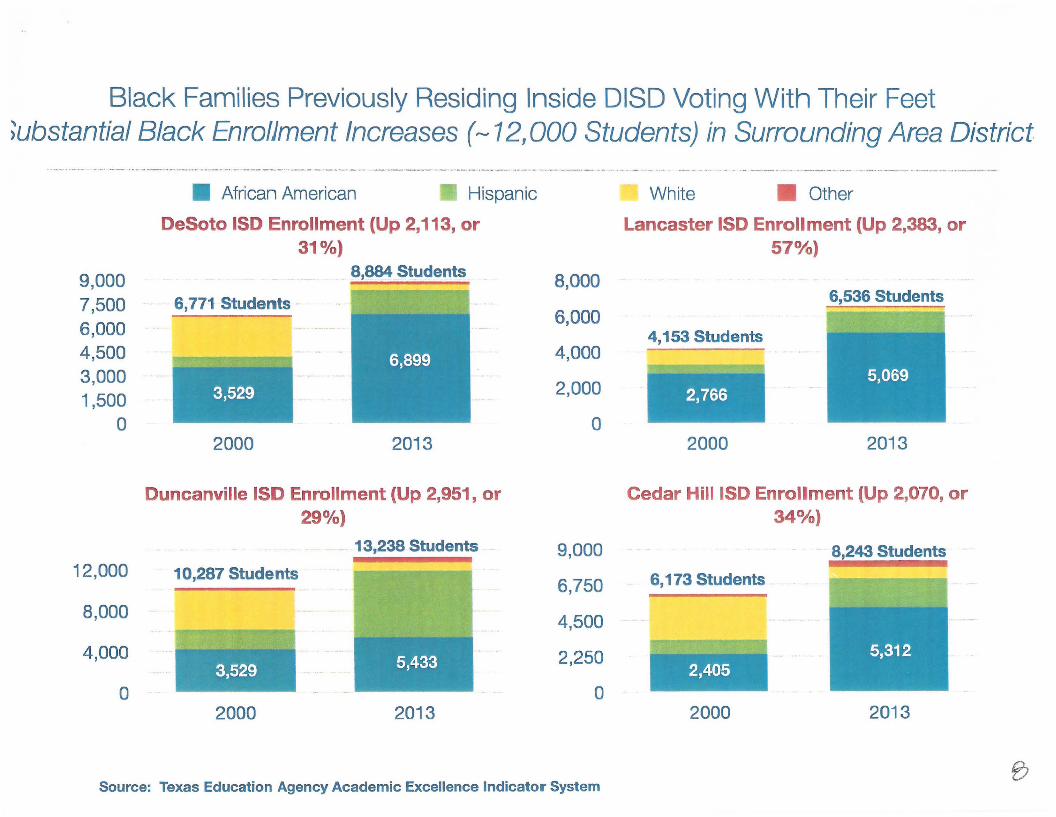
Black Families Previously Residing Inside DISD Voting With Their Feet;ubstantial Black Enrollment Increases (~12,000 Students) in Surrounding Area District.
9,0007,5006,0004,5003,0001,500
o
• African American Hispanic
DeSoto ISO Enrollment (Up 2,113, or31 %)
8,884 Students
6,771 Students
.....r,..'~~.<'t"'.~
3,529
8,000
6,000
4,000
2,000
o
White • Other
Lancaster ISO Enrollment (Up 2,383, or57%)
6,536 Students
4,153 Students
2,766
2000 2013 2000 2013
Duncanville ISD Enrollment (Up 2,951, or290/0)
13,238 Students
20132000
2,405
6,173 Students6,750
4,500
2,250
o
Cedar Hill ISO Enrollment (Up 2,070, or34% )
9,000 8,243 Students
2013
• ;><
I
5,433
2000
10,287 Students12,000
8,000
4,000
o
Source: Texas Education Agency Academic Excellence Indicator System

County Zip Codes with Highest Population of TX Prison InmatesHigh Correlation with Areas Anchored by High Schools Reflecting
Abysmally Low College Readiness Rates
75216 681
Last Zip No. ofCode Inmates
. ~... I I I"-----~
Texas Prison Popul~tion Cou~t Per}·nmaie's Last ~iP Code ..r ...-.,: . _.. ' . '. DaUas ~ounty : . .... ,r '-':i '''.j! . _.J__ ......,. ~
\ I _. I
-_.'
,....
3%
0%
3%
1%
1%
1%
1%
1%
% GradsCollege
Ready
6
1
1
9
3
1
2
2
Included Above
# GradsCollege
Ready
Carter
SOCCarter
Smith
SOC
Molina
Adams
HighSchool
Pinkston
SamuellSpruce
LincolnMadison
DISD High Schools Serving 1-..'Zip Code and No.lPct. I
College Ready in 2010 \_
23.3%
48.3%
31.1%
30.7%
28.6%
33.5%
57.8%
32.3%
41.4%
%HHIncomeUnder$25K
$7.0
$11.1
$10.9
$11.2
$13.2
$14.2
$16.3
$19.1
$28.1
Annual $Cost toState
(Millions)
131
198
260
280
260
321
374
465
75224
75232
75211
75212
75228
75241
75215
75217
75203 132 $6.0 49.3% Adamson 2 1%\
.,----. ...' ".
Sources: Justice Atlas of Sentencing and Correction (the higher the intensity of red, the higher percentage of inmates per 1,000 adults within that zip code).TEA AEIS Data for 2011 - Failed to Graduate and No.lPct. of Graduates With College Entrance Exam Score Deemed College-Ready by SAT/ACT in 2010
3,102 $137.1(Avg. Cost = $44,OOO/lnmate)
27 1%(vs. 947 Students Failing to Graduate and 2,276 Students Graduating Not College Ready)
STANOfor children
q

'" -;-' '--r'O
---- ;-."1fTOp:U.S. Income;r' ~ -O'uintile ,.;~ ¥1.\...lI;t <~r.. ~ ~;k l
2nd IncomeOuintile
~. 3rd Incomer. Q~iintile .: ,j
4th IncomeQulintile
Lowest IncomeOuiintile
jV
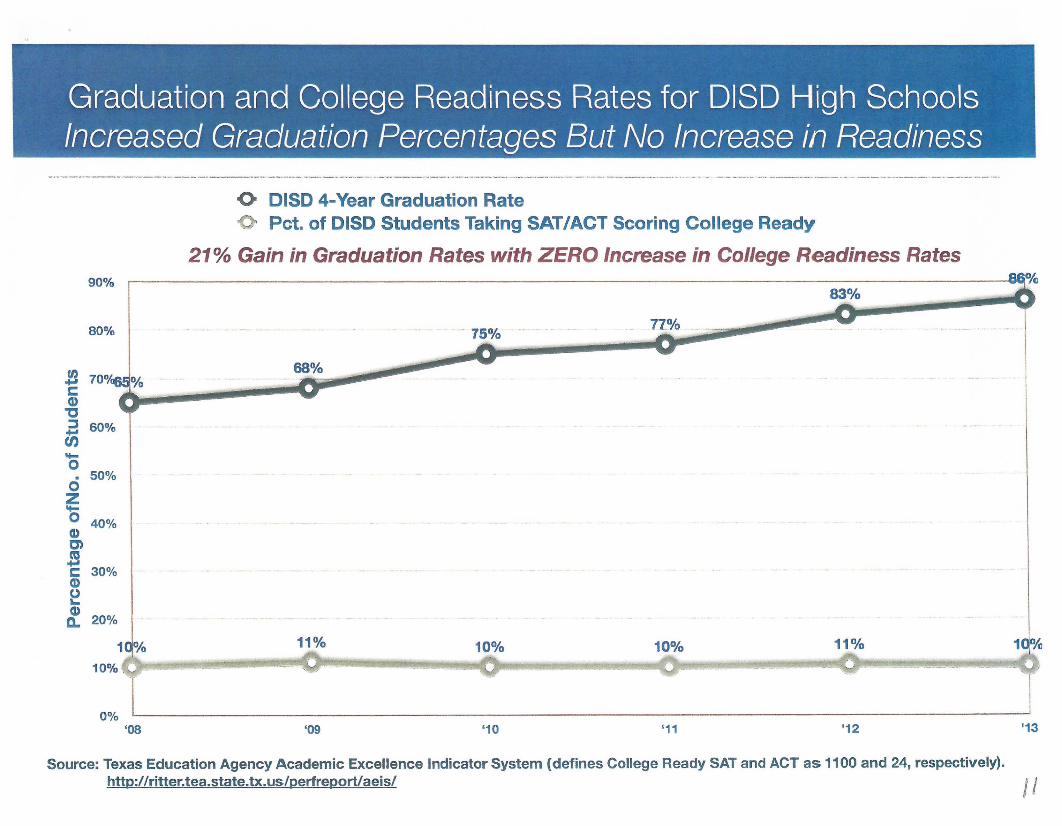
Graduation and College Readiness Rates for DISD High SchoolsIncreased Graduation Percentages But No Increase in Readiness
o DISD 4-Year Graduation Rate'0 Pet. of DISD Students Taking SATIACT Scoring College Ready
21% Gain in Graduation Rates with ZERO Increase in College Readiness Rates
'13'12
11%
'11
10%
'10
10%
'09
11%
68%
83%
___________r
.---------------------------------------------GQ%90%
80%
tJ)70°/c Vo+01
C(1)"C~ 60%+01tn.....0. 50%0Z.....0 40%(1)C)co
+01C 30%(1)
~(1)
20%0-
1 %10%
O%f'08
Source: Texas Education Agency Academic Excellence Indicator System (defines College Ready SAT and ACT as 1100 and 24, respectively).http://ritter.tea.state.tx.us/perfreportlaeis/ /I
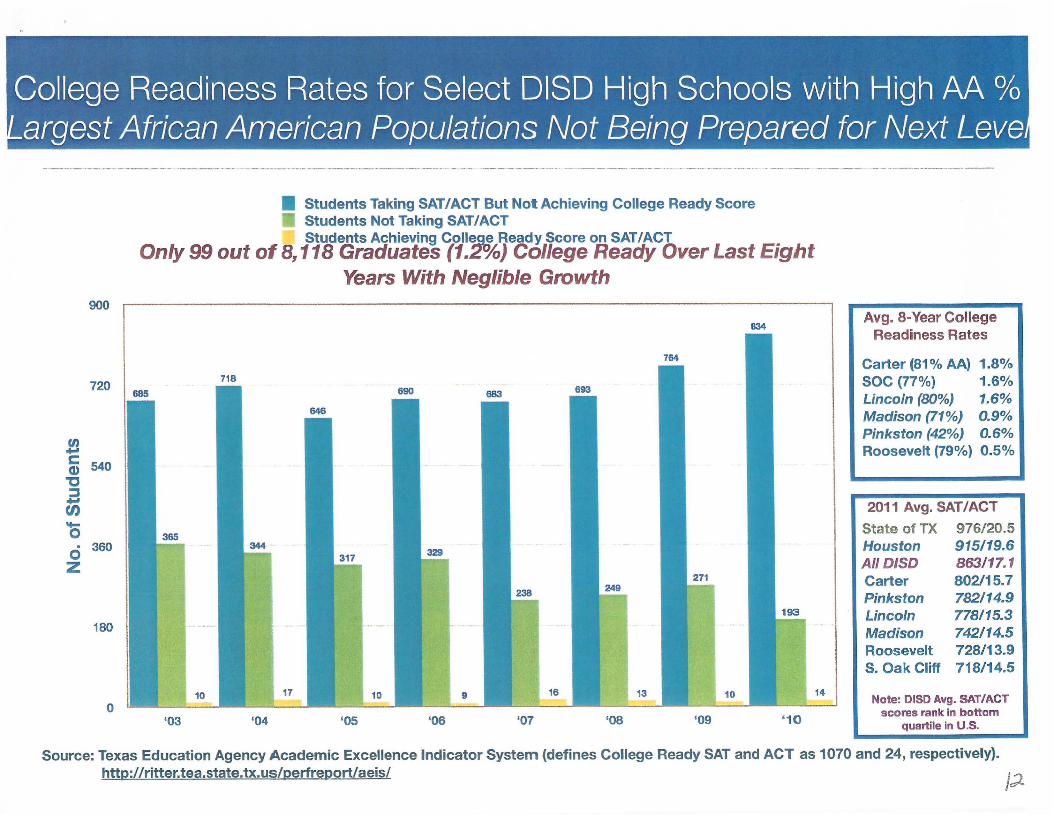
College Readiness Rates for Select DISD High Schools with High AA %argest African American Populations Not Being Prepared for Next Leve
• Students Taking SAT/ACT But Not Achieving College Ready ScoreStudents Not Taking SAT/ACTStudents Achieving ColI~ Ready Score on SAT/ACT
Only 99 out of 8, 118 Graduates (1.2%) College Ready Over Last EightYears With Neglible Growth
Source: Texas Education Agency Academic Excellence Indicator System (defines College Ready SAT and ACT as 1070 and 24, respectively).http://ritter.tea.state.tx.us/perfreportlaeis/ 1;2.

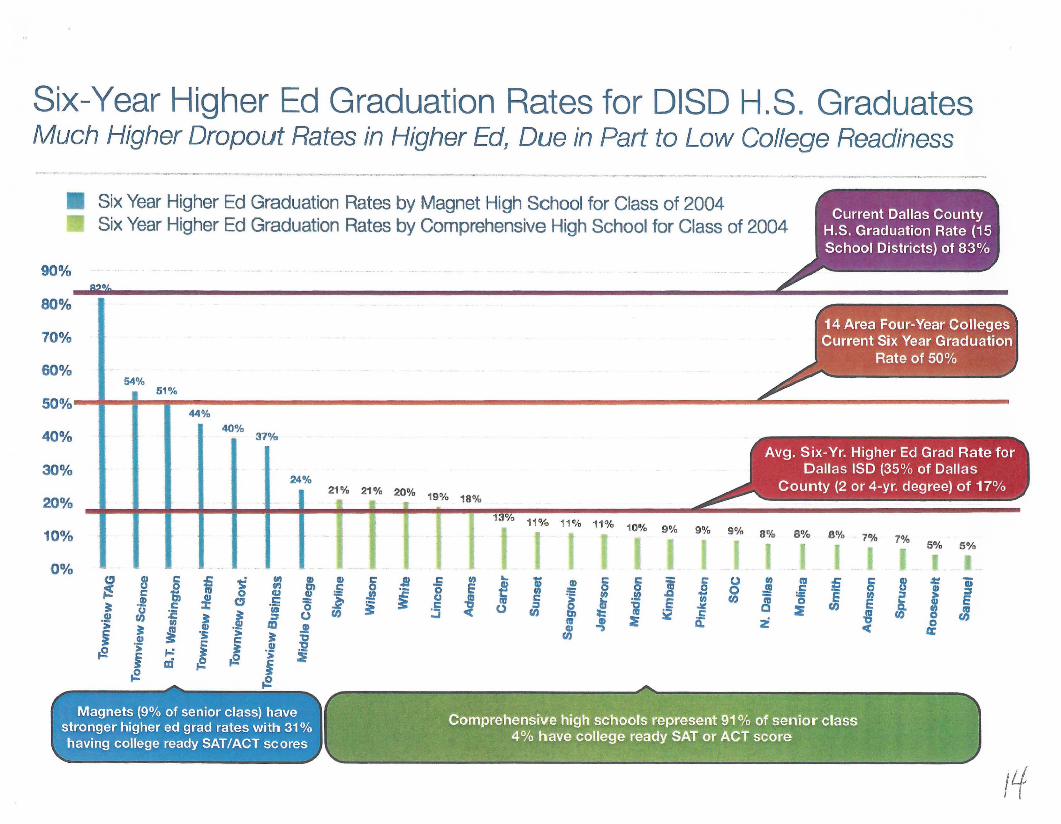
Six-Year Higher Ed Graduation Rates for DISD H.S. GraduatesMuch Higher Dropout Rates in Higher Ed, Due in Part to Low College Readiness
Six Year Higher Ed Graduation Rates by Magnet High School for Class of 2004Six Year Higher Ed Graduation Rates by Comprehensive High School for Class of 2004
54%51%
44%40%
37%
24%21% 21% 20% 19% 18%
0 11% 11% 11% 10% 9% 9% 9% 8% 8% 8% 7% 7% 5% 5%
CIl CIl 8 .~ ..E II) ..i CIl 8 8 ! 8 0 ftl Cll
~ 8 B :::
~ir j 0 E i ~0 ..!! c::
iJ? i ftl .EIl 1,; ~ E ~::J
~U ;f c:: as
~en S cli :5 (,) ::J 0 i ~
~(I) cJ(,) en en CJ) ~ c::
~Cll CIl ~ 0: Z 0~ ~
., 41( IE'tJ~~
§ B 8 j ~c:: 1;, 0
~.91 c:: ~ CJ
.!! ~ :c ~ .1ftl:.~ ~
CIl
i 'S :..!! c:: c::
tE > ,.: ~ !i ai ~~
. , .
.;'rMag"'!ets (9% of senior class) havestronger higher ed grad rates with 31 %
~1.tt~L~~~Y ~A~~~~~~~~~e_~
•• ••• • • ... A _ ••

Dallas County Educational Continuum Highlights Long Term Impact ofFailure to Universally Create a Strong Early Academic Foundation
HS Grad %CollegeReady3..- .
Algebra 128th
Science23rd
Reading2K Ready1
40%
100°f<,
l)Texas Education A.gency ITAPR) and Commit! Partner Districts (districts providina Kir>deraarten Readiness data include: Coppell ISO, Dallas ISO, Grand Prairie ISO,, I;lghiand Park ISO, Irving ISO, Lancaster lSD, Richardson ISO, and Uplift Ed). 2) Atillevement levels represent percentage of stUdents achieving Level 2 Recommended standard
(3rd thruAlgebra 1) on 2013 STAAR exams, the pace most aligned with being on track tor college. 3) Source: Texas Education Agency (TAPR). Per TEA. SAT/ACT college readinessequivalent to 1100 on SAT Reading/Math subject tests or 24 on ACT. Minimum 100 graduates
J~

Dallas County is well behind other major urban counties in public pre-Kenrollment, substantially impacting K Readiness levels
- Harris County
.j...I
~ 400/0-~Q)
0..0.j...IcnU.Q.. wU) Ul 30% _.lU...,.j...ICCQ)OJ'UEB=(/)o ~ 200/0 _.,~ow .~~
IOJL.
Q.. 10%-u
..0::J
Q..
00/0 -
Travis County Bexar County Tarrant County - Dallas Cou nty
Source: Texas Academic Performance Reporting system for 2013. Actual Pre-K enrollment compared to estimate of eligible 3- and 4-year olds (derived bymultiplying1st grade enrollment by free and reduced student population % for each campus in the respective county, and doubling the result for 3yr and 4yr oldcohort)
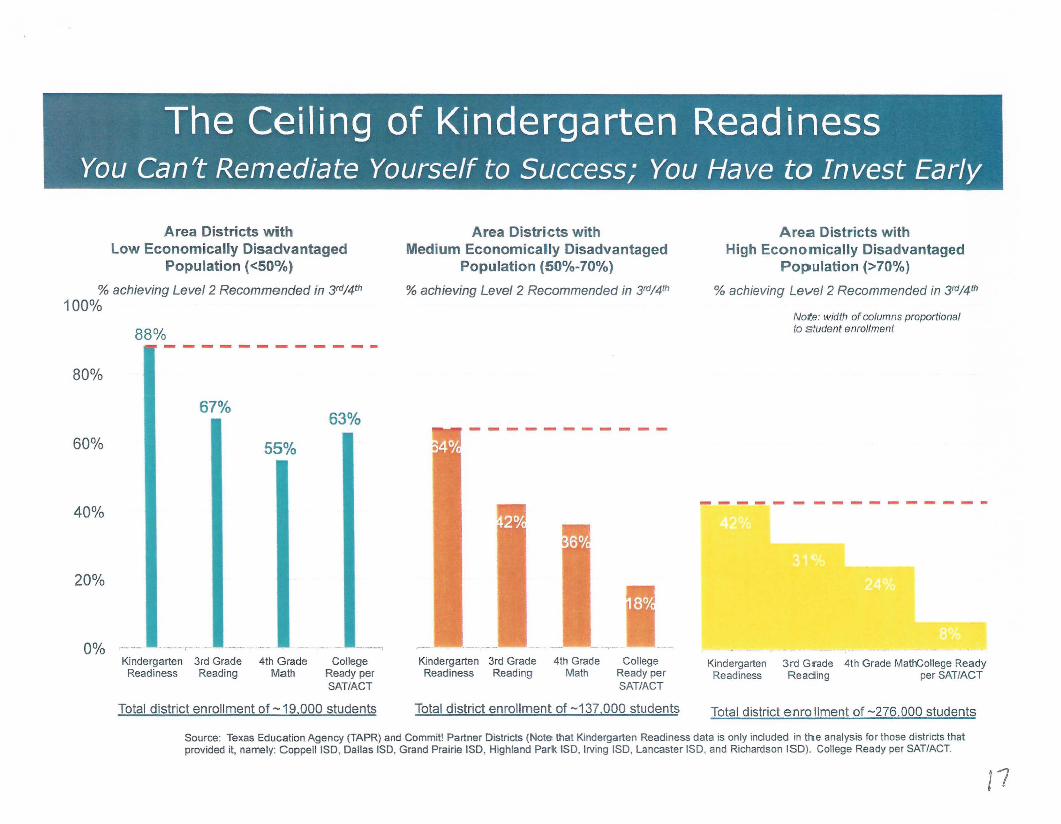
The Ceiling of Kindergarten ReadinessYou Can't Remediate Yourself to Success; You Have to Invest Early
Area Districts withLow Economically Disadvantaged
Population «50%)
% achieving Level 2 Recommended in 3fd/4th
100%
88%
80%
Area Districts withMedium Economically Disadvantaged
Population (50%-70%)
% achieving Level 2 Recommended in 3fC1J4lh
Area Districts withHigh Economically Disadvantaged
Population (>70%)
% achieving Level 2 Recommended in 3rciJ4lh
Note: width ofcolumns proportionalto student enrollment
60%
40%
67%
55%
63%
• A ••
,...20%
0%-----,- - -Kindergarten 3rd Grade 4th Grade CollegeReadiness Reading Math Ready per
SAT/ACT
Total district enrollment of -19,000 students
Kindergarten 3rd Grade 4th Grade CollegeReadiness Reading Math Ready per
SAT/ACT
Total district enrollment of -137,000 students
Kindergarten 3rd Grade 4th Grade MathGollege ReadyReadiness Reading per SATIACT
Total district enrollment of -276,000 students
Source: Texas Education Agency (TAPR) and Commit! Partner Districts (Note that Kindergarten Readiness data is only included in the analysis for those districts thatprovided it, namely: Coppell ISO, Dallas ISO, Grand Prairie ISO, Highland Park ISO, Irving ISO, Lancaster ISO, and Richardson ISD)_ College Ready per SAT/ACT.
17

The Critical Challenge of Teacher Trai ningAnother Game Changer for our Community
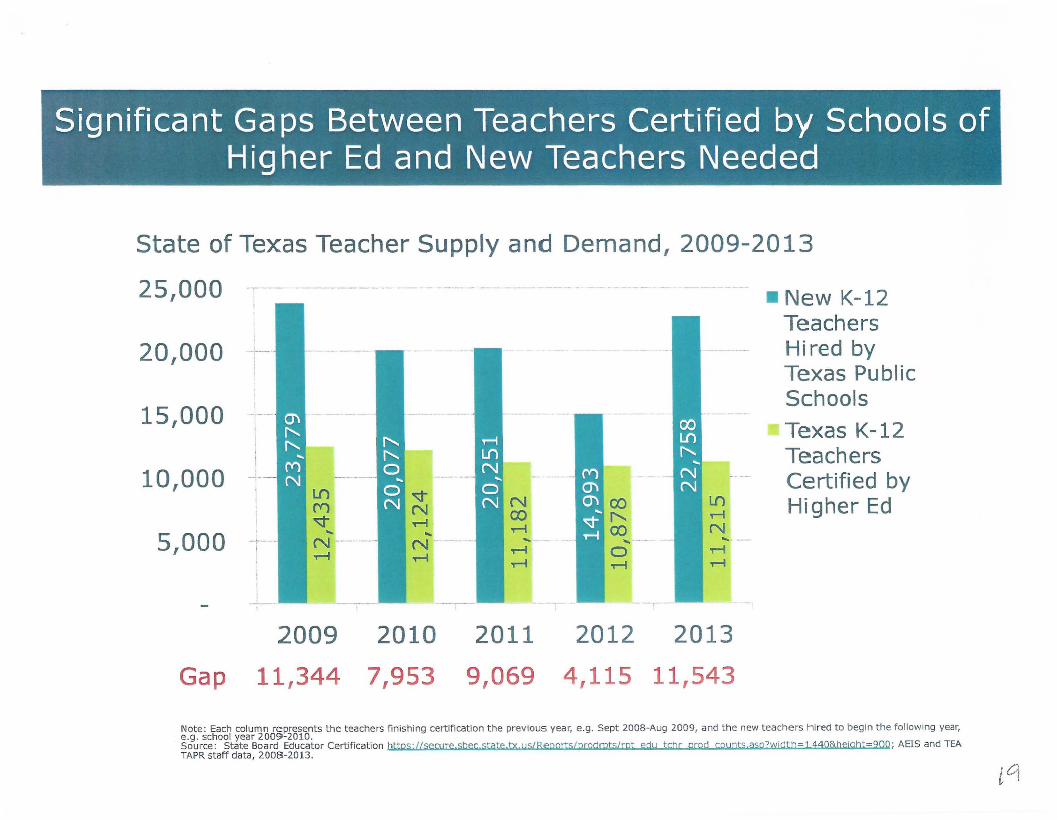
Significant Ga ps Between Teachers Certified by Schools ofHigher Ed and New Teachers Needed
• New K-12TeachersHi red byTexas PublicSchools
Texas K-12TeachersCertified byHigher Ed
5,000
10,000
15,000
20,000
State of Texas Teacher Supply and Demand, 2009-2013
25,000
Gap
2009 2010
11,344 7,953
2011
9,069
2012 2013
4,115 11,543
Note: Each column represents the teachers finishing certification the previous year, e.g. Sept 200B-Aug 2009, and the new teachers hired to begin the following year,e.g. school year 2009-2010.Source: State Board Educator Certification httQs,!lsecyre sbec state tx ys/R€R0rts/prodmts/rot edu tcbr prod eRupts asp?wjdth-1440&hejght-900; AEIS and TEATAPR staff data, 2008-2013.

Teaching Gap Currently Filled Primarily Via AlternativeCertification Providers Reflecting Significant Quality Issues
Alternative Certification
Higher Ed Post-Baccalaureate
Higher Ed Baccalaureate
Pct. of teachers certified byalternative certification
programs graded A thru F2013-2014
40% 44°1.520/0 530/0 ° 50%
100%
75%
50%
II
II1
520/0
I
': 'SOlO 70lII 70, 70/0
7 % '5%
50/0:
87%_-25% 53% 51%
, 41% 41 % 400/0 45% Rated C Rated D • Rated F
0%m 0 T""" C\J C") ..q-0 T"- T""" T"-
IT"- T"-
I I I
co m 0I I
0 0T"- C\J C")
T""" T"- T"-
o 0 0 0 0T"-
C\J C\J0
N C\J C\J C\J
ZERO teachers certifiedfrom alt. cert. programs
graded"A" or "B"
Source: State Boa rd Ed ucator Certificationhttns -{/seclJre she' state tx us/Reports/ d t /National Council of Teacher Quality ratirigrgf ~g ra~~~s~dlilt tchr, prop cq!!ots asp/Width 1440&height 900,__ a ernatlve ~ertJTICaLiOn orovlders :n the state 0" Texas.
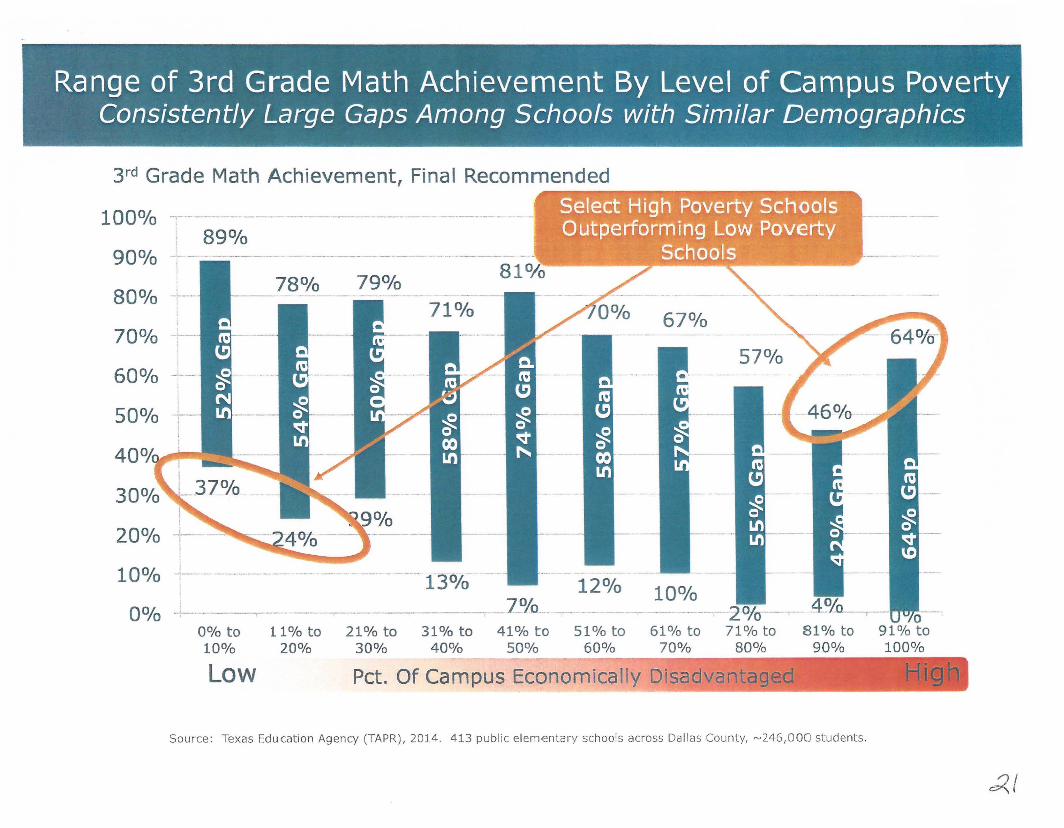
Range of 3rd Grade Math Achievement By Level of Campus PovertyConsistently Large Gaps Among Schools with Similar Demographics
°91% to100%
81% to90%
31% to 41% to 51% to 61% to40% 50% 60% 70%
13% 0 12% 100/0________.. 1_ ~h. . _
Pct. Of Campus Economically Disadvantaged-~-----------------------~~
Low
00/0 ..J.- , ----- - .
0% to 11% to 21 % to10% 20% 30%
20%
10%
50%
70%
60%
80%
90%
3rd Grade Math Achievement, Final Recommended
100% ....,-.-------------------- - -------- --------- .. -
Source: Texas Education Agency (TAPR), 2014. 413 public elementary schools across Dallas County, ~246,OOO students.
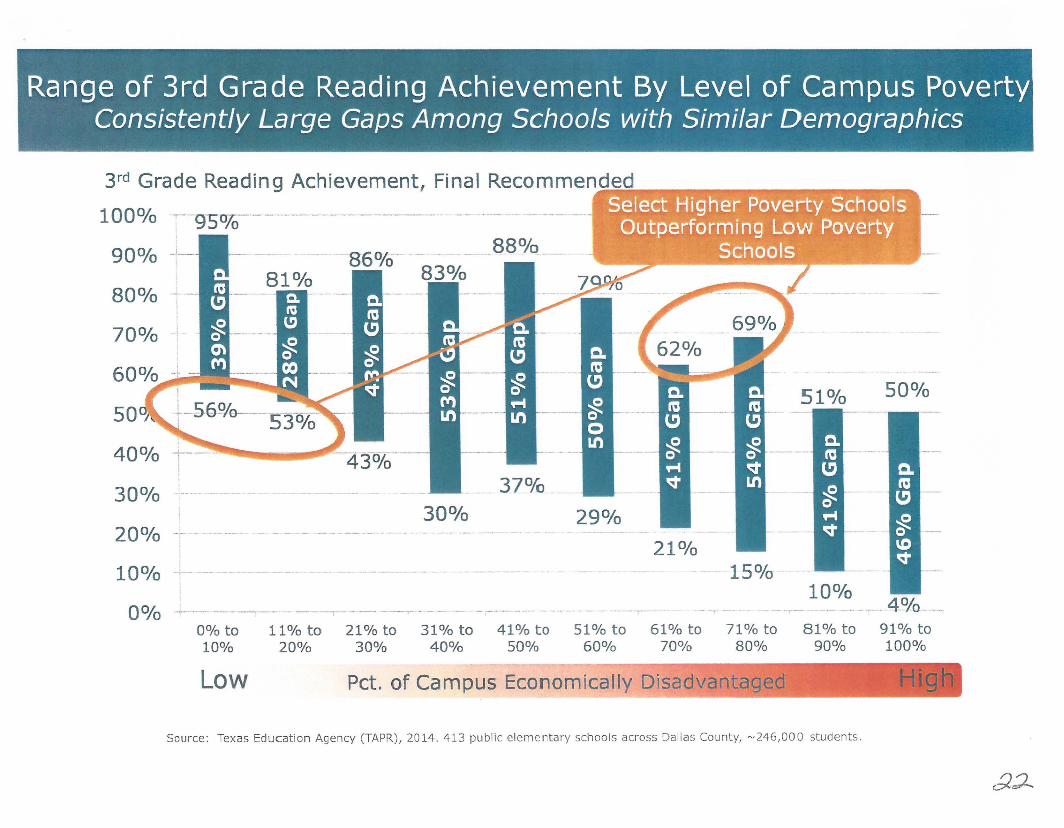
Range of 3rd Grade Reading Achievement By Level of Campus PovertyConsistently Large Gaps Among Schools with Similar Demographics
50%51%
10% a- - .- ---'-_- 4 Va ----
15%21 0/0
29%
37%
30%
86°/c' - - - .o 830/0
0 0/0 -+----- ----~---- -. --- ~-- -- ---
20% -- - ._.- .-.-
10 % .- - -- - .-
30% ... - - --
40%
70%
80%
90%
3rd Grade Readin 9 Achievement, Fi naI Reco m me nrd~eijdiiiiiiiiiiiii:;;::-r.;W~;;:"r.:iiiiiiiiiii;;:1
100% ~- 9'5070-'- - -----. --- -- -----'-'--- - -- ._- --- --- --- - -
0% to10%
11% to 21% to 31% to 41% to 51% to 61% to 71% to 81% to 91% to20% 30% 40% 50% 60% 70% 80% 90% 100%
Low Pct. of Campus Economically Disadvantaged---------------"Source: Texas Education Agency (TAPR), 2014. 413 public elementary schools across Dallas County, ~'246,OOO students.
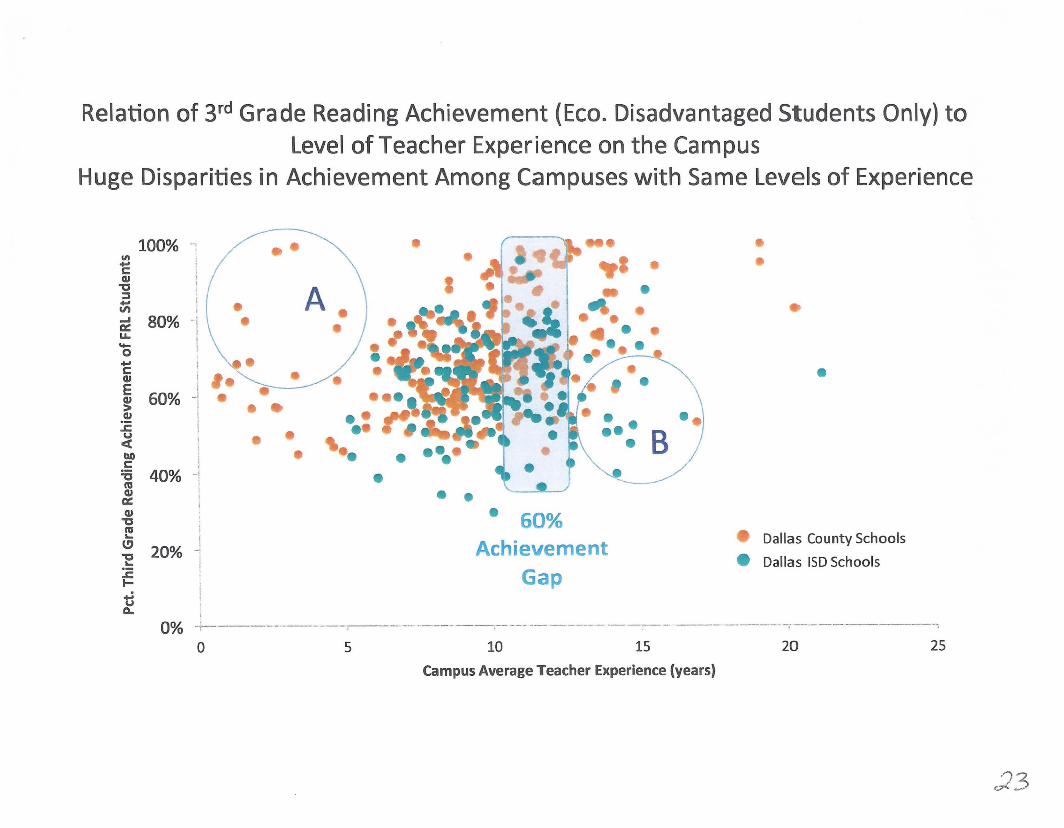
Relation of 3rd Grade Reading Achievement (Eco. Disadvantaged Students Only) toLevel of Teacher Experience on the Campus
Huge Disparities in Achievement Among Campuses with Same Levels of Experience
i
0% +------ ----- '--r--- -- .-------.-----------------, -. ---- ------,.-.---
•
Dallas County Schools
• Dallas ISD Schools
•
••• .J••• B )L-/
• 60%Achievement
Gap
• •••
•
A.
•
•
100%
II
80% -jI!j
60%!
_I
I
40% -,
11\....c:CII
"Cj
~....ex:u.o....c:CIIECII>.!.c:u<tboOc::sIU<IIex:CII
"CIU... i
c;I 20% J"E:cI-
~Q.
o 5 10 15 20 25
Campus Average Teacher Experience (years)
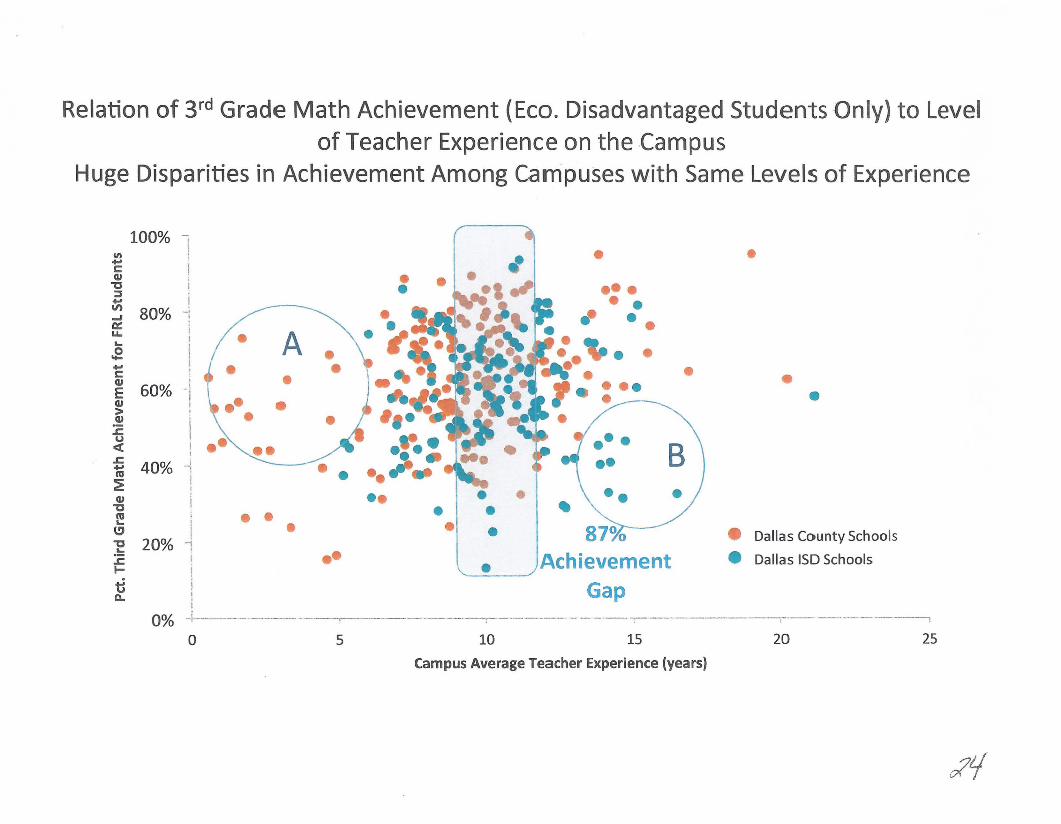
Relation of 3rd Grade Math Achievement (Eco. Disadvantaged Students Only) to Levelof Teacher Experience on the Campus
Huge Disparities in Achievement Among Campuses with Same Levels of Experience
• •
,--_._-------,
•
• Dallas County Schools
• Dallas ISO Schools
•
•B
A•
••• •
•• • •• • • •• • •
•• •iI
•I0% +-----.---------.--.-..-.-------.---:----.-.---------.--.~.-----
i
i20% "1,
III
40% -1
100% II!
I'"....cCI.l
"C:::J....~ 80% I
ff: iII. I
.E I~ ,
~ 60% -j>CI.l
.s::.u<C.s::....."'~CI.l
"C~C'"CII.
:EI-
~Q.
o 5 10 15 20 25
Campus Average Teacher Experience (years)

Statewide Percentile Ranking of Each Harrison District 2 CampusSchool Year Prior to Mike Miles Assuming Superintendency (2005-06)
WildflowerIrwin Elem.
StrattonCarmel
HarrisonPanorama
• CentennialTurman
Fox MeadowMtn. Vista
. ·GibersonMonterey
100
908070605040
302010o
Only 5 of 22 campuses ranked above the 50thpercenti Ie statewide; 8 ranked in the bottom 20 0/0
50thPercentile
2005-06 School YearNote: Mike Miles became superintendent in 2006-07 and left following the 2011-12 school year to become superintendent ofDISD. Similar to DISD, a new principal evaluation was implemented in Year 1 of his six year tenure, with six principals replacedin first year (-25%). Teacher evaluation and compensation system developed in Year 3 and implemented in Year 4, continuing
to present.Source: schooldigger.com Home>Colorado>Colorado Springs>Harrison School District No.2
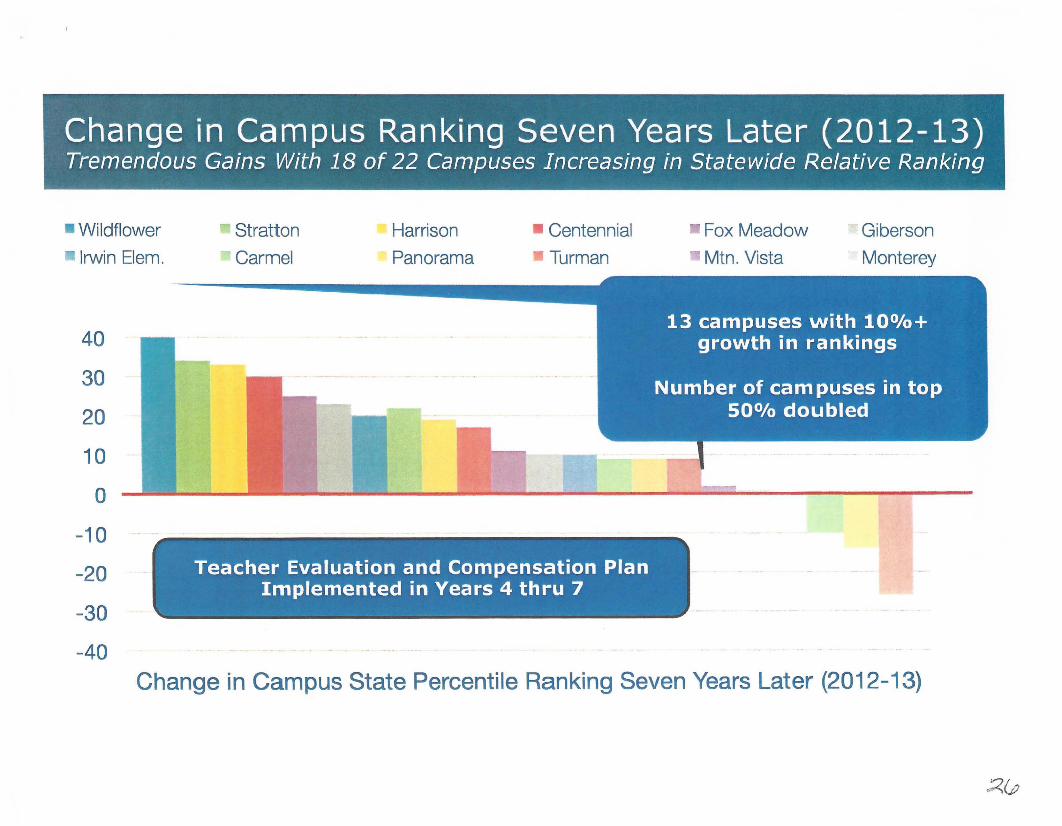
Change in Campus Ranking Seven Years Later (2012-13)Tremendous Gains With 18 of 22 Campuses Increasing in Statewide Relative Ranking
-Wildflower
Irwin Elem.
Stratton
Carmel
Harrison
Panorama
- Centennial
Turman
Fox Meadow
Mtn. Vista
. 'Giberson
Monterey
40
30
20
10
o-10
-20
-30
-40
Change in Campus State Percentile Ranking Seven Years Later (2012-13)