CHARTING THE FINANCIAL CRISIS · Antecedents of the Crisis ... As panic spread, the nationÕs...
85
at BROOKINGS CHARTING THE FINANCIAL CRISIS U.S. Strategy and Outcomes January 2020
Transcript of CHARTING THE FINANCIAL CRISIS · Antecedents of the Crisis ... As panic spread, the nationÕs...

at BROOKINGS
CHARTING THE FINANCIAL CRISIS
U.S. Strategy and Outcomes
January 2020

Introduction
The global !nancial crisis and great recession of 2007–2009 constituted the worst shocks to the United States economy in
generations. Books have been and will be written about the housing bubble and bust, the !nancial panic that followed, the
economic devastation that resulted, and the steps that various arms of the U.S. and foreign governments took to prevent the
Great Depression 2.0. But the story can also be told graphically, as these charts aim to do.
What comes quickly into focus is that as the crisis intensi!ed, so did the government’s response. Although the seeds of the
harrowing events of 2007–2009 were sown over decades, and the U.S. government was initially slow to act, the combined e"orts
of the Federal Reserve, Treasury Department, and other agencies were ultimately forceful, #exible, and e"ective. Federal
regulators greatly expanded their crisis management tool kit as the damage unfolded, moving from traditional and domestic
measures to actions that were innovative and sometimes even international in reach. As panic spread, so too did their e"orts
broaden to quell it. In the end, the government was able to stabilize the system, re-start key !nancial markets, and limit the
extent of the harm to the economy.
No collection of charts, even as extensive as this, can convey all the complexities and details of the crisis and the government’s
interventions. But these !gures capture the essential features of one of the worst episodes in American economic history and the
ultimately successful, even if politically unpopular, government response.
Copyright © 2020 Hutchins Center at the Brookings Institution and Yale Program on Financial Stability
www.som.yale.edu/!nancialcrisischarts
1

Antecedents of the Crisis
In the years leading up to the crisis, the underlying performance of the U.S. economy had eroded in important ways.
2

%
0
1
2
4
3
5
200820052000199519901985198019751970
Sources: Congressional Budget O!ce, “An Update to the Economic Outlook: 2018 to 2028”; authors’ calculations
ANTECEDENTS
Because the growth of productivity and the labor force had slowed in the decade before the crisis, the potential economic growth rate was falling.Growth in real potential GDP
Productivity growthContribution to real potential GDP from:
Labor force growth
3

94
96
98
100
102
104
106
’08’07’06’05’04’03’02’01’00’99’98’97’96’95’94’93’92’91’90
ANTECEDENTS
Overall prime-age participation in the labor force had been falling, as the participation of women slowed and men’s continued a decades-long decline.Civilian labor force participation rates for people ages 25–54, indexed to January 1990=100
Women, ages 25–54
All people, ages 25–54
Men, ages 25–54
Source: Bureau of Labor Statistics via Haver Analytics
4

– 50
0
+ 50
+100
+150
+200
+250
+300%
200820052000199519901985198019751970
ANTECEDENTS
Income growth for the top 1 percent had risen sharply, driving income inequality to levels not seen since the 1920s.Cumulative growth in average income since 1979, before transfers and taxes, by income group
Bottom 20 percentof households
81st to 99thpercentiles of
households
Top 1 percentof households
Middle 60 percentof households
Source: Congressional Budget O!ce, “The Distribution of Household Income, 2014”
5

ANTECEDENTS
Meanwhile, the !nancial system was becoming increasingly fragile.
6

0
8
6
4
2
10%
2008200019901980197019601950194019301920
ANTECEDENTS
A “quiet period” of relatively low bank losses had extended for nearly 70 years and created a false sense of strength.Two-year historical loan-loss rates for commercial banks
Sources: Federal Deposit Insurance Corp.; Federal Reserve Board; International Monetary Fund
7
–15
–10
– 5
0
+ 5
+10
+15
+20%
200820052000199519901985198019751970
ANTECEDENTS
The “Great Moderation”—two decades of more stable economic outcomes with shorter, shallower recessions and lower in!ation—had added to complacency. Quarterly real GDP growth, percent change from preceding period
Source: Bureau of Economic Analysis via Federal Reserve Economic Data (FRED)
The “Great Moderation”
8

0
5
10
15
20%
200820052000199519901985198019751970
ANTECEDENTS
Long-term interest rates had been falling for decades, re!ecting decreasing in!ation, an aging workforce, and a rise in global savings.Benchmark interest rates, monthly
30-year !xedmortgage rate
10-yearTreasury 2-year
Treasury
Sources: Federal Reserve Board and Freddie Mac Primary Mortgage Market Survey® via Federal Reserve Economic Data (FRED)
9

1970 1975 1980 1985 1990 1995 2000 2005 2008
0
+ 40
+ 60
+ 80
+100%
+ 20
Home prices had increased modestly through several boom-and-bust cycles since the 1970s, but started a much more dramatic rise in the late 1990s.
ANTECEDENTS
Home prices across the country had been rising rapidly for nearly a decade.
Real home price index, percentage change from 1890
Source: U.S. Home Price and Related Data, Robert J. Shiller, Irrational Exuberance
10

0
20
40
60
80
100
120
140%
200820052000199519901985198019751970
ANTECEDENTS
Household debt as a share of income had risen to alarming heights.
Aggregate household debt as a share of disposable personal income
Source: Federal Reserve Board Financial Accounts of the United States, based on Ahn et al. (2018)
Mortgage debt
Consumer debt
11

0
50
100
150
200
250
200820052000199519901985198019751970
%
ANTECEDENTS
Credit and risk had migrated outside the regulated banking system.
Credit market debt outstanding, by holder, as a share of nominal GDP
Insurers
GSEs
ABS
MMFs
Notes: GSE: government-sponsored enterprise (including Fannie Mae and Freddie Mac); ABS: asset-backed securities issuers; MMFs: money market fundsSource: Federal Reserve Board Financial Accounts of the United States
Q1 198031%
69%
Q1 200864%
36%
Nonbank FinancialsBroker-Dealers
Banks
12
0
0.25
0.50
0.75
1.00
1.25
1.50
1.75
$2.00 trillion
200820052000199519901985198019751970
The use of repo funding—a form of secured, short-term lending—tripled in the decade prior to 2008.
ANTECEDENTS
The amount of !nancial assets !nanced with short-term liabilities had also risen sharply, increasing the vulnerability of the !nancial system to runs.Net repo funding to banks and broker-dealers
Source: Federal Reserve Board Financial Accounts of the United States
13
The Arc of the Crisis
14

0
100
200
300
400
500 basis points
200920082007
Two widely accepted indicators of !nancial sector stress are credit default swap (CDS) spreads, which measure the cost of insuring a !rm’s debt, and the Libor-OIS spread, which is a common measure of banks’ counterparty credit risk.
Bank CDSspreads
Notes: Credit default swap spreads are equal-weighted averages of JPMorgan Chase, Citigroup, Wells Fargo, Bank of America, Morgan Stanley, and Goldman Sachs. Libor-OIS spread used throughout is the spread between the 3-month London Interbank O"ered Rate and the 3-month USD overnight indexed swap rate.Sources: Libor-OIS: Bloomberg Finance L.P.; bank CDS spreads: Bloomberg Finance L.P., IHS Markit
ARC OF THE CRISIS
The !nancial crisis unfolded in several phases.
Bank credit default swap spreads and Libor-OIS spread
Libor-OISspread
Increasing Stress EarlyEscalation
Panic and Resolution
15

200820072006
–50
–40
–30
–20
–10
0
+10%
DetroitSan Francisco
MiamiTampa
Los AngelesSan Diego
PhoenixLas Vegas
Change, July 2006–March 2008–22.5%–22.6–23.1–23.4–24.4–25.6–26.6–27.7
ARC OF THE CRISIS
Home prices peaked nationally in the summer of 2006, then fell rapidly—eight major cities had declines of more than 20 percent by March 2008.Change in S&P CoreLogic Case-Shiller Home Price Indexes for 20 cities and U.S., from U.S. peak in July 2006, not seasonally adjusted
U.S. peak:July 2006
U.S. change by March 2008: –9.0%
Sources: S&P CoreLogic Case-Shiller Home Price Indexes for 20 individual cities and National Home Price Index via Federal Reserve Economic Data (FRED)
16

basis points
0
50
100
150
200
250
300
350
400
200920082007
Note: GSE: government-sponsored enterpriseSource: Bloomberg Finance L.P.
ARC OF THE CRISIS
Stress in the !nancial system built up gradually over late 2007 and early 2008, as mortgage troubles and recession fears increased.Libor-OIS spread
Bank of England provides emergency credit to Northern
Rock, a troubled mortgage lender, Sept. 14, 2007
Banks and GSEs start reporting billions in losses in Nov. 2007, and
warn of dividend cuts and a need for more capital; stocks fall
BNP Paribas freezes three funds on
Aug. 9, 2007, amid fragile ABS markets
JPMorgan Chase rescues Bear Stearns with emergency support from Federal Reserve, March 14, 2008
Stock markets plunge Jan. 21, 2008, amid recession fears
Bank of America announces intent to buy Countrywide Financial,
a troubled mortgage lender, Jan. 11, 2008
17
Libor-OISspread
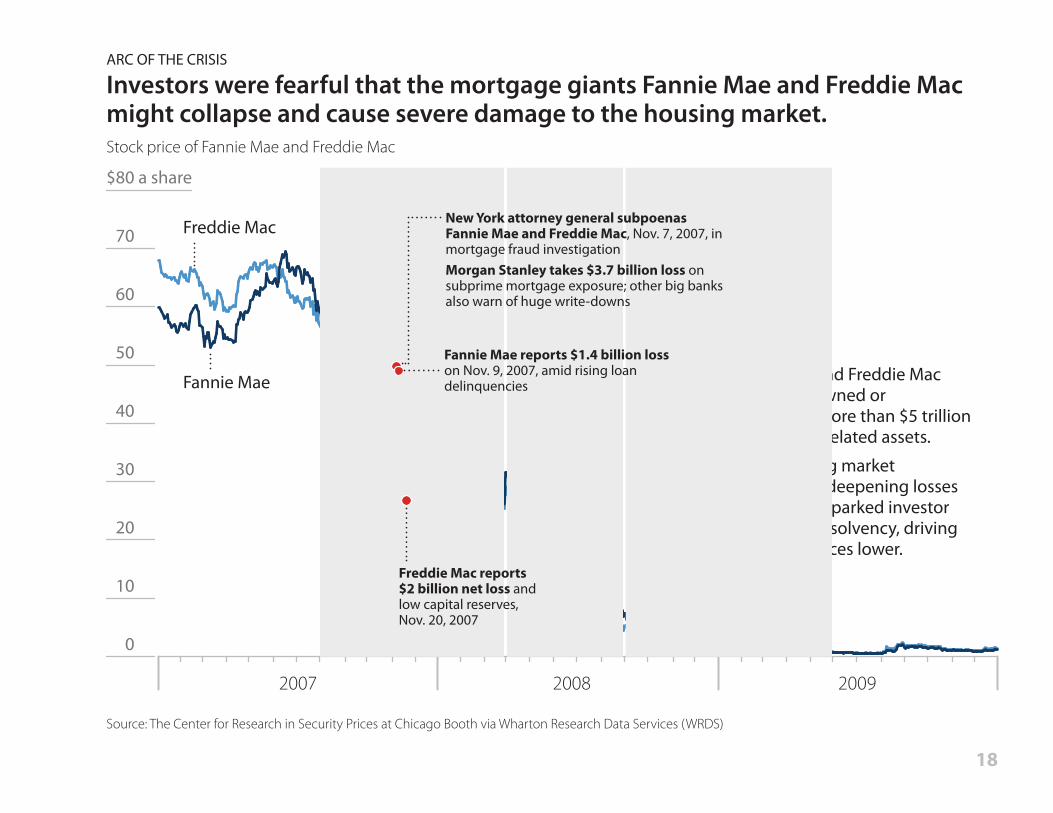
Fannie Mae and Freddie Mac collectively owned or guaranteed more than $5 trillion in mortgage-related assets.As the housing market deteriorated, deepening losses at both GSEs sparked investor concerns of insolvency, driving their share prices lower.
200920082007
0
10
20
30
40
50
60
70
$80 a share
Source: The Center for Research in Security Prices at Chicago Booth via Wharton Research Data Services (WRDS)
ARC OF THE CRISIS
Investors were fearful that the mortgage giants Fannie Mae and Freddie Mac might collapse and cause severe damage to the housing market.Stock price of Fannie Mae and Freddie Mac
Freddie Mac
Fannie Mae
New York attorney general subpoenas Fannie Mae and Freddie Mac, Nov. 7, 2007, in mortgage fraud investigationMorgan Stanley takes $3.7 billion loss on subprime mortgage exposure; other big banks also warn of huge write-downs
Fannie Mae reports $1.4 billion loss on Nov. 9, 2007, amid rising loan delinquencies
Freddie Mac reports$2 billion net loss andlow capital reserves,Nov. 20, 2007
18

200920082007
0
100
200
300
400
500
600
Note: Credit default swap spread is an equal-weighted average of JPMorgan Chase, Citigroup, Wells Fargo, Bank of America, Morgan Stanley, and Goldman Sachs.Sources: S&P 500 Financials: Bloomberg Finance L.P., S&P Dow Jones Indices LLC; bank CDS spreads: Bloomberg Finance L.P., IHS Markit
ARC OF THE CRISIS
As panic spread, the nation’s largest banks and investment banks looked increasingly vulnerable to failure.S&P 500 Financials index level, and average of six big banks’ CDS spreads in basis points
S&P 500 Financials
Averagebank CDSspread
Lehman Brothers !les for bankruptcy; Bank of America announces plans to acquire Merrill Lynch, Sept. 15, 2008Reserve Primary Fund “breaks the buck”;Fed rescues AIG with $85 billion credit facility, Sept. 16Fed authorizes Goldman Sachs and Morgan Stanley to become bank holding companies, Sept. 21Washington Mutual fails and is acquired in part by JPMorgan Chase, Sept. 25
S&P downgrades credit ratings of11 major global banks, Dec. 20, 2008
19

A self-reinforcing cycle of fear
ARC OF THE CRISIS
The rise in losses, the fear of further losses, and the liquidity pressures on the system pushed the price of !nancial assets down and added to concerns about the solvency of the !nancial system.
Economic or assetprice growth slows
People run from weak!nancial institutions
Financial institutionsunload assets in !re sale
Asset pricesdecline further
Banks lend less andpeople spend less
Economicgrowth slows
More !nancialinstitutions
look weak
20

–6
–3
0
+3
+6%
–9
2010200920082007Q4Q3Q2Q1 Q4Q3Q2Q1 Q4Q3Q2Q1 Q4Q3Q2Q1
ARC OF THE CRISIS
Yet the economic forecasts suggested a modest and manageable slowdown in economic growth. The forecasters were wrong. Real GDP, percent change from preceding quarter, SAAR, and Philadelphia Fed surveys of professional forecasters
Sources: Bureau of Economic Analysis via Federal Reserve Economic Data (FRED) (data update of Aug. 29, 2018); Philadelphia Federal Reserve Survey of Professional Forecasters, Q3 2007 and Q1 and Q3 2008
Professional Forecasters’GDP forecast, Aug. 2007
Actual GDP
Professional Forecasters’GDP forecast, Feb. 2008
Professional Forecasters’GDP forecast, Aug. 2008
21

The U.S. Strategy
22

U.S. STRATEGY
Among the key elements of the U.S. policy response were:
Use of the Fed’s lender-of-last-resort authorities beyond the banking system, for investment banks and funding markets.
An expansive use of guarantees to prevent runs on money market funds and a broad array of !nancial institutions.
An aggressive recapitalization of the !nancial system,in two stages, backed by expanded FDIC guarantees.
A powerful use of monetary and !scal policyto limit the severity of the recession and restore economic growth.
A broad mix of housing policies to prevent the failure of the GSEs, slow the fall of home values, lower mortgage rates, and aid in re!nancings.
An extension of dollar liquidity to the global !nancial system, combined with international cooperation and Keynesian stimulus.
23
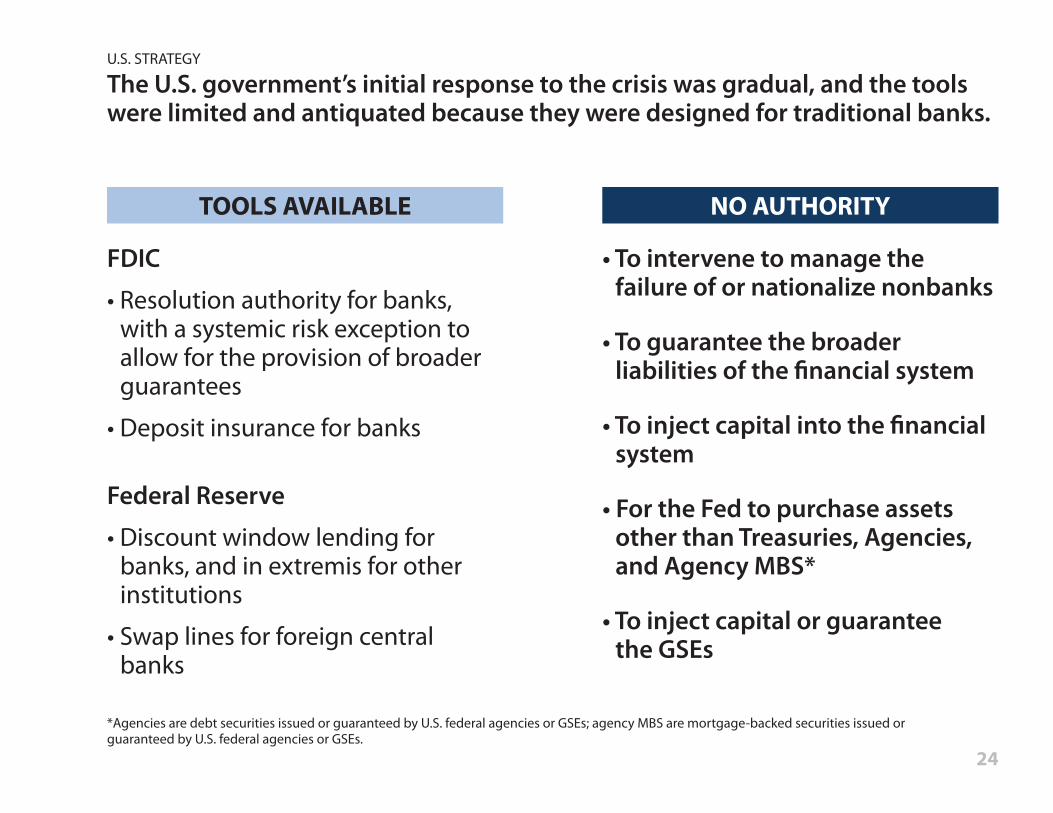
U.S. STRATEGY
The U.S. government’s initial response to the crisis was gradual, and the tools were limited and antiquated because they were designed for traditional banks.
FDIC• Resolution authority for banks,
with a systemic risk exception to allow for the provision of broader guarantees
• Deposit insurance for banks
Federal Reserve• Discount window lending for
banks, and in extremis for other institutions
• Swap lines for foreign central banks
TOOLS AVAILABLE
• To intervene to manage the failure of or nationalize nonbanks
• To guarantee the broader liabilities of the !nancial system
• To inject capital into the !nancial system
• For the Fed to purchase assets other than Treasuries, Agencies, and Agency MBS*
• To inject capital or guaranteethe GSEs
NO AUTHORITY
*Agencies are debt securities issued or guaranteed by U.S. federal agencies or GSEs; agency MBS are mortgage-backed securities issued or guaranteed by U.S. federal agencies or GSEs.
24

basis points
0
50
100
150
200
250
300
350
400
200920082007
Libor-OIS
Source: Libor-OIS: Bloomberg Finance L.P. Note: Start dates for programs re!ect the date of their announcement. The Federal Reserve administered the bank stress tests under the SCAP while the Treasury established a capital backstop under the CAP.
Increasing Stress EarlyEscalation
Panic and Resolution
U.S. STRATEGY
But the response became more forceful and comprehensive as the crisis intensi!ed and Congress provided new emergency authority.Libor-OIS spread
25
Systemic!nancialpolicies
Monetary and!scal policies
Housing andautos
International
Fannie, Freddie conservatorship (FHFA)
PPIP (Treasury)
Agency MBS Purchase Program (Treasury)
HAMP (Treasury)HARP (FHFA)
TALF (Fed, Treasury)
Recovery Act (Obama)Stimulus Act (Bush)
Central bank swap lines Swap line extension (Fed)
Quantitative easing (Fed)Fed funds interest rate cuts (Fed)
CPP (Treasury)
AIG stabilization (Fed, Treasury)
TLGP, deposit insurance (FDIC) CPFF (Fed)
MMF guarantees (Treasury)AMLF (Fed)
TSLF (Fed)Bear Stearns rescue (Fed)
Auto industry support (Treasury)
PDCF (Fed)
TAF TAF extension (Fed)
Stress tests (Fed, Treasury)

U.S. STRATEGY
The U.S. government deployed a mix of systemic policies to stabilize !nancial institutions and markets:
Liquidity programs to keep !nancial institutions operating and credit "owing to consumers and businesses.
Guarantee programs to support critical funding markets for !nancial institutions.
Capitalization strategies with private and government capital to prevent the failure of systemic institutions and resolve uncertainty about the !nancial system.
26

U.S. STRATEGY
As the crisis intensi!ed, the U.S. government’s liquidity programs expanded along several dimensions:
•"Domestic International
• Traditional Novel
• Institutions Markets
27

billion
0
100
200
300
400
500
$600 billion
0
100
200
300
400
500
$600
2010200920082007 2010200920082007
Source: Federal Reserve Board, based on English and Mosser (2020). Transaction-level data on discount window lending during the crisis were released under Freedom of Information Act court decisions (see: https://www.federalreserve.gov/foia/servicecenter.htm)
U.S. STRATEGY
The Federal Reserve initially deployed its traditional lender-of-last-resort tools to provide liquidity to the banking system.Federal Reserve discount window usage Term Auction Facility (TAF) usage
Use of theFed’s discountwindow
Term AuctionFacility
Banks were reluctant to borrow from the Fed’s discount window over fear it would signal they were in !nancial trouble . . .
. . . so the Fed initiated TAF in a similar role, and opened it to both domestic and foreign banks.
Foreign banksU.S. banks
28

billion
0
100
200
300
400
500
$600 billion
0
100
200
300
400
500
$600
20102009200820072010200920082007
Note: PDCF includes loans extended to select other broker-dealers.Source: Federal Reserve Board via Federal Reserve Economic Data (FRED)
U.S. STRATEGY
And then the Fed expanded its tools to support dealers and funding markets. Securities lent to dealers: Term Securities Lending Facility Primary Dealer Credit Facility (PDCF) loans
Term SecuritiesLending Facility
Primary DealerCredit Facility
. . . and then created the PDCF to provide emergency liquidity to investment banks, which did not have access to the discount window.
The Fed established the TSLF to promote liquidity in U.S. Treasury bonds and other important collateral markets . . .
29

0
3
6
9
12
15%
200920082007
Asset-backedcommercial paper
Commercial paper
Source: Federal Reserve Bank of New York based on data from the Federal Reserve Board of Governors, “Commercial Paper Rates and Outstanding Summary,” derived from data supplied by the Depository Trust & Clearing Corporation
U.S. STRATEGY
The Fed and Treasury introduced programs to address fragility in the commercial paper market, a key source of funding to !nancial institutions and businesses.Overnight issuance as a share of outstanding commercial paper
Commercial Paper Funding Facility (CPFF)announced by Fed, Oct. 7, 2008
Master Liquidity Enhancement Conduit (MLEC)On Oct. 15, 2007, Treasury facilitates plan for private banks to support the ABCP market; it is never implemented
BNP Paribas freezes three funds on Aug. 9, 2007,
amid fragile ABS markets
After the bankruptcy of Lehman Brothers, anxious investors demanded ultra-short terms for commercial paper, exposing issuers to signi!cant rollover risk amid the continued retreat of market liquidity.
AMLF and money market guarantees Sept. 19, 2008
Fed establishes ABCP Money Market Mutual Fund Liquidity
Facility; Treasury announces temporary guarantee program
for money market mutual funds, a major buyer of
commercial paper
Lehman bankruptcySept. 15, 2008
30

0
10
20
30
40
50
60
$70
20112010200920082007
billion
Sources: Federal Reserve Bank of New York based on data from JP Morgan, Bloomberg Finance L.P., and the Federal Reserve Board of Governors
U.S. STRATEGY
The Fed and Treasury also helped restart the asset-backed securitization market, a vital source of funding for credit cards, auto loans, and mortgage lending.Asset-backed securities issuance (eligible classes) and amount pledged to TALF
TALF, which becomes operational in March 2009, has an immediate e!ect on restoring market functionPPIP, introduced in February 2009, also supports the market
Lehman bankruptcyAfter the "rm’s collapse in September 2008, the ABS
market is nearly frozen
Early crisis average
Post-TALF and PPIP average
ABS market nearly frozen
Total issuance (eligible classes)Amount pledged to TALF
31

U.S. STRATEGY
The U.S. government put in place a mix of guarantees to backstop critical parts of the !nancial system.
32

DecemberNovemberOctober SeptemberAugust 2008
– 150
– 120
– 90
– 60
– 30
0
+ 30
+ 60
+$ 90 billion
Sources: iMoneyNet; authors’ calculations based on Schmidt et al. (2016)
U.S. STRATEGY
Treasury agreed to guarantee about $3.2 trillion of money market fund assets to stop the run on prime money market funds.Daily U.S. money market fund !ows
Prime institutionalmoney market fund !ows
Lehman bankruptcySept. 15, 2008before market
opened
Reserve Primary Fund “breaks the buck”Sept. 16, 2008; the fund held Lehman commercialpaper that was valued at zero after the bankruptcy
Treasury announces Temporary GuaranteeProgram for Money Market FundsSept. 19, 2008
Treasury opens guarantee programSept. 29, 2008
33

Increased coverage gave consumers and businesses more con!dence that their money was safe.
48
50
52
54
56
58
60
62%
Temporary increase to $250,000as authorized by the EmergencyEconomic Stabilization Act
$250,000 made permanentby Dodd-Frank
20112010200920082007
$100,000FDIC insurancecoverage
U.S. STRATEGY
The FDIC expanded its deposit insurance coverage limits on consumer and business accounts in an e!ort to prevent bank runs.Share of total deposits FDIC insured
Note: Does not include non-interest-bearing transaction account amounts insured by Dodd-Frank through the end of 2012.Source: U.S. Treasury, “Reforming Wall Street, Protecting Main Street”
FDIC-insureddeposits
53% 59%
34

0
50
100
150
200
250
300
350
$400 billion
20122011201020092008 200920082007
Nonbanks
Bank holdingcompanies
Commercialbanks 0
100
200
300
400
500 basis points
Bank CDSspreads
FDIC debtguarantees
*Debt Guarantee Program covered debt issued by both the parent company and its a!liates.Sources: Debt issuance: Federal Deposit Insurance Corp., authors’ calculations; CDS spreads: Bloomberg Finance L.P., IHS Markit
U.S. STRATEGY
By agreeing to guarantee new !nancial debt, the FDIC helped institutions obtain more stable funding.Debt outstanding under the TLGP (DGP)* Average-weighted CDS spread for six big banks
TLGP Debt Guarantee Program introduced
Oct. 14, 2008
35

U.S. STRATEGY
The U.S. government moved to strengthen the capital in the !nancial systemas the crisis intensi!ed by:
Encouraging the biggest institutions to raise private capital early in the crisis.
Injecting substantial government capital into the banking system when the crisis worsened and Congress providedemergency authority.
Stabilizing the most troubled banks with additional capitaland ring-fence guarantees.
Conducting stress tests to complete the recapitalization ofthe !nancial system.
36
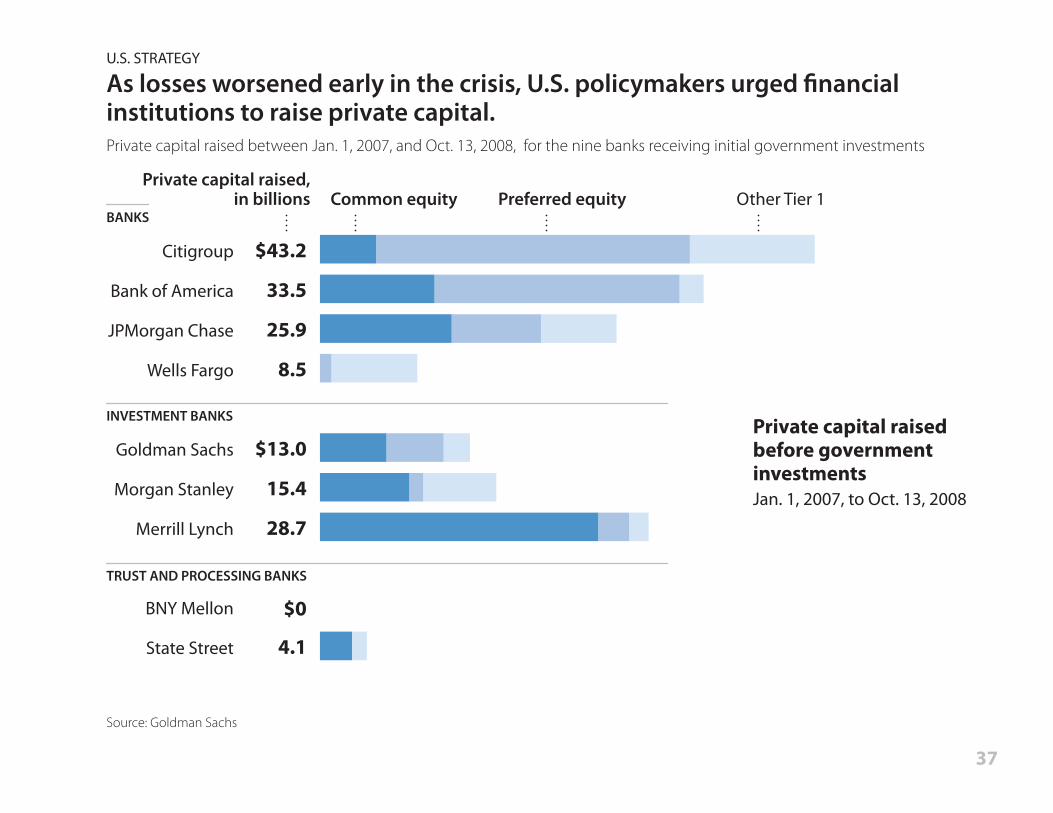
Private capital raised,in billions
Private capital raisedbefore governmentinvestmentsJan. 1, 2007, to Oct. 13, 2008
33.5
25.9
$13.0
15.4
28.7
$0
4.1
8.5
State Street
BNY Mellon
Merrill Lynch
Morgan Stanley
Goldman Sachs
Wells Fargo
$43.2Citigroup
JPMorgan Chase
Bank of America
Common equity Preferred equity Other Tier 1
U.S. STRATEGY
As losses worsened early in the crisis, U.S. policymakers urged !nancial institutions to raise private capital.Private capital raised between Jan. 1, 2007, and Oct. 13, 2008, for the nine banks receiving initial government investments
Source: Goldman Sachs
BANKS
INVESTMENT BANKS
TRUST AND PROCESSING BANKS
37
Capital raised,in billions
35.0
25.0
$15.8
10.0
10.0
$3.0
2.0
37.7
$59.1
State Street
BNY Mellon
Merrill Lynch
Morgan Stanley
Goldman Sachs
Wells Fargo
JPMorgan Chase
Bank of America
Citigroup**
Governmentpreferred equity*
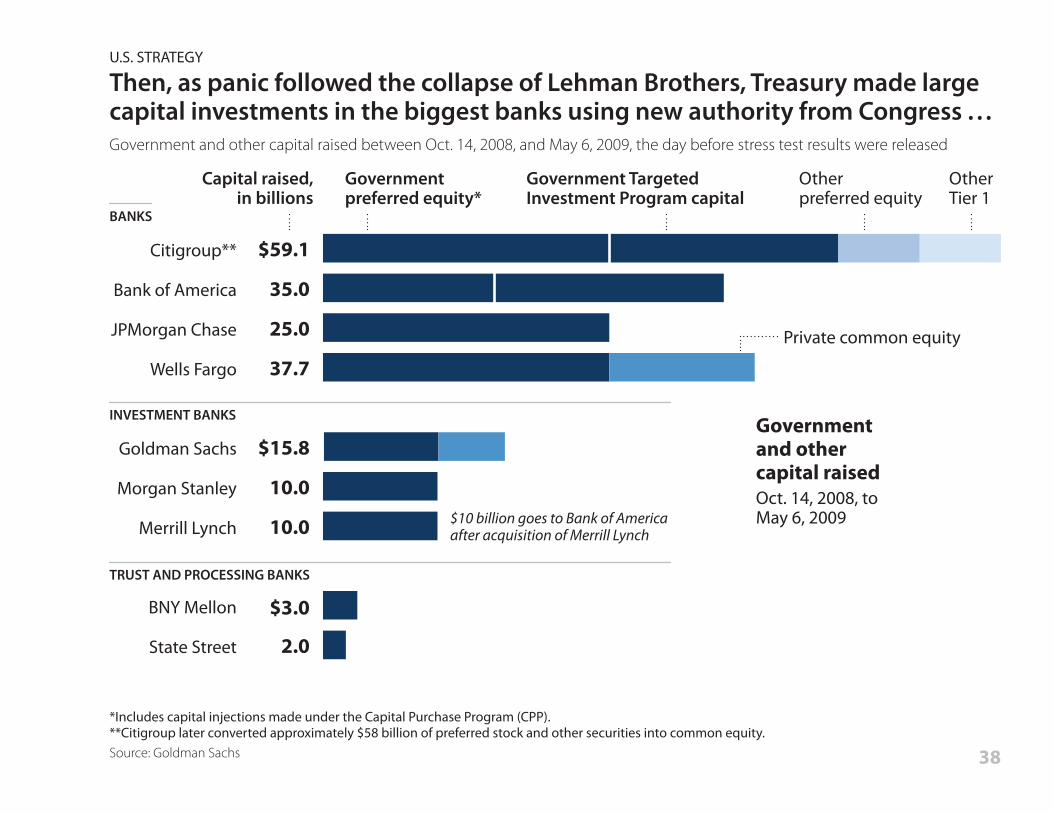
Government TargetedInvestment Program capital
Governmentand othercapital raisedOct. 14, 2008, toMay 6, 2009$10 billion goes to Bank of America
after acquisition of Merrill Lynch
Private common equity
Otherpreferred equity
OtherTier 1
U.S. STRATEGY
Then, as panic followed the collapse of Lehman Brothers, Treasury made large capital investments in the biggest banks using new authority from Congress . . .Government and other capital raised between Oct. 14, 2008, and May 6, 2009, the day before stress test results were released
*Includes capital injections made under the Capital Purchase Program (CPP). **Citigroup later converted approximately $58 billion of preferred stock and other securities into common equity.Source: Goldman Sachs
BANKS
INVESTMENT BANKS
TRUST AND PROCESSING BANKS
38

0
50
100
150
200
250
$300 billion
2014201320122011201020092008
By the end of 2008, more than 200 banks had received funds under the Capital Purchase Program. Overall, $205 billion would be distributed to 707 banks.An additional $40 billion was split between Citigroup and Bank of America under the Targeted Investment Program.
Government capital investmentsin banks
Sources: Timeline of funds outstanding: TARP Tracker; banks receiving funds, by asset size: U.S. Treasury, “Troubled Asset Relief Program: Two Year Retrospective,” SNL Financial; banks receiving funds, by state: authors’ calculations based on TARP Investment Program transaction reports, Aug. 8, 2018
U.S. STRATEGY
. . . and used additional funds to make direct government investments inhundreds of smaller banks.Principal outstanding for government bank capital investments Distribution of banks participating in the Capital Purchase Program
0 1 to 10
Less than$1 billion
$1 to $10billion
Over $10billion
Banks receiving funds: by asset size
Banks receiving funds: by state11 to 20 21 to 30 31 to 71
473 banks 177 57
39

CitigroupCDSspreads
0
100
200
300
400
500
600
700 basis points
2010200920082007
*The Federal Reserve Bank of New York’s loss position was structured in the form of a nonrecourse loan.Sources: Asset Guarantee Program terms: Special Inspector General for TARP, “Extraordinary Financial Assistance Provided to Citigroup, Inc.”; CDS spreads: Bloomberg Finance L.P., IHS Markit
U.S. STRATEGY
In addition to capital injections, the government expanded its tools with asset guarantees for the most troubled banks, Citigroup and Bank of America.Asset Guarantee Program (AGP), Citigroup assets, and “ring-fence” loss responsibility structure(Asset guarantees for Bank of America were drawn up but never implemented.)
Pool of Citigroupassets:$301 billion
Homemortgageloans$175.1 billion
MBS,commercialreal estate $76.3 billion
1st Loss 2nd Loss 3rd Loss Tail Loss
CitigroupAGP announcedNov. 23, 2008
Citigroup AGP asset pool !nalizedNov. 17, 2009
Citigroupexits AGP and repaysTARP fundsDec. 23, 2009
Other
Treasury$5.0 bil.
FDIC$10.0 bil.
Citigroup$39.5 bil.
Citigroup$0.6 bil.
Citigroup$1.1 bil.
Citigroup$24.5 bil.FRBNY*$220.4 bil.
40
0
$50
$100
$150
$200 billion
2012201120102009
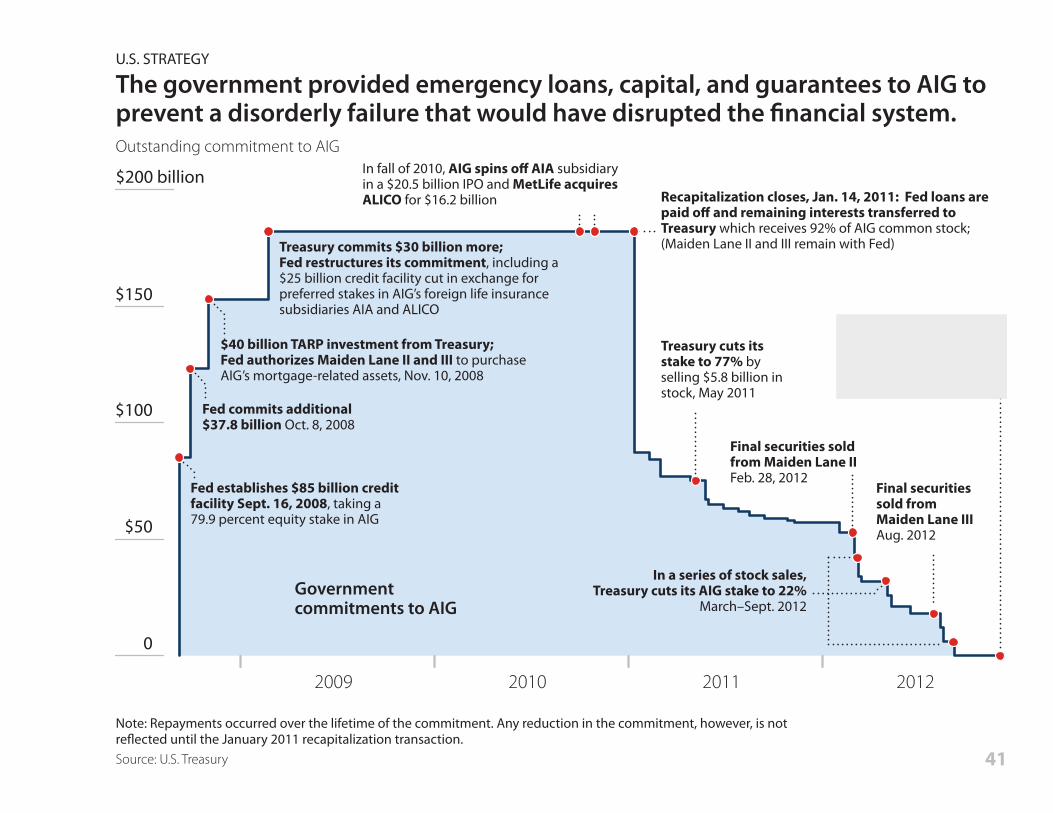
Note: Repayments occurred over the lifetime of the commitment. Any reduction in the commitment, however, is not re!ected until the January 2011 recapitalization transaction.Source: U.S. Treasury
U.S. STRATEGY
The government provided emergency loans, capital, and guarantees to AIG to prevent a disorderly failure that would have disrupted the !nancial system.Outstanding commitment to AIG
Fed establishes $85 billion credit facility Sept. 16, 2008, taking a 79.9 percent equity stake in AIG
In fall of 2010, AIG spins o! AIA subsidiary in a $20.5 billion IPO and MetLife acquires ALICO for $16.2 billion
Fed commits additional$37.8 billion Oct. 8, 2008
$40 billion TARP investment from Treasury;Fed authorizes Maiden Lane II and III to purchase AIG’s mortgage-related assets, Nov. 10, 2008
Treasury commits $30 billion more;Fed restructures its commitment, including a $25 billion credit facility cut in exchange for preferred stakes in AIG’s foreign life insurance subsidiaries AIA and ALICO
Treasury cuts its stake to 77% by selling $5.8 billion in stock, May 2011
In a series of stock sales,Treasury cuts its AIG stake to 22%
March–Sept. 2012
Final securities sold from Maiden Lane II Feb. 28, 2012
Final securities sold from Maiden Lane III Aug. 2012
Government makes $23 billion pro"tafter Treasury sells "nal
shares in AIG, Dec. 2012
Recapitalization closes, Jan. 14, 2011: Fed loans are paid o! and remaining interests transferred to Treasury which receives 92% of AIG common stock; (Maiden Lane II and III remain with Fed)
Governmentcommitments to AIG
41

0
2
4
6
8
10%
’10’00’90’80’70’60’50’40’30’20
U.S. STRATEGY
As con!dence in banks further eroded, government “stress tests” increased transparency, helping regulators and investors make credible loss projections . . . Two-year historical loan-loss rates for commercial banks SCAP capital shortfall, May 7, 2009
9.1%At 9.1% of outstanding loans,the Fed’s loss estimates for thestress test were higher than peaklosses during the Great Depression.
Note: The $74.6 billion in required capital is after earnings and capital measures in the !rst quarter of 2009. Citigroup’s requirement, for example, fell from $92.6 billion to $5.5 billion after adjusting for capital actions and earnings in the !rst quarter of 2009 and its plan to convert approximately $58 billion of preferred stock into common equity.Sources: Federal Deposit Insurance Corp.; Federal Reserve Board; International Monetary Fund
Two-year historical loan-loss ratesfor commercial banks
$0.6 PNC Financial
$1.1 Fifth Third Bank
$1.8 KeyCorp
$1.8 Morgan Stanley
$2.2 SunTrust Banks
$2.5 Regions Financial
$11.5 GMAC
$13.7 Wells Fargo
Bank ofAmerica$33.9
CAPITAL RAISES NEEDED, IN BILLIONS
$5.5 Citigroup
Of 19 institutions participating inthe Supervisory Capital Assessment Program (SCAP), ten were requiredto raise $74.6 billion in capital; nine others did not need additional capital.
42

Private capital raised,in billions
Private capital raisedafter stress testresults releasedMay 7, 2009, throughDec. 31, 2010
9.8
$22.7
32.8
$0
6.9
—
$2.8
2.3
20.9
State Street
BNY Mellon
Merrill Lynch Acquired by Bank of America
Morgan Stanley
Goldman Sachs
Wells Fargo
JPMorgan Chase
Bank of America
Citigroup
Common equity Preferred equityOther Tier 1
U.S. STRATEGY
. . . and accelerated the return of private capital.
Private capital raised, May 7, 2009, through Dec. 31, 2010
Note: In April 2009, before the release of stress test results, Goldman Sachs raised $5.8 billion in capital for the repayment of TARP funds.Source: Goldman Sachs
BANKS
INVESTMENT BANKS
TRUST AND PROCESSING BANKS
43

0
20
40
60
80
100
$120 billion
201620152014201320122011201020092008
U.S. STRATEGY
Indeed, the U.S. recapitalized its banking system more quickly and aggressively than Europe.Capital raised each year
Note: Authors’ estimates based on !gures from Goldman Sachs.Source: Goldman Sachs
U.S. banks~90% of 2008–2016 capital was raised 2008–2010
European banks~50% of 2008–2016 capital was raised 2008–2010
44

U.S. STRATEGY
Alongside programs designed to address the systemic problems in the !nancial system, the Fed and Treasury put in place a forceful mix of monetary policy and !scal stimulus.
45

0
’12’11’10’09’08’07
0
50
100
150
$200 billion
1
2
3
4
5
6%
’12’11’10’09’08’07
Fed funds target rateUpper bound
Fed assetpurchases
10-year Treasury rate
Sources: Target rate: Federal Reserve Board; 10-year Treasury: Federal Reserve Board via Federal Reserve Economic Data (FRED); monthly asset purchases: Federal Reserve Bank of New York, Haver Analytics
U.S. STRATEGY
As the Fed funds rate neared zero, the Fed made large-scale asset purchases to drive down long-term interest rates—a policy known as quantitative easing. Fed funds target rate or range and 10-year Treasury rate Gross asset purchases, monthly
Target range
QE 1 QE 2 QE 3
QE 1 QE 2 QE 3
TreasuriesAgency debtMBS
46

0
+0.5
+1.0
+1.5
+2.0
+2.5
+3.0
+3.5
+4.0%
201220112010200920082007
Note: $168 billion represents the combined stimulus from pre–Recovery Act measures through 2012.Sources: Council of Economic Advisers; Congressional Budget O!ce; Bureau of Economic Analysis; calculations by Jason Furman
U.S. STRATEGY
The U.S. passed the !rst !scal stimulus very early in the crisis. But at$168 billion, it was relatively small and needed time to take e"ect. Quarterly e"ect of #scal stimulus measures on GDP
Estimated impact on GDPfrom !scal legislation
Post–Recovery ActRecovery ActPre–Recovery Act
Economic StimulusAct of 2008Feb. 13, 2008
Supplemental Appropriations ActJune 30, 2008
Housing and Economic Recovery Act (HERA) July 31, 2008
Unemployment Compensation Extension Act Nov. 21, 2008
47

0
+0.5
+1.0
+1.5
+2.0
+2.5
+3.0
+3.5
+4.0%
201220112010200920082007
Note: $712 billion represents the stimulus from the Recovery Act through 2012.Sources: Council of Economic Advisers; Congressional Budget O!ce; Bureau of Economic Analysis; calculations by Jason Furman
U.S. STRATEGY
The Recovery Act of 2009 provided a larger mix—$712 billion—of temporary tax cuts and spending increases, o!setting some but not all of the fall in GDP.Quarterly e"ect of #scal stimulus measures on GDP
American Recovery and Reinvestment Act of 2009Feb. 17, 2009
Estimated impact on GDPfrom "scal legislation
Post–Recovery ActRecovery ActPre–Recovery Act
48

0
+0.5
+1.0
+1.5
+2.0
+2.5
+3.0
+3.5
+4.0%
201220112010200920082007
Note: $657 billion represents the combined stimulus from post–Recovery Act measures through 2012.Sources: Council of Economic Advisers; Congressional Budget O!ce; Bureau of Economic Analysis; calculations by Jason Furman
U.S. STRATEGY
A further $657 billion from a series of smaller post–Recovery Act measures added to the level of economic support . . . Quarterly e"ect of #scal stimulus measures on GDP
Estimated impact on GDPfrom !scal legislation
Post–Recovery ActRecovery ActPre–Recovery Act
Supplemental Appropriations ActJune 2009
Worker, Homeowner andBusiness Assistance Act;Defense Appropriations ActNov.–Dec. 2009
Temporary Extension Act; Hiring Incentives to Restore Employment Act March 2010
ContinuingExtension Act April 2010
Unemployment Compensation Extension Act;FAA Air Transportation Act; Small Business Jobs ActJuly–Sept. 2010
VOW Act; Temporary Payroll Tax Cut Continuation ActNov.–Dec. 2011
Tax Relief Act Dec. 2010
Middle-Class Tax Relief and Job Creation ActFeb. 2012
49
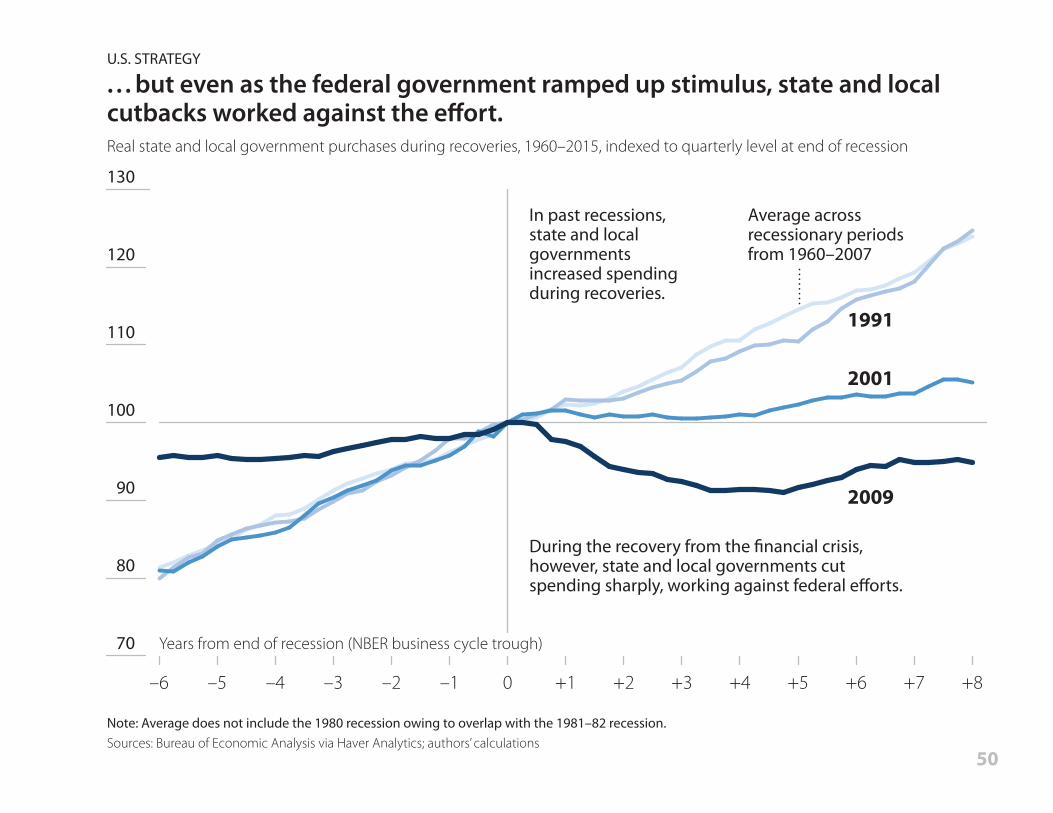
2009
2001
1991
Average acrossrecessionary periodsfrom 1960–2007
During the recovery from the !nancial crisis, however, state and local governments cut spending sharply, working against federal e"orts.
In past recessions, state and local governments increased spending during recoveries.
Years from end of recession (NBER business cycle trough)
U.S. STRATEGY
. . . but even as the federal government ramped up stimulus, state and localcutbacks worked against the e!ort. Real state and local government purchases during recoveries, 1960–2015, indexed to quarterly level at end of recession
Note: Average does not include the 1980 recession owing to overlap with the 1981–82 recession.Sources: Bureau of Economic Analysis via Haver Analytics; authors’ calculations
70
80
90
100
110
120
130
+8+7+6+5+4+3+2+10–1–2–3–4–5–6
50

U.S. STRATEGY
The government put in place a series of housing programs to:
•!Lower mortgage rates and ensure the availability of credit
• Reduce mortgage foreclosures
• Help struggling borrowers re"nance mortgages to take advantage of lower rates
51

0
1
2
3
4
5
6
7%
0
100
200
300
400
500
600
700,000
201620152014201320122011201020092008200720062005
Sources: Mortgage rates: Freddie Mac Primary Mortgage Market Survey® via Federal Reserve Economic Data (FRED); foreclosure completions: CoreLogic
U.S. STRATEGY
The government’s housing programs brought down mortgage rates and reduced foreclosures but were not powerful enough to contain the damage.30-year !xed mortgage rate Foreclosure completions, annual rate distributed evenly across four quarters
Hope NowOct. 10, 2007 Treasury and HUD facilitate creationof private loan modi!cation program
Home prices peakJuly 2006
HAMP and HARP Treasury releases details on Home A"ordable Modi!cation Program and Home A"ordable Re!nance Program, March 4, 2009
Fannie Mae, Freddie Mac conservatorship Sept. 7, 2008FHFA takes control of GSEsAgency MBS Purchase Program Treasury announces plan to purchase securities, also on Sept. 7
Quantitative easing Fed announces it will buy GSE debt and GSE-backed MBS, Nov. 25, 2008
FDIC-IndyMac modi!cationsProgram implementedAug. 20, 2008, for failed IndyMac Bank
ForeclosurecompletionsRight scale
30-year !xedmortgage rateLeft scale
52

0
50
100
150
200
250
$300 billion
0
50
100
150
200
250
300 basis points
201120102009200820072006
Agency MBS Left scale
Agency MBS spread Right scalePrivate-market MBS Left scale
Sources: MBS issuance: Securities Industry and Financial Markets Association; agency MBS spread: Bloomberg Finance L.P., authors’ calculations
U.S. STRATEGY
Government support of Fannie Mae and Freddie Mac kept mortgage credit !owing and stabilized the housing market after private issuers pulled back.Mortgage-backed securities issuance Agency MBS-to-Treasury spread
Fannie Mae, Freddie Macconservatorship Sept. 7, 2008
Senior Preferred Stock Purchase Agreements (SPSPAs)GSEs receive capital backstop of up to $100 billion, Sept. 26
Fed QE 1 Fed announces it will buyGSE debt and GSE-backed MBS, Nov. 25, 2008
First SPSPA Amendment increases commitmentto $200 billion per GSE, May 6, 2009
Second SPSPA Amendmentincreases commitmentagain, Dec. 24, 2009
53

0
100
200
300
400
500
600
700,000
201620152014201320122011201020092008200720062005
FHA lossmitigation
HAMP permanentmodi!cations
Private sectormodi!cations
Foreclosurecompletions
Note: Modi!cations through Nov. 2016; other program results through 2016. Foreclosure completions are plotted using an annual rate distributed evenly across four quarters.Sources: FHA loss mitigation: Dept. of Housing and Urban Development; HAMP modi!cations: U.S. Treasury; private sector modi!cations: HOPE NOW; foreclosure completions: CoreLogic
U.S. STRATEGY
Loan modi!cation programs, including HAMP, helped millions of struggling home owners with their mortgages.Mortgages modi!ed or receiving loss mitigation aid, April 1, 2009, through Nov. 30, 2016
Streamlined administrative processes,Aug. and Oct. 2009
Revised HAMP rules, March 2010, to encourage some principal write-downs to combat negative equity and to o"er some unemployed borrowers principal forbearance for up to three months
HAMP Tier 2 becomes e!ective,June 2012, facilitating modi!cations for non-GSE borrowers
Streamline HAMP announced, July 2015, allowing modi!cations for seriously delinquent borrowers with documentation limitations
54

0
100
200
300
400
500
600
700,000
201620152014201320122011201020092008200720062005
HARPre!nances
Note: Foreclosure completions are plotted using an annual rate distributed evenly across four quarters.Sources: Re!nances: Federal Housing Finance Agency; foreclosure completions: CoreLogic
U.S. STRATEGY
The Home A"ordable Re!nance Program lowered mortgage rates, encouraged re!nancings, and helped “underwater” home owners avoid foreclosure.Loans re!nanced through the Home A"ordable Re!nance Program
Foreclosurecompletions
Raised loan-to-value ceiling,July 2009, to allow somewhat deeper underwater borrowers to re!nance
Streamlined administrative processes, Aug. and Oct. 2009
HARP 2.0, Oct. 2011, eased representation and warranty requirements to increase pool of eligible borrowers and increase servicer participation
55

Other borrower assistanceLoan modi!cations5.3 million8.2 million
0
2
4
6
8
10
12 million
PROGRAMS
HAMP All trial and permanent loan modi!cations
HOPE NOW Proprietary modi!cations
GSE Standard and streamlined modi!cations
FHA MODIFICATIONS Additional loss mitigation
PROGRAMS
FHFA HomeSaver advance; repayment plans; forbearance plans; and foreclosure alternatives
FHA Loss mitigation interventions
STATE AND LOCAL HOUSING FINANCE AGENCY INITIATIVES Mortgages and !nanced units
HARDEST HIT FUND Local foreclosure prevention
Through2012
Through2017
Special re!nancings9.5 million
PROGRAMS
HARP Completed re!nances
FHFA Streamline re!nances
FHA Streamline re!nances Through
2012
Through2017
Through2012
Through2017
U.S. STRATEGY
The government’s programs helped millions of home owners, but were slow to take e"ect and reached a limited number of people threatened by foreclosure.Home owners assisted through crisis-era loan modi!cation programs and other foreclosure prevention actions
Source: Barr et al. (2020)
56

U.S. STRATEGY
Even though the crisis started in the United States, its impact reverberated around the world—and the response required U.S. policymakers to work closely with their global counterparts to:
Establish central bank swap linesto address dollar funding shortages
Coordinate monetary policyto send a powerful message to the markets
Arrange for IMF supportfor emerging markets countries a!ected by the crisis
57

By Oct. 14, 2008, the Fed had expanded currency swap lines to essentially unlimited amounts with four central banks: ECB, Switzerland, and the Banks of England and Japan.Limited swap lines were arranged with 10 other central banks:
billion
0
100
200
300
400
500
$600
Sources: Amounts outstanding: Federal Reserve Board, authors’ calculations; maximum commitments: Goldberg et al. (2010)
U.S. STRATEGY
The Federal Reserve established swap lines with more than a dozen foreign central banks to ease funding pressures arising from a shortage of dollars.Central bank liquidity swaps
Othercountries
JapanECB
Canada
Australia
Sweden
Brazil
Mexico
South Korea
Singapore
Denmark
Norway
New Zealand
Swap line limitsSwap line amounts outstanding
201020092008
Australia, Denmark, Norway, Sweden added Sept. 24, 2008
Japan, Bank of England, Canada added Sept. 18, 2008
Brazil, Mexico, New Zealand,South Korea, Singapore added Oct. 28–29, 2008
Fed establishes swap lines with the ECB and SwitzerlandDec. 12, 2007
$30
$30
$30
$30
$30
$30
$30
billions
$15
$15
$15
58

20122011201020092008 200720062005
0
1
2
3
4
5
6% target rate
United States
United Kingdom
Switzerland
Canada
EuropeanCentralBank
Japan
Source: Bloomberg Finance L.P.
U.S. STRATEGY
The Federal Reserve and the world’s major central banks orchestrated a coordinated interest rate cut.Central bank target interest rates for each country (month-end)
On Oct. 8, 2008, the Fed joins the European Central Bank, the Bank of England, and the central banks of Canada, Sweden, and Switzerland in cutting interest rates.
59

0
25
50
75
100
125
150
$175 billion
14 1513121110987654321Months after the start of new IMF lending
Asian !nancial crisis (1997–1998)
Global !nancial crisis (2008–2009)
Note: Start date for new IMF lending for the Asian !nancial crisis (AFC) is July 1997 and for the global !nancial crisis (GFC) is Sept. 2008. SDR data were converted to U.S. dollars at $1.355820 per SDR (the rate on July 31, 1997) for the AFC and $1.557220 per SDR (the rate on Sept. 30, 2008) for the GFC.Sources: International Monetary Fund; authors’ calculations based on Lowery et al. (2020)
U.S. STRATEGY
The IMF provided substantial aid to countries a"ected by the crisis, outpacing its response to the Asian !nancial crisis in 1997.Increase in IMF lending commitments from start of Asian and global !nancial crises
Proposal to expand New Arrangements to Borrow
resources of the IMF by up to $500 billion, April 2009
Flexible credit lines
Standby and extendedarrangements
Standby and extendedarrangements
60

Outcomes
61

21Peak 321 1Peak
%
–70
–60
–40
–30
–10
0
–50
–20
Peak
–25
–15
– 5
0%
–20
–10
–20
–15
– 5
0%
–10
Year later Year laterYear later
Notes: Stock declines shown to !nancial crisis trough; house prices 3 years after peak; household wealth !gures are based on the change between the nominal annual average of 1929 and of 1930, and the change in the nominal level from Q1 2008 to Q1 2009. Sources: Stock prices: The Center for Research in Security Prices at Chicago Booth via Wharton Research Data Services (WRDS); housing prices: U.S. home price and related data, Robert J. Shiller, Irrational Exuberance; GD household wealth: Mishkin (1978); GR household wealth: Federal Reserve Board Financial Accounts of the United States
OUTCOMES
The severity of the stress of the 2008 !nancial crisis was, in some respects, worse than in the Great Depression.Stock market prices from peak Nominal house prices from peak Decline in household wealth
Stock market House prices Householdwealth
FinancialCrisis–57.8%
FinancialCrisis–18.3% Financial
Crisis–14.1%
GreatDepression–44.9%
GreatDepression–6.2%
GreatDepression–6.0%
62
2010200920082007
0
100
200
300
400
500 basis points
Bank CDSspreads
Note: Credit default swap spreads are equal-weighted averages of JPMorgan Chase, Citigroup, Wells Fargo, Bank of America, Morgan Stanley, and Goldman Sachs.Sources: Libor-OIS: Bloomberg Finance L.P.; CDS spreads: Bloomberg Finance L.P., IHS Markit
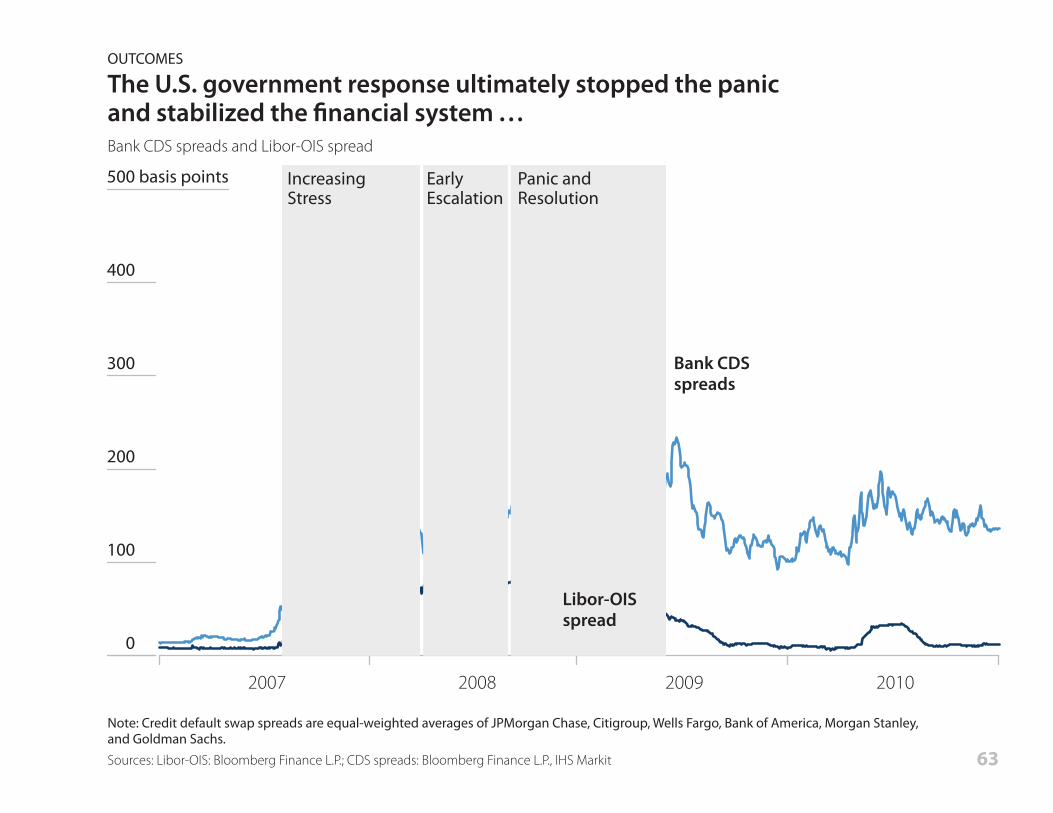
OUTCOMES
The U.S. government response ultimately stopped the panicand stabilized the !nancial system . . .Bank CDS spreads and Libor-OIS spread
Libor-OISspread
IncreasingStress
EarlyEscalation
Panic andResolution
63

0
1
2
3
4
5
6
$7 trillion
201020092008
–6
–4
–2
0
+2
+4
+6%
OUTCOMES
. . . and allowed the economy to slowly begin digging out of adeep recession.Treasury, Federal Reserve, and FDIC exposures Real GDP and employment growth, year-over-year percent change (monthly)
Sources: Liang et al. (2020), based on U.S. government exposures: Congressional Oversight Panel, “Guarantees and Contingent Payments in TARP and Related Programs” via Federal Reserve Bank of St. Louis, Federal Deposit Insurance Corp., Federal Reserve Board, Federal Housing Finance Agency, U.S. Treasury; employment: Bureau of Labor Statistics; real GDP: Macroeconomic Advisers via Haver Analytics
GovernmentcommitmentsLeft scale
GuaranteesOther programsTARPFed liquidity
Real GDPYear-over-yearchange Right scale
EmploymentYear-over-yearchange Right scale
64

0
100
200
300
400
500
600
700 basis points
2010200920082007
+80
+60
+40
+20
0
–20%
2007 2008 2009 2010
Sources: ABS spreads: Federal Reserve Bank of New York based on data from JP Morgan and Bloomberg Finance L.P.; lending standards: Federal Reserve Board
OUTCOMES
The response helped restart the credit markets and bank lending so that !nancing was once again cheaper and easier to obtain.Consumer asset-backed security (ABS) spreads Net percentage of banks tightening loan standards
Credit lessavailable
Primemortgage
credit moreavailable
Triple-A-ratedcredit cardABS spread
Triple-A-ratedauto ABS spread
65!
0
1
2
3
4
5%
2013201220112010200920082007 2013201220112010200920082007
100
120
140
160
180
200
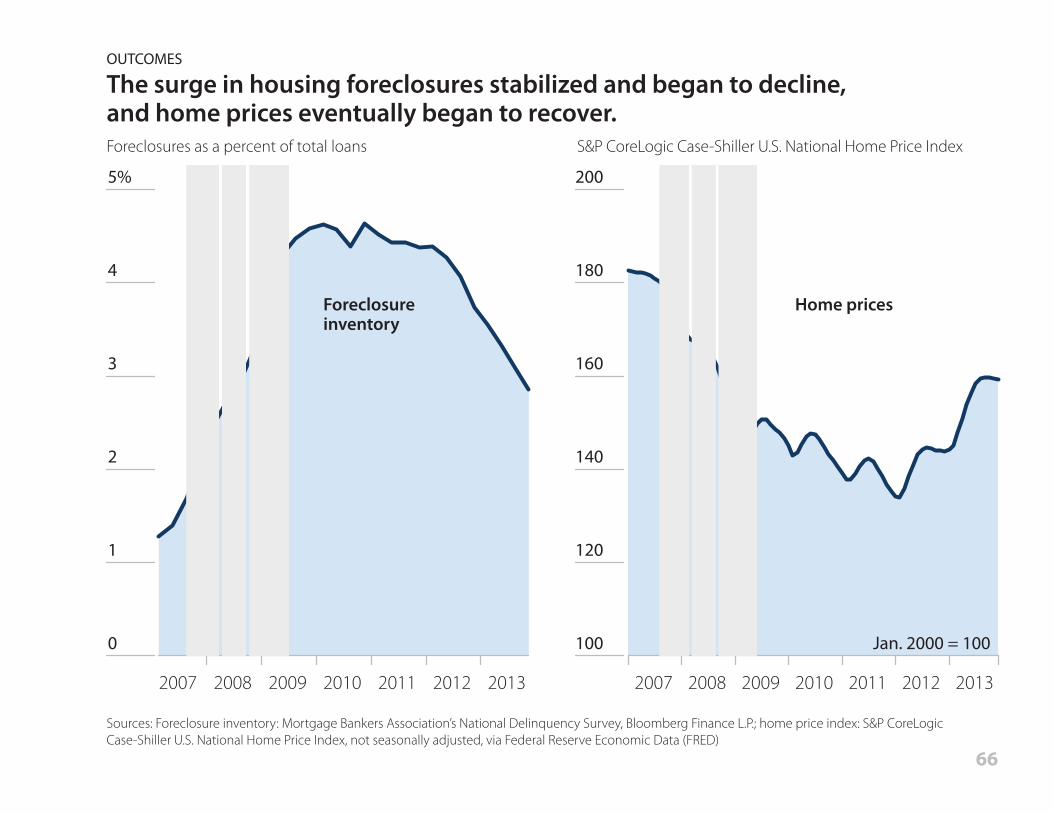
OUTCOMES
The surge in housing foreclosures stabilized and began to decline,and home prices eventually began to recover.Foreclosures as a percent of total loans S&P CoreLogic Case-Shiller U.S. National Home Price Index
Sources: Foreclosure inventory: Mortgage Bankers Association’s National Delinquency Survey, Bloomberg Finance L.P.; home price index: S&P CoreLogic Case-Shiller U.S. National Home Price Index, not seasonally adjusted, via Federal Reserve Economic Data (FRED)
Foreclosureinventory
Home prices
Jan. 2000 = 100
66
– 10
0
+10
20
+30
+40
+50%
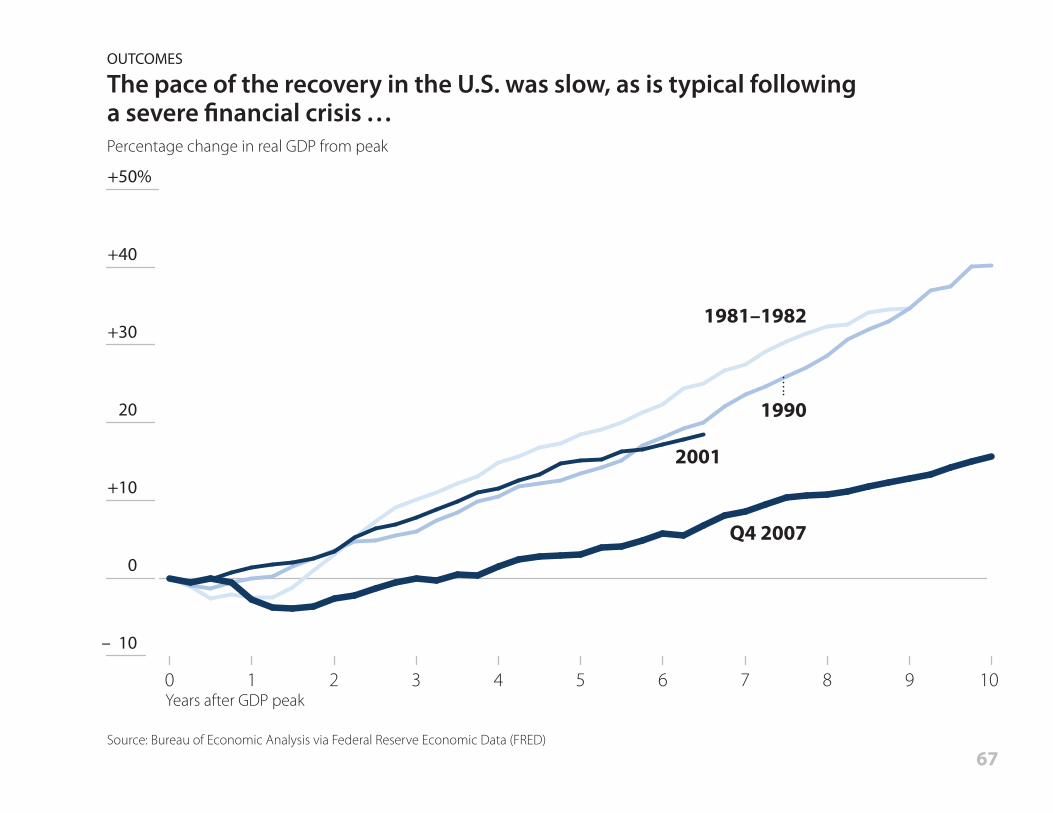
109876543210
Q4 2007
2001
1990
1981–1982
Years after GDP peak
OUTCOMES
The pace of the recovery in the U.S. was slow, as is typical followinga severe !nancial crisis . . . Percentage change in real GDP from peak
Source: Bureau of Economic Analysis via Federal Reserve Economic Data (FRED)67

–10
– 8
– 6
– 4
– 2
0
+ 2
+ 4
+ 6%
201320122011201020092008
Germany
United Kingdom
Italy
Spain
France
OUTCOMES
. . . although growth has been stronger than in many European countries. Real GDP, percentage change from 4th quarter 2007
Source: Organisation for Economic Co-operation and Development
United States
68

OUTCOMES
Financial crises are typically costly to economic output, but the U.S. strategy was able to limit the damage compared to other crises.
Sources: Reinhart and Rogo! (2009); Bureau of Economic Analysis via Federal Reserve Economic Data (FRED); based on comparisons from Liang et al. (2020)
Decline in output peak to trough(real GDP per capita)
How bad was the drop in GDP?
63 !nancial crises inadvanced economies,1857 to 2013
–9.6%
U.S. !nancial crisis
Duration of recessionHow long was the recession?
2.9years
1.5years
Recovery of output toprevious peak
How fast was the recovery?
7.3years
5.5years
–5.25%
69

OUTCOMES
U.S. taxpayers made a pro!t on the !nancial rescue.Income or cost of !nancial stability programs
Sources: Federal Deposit Insurance Corp.; Federal Housing Finance Agency; Federal Reserve Board; Webel and Labonte (2018); U.S. Treasury
CapitalInvestments
GSEsAIGCPPCitigroupBank of AmericaGMAC/AllyCDCIChrysler Financial
ChryslerGeneral Motors
Liquidity/Credit Markets
GSE Debt PurchasesCPFFTAFPPIPTALFTSLFMaiden LanePDCFAMLFSBA 7(a)
+$17.66.14.13.92.30.80.80.60.50.0
GuaranteePrograms
DGPMMF Guarantee
TAGP
+$10.21.2
–0.3
FDICResolution
In billions In billions
In billionsIn billions
Cumulative Income, 2008–10
DIF Losses, 2008–10
+$88.222.721.9
6.63.12.40.00.0
–1.2–10.5
+$45.4
–60.0
70

Bank holding companieswith more than$500 billion in assets
All institutions
Bank capital levels
0
2
4
6
8
10
12
14%
20172016201520142013201220112010200920082007200620052004200320022001
Long after the !nancial crisis, banks have continued to increase their capital, pushed in large part by more stringent regulatory requirements.
OUTCOMES
Today the !nancial system has signi!cantly more capital and would be better able to withstand losses in the event of a severe economic downturn.CET1 and Tier 1 common equity as percent of risk-weighted assets
Note: Capital ratio is based on tier 1 common equity pre-2014 and common equity tier 1 (CET1) as of 2015, and is a combination of the two during 2014.Source: Federal Reserve Bank of New York’s Research and Statistics Group
71
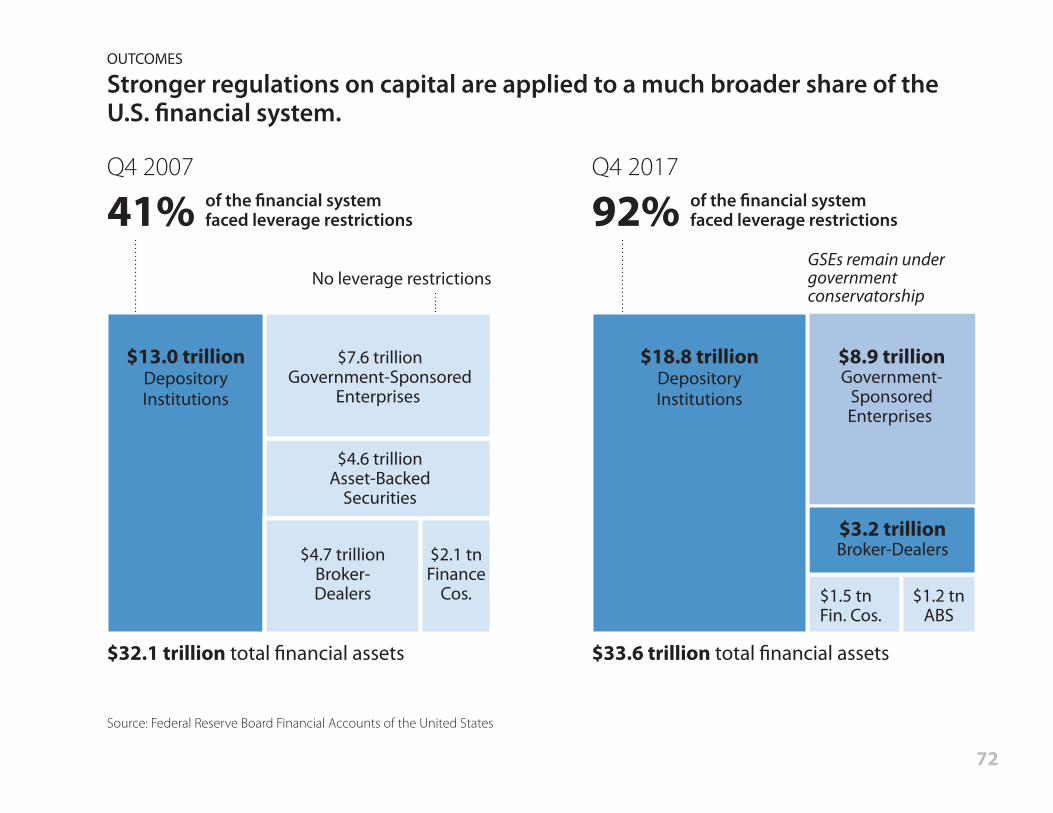
$32.1 trillion total !nancial assets $33.6 trillion total !nancial assets
GSEs remain undergovernmentconservatorship
OUTCOMES
Stronger regulations on capital are applied to a much broader share of the U.S. !nancial system.
Source: Federal Reserve Board Financial Accounts of the United States
$13.0 trillionDepositoryInstitutions
$18.8 trillionDepositoryInstitutions
$7.6 trillionGovernment-Sponsored
Enterprises
$8.9 trillionGovernment-
SponsoredEnterprises
$4.6 trillionAsset-Backed
Securities
$3.2 trillionBroker-Dealers
$1.2 tnABS
$1.5 tnFin. Cos.
$4.7 trillionBroker-Dealers
$2.1 tnFinance
Cos.
No leverage restrictions
Q4 2007
41% of the !nancial systemfaced leverage restrictions
Q4 2017
92% of the !nancial systemfaced leverage restrictions
72
OUTCOMES
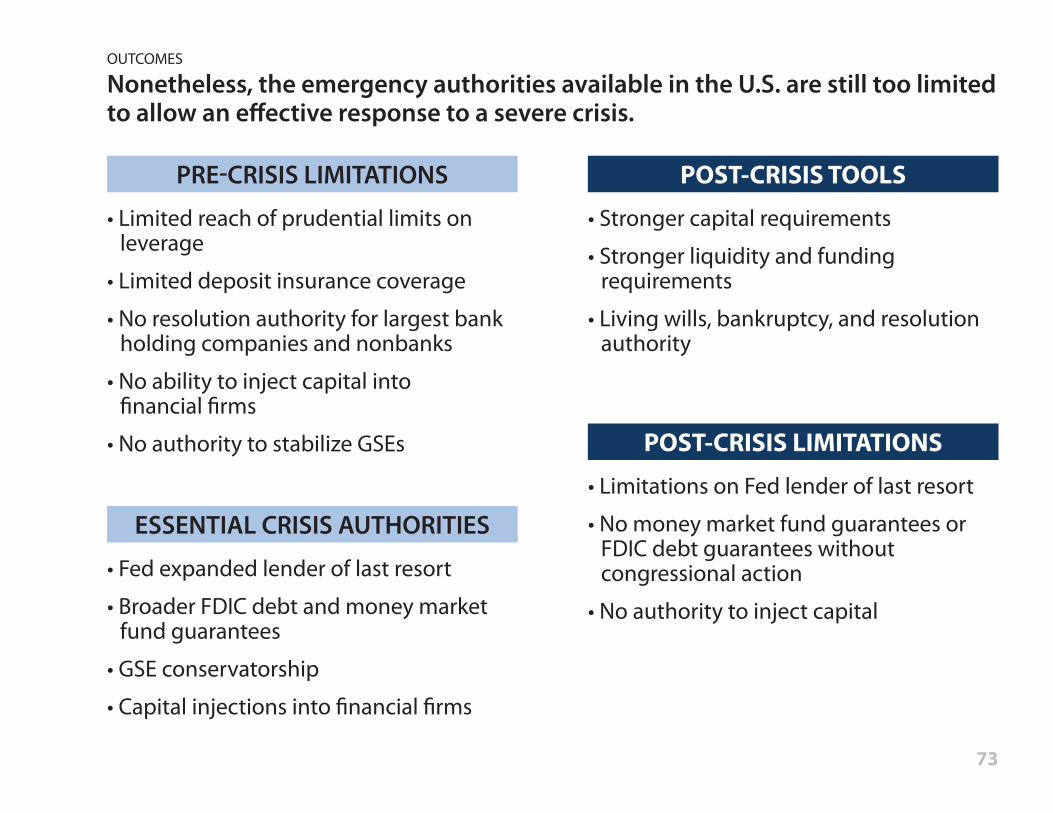
Nonetheless, the emergency authorities available in the U.S. are still too limited to allow an e!ective response to a severe crisis.
• Limited reach of prudential limits on leverage
• Limited deposit insurance coverage
• No resolution authority for largest bank holding companies and nonbanks
• No ability to inject capital into!nancial !rms
• No authority to stabilize GSEs
PRE"CRISIS LIMITATIONS
• Fed expanded lender of last resort
• Broader FDIC debt and money market fund guarantees
• GSE conservatorship
• Capital injections into !nancial !rms
ESSENTIAL CRISIS AUTHORITIES
• Stronger capital requirements
• Stronger liquidity and funding requirements
• Living wills, bankruptcy, and resolution authority
POST-CRISIS TOOLS
• Limitations on Fed lender of last resort
• No money market fund guarantees or FDIC debt guarantees without congressional action
• No authority to inject capital
POST-CRISIS LIMITATIONS
73
OUTCOMES
This was a terribly damaging crisis. It did not need to be so bad.
The damage illustrates the costs of running a !nancial system with weak oversight, and of going into a crisis without the essential tools for aggressive early action to prevent disaster.
The recovery was slow and fragile, made slower by the premature shift to tighter !scal policy.
Even after repairing the immediate damage, the U.S. economy still faces a number of longer-term challenges, with causes that predated the crisis.
74

ABCP asset-backed commercial paper
ABS asset-backed securities
AMLF Asset-Backed Commercial Paper Money Market Mutual Fund Liquidity Facility
CAP Capital Assistance Program
CDCI Community Development Capital Initiative
CDS credit default swaps
CET1 Common Equity Tier 1
CPFF Commercial Paper Funding Facility
CPP Capital Purchase Program
DGP Debt Guarantee Program
DIF Deposit Insurance Fund
EESA Emergency Economic Stabilization Act of 2008
FDIC Federal Deposit Insurance Corporation
FHA Federal Housing Administration
FHFA Federal Housing Finance Agency
GDP gross domestic product
GSEs government-sponsored enterprises
HAMP Home A!ordable Modi"cation Program
HARP Home A!ordable Re"nance Program
HUD U.S. Department of Housing and Urban Development
Libor-OIS London Interbank O!ered Rate–Overnight Indexed Swap rate
Acronyms
MBS mortgage-backed securities
MLEC Master Liquidity Enhancement Conduit
MMFs money market funds
NBER National Bureau of Economic Research
PDCF Primary Dealer Credit Facility
PPIP Public-Private Investment Program
QE Quantitative Easing
SAAR seasonally adjusted annual rate
SBA 7(a) Small Business Association Section 7(a) Securities Purchase Program
SCAP Supervisory Capital Assessment Program
SDR special drawing right
SPSPAs Senior Preferred Stock Purchase Agreements
TAF Term Auction Facility
TAGP Transaction Account Guarantee Program
TALF Term Asset-Backed Securities Loan Facility
TARP Troubled Assets Relief Program
TLGP Temporary Liquidity Guarantee Program
TSLF Term Securities Lending Facility
75

ABCP asset-backed commercial paper
ABS asset-backed securities
AMLF Asset-Backed Commercial Paper Money Market Mutual Fund Liquidity Facility
CAP Capital Assistance Program
CDCI Community Development Capital Initiative
CDS credit default swaps
CET1 Common Equity Tier 1
CPFF Commercial Paper Funding Facility
CPP Capital Purchase Program
DGP Debt Guarantee Program
DIF Deposit Insurance Fund
EESA Emergency Economic Stabilization Act of 2008
FDIC Federal Deposit Insurance Corporation
FHA Federal Housing Administration
FHFA Federal Housing Finance Agency
GDP gross domestic product
GSEs government-sponsored enterprises
HAMP Home A!ordable Modi"cation Program
HARP Home A!ordable Re"nance Program
HUD U.S. Department of Housing and Urban Development
Libor-OIS London Interbank O!ered Rate–Overnight Indexed Swap rate
MBS mortgage-backed securities
MLEC Master Liquidity Enhancement Conduit
MMFs money market funds
NBER National Bureau of Economic Research
PDCF Primary Dealer Credit Facility
PPIP Public-Private Investment Program
QE Quantitative Easing
SAAR seasonally adjusted annual rate
SBA 7(a) Small Business Association Section 7(a) Securities Purchase Program
SCAP Supervisory Capital Assessment Program
SDR special drawing right
SPSPAs Senior Preferred Stock Purchase Agreements
TAF Term Auction Facility
TAGP Transaction Account Guarantee Program
TALF Term Asset-Backed Securities Loan Facility
TARP Troubled Assets Relief Program
TLGP Temporary Liquidity Guarantee Program
TSLF Term Securities Lending Facility
Acronyms
76

This chart book was produced as part of an e!ort led by Ben S. Bernanke, Timothy F. Geithner,
and Henry M. Paulson, Jr., to examine the U.S. government’s interventions in the 2007–2009
"nancial crisis, a joint project of the Yale School of Management, Program on Financial
Stability, and the Brookings Institution, Hutchins Center on Fiscal and Monetary Policy.
Chart Book Project Advisers: Timothy F. Geithner and J. Nellie Liang
Editorial Director: Deborah McClellan
Chart Book Project Director: Eric Dash
Data Visualization: Seth W. Feaster
Lead Data Analyst: Ben HenkenData Analyst: Aidan Lawson
Acknowledgments
77

We wish to thank the following individuals and organizations:
Brookings/Hutchins: David Wessel, Director; Sage Belz, Je!rey Cheng, Vivien Lee, Michael Ng
Yale Program on Financial Stability: Andrew Metrick, Program Director; Alec Buchholtz, Anshu Chen, Greg Feldberg, Christian McNamara, Chase Ross, David Tam, Daniel Thompson, Rosalind Z. Wiggins
Golden Triangle Strategies: Monica Boyer, Emily Cincebeaux, Bill Marsh, Melissa Wohlgemuth
Others: Charlie Anderson, Matthew Anderson, Christie Baer, Michael S. Barr, James Egelhof, Jason Furman,Robert Jackson, Annabel Jouard, Katherine Korsak, Lorie Logan, Francis Mahoney, Vivek Manjunath,Drew McKinley, Patrick Parkinson, Wilson Powell III, Ernie Tedeschi
Data sources: Bloomberg Finance L.P.; the Center for Research in Security Prices at Chicago Booth; CoreLogic®, a property data and analytics company; Freddie Mac; Goldman Sachs; Haver Analytics;IHS Markit; iMoneyNet; Mortgage Bankers Association; Securities Industry and Financial Markets Association; SNL Financial; S&P Dow Jones Indices LLC; Standard & Poor’s; S&P® and S&P 500® are registered trademarks of Standard & Poor’s Financial Services LLC, and Dow Jones® is a registered trademark of Dow Jones Trademark Holdings LLC. © 2017 S&P Dow Jones Indices LLC, its a#liates and/or its licensors. All rights reserved; U.S. Dept. of Housing and Urban Development; Wharton Research Data Services (WRDS).
Acknowledgments
78

Additional data sources: Bureau of Economic Analysis; Bureau of Labor Statistics; Congressional Budget O#ce; Congressional Oversight Panel; Council of Economic Advisers; Federal Deposit Insurance Corp.; Federal Housing Finance Agency; Federal Reserve Bank of New York Financial Crisis Policy Response Timeline; Federal Reserve Bank of New York’s Research and Statistics Group; Federal Reserve Bank of Philadelphia; Federal Reserve Bank of St. Louis; Federal Reserve Bank of St. Louis Financial Crisis Policy Response Timeline; Federal Reserve Board; Federal Reserve Economic Data (FRED); International Monetary Fund; Macroeconomic Advisers®; Mishkin (1978); Organisation for Economic Co-operation and Development; U.S. Dept. of Treasury.
Acknowledgments
79
PAGE 5 Re-created with data underlying Figure 10, “The Distribution of Household Income, 2014,” Congressional Budget O!ce (2018), www.cbo.gov/publication/53597. See link for de"nitions of income and income groups.
PAGE 10 Based on Figure 3.1, U.S. home price and related data, Robert J. Shiller, Irrational Exuberance, 3rd ed. (Princeton, NJ: Princeton University Press, 2015), as updated by the author, www.econ.yale.edu/~shiller/data.htm.
PAGE 11 Based on Figure 1, Panel 1, Michael Ahn, Michael Batty, and Ralf Meisenzahl, “Household Debt-to-Income Ratios in the Enhanced Financial Accounts,” FEDS Notes (Washington, DC: Board of Governors of the Reserve System, January 11, 2018), https://doi.org/10.17016/2380-7172.2138.
PAGE 12 Based on Figure 4.1, Scott G. Alvarez, William Dudley, and J. Nellie Liang, “Nonbank Financial Institutions: New Vulnerabilities and Old Tools,” in Ben S. Bernanke, Timothy F. Geithner, and Henry M. Paulson, Jr., with J. Nellie Liang, eds., First Responders: Inside the U.S. Strategy for Fighting the 2007–2009 Global Financial Crisis (New Haven: Yale University Press, 2020).
PAGE 13 Based on Exhibit 1, Gary Gorton and Andrew Metrick, “Who Ran on Repo?” (2012), http://faculty.som.yale.edu/garygorton/documents/whorancompleteoctober4.pdf.
Banks’ portion includes net liabilities from federal funds agreements.
PAGE 28 Based on Figures 2.5 and 2.6, William English and Patricia Mosser, “The Use and E#ectiveness of Conventional Liquidity Tools Early in the Financial Crisis,” in Ben S. Bernanke, Timothy F. Geithner, and Henry M. Paulson, Jr., with J. Nellie Liang, eds. First Responders: Inside the U.S. Strategy for Fighting the 2007–2009 Global Financial Crisis (New Haven: Yale University Press, 2020).
Notes
PAGE 30 Based on Figure 3.7, Lorie Logan, William Nelson, and Patrick Parkinson, “The Fed’s Novel Lender of Last Resort Programs,” in Ben S. Bernanke, Timothy F. Geithner, and Henry M. Paulson, Jr., with J. Nellie Liang, eds., First Responders: Inside the U.S. Strategy for Fighting the 2007–2009 Global Financial Crisis (New Haven: Yale University Press, 2020).
PAGE 31 Based on Chart 5, Adam Ashcraft, Allan Malz, and Zoltan Pozsar, “The Federal Reserve’s Term Asset-Backed Securities Loan Facility,” Federal Reserve Bank of New York Economic Policy Review 18(3) (November 2012): 29-66, https://www.newyorkfed.org/medialibrary/media/research/epr/2012/EPRvol18n3.pdf.
PAGE 33 Based on Panel A, Lawrence Schmidt, Allan Timmermann, and Russ Wermers, “Runs on Money Market Mutual Funds,” American Economic Review 106(9) (2016): 2625–57, www.aeaweb.org/articles?id=10.1257/aer.20140678.
PAGE 34 Based on Slide 4, “Reforming Wall Street, Protecting Main Street,” U.S. Treasury, July 2012, www.treasury.gov/connect/blog/Documents/20120719_DFA_FINAL5.pdf.
PAGE 35 Commercial banks include depository institutions. Bank holding companies include bank holding companies, savings and loan holding companies, "nancial holding companies, and their funding a!liates. Nonbanks include nonbank entities and their a!liates, as well as bank holding companies with nonbank assets of nonbank subsidiaries comprising more than half of their total assets.
PAGE 41 Based on U.S. Treasury data and AIG infographic and timeline, www.treasury.gov/initiatives/"nancial-stability/TARP-Programs/aig/Pages/default.aspx.
PAGES 47, 48, 49 Based on Figure 16.3, Jason Furman, “The Fiscal Response to the Great Recession: Steps Taken, Paths Rejected, and Lessons for Next Time,” in Ben S. Bernanke, Timothy F. Geithner, and Henry M. Paulson, Jr., with J. Nellie Liang, eds., First Responders: Inside the U.S. Strategy for Fighting the 2007–2009 Global Financial Crisis (New Haven: Yale University Press, 2020).
PAGE 53 Monthly mortgage-related securities issuance "gures may not match annual "gures reported by the Securities Industry and Financial Markets Association on its website owing to a methodological di#erence in the reporting of each series.
PAGE 54 Based on the "gure “Mortgage Aid Extended More than 9.9 Million Times, Outpacing Foreclosures,” December 2016 Housing Scorecard, www.hud.gov/sites/documents/SCORECARD_2016_12_508C.PDF.
PAGE 56 Some home owners may have participated in more than one program; the sum of home owners helped across all categories does not necessarily re$ect the number of unique borrowers helped.
Based on Table 12.3, Michael Barr, Neel Kashkari, Andreas Lehnert, Phillip Swagel, “Crisis-Era Housing Programs,” in Ben S. Bernanke, Timothy F. Geithner, and Henry M. Paulson, Jr., with J. Nellie Liang, eds., First Responders: Inside the U.S. Strategy for Fighting the 2007–2009 Global Financial Crisis (New Haven: Yale University Press, 2020).
PAGE 58 Maximum commitments were taken from Table 2, Linda S. Goldberg, Craig Kennedy, and Jason Miu, “Central Bank Dollar Swap Lines and Overseas Dollar Funding Costs,” Federal Reserve Bank of New York Economic Policy Review 17(1) (May 2011): 3–20,www.newyorkfed.org/medialibrary/media/research/epr/11v17n1/1105gold.pdf.
PAGE 60 Based on Figure 17.9, Clay Lowery, Nathan Sheets, and Edwin (Ted) Truman, “International Coordination of Financial and Economic Policies,” in Ben S. Bernanke, Timothy F. Geithner, and Henry M. Paulson, Jr., with J. Nellie Liang, eds., First Responders: Inside the U.S. Strategy for Fighting the 2007–2009 Global Financial Crisis (New Haven: Yale University Press, 2020).
PAGE 62 The stock market (NYSE/AMEX/NASDAQ/ARCA) is measured by total market value as reported by the Center for Research in Security Prices and is shown to "nancial crisis trough. House prices are shown to three years after peak. Household wealth is a comparison between the change in the annual average (in nominal terms) of household wealth from 1929 to 1930, and the change in the nominal level of household wealth from Q1 2008 to Q1 2009.
Estimates of real household net worth (wealth) during the Great Depression were taken from Table 1, Frederic S. Mishkin, “The Household Balance Sheet and the Great Depression,” The Journal of Economic History 38(4) (December 1978): 918–37, www.jstor.org/stable/2118664.
PAGE 64 Guarantees: Re$ects the U.S. Treasury’s maximum commitments under the Temporary Guarantee Program for Money Market Funds and the FDIC’s maximum commitments under the two components of the Temporary Liquidity Guarantee Program, the Debt Guarantee Program, and the Transaction Account Guarantee Program.
Troubled Assets Relief Program (TARP): Re$ects principal outstanding for TARP programs including bank support programs, credit market programs, auto industry support, assistance to American International Group, and housing programs.
Federal Reserve Liquidity Programs: Re$ects loan amounts outstanding under credit and liquidity programs established the Federal Reserve Board. These include discount window lending (primary credit, secondary credit, and seasonal credit), term auction credit, the Primary Dealer Credit Facility, the Asset-Backed Commercial Paper Money Market Mutual Fund Liquidity Facility, the Term Asset-Backed Securities Loan Facility, the Commercial Paper Funding Facility, and central bank liquidity swaps. Also re$ects the value of outstanding securities lent through the Term Securities Lending Facility.
Other Programs: Re$ects the Federal Reserve, FDIC, and Treasury’s commitments under the Asset Guarantee Program; Federal Reserve Board assistance to Maiden Lane companies and support to American International Group; Treasury support for Fannie Mae and Freddie Mac through the senior preferred stock purchase agreements, as well as the face value of Treasury’s total mortgage-backed securities (MBS) portfolio at the end of each month, from October 2008-March 2012.
Exposures via Treasury’s Temporary Guarantee Program for Money Market Funds were taken from “Guarantees and Contingent Payments in TARP and Related Programs: Congressional Oversight Panel
November Oversight Report,” Congressional Oversight Panel (November 2009), https://fraser.stlouisfed.org/title/5018.
Based on Figure 18.5, J. Nellie Liang, Margaret M. McConnell, and Phillip Swagel, “Evidence on Outcomes,” in Ben S. Bernanke, Timothy F. Geithner, and Henry M. Paulson, Jr., with J. Nellie Liang, eds., First Responders: Inside the U.S. Strategy for Fighting the 2007–2009 Global Financial Crisis (New Haven: Yale University Press, 2020).
PAGE 69 Data for 63 "nancial crises in advanced economies, 1857 to 2013, were taken from Carmen Reinhart and Kenneth Rogo#, “Recovery from Financial Crises: Evidence from 100 Episodes,” American Economic Review: Papers & Proceedings 104(5) (2014): 50–55, https://scholar.harvard.edu/"les/rogo#/"les/aer_104-5_50-55.pdf.
Based on Figure 18.3, J. Nellie Liang, Margaret M. McConnell, and Phillip Swagel, “Evidence on Outcomes,” in Ben S. Bernanke, Timothy F. Geithner, and Henry M. Paulson, Jr., with J. Nellie Liang, eds., First Responders: Inside the U.S. Strategy for Fighting the 2007–2009 Global Financial Crisis (New Haven: Yale University Press, 2020).
PAGE 70 Based on Table 2 in Baird Webel and Marc Labonte, “Costs of Government Interventions in Response to the Financial Crisis: A Retrospective,” Congressional Research Service (updated September 2018), https://fas.org/sgp/crs/misc/R43413.pdf.
All "gures except otherwise noted are reported on a cash basis and as of Aug. 1, 2018. GSE debt purchases, DIF losses and cumulative income, and TAGP are as of Dec. 31, 2017; Maiden Lane is as of Jan. 31, 2018; and GSEs are as of Q2 2018.
PAGE 72 Depository institutions include U.S.-chartered depository institutions, foreign banking o!ces in the U.S., and credit unions.
80

PAGE 5 Re-created with data underlying Figure 10, “The Distribution of Household Income, 2014,” Congressional Budget O!ce (2018), www.cbo.gov/publication/53597. See link for de"nitions of income and income groups.
PAGE 10 Based on Figure 3.1, U.S. home price and related data, Robert J. Shiller, Irrational Exuberance, 3rd ed. (Princeton, NJ: Princeton University Press, 2015), as updated by the author, www.econ.yale.edu/~shiller/data.htm.
PAGE 11 Based on Figure 1, Panel 1, Michael Ahn, Michael Batty, and Ralf Meisenzahl, “Household Debt-to-Income Ratios in the Enhanced Financial Accounts,” FEDS Notes (Washington, DC: Board of Governors of the Reserve System, January 11, 2018), https://doi.org/10.17016/2380-7172.2138.
PAGE 12 Based on Figure 4.1, Scott G. Alvarez, William Dudley, and J. Nellie Liang, “Nonbank Financial Institutions: New Vulnerabilities and Old Tools,” in Ben S. Bernanke, Timothy F. Geithner, and Henry M. Paulson, Jr., with J. Nellie Liang, eds., First Responders: Inside the U.S. Strategy for Fighting the 2007–2009 Global Financial Crisis (New Haven: Yale University Press, 2020).
PAGE 13 Based on Exhibit 1, Gary Gorton and Andrew Metrick, “Who Ran on Repo?” (2012), http://faculty.som.yale.edu/garygorton/documents/whorancompleteoctober4.pdf.
Banks’ portion includes net liabilities from federal funds agreements.
PAGE 28 Based on Figures 2.5 and 2.6, William English and Patricia Mosser, “The Use and E#ectiveness of Conventional Liquidity Tools Early in the Financial Crisis,” in Ben S. Bernanke, Timothy F. Geithner, and Henry M. Paulson, Jr., with J. Nellie Liang, eds. First Responders: Inside the U.S. Strategy for Fighting the 2007–2009 Global Financial Crisis (New Haven: Yale University Press, 2020).
PAGE 30 Based on Figure 3.7, Lorie Logan, William Nelson, and Patrick Parkinson, “The Fed’s Novel Lender of Last Resort Programs,” in Ben S. Bernanke, Timothy F. Geithner, and Henry M. Paulson, Jr., with J. Nellie Liang, eds., First Responders: Inside the U.S. Strategy for Fighting the 2007–2009 Global Financial Crisis (New Haven: Yale University Press, 2020).
PAGE 31 Based on Chart 5, Adam Ashcraft, Allan Malz, and Zoltan Pozsar, “The Federal Reserve’s Term Asset-Backed Securities Loan Facility,” Federal Reserve Bank of New York Economic Policy Review 18(3) (November 2012): 29-66, https://www.newyorkfed.org/medialibrary/media/research/epr/2012/EPRvol18n3.pdf.
PAGE 33 Based on Panel A, Lawrence Schmidt, Allan Timmermann, and Russ Wermers, “Runs on Money Market Mutual Funds,” American Economic Review 106(9) (2016): 2625–57, www.aeaweb.org/articles?id=10.1257/aer.20140678.
PAGE 34 Based on Slide 4, “Reforming Wall Street, Protecting Main Street,” U.S. Treasury, July 2012, www.treasury.gov/connect/blog/Documents/20120719_DFA_FINAL5.pdf.
PAGE 35 Commercial banks include depository institutions. Bank holding companies include bank holding companies, savings and loan holding companies, "nancial holding companies, and their funding a!liates. Nonbanks include nonbank entities and their a!liates, as well as bank holding companies with nonbank assets of nonbank subsidiaries comprising more than half of their total assets.
PAGE 41 Based on U.S. Treasury data and AIG infographic and timeline, www.treasury.gov/initiatives/"nancial-stability/TARP-Programs/aig/Pages/default.aspx.
PAGES 47, 48, 49 Based on Figure 16.3, Jason Furman, “The Fiscal Response to the Great Recession: Steps Taken, Paths Rejected, and Lessons for Next Time,” in Ben S. Bernanke, Timothy F. Geithner, and Henry M. Paulson, Jr., with J. Nellie Liang, eds., First Responders: Inside the U.S. Strategy for Fighting the 2007–2009 Global Financial Crisis (New Haven: Yale University Press, 2020).
Notes
PAGE 53 Monthly mortgage-related securities issuance "gures may not match annual "gures reported by the Securities Industry and Financial Markets Association on its website owing to a methodological di#erence in the reporting of each series.
PAGE 54 Based on the "gure “Mortgage Aid Extended More than 9.9 Million Times, Outpacing Foreclosures,” December 2016 Housing Scorecard, www.hud.gov/sites/documents/SCORECARD_2016_12_508C.PDF.
PAGE 56 Some home owners may have participated in more than one program; the sum of home owners helped across all categories does not necessarily re$ect the number of unique borrowers helped.
Based on Table 12.3, Michael Barr, Neel Kashkari, Andreas Lehnert, Phillip Swagel, “Crisis-Era Housing Programs,” in Ben S. Bernanke, Timothy F. Geithner, and Henry M. Paulson, Jr., with J. Nellie Liang, eds., First Responders: Inside the U.S. Strategy for Fighting the 2007–2009 Global Financial Crisis (New Haven: Yale University Press, 2020).
PAGE 58 Maximum commitments were taken from Table 2, Linda S. Goldberg, Craig Kennedy, and Jason Miu, “Central Bank Dollar Swap Lines and Overseas Dollar Funding Costs,” Federal Reserve Bank of New York Economic Policy Review 17(1) (May 2011): 3–20,www.newyorkfed.org/medialibrary/media/research/epr/11v17n1/1105gold.pdf.
PAGE 60 Based on Figure 17.9, Clay Lowery, Nathan Sheets, and Edwin (Ted) Truman, “International Coordination of Financial and Economic Policies,” in Ben S. Bernanke, Timothy F. Geithner, and Henry M. Paulson, Jr., with J. Nellie Liang, eds., First Responders: Inside the U.S. Strategy for Fighting the 2007–2009 Global Financial Crisis (New Haven: Yale University Press, 2020).
PAGE 62 The stock market (NYSE/AMEX/NASDAQ/ARCA) is measured by total market value as reported by the Center for Research in Security Prices and is shown to "nancial crisis trough. House prices are shown to three years after peak. Household wealth is a comparison between the change in the annual average (in nominal terms) of household wealth from 1929 to 1930, and the change in the nominal level of household wealth from Q1 2008 to Q1 2009.
Estimates of real household net worth (wealth) during the Great Depression were taken from Table 1, Frederic S. Mishkin, “The Household Balance Sheet and the Great Depression,” The Journal of Economic History 38(4) (December 1978): 918–37, www.jstor.org/stable/2118664.
PAGE 64 Guarantees: Re$ects the U.S. Treasury’s maximum commitments under the Temporary Guarantee Program for Money Market Funds and the FDIC’s maximum commitments under the two components of the Temporary Liquidity Guarantee Program, the Debt Guarantee Program, and the Transaction Account Guarantee Program.
Troubled Assets Relief Program (TARP): Re$ects principal outstanding for TARP programs including bank support programs, credit market programs, auto industry support, assistance to American International Group, and housing programs.
Federal Reserve Liquidity Programs: Re$ects loan amounts outstanding under credit and liquidity programs established the Federal Reserve Board. These include discount window lending (primary credit, secondary credit, and seasonal credit), term auction credit, the Primary Dealer Credit Facility, the Asset-Backed Commercial Paper Money Market Mutual Fund Liquidity Facility, the Term Asset-Backed Securities Loan Facility, the Commercial Paper Funding Facility, and central bank liquidity swaps. Also re$ects the value of outstanding securities lent through the Term Securities Lending Facility.
Other Programs: Re$ects the Federal Reserve, FDIC, and Treasury’s commitments under the Asset Guarantee Program; Federal Reserve Board assistance to Maiden Lane companies and support to American International Group; Treasury support for Fannie Mae and Freddie Mac through the senior preferred stock purchase agreements, as well as the face value of Treasury’s total mortgage-backed securities (MBS) portfolio at the end of each month, from October 2008-March 2012.
Exposures via Treasury’s Temporary Guarantee Program for Money Market Funds were taken from “Guarantees and Contingent Payments in TARP and Related Programs: Congressional Oversight Panel
November Oversight Report,” Congressional Oversight Panel (November 2009), https://fraser.stlouisfed.org/title/5018.
Based on Figure 18.5, J. Nellie Liang, Margaret M. McConnell, and Phillip Swagel, “Evidence on Outcomes,” in Ben S. Bernanke, Timothy F. Geithner, and Henry M. Paulson, Jr., with J. Nellie Liang, eds., First Responders: Inside the U.S. Strategy for Fighting the 2007–2009 Global Financial Crisis (New Haven: Yale University Press, 2020).
PAGE 69 Data for 63 "nancial crises in advanced economies, 1857 to 2013, were taken from Carmen Reinhart and Kenneth Rogo#, “Recovery from Financial Crises: Evidence from 100 Episodes,” American Economic Review: Papers & Proceedings 104(5) (2014): 50–55, https://scholar.harvard.edu/"les/rogo#/"les/aer_104-5_50-55.pdf.
Based on Figure 18.3, J. Nellie Liang, Margaret M. McConnell, and Phillip Swagel, “Evidence on Outcomes,” in Ben S. Bernanke, Timothy F. Geithner, and Henry M. Paulson, Jr., with J. Nellie Liang, eds., First Responders: Inside the U.S. Strategy for Fighting the 2007–2009 Global Financial Crisis (New Haven: Yale University Press, 2020).
PAGE 70 Based on Table 2 in Baird Webel and Marc Labonte, “Costs of Government Interventions in Response to the Financial Crisis: A Retrospective,” Congressional Research Service (updated September 2018), https://fas.org/sgp/crs/misc/R43413.pdf.
All "gures except otherwise noted are reported on a cash basis and as of Aug. 1, 2018. GSE debt purchases, DIF losses and cumulative income, and TAGP are as of Dec. 31, 2017; Maiden Lane is as of Jan. 31, 2018; and GSEs are as of Q2 2018.
PAGE 72 Depository institutions include U.S.-chartered depository institutions, foreign banking o!ces in the U.S., and credit unions.
81

PAGE 5 Re-created with data underlying Figure 10, “The Distribution of Household Income, 2014,” Congressional Budget O!ce (2018), www.cbo.gov/publication/53597. See link for de"nitions of income and income groups.
PAGE 10 Based on Figure 3.1, U.S. home price and related data, Robert J. Shiller, Irrational Exuberance, 3rd ed. (Princeton, NJ: Princeton University Press, 2015), as updated by the author, www.econ.yale.edu/~shiller/data.htm.
PAGE 11 Based on Figure 1, Panel 1, Michael Ahn, Michael Batty, and Ralf Meisenzahl, “Household Debt-to-Income Ratios in the Enhanced Financial Accounts,” FEDS Notes (Washington, DC: Board of Governors of the Reserve System, January 11, 2018), https://doi.org/10.17016/2380-7172.2138.
PAGE 12 Based on Figure 4.1, Scott G. Alvarez, William Dudley, and J. Nellie Liang, “Nonbank Financial Institutions: New Vulnerabilities and Old Tools,” in Ben S. Bernanke, Timothy F. Geithner, and Henry M. Paulson, Jr., with J. Nellie Liang, eds., First Responders: Inside the U.S. Strategy for Fighting the 2007–2009 Global Financial Crisis (New Haven: Yale University Press, 2020).
PAGE 13 Based on Exhibit 1, Gary Gorton and Andrew Metrick, “Who Ran on Repo?” (2012), http://faculty.som.yale.edu/garygorton/documents/whorancompleteoctober4.pdf.
Banks’ portion includes net liabilities from federal funds agreements.
PAGE 28 Based on Figures 2.5 and 2.6, William English and Patricia Mosser, “The Use and E#ectiveness of Conventional Liquidity Tools Early in the Financial Crisis,” in Ben S. Bernanke, Timothy F. Geithner, and Henry M. Paulson, Jr., with J. Nellie Liang, eds. First Responders: Inside the U.S. Strategy for Fighting the 2007–2009 Global Financial Crisis (New Haven: Yale University Press, 2020).
PAGE 30 Based on Figure 3.7, Lorie Logan, William Nelson, and Patrick Parkinson, “The Fed’s Novel Lender of Last Resort Programs,” in Ben S. Bernanke, Timothy F. Geithner, and Henry M. Paulson, Jr., with J. Nellie Liang, eds., First Responders: Inside the U.S. Strategy for Fighting the 2007–2009 Global Financial Crisis (New Haven: Yale University Press, 2020).
PAGE 31 Based on Chart 5, Adam Ashcraft, Allan Malz, and Zoltan Pozsar, “The Federal Reserve’s Term Asset-Backed Securities Loan Facility,” Federal Reserve Bank of New York Economic Policy Review 18(3) (November 2012): 29-66, https://www.newyorkfed.org/medialibrary/media/research/epr/2012/EPRvol18n3.pdf.
PAGE 33 Based on Panel A, Lawrence Schmidt, Allan Timmermann, and Russ Wermers, “Runs on Money Market Mutual Funds,” American Economic Review 106(9) (2016): 2625–57, www.aeaweb.org/articles?id=10.1257/aer.20140678.
PAGE 34 Based on Slide 4, “Reforming Wall Street, Protecting Main Street,” U.S. Treasury, July 2012, www.treasury.gov/connect/blog/Documents/20120719_DFA_FINAL5.pdf.
PAGE 35 Commercial banks include depository institutions. Bank holding companies include bank holding companies, savings and loan holding companies, "nancial holding companies, and their funding a!liates. Nonbanks include nonbank entities and their a!liates, as well as bank holding companies with nonbank assets of nonbank subsidiaries comprising more than half of their total assets.
PAGE 41 Based on U.S. Treasury data and AIG infographic and timeline, www.treasury.gov/initiatives/"nancial-stability/TARP-Programs/aig/Pages/default.aspx.
PAGES 47, 48, 49 Based on Figure 16.3, Jason Furman, “The Fiscal Response to the Great Recession: Steps Taken, Paths Rejected, and Lessons for Next Time,” in Ben S. Bernanke, Timothy F. Geithner, and Henry M. Paulson, Jr., with J. Nellie Liang, eds., First Responders: Inside the U.S. Strategy for Fighting the 2007–2009 Global Financial Crisis (New Haven: Yale University Press, 2020).
PAGE 53 Monthly mortgage-related securities issuance "gures may not match annual "gures reported by the Securities Industry and Financial Markets Association on its website owing to a methodological di#erence in the reporting of each series.
PAGE 54 Based on the "gure “Mortgage Aid Extended More than 9.9 Million Times, Outpacing Foreclosures,” December 2016 Housing Scorecard, www.hud.gov/sites/documents/SCORECARD_2016_12_508C.PDF.
PAGE 56 Some home owners may have participated in more than one program; the sum of home owners helped across all categories does not necessarily re$ect the number of unique borrowers helped.
Based on Table 12.3, Michael Barr, Neel Kashkari, Andreas Lehnert, Phillip Swagel, “Crisis-Era Housing Programs,” in Ben S. Bernanke, Timothy F. Geithner, and Henry M. Paulson, Jr., with J. Nellie Liang, eds., First Responders: Inside the U.S. Strategy for Fighting the 2007–2009 Global Financial Crisis (New Haven: Yale University Press, 2020).
PAGE 58 Maximum commitments were taken from Table 2, Linda S. Goldberg, Craig Kennedy, and Jason Miu, “Central Bank Dollar Swap Lines and Overseas Dollar Funding Costs,” Federal Reserve Bank of New York Economic Policy Review 17(1) (May 2011): 3–20,www.newyorkfed.org/medialibrary/media/research/epr/11v17n1/1105gold.pdf.
PAGE 60 Based on Figure 17.9, Clay Lowery, Nathan Sheets, and Edwin (Ted) Truman, “International Coordination of Financial and Economic Policies,” in Ben S. Bernanke, Timothy F. Geithner, and Henry M. Paulson, Jr., with J. Nellie Liang, eds., First Responders: Inside the U.S. Strategy for Fighting the 2007–2009 Global Financial Crisis (New Haven: Yale University Press, 2020).
PAGE 62 The stock market (NYSE/AMEX/NASDAQ/ARCA) is measured by total market value as reported by the Center for Research in Security Prices and is shown to "nancial crisis trough. House prices are shown to three years after peak. Household wealth is a comparison between the change in the annual average (in nominal terms) of household wealth from 1929 to 1930, and the change in the nominal level of household wealth from Q1 2008 to Q1 2009.
Notes
Estimates of real household net worth (wealth) during the Great Depression were taken from Table 1, Frederic S. Mishkin, “The Household Balance Sheet and the Great Depression,” The Journal of Economic History 38(4) (December 1978): 918–37, www.jstor.org/stable/2118664.
PAGE 64 Guarantees: Re$ects the U.S. Treasury’s maximum commitments under the Temporary Guarantee Program for Money Market Funds and the FDIC’s maximum commitments under the two components of the Temporary Liquidity Guarantee Program, the Debt Guarantee Program, and the Transaction Account Guarantee Program.
Troubled Assets Relief Program (TARP): Re$ects principal outstanding for TARP programs including bank support programs, credit market programs, auto industry support, assistance to American International Group, and housing programs.
Federal Reserve Liquidity Programs: Re$ects loan amounts outstanding under credit and liquidity programs established the Federal Reserve Board. These include discount window lending (primary credit, secondary credit, and seasonal credit), term auction credit, the Primary Dealer Credit Facility, the Asset-Backed Commercial Paper Money Market Mutual Fund Liquidity Facility, the Term Asset-Backed Securities Loan Facility, the Commercial Paper Funding Facility, and central bank liquidity swaps. Also re$ects the value of outstanding securities lent through the Term Securities Lending Facility.
Other Programs: Re$ects the Federal Reserve, FDIC, and Treasury’s commitments under the Asset Guarantee Program; Federal Reserve Board assistance to Maiden Lane companies and support to American International Group; Treasury support for Fannie Mae and Freddie Mac through the senior preferred stock purchase agreements, as well as the face value of Treasury’s total mortgage-backed securities (MBS) portfolio at the end of each month, from October 2008-March 2012.
Exposures via Treasury’s Temporary Guarantee Program for Money Market Funds were taken from “Guarantees and Contingent Payments in TARP and Related Programs: Congressional Oversight Panel
November Oversight Report,” Congressional Oversight Panel (November 2009), https://fraser.stlouisfed.org/title/5018.
Based on Figure 18.5, J. Nellie Liang, Margaret M. McConnell, and Phillip Swagel, “Evidence on Outcomes,” in Ben S. Bernanke, Timothy F. Geithner, and Henry M. Paulson, Jr., with J. Nellie Liang, eds., First Responders: Inside the U.S. Strategy for Fighting the 2007–2009 Global Financial Crisis (New Haven: Yale University Press, 2020).
PAGE 69 Data for 63 "nancial crises in advanced economies, 1857 to 2013, were taken from Carmen Reinhart and Kenneth Rogo#, “Recovery from Financial Crises: Evidence from 100 Episodes,” American Economic Review: Papers & Proceedings 104(5) (2014): 50–55, https://scholar.harvard.edu/"les/rogo#/"les/aer_104-5_50-55.pdf.
Based on Figure 18.3, J. Nellie Liang, Margaret M. McConnell, and Phillip Swagel, “Evidence on Outcomes,” in Ben S. Bernanke, Timothy F. Geithner, and Henry M. Paulson, Jr., with J. Nellie Liang, eds., First Responders: Inside the U.S. Strategy for Fighting the 2007–2009 Global Financial Crisis (New Haven: Yale University Press, 2020).
PAGE 70 Based on Table 2 in Baird Webel and Marc Labonte, “Costs of Government Interventions in Response to the Financial Crisis: A Retrospective,” Congressional Research Service (updated September 2018), https://fas.org/sgp/crs/misc/R43413.pdf.
All "gures except otherwise noted are reported on a cash basis and as of Aug. 1, 2018. GSE debt purchases, DIF losses and cumulative income, and TAGP are as of Dec. 31, 2017; Maiden Lane is as of Jan. 31, 2018; and GSEs are as of Q2 2018.
PAGE 72 Depository institutions include U.S.-chartered depository institutions, foreign banking o!ces in the U.S., and credit unions.
82

PAGE 5 Re-created with data underlying Figure 10, “The Distribution of Household Income, 2014,” Congressional Budget O!ce (2018), www.cbo.gov/publication/53597. See link for de"nitions of income and income groups.
PAGE 10 Based on Figure 3.1, U.S. home price and related data, Robert J. Shiller, Irrational Exuberance, 3rd ed. (Princeton, NJ: Princeton University Press, 2015), as updated by the author, www.econ.yale.edu/~shiller/data.htm.
PAGE 11 Based on Figure 1, Panel 1, Michael Ahn, Michael Batty, and Ralf Meisenzahl, “Household Debt-to-Income Ratios in the Enhanced Financial Accounts,” FEDS Notes (Washington, DC: Board of Governors of the Reserve System, January 11, 2018), https://doi.org/10.17016/2380-7172.2138.
PAGE 12 Based on Figure 4.1, Scott G. Alvarez, William Dudley, and J. Nellie Liang, “Nonbank Financial Institutions: New Vulnerabilities and Old Tools,” in Ben S. Bernanke, Timothy F. Geithner, and Henry M. Paulson, Jr., with J. Nellie Liang, eds., First Responders: Inside the U.S. Strategy for Fighting the 2007–2009 Global Financial Crisis (New Haven: Yale University Press, 2020).
PAGE 13 Based on Exhibit 1, Gary Gorton and Andrew Metrick, “Who Ran on Repo?” (2012), http://faculty.som.yale.edu/garygorton/documents/whorancompleteoctober4.pdf.
Banks’ portion includes net liabilities from federal funds agreements.
PAGE 28 Based on Figures 2.5 and 2.6, William English and Patricia Mosser, “The Use and E#ectiveness of Conventional Liquidity Tools Early in the Financial Crisis,” in Ben S. Bernanke, Timothy F. Geithner, and Henry M. Paulson, Jr., with J. Nellie Liang, eds. First Responders: Inside the U.S. Strategy for Fighting the 2007–2009 Global Financial Crisis (New Haven: Yale University Press, 2020).
PAGE 30 Based on Figure 3.7, Lorie Logan, William Nelson, and Patrick Parkinson, “The Fed’s Novel Lender of Last Resort Programs,” in Ben S. Bernanke, Timothy F. Geithner, and Henry M. Paulson, Jr., with J. Nellie Liang, eds., First Responders: Inside the U.S. Strategy for Fighting the 2007–2009 Global Financial Crisis (New Haven: Yale University Press, 2020).
PAGE 31 Based on Chart 5, Adam Ashcraft, Allan Malz, and Zoltan Pozsar, “The Federal Reserve’s Term Asset-Backed Securities Loan Facility,” Federal Reserve Bank of New York Economic Policy Review 18(3) (November 2012): 29-66, https://www.newyorkfed.org/medialibrary/media/research/epr/2012/EPRvol18n3.pdf.
PAGE 33 Based on Panel A, Lawrence Schmidt, Allan Timmermann, and Russ Wermers, “Runs on Money Market Mutual Funds,” American Economic Review 106(9) (2016): 2625–57, www.aeaweb.org/articles?id=10.1257/aer.20140678.
PAGE 34 Based on Slide 4, “Reforming Wall Street, Protecting Main Street,” U.S. Treasury, July 2012, www.treasury.gov/connect/blog/Documents/20120719_DFA_FINAL5.pdf.
PAGE 35 Commercial banks include depository institutions. Bank holding companies include bank holding companies, savings and loan holding companies, "nancial holding companies, and their funding a!liates. Nonbanks include nonbank entities and their a!liates, as well as bank holding companies with nonbank assets of nonbank subsidiaries comprising more than half of their total assets.
PAGE 41 Based on U.S. Treasury data and AIG infographic and timeline, www.treasury.gov/initiatives/"nancial-stability/TARP-Programs/aig/Pages/default.aspx.
PAGES 47, 48, 49 Based on Figure 16.3, Jason Furman, “The Fiscal Response to the Great Recession: Steps Taken, Paths Rejected, and Lessons for Next Time,” in Ben S. Bernanke, Timothy F. Geithner, and Henry M. Paulson, Jr., with J. Nellie Liang, eds., First Responders: Inside the U.S. Strategy for Fighting the 2007–2009 Global Financial Crisis (New Haven: Yale University Press, 2020).
PAGE 53 Monthly mortgage-related securities issuance "gures may not match annual "gures reported by the Securities Industry and Financial Markets Association on its website owing to a methodological di#erence in the reporting of each series.
PAGE 54 Based on the "gure “Mortgage Aid Extended More than 9.9 Million Times, Outpacing Foreclosures,” December 2016 Housing Scorecard, www.hud.gov/sites/documents/SCORECARD_2016_12_508C.PDF.
PAGE 56 Some home owners may have participated in more than one program; the sum of home owners helped across all categories does not necessarily re$ect the number of unique borrowers helped.
Based on Table 12.3, Michael Barr, Neel Kashkari, Andreas Lehnert, Phillip Swagel, “Crisis-Era Housing Programs,” in Ben S. Bernanke, Timothy F. Geithner, and Henry M. Paulson, Jr., with J. Nellie Liang, eds., First Responders: Inside the U.S. Strategy for Fighting the 2007–2009 Global Financial Crisis (New Haven: Yale University Press, 2020).
PAGE 58 Maximum commitments were taken from Table 2, Linda S. Goldberg, Craig Kennedy, and Jason Miu, “Central Bank Dollar Swap Lines and Overseas Dollar Funding Costs,” Federal Reserve Bank of New York Economic Policy Review 17(1) (May 2011): 3–20,www.newyorkfed.org/medialibrary/media/research/epr/11v17n1/1105gold.pdf.
PAGE 60 Based on Figure 17.9, Clay Lowery, Nathan Sheets, and Edwin (Ted) Truman, “International Coordination of Financial and Economic Policies,” in Ben S. Bernanke, Timothy F. Geithner, and Henry M. Paulson, Jr., with J. Nellie Liang, eds., First Responders: Inside the U.S. Strategy for Fighting the 2007–2009 Global Financial Crisis (New Haven: Yale University Press, 2020).
PAGE 62 The stock market (NYSE/AMEX/NASDAQ/ARCA) is measured by total market value as reported by the Center for Research in Security Prices and is shown to "nancial crisis trough. House prices are shown to three years after peak. Household wealth is a comparison between the change in the annual average (in nominal terms) of household wealth from 1929 to 1930, and the change in the nominal level of household wealth from Q1 2008 to Q1 2009.
Estimates of real household net worth (wealth) during the Great Depression were taken from Table 1, Frederic S. Mishkin, “The Household Balance Sheet and the Great Depression,” The Journal of Economic History 38(4) (December 1978): 918–37, www.jstor.org/stable/2118664.
PAGE 64 Guarantees: Re$ects the U.S. Treasury’s maximum commitments under the Temporary Guarantee Program for Money Market Funds and the FDIC’s maximum commitments under the two components of the Temporary Liquidity Guarantee Program, the Debt Guarantee Program, and the Transaction Account Guarantee Program.
Troubled Assets Relief Program (TARP): Re$ects principal outstanding for TARP programs including bank support programs, credit market programs, auto industry support, assistance to American International Group, and housing programs.
Federal Reserve Liquidity Programs: Re$ects loan amounts outstanding under credit and liquidity programs established the Federal Reserve Board. These include discount window lending (primary credit, secondary credit, and seasonal credit), term auction credit, the Primary Dealer Credit Facility, the Asset-Backed Commercial Paper Money Market Mutual Fund Liquidity Facility, the Term Asset-Backed Securities Loan Facility, the Commercial Paper Funding Facility, and central bank liquidity swaps. Also re$ects the value of outstanding securities lent through the Term Securities Lending Facility.
Other Programs: Re$ects the Federal Reserve, FDIC, and Treasury’s commitments under the Asset Guarantee Program; Federal Reserve Board assistance to Maiden Lane companies and support to American International Group; Treasury support for Fannie Mae and Freddie Mac through the senior preferred stock purchase agreements, as well as the face value of Treasury’s total mortgage-backed securities (MBS) portfolio at the end of each month, from October 2008-March 2012.
Exposures via Treasury’s Temporary Guarantee Program for Money Market Funds were taken from “Guarantees and Contingent Payments in TARP and Related Programs: Congressional Oversight Panel
Notes
November Oversight Report,” Congressional Oversight Panel (November 2009), https://fraser.stlouisfed.org/title/5018.
Based on Figure 18.5, J. Nellie Liang, Margaret M. McConnell, and Phillip Swagel, “Evidence on Outcomes,” in Ben S. Bernanke, Timothy F. Geithner, and Henry M. Paulson, Jr., with J. Nellie Liang, eds., First Responders: Inside the U.S. Strategy for Fighting the 2007–2009 Global Financial Crisis (New Haven: Yale University Press, 2020).
PAGE 69 Data for 63 "nancial crises in advanced economies, 1857 to 2013, were taken from Carmen Reinhart and Kenneth Rogo#, “Recovery from Financial Crises: Evidence from 100 Episodes,” American Economic Review: Papers & Proceedings 104(5) (2014): 50–55, https://scholar.harvard.edu/"les/rogo#/"les/aer_104-5_50-55.pdf.
Based on Figure 18.3, J. Nellie Liang, Margaret M. McConnell, and Phillip Swagel, “Evidence on Outcomes,” in Ben S. Bernanke, Timothy F. Geithner, and Henry M. Paulson, Jr., with J. Nellie Liang, eds., First Responders: Inside the U.S. Strategy for Fighting the 2007–2009 Global Financial Crisis (New Haven: Yale University Press, 2020).
PAGE 70 Based on Table 2 in Baird Webel and Marc Labonte, “Costs of Government Interventions in Response to the Financial Crisis: A Retrospective,” Congressional Research Service (updated September 2018), https://fas.org/sgp/crs/misc/R43413.pdf.
All "gures except otherwise noted are reported on a cash basis and as of Aug. 1, 2018. GSE debt purchases, DIF losses and cumulative income, and TAGP are as of Dec. 31, 2017; Maiden Lane is as of Jan. 31, 2018; and GSEs are as of Q2 2018.
PAGE 72 Depository institutions include U.S.-chartered depository institutions, foreign banking o!ces in the U.S., and credit unions.
83
PAGE 5 Re-created with data underlying Figure 10, “The Distribution of Household Income, 2014,” Congressional Budget O!ce (2018), www.cbo.gov/publication/53597. See link for de"nitions of income and income groups.
PAGE 10 Based on Figure 3.1, U.S. home price and related data, Robert J. Shiller, Irrational Exuberance, 3rd ed. (Princeton, NJ: Princeton University Press, 2015), as updated by the author, www.econ.yale.edu/~shiller/data.htm.
PAGE 11 Based on Figure 1, Panel 1, Michael Ahn, Michael Batty, and Ralf Meisenzahl, “Household Debt-to-Income Ratios in the Enhanced Financial Accounts,” FEDS Notes (Washington, DC: Board of Governors of the Reserve System, January 11, 2018), https://doi.org/10.17016/2380-7172.2138.
PAGE 12 Based on Figure 4.1, Scott G. Alvarez, William Dudley, and J. Nellie Liang, “Nonbank Financial Institutions: New Vulnerabilities and Old Tools,” in Ben S. Bernanke, Timothy F. Geithner, and Henry M. Paulson, Jr., with J. Nellie Liang, eds., First Responders: Inside the U.S. Strategy for Fighting the 2007–2009 Global Financial Crisis (New Haven: Yale University Press, 2020).
PAGE 13 Based on Exhibit 1, Gary Gorton and Andrew Metrick, “Who Ran on Repo?” (2012), http://faculty.som.yale.edu/garygorton/documents/whorancompleteoctober4.pdf.
Banks’ portion includes net liabilities from federal funds agreements.
PAGE 28 Based on Figures 2.5 and 2.6, William English and Patricia Mosser, “The Use and E#ectiveness of Conventional Liquidity Tools Early in the Financial Crisis,” in Ben S. Bernanke, Timothy F. Geithner, and Henry M. Paulson, Jr., with J. Nellie Liang, eds. First Responders: Inside the U.S. Strategy for Fighting the 2007–2009 Global Financial Crisis (New Haven: Yale University Press, 2020).
PAGE 30 Based on Figure 3.7, Lorie Logan, William Nelson, and Patrick Parkinson, “The Fed’s Novel Lender of Last Resort Programs,” in Ben S. Bernanke, Timothy F. Geithner, and Henry M. Paulson, Jr., with J. Nellie Liang, eds., First Responders: Inside the U.S. Strategy for Fighting the 2007–2009 Global Financial Crisis (New Haven: Yale University Press, 2020).
PAGE 31 Based on Chart 5, Adam Ashcraft, Allan Malz, and Zoltan Pozsar, “The Federal Reserve’s Term Asset-Backed Securities Loan Facility,” Federal Reserve Bank of New York Economic Policy Review 18(3) (November 2012): 29-66, https://www.newyorkfed.org/medialibrary/media/research/epr/2012/EPRvol18n3.pdf.
PAGE 33 Based on Panel A, Lawrence Schmidt, Allan Timmermann, and Russ Wermers, “Runs on Money Market Mutual Funds,” American Economic Review 106(9) (2016): 2625–57, www.aeaweb.org/articles?id=10.1257/aer.20140678.
PAGE 34 Based on Slide 4, “Reforming Wall Street, Protecting Main Street,” U.S. Treasury, July 2012, www.treasury.gov/connect/blog/Documents/20120719_DFA_FINAL5.pdf.
PAGE 35 Commercial banks include depository institutions. Bank holding companies include bank holding companies, savings and loan holding companies, "nancial holding companies, and their funding a!liates. Nonbanks include nonbank entities and their a!liates, as well as bank holding companies with nonbank assets of nonbank subsidiaries comprising more than half of their total assets.
PAGE 41 Based on U.S. Treasury data and AIG infographic and timeline, www.treasury.gov/initiatives/"nancial-stability/TARP-Programs/aig/Pages/default.aspx.
PAGES 47, 48, 49 Based on Figure 16.3, Jason Furman, “The Fiscal Response to the Great Recession: Steps Taken, Paths Rejected, and Lessons for Next Time,” in Ben S. Bernanke, Timothy F. Geithner, and Henry M. Paulson, Jr., with J. Nellie Liang, eds., First Responders: Inside the U.S. Strategy for Fighting the 2007–2009 Global Financial Crisis (New Haven: Yale University Press, 2020).
PAGE 53 Monthly mortgage-related securities issuance "gures may not match annual "gures reported by the Securities Industry and Financial Markets Association on its website owing to a methodological di#erence in the reporting of each series.
PAGE 54 Based on the "gure “Mortgage Aid Extended More than 9.9 Million Times, Outpacing Foreclosures,” December 2016 Housing Scorecard, www.hud.gov/sites/documents/SCORECARD_2016_12_508C.PDF.
PAGE 56 Some home owners may have participated in more than one program; the sum of home owners helped across all categories does not necessarily re$ect the number of unique borrowers helped.
Based on Table 12.3, Michael Barr, Neel Kashkari, Andreas Lehnert, Phillip Swagel, “Crisis-Era Housing Programs,” in Ben S. Bernanke, Timothy F. Geithner, and Henry M. Paulson, Jr., with J. Nellie Liang, eds., First Responders: Inside the U.S. Strategy for Fighting the 2007–2009 Global Financial Crisis (New Haven: Yale University Press, 2020).
PAGE 58 Maximum commitments were taken from Table 2, Linda S. Goldberg, Craig Kennedy, and Jason Miu, “Central Bank Dollar Swap Lines and Overseas Dollar Funding Costs,” Federal Reserve Bank of New York Economic Policy Review 17(1) (May 2011): 3–20,www.newyorkfed.org/medialibrary/media/research/epr/11v17n1/1105gold.pdf.
PAGE 60 Based on Figure 17.9, Clay Lowery, Nathan Sheets, and Edwin (Ted) Truman, “International Coordination of Financial and Economic Policies,” in Ben S. Bernanke, Timothy F. Geithner, and Henry M. Paulson, Jr., with J. Nellie Liang, eds., First Responders: Inside the U.S. Strategy for Fighting the 2007–2009 Global Financial Crisis (New Haven: Yale University Press, 2020).
PAGE 62 The stock market (NYSE/AMEX/NASDAQ/ARCA) is measured by total market value as reported by the Center for Research in Security Prices and is shown to "nancial crisis trough. House prices are shown to three years after peak. Household wealth is a comparison between the change in the annual average (in nominal terms) of household wealth from 1929 to 1930, and the change in the nominal level of household wealth from Q1 2008 to Q1 2009.
Estimates of real household net worth (wealth) during the Great Depression were taken from Table 1, Frederic S. Mishkin, “The Household Balance Sheet and the Great Depression,” The Journal of Economic History 38(4) (December 1978): 918–37, www.jstor.org/stable/2118664.
PAGE 64 Guarantees: Re$ects the U.S. Treasury’s maximum commitments under the Temporary Guarantee Program for Money Market Funds and the FDIC’s maximum commitments under the two components of the Temporary Liquidity Guarantee Program, the Debt Guarantee Program, and the Transaction Account Guarantee Program.
Troubled Assets Relief Program (TARP): Re$ects principal outstanding for TARP programs including bank support programs, credit market programs, auto industry support, assistance to American International Group, and housing programs.
Federal Reserve Liquidity Programs: Re$ects loan amounts outstanding under credit and liquidity programs established the Federal Reserve Board. These include discount window lending (primary credit, secondary credit, and seasonal credit), term auction credit, the Primary Dealer Credit Facility, the Asset-Backed Commercial Paper Money Market Mutual Fund Liquidity Facility, the Term Asset-Backed Securities Loan Facility, the Commercial Paper Funding Facility, and central bank liquidity swaps. Also re$ects the value of outstanding securities lent through the Term Securities Lending Facility.
Other Programs: Re$ects the Federal Reserve, FDIC, and Treasury’s commitments under the Asset Guarantee Program; Federal Reserve Board assistance to Maiden Lane companies and support to American International Group; Treasury support for Fannie Mae and Freddie Mac through the senior preferred stock purchase agreements, as well as the face value of Treasury’s total mortgage-backed securities (MBS) portfolio at the end of each month, from October 2008-March 2012.
Exposures via Treasury’s Temporary Guarantee Program for Money Market Funds were taken from “Guarantees and Contingent Payments in TARP and Related Programs: Congressional Oversight Panel
November Oversight Report,” Congressional Oversight Panel (November 2009), https://fraser.stlouisfed.org/title/5018.
Based on Figure 18.5, J. Nellie Liang, Margaret M. McConnell, and Phillip Swagel, “Evidence on Outcomes,” in Ben S. Bernanke, Timothy F. Geithner, and Henry M. Paulson, Jr., with J. Nellie Liang, eds., First Responders: Inside the U.S. Strategy for Fighting the 2007–2009 Global Financial Crisis (New Haven: Yale University Press, 2020).
PAGE 69 Data for 63 "nancial crises in advanced economies, 1857 to 2013, were taken from Carmen Reinhart and Kenneth Rogo#, “Recovery from Financial Crises: Evidence from 100 Episodes,” American Economic Review: Papers & Proceedings 104(5) (2014): 50–55, https://scholar.harvard.edu/"les/rogo#/"les/aer_104-5_50-55.pdf.
Based on Figure 18.3, J. Nellie Liang, Margaret M. McConnell, and Phillip Swagel, “Evidence on Outcomes,” in Ben S. Bernanke, Timothy F. Geithner, and Henry M. Paulson, Jr., with J. Nellie Liang, eds., First Responders: Inside the U.S. Strategy for Fighting the 2007–2009 Global Financial Crisis (New Haven: Yale University Press, 2020).
PAGE 70 Based on Table 2 in Baird Webel and Marc Labonte, “Costs of Government Interventions in Response to the Financial Crisis: A Retrospective,” Congressional Research Service (updated September 2018), https://fas.org/sgp/crs/misc/R43413.pdf.
All "gures except otherwise noted are reported on a cash basis and as of Aug. 1, 2018. GSE debt purchases, DIF losses and cumulative income, and TAGP are as of Dec. 31, 2017; Maiden Lane is as of Jan. 31, 2018; and GSEs are as of Q2 2018.
PAGE 72 Depository institutions include U.S.-chartered depository institutions, foreign banking o!ces in the U.S., and credit unions.
Notes
84