Charting the course: A framework to evaluate pension de ... · Confidential – All Rights Reserved...
45
Charting the course A framework to evaluate pension de-risking strategies
Transcript of Charting the course: A framework to evaluate pension de ... · Confidential – All Rights Reserved...

Charting the course
A framework to evaluate pension de-risking strategies

Confidential – All Rights Reserved Charting the course — A framework to evaluate pension de-risking strategies |
Our authors
Adam Berk Partner, Ernst & Young LLP
Houston, TX +1 713 750 4996 [email protected]
Chris Raham Principal, Ernst & Young LLP
New York, NY +1 212 773 9064 [email protected]
Phil Hur Manager, Ernst & Young LLP
New York, NY +1 212 773 7029 [email protected]
Francisco Orduña Manager, Ernst & Young LLP
New York, NY +1 212 773 0145 [email protected]

Confidential – All Rights Reserved Charting the course — A framework to evaluate pension de-risking strategies |
Table of contents
1. Synopsis ........................................................................................................................................................................ 1
2. Introduction ................................................................................................................................................................... 6
3. Why is pension plan de-risking such a hot topic? ................................................................................................................ 7
4 The tools available for pension risk management ............................................................................................................... 8
5 Setting up a guidance framework ................................................................................................................................... 11
6. A case in point .............................................................................................................................................................. 12
6.1 Background ......................................................................................................................................................... 12
6.2 Defining the corporate objective ............................................................................................................................ 13
6.3 Identifying the strategies that will be considered ..................................................................................................... 13
6.4 Analyzing the results ............................................................................................................................................ 14
6.4.1 Modeling the selected strategies ............................................................................................................... 14
6.4.2 How do the candidate strategies perform in the management scenarios? ..................................................... 15
6.4.3 How do the candidate strategies perform under stochastic scenarios? ......................................................... 19
7. Closing remarks ............................................................................................................................................................ 26
Appendix A: Census data specifications ................................................................................................................................. 27
Appendix B: Actuarial valuation assumptions and methods ...................................................................................................... 29
Appendix C: Capital market scenario generation ..................................................................................................................... 30
Appendix D: Asset liability management modeling .................................................................................................................. 34
Appendix E: Model analytics ................................................................................................................................................. 37
A note on the organization: Section 1, the synopsis, provides an overview of our methodology and key findings. The remaining sections, the introduction through the closing remarks, develop, in further detail, each of the key themes of the synopsis.

Confidential – All Rights Reserved Charting the course — A framework to evaluate pension de-risking strategies | 1
1. Synopsis
In the five years since the financial crisis began, volatile market returns and depressed interest rates have combined to make defined
benefit (DB) plan management particularly challenging. Volatility on the balance sheet, in net income and in cash contributions has
caused DB plan management to be elevated to the finance agenda, and in response, plan sponsors, consultants and insurers are now
increasingly focused on de-risking strategies for defined benefit plans.
Corporations experienced some relief in 2013, when market returns sky-rocketed and interest rates increased, increasing the funded
status of many plans to pre-crisis levels. Many plan sponsors are back in the same funded position, facing the same type of decisions,
as they were in early 2008. Back then, plan termination appeared to be affordable, yet because plan investments were not aligned to
manage the risks in the liability portfolio, the opportunity to implement such forward-looking changes quickly vanished as the
market plummeted.
Now, many plan sponsors are working with their advisors to develop their strategy for the next five to ten years: more plans have
been frozen, and the discussion has turned to the effective management of the legacy liabilities. Differently than in 2008 when risk
management options were limited to traditional Liability Driven Investment (LDI) investment strategies or terminal funding
arrangements, plan sponsors now have more solutions available and, as a result of the increased focus on pension risk management,
plan sponsors are better educated about their options.
Yet within the wide range of alternatives available, it can be difficult to settle on a course of action. Crucially, there is still a void with
respect to the process that should be used to evaluate options against plan sponsor objectives instead of in their separate silos
(design, financial, investment and insurance). The industry has not yet answered one of the most important questions: how can we
examine the strategies available in today’s market under a common framework?
We wrote this paper as part of an effort to fill that gap, laying out a framework and then taking the CFO of two midsize plans through
our process to demonstrate how it can enable effective decision making tailored to the company and to the plan.
Building the decision-making framework
We believe there are three key tenets of a sound decision-making process:
• The analysis must be objective. We should be able to use the same framework regardless of the company or the plan under review.
• The guidance should be unbiased. Each solution — from plan design changes to the full buy-out of plan liabilities — should be evaluated against the same set of objective criteria.
• The outcome must be well understood. A solution’s ability to achieve the identified objective must be measurable, as must be the costs or trade-offs of adopting the strategy.
The outcome of the process should be guidance that considers the objectives of the company and rejects solutions that expose the
company to risks it is not willing, or prepared to take.
The framework is applied in five key work steps: define the objective; define the alternative strategies; analyze the alternatives,
implement the strategy and monitor the outcomes. We will use the case study to walk through the first three steps of this process.
Applying the framework to our case study
Outlining the CFO’s current state
The CFO has a common problem: the combination of low interest rates and volatile markets has significantly reduced the funded
status of the company’s defined benefit plans over the past five years. In fact, in the single year between 2008 and 2009, the funded
status of the plans dropped 20%. As a result, while the company has made significant cash contributions, there has been no
measurable improvement in funded status. Its investment policy — 60% return-seeking and 40% risk-protection assets — did not
perform well in response to market volatility, but has allowed for partial recovery in recent quarters.
In those quarters, market returns and interest rates have improved. The CFO has made the strategic decision to take advantage of
the resulting improvement in funded status to implement a strategy to terminate the plans within five years. She has taken the initial
steps to close both plans and freeze benefit accruals; in addition, she has overseen the settlement of a portion of the existing
liabilities using lump-sum payments. But how should assets be managed between now and full termination? What should her
concerns be as they approach the 5th year?

Confidential – All Rights Reserved Charting the course — A framework to evaluate pension de-risking strategies | 2
How do we apply the framework to our case?
Define the objective: the answer to the CFO’s question — how should assets be managed between now and full termination? —
depends on varying factors: the risk tolerance of the company; the plan attributes; and the size of the plan liabilities when compared
with the company’s core business. While there may not be one ‘best’ solution, we will look to find the best options after we eliminate
those strategies that do not meet the CFO’s objectives. The CFO can then choose between the remaining strategies knowing that
she’s eliminated solutions that expose the business to undesirable outcomes.
We will walk through the case study under two scenarios:
• First, we will look at the CFO whose objective is to minimize the total expected cost of termination.
• Second, we will look at the CFO with no tolerance for termination cost in excess of what is budgeted — $45m for the Salaried Plan; and $12.5m for the Hourly Plan. Should the economy improve, the improvement in funded status will allow the company to transact more quickly. However, should the economy deteriorate, this CFO expects the strategy to protect the plans’ funded status from further deterioration.
Define the alternative strategies: The CFO is considering a set of four investment management strategies that are typically available
to a midsize plan sponsor:
Static allocation The current allocation of return-seeking and risk-protection assets is maintained throughout the
projection period.
Graded allocation The allocation to the current risk-protection asset is increased as certain milestones, based on the funding
target, are reached. Re-risking, or increasing the allocation to return-seeking assets, is allowed if the funded
status deteriorates.
Traditional LDI The allocation to the current risk-protection asset is increased as certain milestones, based on the funding
target, are reached. The risk-protection asset is defined as the combination of the Barclays Long
Government Credit and the 30-year Treasury that matches the duration of the liabilities. Re-risking is
allowed if the funded status deteriorates.
Insured solution The allocation to the current risk-protection asset is increased as certain milestones, based on the funding
target, are reached. The risk-protection asset is designed to transfer the economic risks to an insurance
company. Re-risking is not allowed in this solution.
Analyze the alternatives: to demonstrate financial impacts, we demonstrate the performance of the strategies under a set of
stochastic scenarios more like traditional Value at Risk (VaR) measures.
We will use the results of the stochastic analysis to rank the strategies by customized risk metrics. This will allow us to stress the
performance of the strategies against the CFO’s objectives over a wide variety of economic outcomes.
In this synopsis, we will focus our analysis on the Salaried Plan. In the body of the paper, we will extend our analysis to the Hourly
Plan in situations where different plan attributes drive different results.
Minimizing the total expected cost of termination
The CFO is focused on minimizing the expected cost to terminate the plan over a five year horizon, subject to the condition that the
strategy chosen shows a reasonable probability of achieving plan termination within the five year window. The plans will be
terminated once available assets are sufficient to cover the termination premium.
The following chart shows the average total employer contributions remitted in the first five years of the projection against the
probability of being fully funded by Year 5. Remitted contributions are less than budgeted when plan termination occurs before the
end of the fifth year.

Confidential – All Rights Reserved Charting the course — A framework to evaluate pension de-risking strategies | 3
Chart 1
Present value of employer contributions in the first five years of the projection
As we would expect, because the allocation to the return-seeking asset remains high under the static allocation, there is more
opportunity to collect on market upswings, and the present value of the average cost of this strategy is the lowest. Since the static
allocation also exhibits a reasonable probability of successful termination within the five year window (65%), the CFO is likely to
choose this strategy.
In this case, the order of the graded allocation, traditional LDI and insured solution is also important. Many economic forecasts
anticipate an increasing interest rate environment, and the scenarios we’ve used do the same. Portfolios with shorter-duration
fixed income will perform better in this environment than comparable strategies with longer-duration fixed income. Since we have
modeled traditional LDI so that the dollar duration of the fixed income matches the liability, this portfolio uses longer-duration
assets than the graded allocation and insured solution. Therefore, in this environment, traditional LDI does not have as high a
return as those other strategies. In a decreasing interest rate environment, we would see the opposite effect.
Restricting the total cost of termination to budgeted contributions
In this case, the CFO is focused on capping the total cost of termination to the budget. The plans will be terminated once available
assets are sufficient to cover the termination premium.
In this case, better-than-expected performance that would allow termination before five years is a good outcome; however, it is less
important than protecting against the risk of additional contributions.

Confidential – All Rights Reserved Charting the course — A framework to evaluate pension de-risking strategies | 4
If we look at the median result, the CFO’s objective is satisfied under each strategy as all strategies achieve plan termination within
the five year window.
Chart 2
Percent of funded target achieved by year at the 50th percentile
However, by looking more deeply into the analysis, specifically at the adverse scenarios, critical differences between the strategies
begin to appear. The following chart shows the probability of being fully funded by Year 5, against the unfunded termination liability
at Year 5 in the scenario at the 95th percentile. By 95th percentile, we mean that if there were 100 cases ranked from the lowest cost
of termination to the highest, this case would be the 95th least expensive — or 5th most expensive, scenario.
Chart 3
Unfunded termination liability vs. probability of being fully funded by Year 5
In this case, the traditional LDI and the insured solution have the lowest average unfunded termination liability at the end of five
years. However, the insured solution appears to be the clear choice for the CFO as the probability of termination within the five year
window is higher than for all other strategies.
In our example, we have chosen to model a simple version of the traditional LDI strategy where the bond portfolio is made up of a
short duration asset and a long duration asset and the relative weighting is set to match the dollar duration of the liability. While
there are more sophisticated LDI strategies available in the market, we have chosen to model the traditional LDI in this way because
many companies with plan assets of a similar magnitude as those in the case study rely on a variant of this simple strategy.
50%
60%
70%
80%
90%
100%
0 1 2 3 4 5
Chart 2: Percent of funded target achieved by year: 50th percentile
Static allocation Graded allocation
Traditional LDI Insured solution

Confidential – All Rights Reserved Charting the course — A framework to evaluate pension de-risking strategies | 5
Plans with a more sophisticated LDI strategy will see results that are more consistent with those plans that undertake an insured
solution. In those cases, the traditional LDI strategy will show results more in line with the insured solution and may be a viable
alternative for the CFO.
Summary analysis
It is clear from our examples that the strategy that best fulfills the objective of the plan sponsor is not the same for everyone. The
strategy that best satisfies the corporate objective, constraints and priorities of the plan sponsor depends on the plan sponsor’s risk
tolerance and the attributes of the plan. It also depends on which economic environment the CFO thinks is most likely over the
projection time frame.
When markets perform well, static allocation strategies with a high allocation to equity perform well also; when interest rates are
rising, but recovery is more sluggish, the strategies with higher allocations to shorter-duration risk-protection assets perform the
best; and lastly, when interest rates are falling, the strategies with longer-duration risk-protection assets provide the lowest-cost
solution.
Innovation has given CFOs a set of instruments that can be used to manage pension risk, and the tools to make effective risk
management decisions have been created.
By using the disciplined framework we have presented here, the CFO can weigh each solution’s benefits and costs against the
company’s constraints and other priorities.
As plans teeter on the brink of full funding, companies should harness the latest tools to select the strategy that best suits their
needs. The alternative is to expose the company to a potential replay of the volatility they have experienced in the past five years.

Confidential – All Rights Reserved Charting the course — A framework to evaluate pension de-risking strategies | 6
2. Introduction
DB pension plan risk management is a topic frequently on the C-suite agenda. As such, many articles have been written to describe
the unique challenges inherent in DB plan management, much media attention has been focused on those companies that are
implementing risk management strategies, and many options are available to support transferring all or some of these risks to
third parties.
One question that has not been answered is one of the most important: how can we examine the pension risk management strategies
available in today’s market under a common framework to assess which best meet the goals of the CFO, while considering the unique
aspects of each company’s situation?
Funded-status metrics are again at a level where de-risking solutions are affordable which presents an opportunity for companies to
review their pension risk management strategy. Past experience shows us that the markets can move quickly to erode the hard-won
gains in funded status, and those that have a strategy in place will be better positioned to handle unexpected market events.
If the ultimate goal is termination, there is also an advantage to being prepared: there are windows of time where de-risking
strategies are more attractive and affordable. In order to be ready to take action, the CFO must have a strategy in place to take
advantage of favorable market conditions. This means doing the legwork ahead of time to scrub the data, align the portfolio to an
allocation that is appropriate both before and at plan termination, and perform proper due diligence on termination pricing relative
to the demographics and plan provisions.
We wrote this paper to show how a company can work towards an effective pension risk management strategy. In particular, we will
use a framework which allows a broad range of de-risking options to be evaluated in an objective and unbiased way against the
company’s objectives, constraints and other priorities.
In the sections below, you’ll find the following information:
• In Section 3, we look at the market events that have led many plan sponsors to identify pension de-risking as a strategic objective.
• In Section 4, we lay out the key tenets of our framework for evaluating de-risking strategies.
• In Section 5, we describe the types of solutions that are available to plan sponsors.
• In Section 6, we illustrate how our framework can be used to set an effective pension risk management strategy through the use of a case study.

Confidential – All Rights Reserved Charting the course — A framework to evaluate pension de-risking strategies | 7
3. Why is pension plan de-risking such a hot topic?
Volatile market returns and depressed interest rates have combined in the early 2000s and again in more recent years to make
defined benefit plan management particularly challenging. Plan sponsors have been required to contribute cash into their DB plans
which otherwise would have been available for other purposes. Additionally, due to market fluctuations, they have had to explain
volatility in their income and balance sheet to investors and analysts. This turbulence has elevated DB plan management to the
finance agenda; in response, plan sponsors, consultants and insurers are now increasingly focused on de-risking strategies for
DB plans.
Many plan sponsors have taken the initial step toward full termination and closed their DB plans to new entrants and have often taken
the additional step to stop future accruals to existing plan members. As of June 30, 2012, only 11% of the Fortune 100 companies
continued to offer traditional defined benefit plans to new salaried employees, down from 90% as recently as 1998.1 Put a different
way, of the approximately $2.0 trillion of US DB assets under management by private plan sponsors, 56% relate to plans that are
closed to new entrants and approximately half of those are frozen to future accruals.2
A Pyramis Global Advisors survey conducted in late 2013 showed that 15% of plan sponsors surveyed had instituted a formal glide
path strategy with established triggers — i.e., a strategy that creates a more conservative asset allocation as certain triggers, like
funded status level, are reached; a further 30% declared their intention to de-risk, but have not yet
implemented a formal glide path.3
Pension plan management, traditionally the purview of the benefits department, is now also on the
finance agenda, and financial risk management techniques are now becoming part of enterprise
risk management strategy.
Why should we act now?
In 2013, market returns and interest rates increased. Consequently, the funded status of many
plans increased to pre-crisis levels. While this has relieved some of the financial pressure on plan
sponsors, significant challenges continue to exist:
• Legislative and accounting changes now require that pension liabilities be valued on a basis more in line with corporate debt.
• Updated mortality tables and improvement scales that reflect longer life expectancies have caused unanticipated increases in liabilities to reflect the additional expected payments to retirees.
• The costs of administering plans, including PBGC premiums, are rising.
• Lastly, analysts are taking a harder look at the ability of plan sponsors to meet their obligations, especially when the pension liabilities rival the plan sponsor’s market capitalization.
Many plan sponsors find themselves in a similar funded position, facing similar decisions, as they were in early 2008: the plan’s
investments may not be aligned to mitigate the risks in the liability portfolio and therefore any slowdown or reversal of the economic
recovery could cause a reversal in the gains in funded status as well. This is an outcome that plan sponsors understand well but
would like to avoid.
Therefore, as asset values and interest rates continue to increase, and the cost of transferring the risk of the plan becomes more
affordable, plan sponsors should consider this opportunity to act. There are many options: some will choose to defease the liability
completely, others may choose to implement investment solutions with risk mitigation characteristics, and still others may choose
to continue to manage their pension portfolio on a total return basis to take advantage of market upswings.
Regardless of the ultimate objective of the plan sponsor, the decision should be based on a framework that allows the performance of
each strategy to be assessed in an unbiased way against the objectives, constraints and other priorities of the plan sponsor.
1 “Fewer Employers Offering Defined Benefit Pension Plans to New Salaried Employees,” Workforce magazine, www.workforce.com/articles/fewer-
employers-offering-defined-benefit-pension-plans-to-new-salaried-employees, October 3, 2012.
2 “The 2013 Cutwater Asset Management Defined Benefit Pension Plan Survey,” Cutwater Asset Management,
www.cutwater.com/pdf/research/2013_cutwater_survey_white_paper.pdf, 2013.
3 “2013 Pyramis Global Advisors US Corporate Mid-Market Pulse Poll,” Pyramis Global Advisors, http://www.pyramis.com/us/mid-market, 2013.
MAP-21 temporarily
increased PPA interest
rates; however, the effects
are likely to disappear by
2016. In addition, rates
calculated in accordance
with MAP-21 are not used
to compute PBGC premiums
and will not affect the
interest rates used by
insurers to determine buy-
out liabilities. As a result,
we have not included the
effects of MAP-21 in
our model.

Confidential – All Rights Reserved Charting the course — A framework to evaluate pension de-risking strategies | 8
4 The tools available for pension risk management
In early 2008, plan termination appeared to be affordable for many plan sponsors, and many companies began to ask about de-
risking strategies. At the time, there were fewer de-risking options available in the US, and we had not yet seen the level of
customization that has been negotiated into recent transactions.
In 2014, that picture has changed, and there are significantly more options available across the spectrum of risk management
activities, whether the end goal is to implement a liability-focused investment strategy, to partially de-risk the plan or to fully defease
plan liabilities. Increasingly, as noted above, these options are customizable to the plan sponsor and plan attributes.
Many plan sponsors implement a de-risking strategy in a series of four major steps:
1. Close the plan to new members and freeze benefits against future accruals. This strategy reduces the company’s exposure to
future benefit accruals and will be driven by the company’s overall benefits strategy.
2. Offer lump-sum payouts to eligible deferred vested members and retirees. Before a broader de-risking strategy is pursued for
the existing plan population, this strategy should be evaluated as it may provide a cost-effective method to settle eligible
benefits, depending on the current economic environment.
3. Change the investment strategy such that the assets more closely mirror the liabilities. To protect the funded status of the
plan, the plan sponsor can invest in assets that will mirror changes in the underlying plan liability as interest rates and corporate
bond spreads change.
4. Transfer either or both the economic and longevity risks to an insurance carrier. To insulate the plan against unfavorable
changes in the interest rate environment, or against unexpected changes in plan experience, the company can purchase an
insurance product.
For each of these steps, the right combination of risk management, or risk transfer techniques depends on a variety of factors,
including the current and projected financial position of the DB plan, the company’s expectations of the future economic
environment, the company’s overall benefit strategy and the relative cost of the strategies, just to name a few.

Confidential – All Rights Reserved Charting the course — A framework to evaluate pension de-risking strategies | 9
The following table provides a summary of some common risk management and risk transfer techniques available to DB
plan sponsors.
Common risk management
or risk transfer strategies Description and representative actions
Design solutions Design solutions are usually applied in the first stages of a risk reduction exercise and are used to
moderate or eliminate future increases in plan liabilities as a result of benefit accruals for current
and future participants.
These techniques can include:
• Reducing future benefits
• Closing the plan to new entrants
• Eliminating future accruals for existing plan participants
Financial solutions Financial solutions are applied to reduce the liability or current shortfall in plan assets.
Common techniques include:
• Additional contributions in the form of cash, employer securities (the ability to use this
approach is limited) or debt financing
• Lump-sum payouts
Investment solutions Investment solutions focus on the management of plan assets as a tool to either reduce any
shortfall in plan assets or to reduce the volatility of the deficit or surplus.
Common techniques include:
• Portfolio diversification
• Investments in alternative asset classes; for example, private equity, derivative instruments or
hedge funds
• Liability-driven investment (LDI) strategies
• Dynamic asset allocation
Insurance solutions Insurance solutions are used to protect the portfolio against unplanned changes in the liability; for
example, an unexpected change in the pattern of retiree deaths or a mismatch between the liability
discount rate and the return of the fixed income portfolio.
Common products include:
• Insured LDI
• Insured buy-in
• Insured buy-out
• Longevity insurance (more commonly sold in the UK)

Confidential – All Rights Reserved Charting the course — A framework to evaluate pension de-risking strategies | 10
Investment and insurance solutions available to plan sponsors
• Traditional Liability Driven Investment (LDI): the company seeks a closer correlation between the expected performance of
current investments and future liabilities. An LDI approach seeks to build a portfolio capable of meeting all future DB liabilities
on a best efforts basis. Similar to other investment products, fees are expressed as a percent of assets under management and
collected at regular intervals.
• Insured LDI: a more rigorous example of the above, an insured LDI approach provides a guaranteed investment that exactly
matches the economic basis of the liabilities. This strategy eliminates the basis risk that exists between a traditional LDI
portfolio and the discount rate used to calculate plan liabilities. Similar to other investment products, fees are expressed as a
percent of assets under management and collected at regular intervals.
• Insured buy-out: also referred to as an annuity purchase. A plan sponsor transfers the existing pension liabilities directly to an
insurer in exchange for an up-front payment. This removes the liability from the plan sponsor’s balance sheet. If a buy-out
contract is purchased for the entire liability, the plan sponsor must immediately fund any gap between available assets and the
buy-out premium. If a buy-out contract is purchased for a portion of the liabilities, the plan sponsor may be required to remit
additional cash contributions should the plan become ‘at-risk’. Typically, the premium for this product is due when the
transaction is executed.
• Insured buy-in: these are similar to buy-outs, with one key exception: the fiduciary responsibility is not transferred to the insurer
but rather remains with the plan sponsor. The plan sponsor purchases an asset that matches the existing pension obligations.
This product allows the plan sponsor to i) avoid having to immediately fund any existing deficit and ii) avoid the settlement
accounting that is required if the obligations are sold to an insurer in a buy-out. At the same time, future pension contributions
and expenses become more predictable as the sponsor’s deficit, with respect to the covered liabilities, becomes fixed. We note
that the accounting treatment for buy-in contracts is complex and the issues related to measuring pension expense have been a
consideration for employers evaluating this approach. Typically, the premium for this product is due when the transaction is
executed.
• Longevity insurance: sometimes implemented as part of a broader Liability Driven Investment (LDI) strategy, actual longevity
experience is swapped for a counterparty’s expectations of future longevity experience, thereby locking-in the future longevity
experience from the perspective of the plan sponsor. Fees are typically expressed as a percentage of the underlying benefit cash
flows and may be collected up front, or at regular intervals.
Pension risk management is a complex exercise: in order to make an effective decision, the CFO needs a framework under which she
can evaluate how successful each technique, or combination of techniques, might be related to her selection criteria.

Confidential – All Rights Reserved Charting the course — A framework to evaluate pension de-risking strategies | 11
5 Setting up a guidance framework
We believe there are three key tenets of a sound decision-making process:
• The analysis must be objective: We should be able to use the same framework regardless of the company or the plan under review. The criteria that a CFO prioritizes will fluctuate depending on the plan attributes and the company’s risk tolerance, but the framework should remain constant while accommodating varying circumstances and facilitating the analysis.
• The guidance should be unbiased: each solution — from plan design changes to the full buy-out of plan liabilities — should be evaluated against the same set of objective criteria that has been prioritized based on the plan attributes and the company’s risk tolerance.
• The outcome must be well understood: A solution’s ability to achieve the identified objective must be measurable, as must the costs and risk/reward trade-offs of adopting the strategy.
The outcome of the process should reflect the company’s objectives and reject solutions that expose the company to risks it is not
willing, or prepared to take.
So how can we apply these tenets to the pension risk management exercise? Our pension risk management framework is set out in
the table below.
Key work step Key objectives
Define and prioritize the
objectives and
constraints
The company’s objectives when defining its pension risk management policy should be stated in terms of
its fiscal priorities; for example, the goal may be to minimize the volatility of cash contributions or net
income, or to fully defease the liability for all or a part of plan participants in a set number of years. The
company should prioritize competing objectives by its tolerance to the underlying risk.
Define the universe of
alternatives to consider
The company should identify a finite number of strategies across the spectrum of alternatives that could
be used to help achieve its objectives. Each alternative will then be subject to analytical review.
Analyze alternatives Financial outcomes should be projected for the selected alternative strategies across a broad range of
economic scenarios over the time horizon appropriate for the plan sponsor. Progress towards the
defined objectives should be tracked and used to rank the strategies.
Implement the strategy The company will work through the implementation of the strategy — for example, a lump sum offering,
a change in investment strategy, or the purchase of an insurance product — with its team of advisors.
Monitor the strategy Periodic monitoring allows the company to assess how the strategy is performing in a timely fashion and
allows the plan sponsor time to react if adjustments need to be made. The frequency of monitoring will
depend on the individual company and the size of the residual risk.
Long-term forecasts should be reviewed at regular intervals to validate the strategies in terms of the
company’s current objectives.
The key tenets are important in each of the steps above. In this paper, we will show how they can be applied to analyze the
alternative strategies. We will show how the application of an objective and unbiased framework and the choice of metrics that are
focused on the objectives, constraints and other priorities of the CFO help to rank the strategies such that the solutions that expose
the business to undesirable outcomes are eliminated, leaving only those that are best aligned with the company’s goals.
Identifying the best strategy — setting objectives, analyzing the alternatives and selecting the ultimate strategy — takes time.
Therefore, the earlier that the company works through this decision-making process, the sooner it can take action. In addition,
implementation will also take some time and effort. Many of these actions demand significant planning. For example:
• Changes in a plan’s benefit structure require plan amendments that must be communicated to and approved by various parties.
• Opening a lump-sum window requires a plan amendment and, in certain cases, approval from the Department of Labor.
• Data must be of sufficient quality to support the implementation of a lump-sum program or full termination through a buy-in or buy-out to an insurer.
Finally, acting early allows the company to be prepared and proactive to the economic environment before implementing a de-risking
strategy. Timing is particularly important when the de-risking strategy requires changes to the portfolio’s investment mix, which is
likely required when implementing investment solutions and insurance products.

Confidential – All Rights Reserved Charting the course — A framework to evaluate pension de-risking strategies | 12
6. A case in point
To demonstrate our framework, we look at how the process would work for a hypothetical company: a mid-sized manufacturer with a
current market capitalization of approximately $500m.
6.1 Background
The company sponsors two defined benefit pension plans: the Salaried Plan and the Hourly Plan. The combined liabilities of the two
plans on a funding basis (as dictated by the Pension Protection Act of 2006) are approximately $175m.
The Salaried Plan is a final average pay plan with relatively rich benefits. It has been closed to new entrants for 10 years, which
means the majority of the participants (80%) are already in receipt of benefits; the benefits are not linked to inflation. The plan is
85% funded on a PPA basis and has an existing asset allocation that is invested 60% in return-seeking assets (i.e., equities) and 40%
in risk-protection assets (i.e., fixed income securities).
By contrast, the Hourly Plan is a flat benefit plan that has remained open to new entrants. Approximately half of the plan participants
are receiving monthly benefits, with the remainder either still accruing benefits or terminated with a vested benefit; benefits are not
linked to inflation. The plan is 95% funded on a PPA basis and has an existing asset allocation similar to the Salaried Plan: 60%
invested in return-seeking assets and 40% in risk-protection assets. The duration of the Hourly Plan liabilities is longer than that of
the Salaried Plan; this means that the cash flows are paid out over a longer period of time.
Further information on plan demographics can be found in Appendix A and further information on the liability valuation parameters
can be found in Appendix B.
The Company’s business is cyclical in nature: when the economy goes through a downturn, it experiences a reduction in sales and
has less cash available to run its business. Unfortunately, this is also the time at which more cash must be contributed to the plans. In
the more recent past, the combination of low interest rates and volatile markets had significantly reduced the funded status of the
plans. The company has been required to make significant cash contributions. While market returns and interest rates have increased
in the past year, the CFO wants to eliminate the volatility in required cash contributions and the resulting impact on the
Company’s financials.
Certain risk management actions have already been taken
The management team has evaluated its options and has decided that the retirement benefits that the company offers will be
converted from a defined benefit arrangement to a defined contribution-style plan. The plan conversion is outside the scope of this
case study: we will focus on the path the CFO follows to fully defease the risk of the existing DB plans.
The CFO consults with the plans’ actuaries on the most effective way to manage the risks associated with the remaining DB plan
liabilities; it is decided that the plans will be fully terminated: the target time frame is five years.
A number of steps are taken immediately:
• The Hourly Plan is closed to new entrants to mitigate the risk of any increase in liabilities due to new participant accruals. This action is not required for the Salaried Plan which is already closed.
• All existing accruals are frozen, i.e., current plan participants are no longer eligible to accrue benefits related to future service within either of the DB plans.
• Lump-sums payouts are offered to eligible participants, reducing the liability related to the ultimate buy-out transaction.
Offering lump-sum payouts for relatively small accrued benefits is an economical way to reduce the liability for many pension
plans. While the actual cash payouts relative to the liability will vary depending on the economic conditions and assumptions for
determining the liability, there are other savings to be considered. PBGC fixed premiums are paid annually on a per participant
basis, regardless of funding level, and are set to rise from $42 for the 2013 plan year to at least $64 for the 2016 plan year, a
more than 50% increase. In addition, reducing the number of plan participants can lessen various administrative burdens such as
annual notices and census recordkeeping.

Confidential – All Rights Reserved Charting the course — A framework to evaluate pension de-risking strategies | 13
The remaining shortfall between available assets and the full termination premium is too large for the company to contribute in a
single year; the CFO has set the funding policy such that, at current interest rates, the plans will be funded at the end of five years.
For the Salaried Plan, the annual contribution is budgeted at $9m (for a cumulative total of $45m); $2.5m for the Hourly Plan (for a
cumulative total of $12.5m).
The plans will be terminated once available assets are sufficient to cover the termination premium; or at the end of 10 years,
whichever happens first.
The CFO must set the investment policy for plan assets from now until the date of termination.
6.2 Defining the corporate objective
We will walk through the case study under two scenarios:
• Objective 1: The CFO’s objective is to minimize the expected total cost of termination.
• Objective 2: The CFO has low tolerance for termination costs in excess of what is budgeted — $45m for the Salaried Plan; and $12.5m for the Hourly Plan. Should the economy improve, the improvement in funded status will allow the company to transact more quickly. However, should the economy deteriorate, this CFO expects the strategy to protect the plans’ funded status from further deterioration.
6.3 Identifying the strategies that will be considered
As a first step, the CFO works with the plans’ advisors to develop the list of investment and insurance strategies to be considered.
The following strategies, which represent a cross section of those typically available to a mid-size sponsor, were selected for analysis.
• The current allocation of risk-seeking and risk-protection assets is maintained
throughout the projection period. Static allocation
• The allocation to the current risk-protection asset is increased as certain milestones, based on the funding target, are reached.
• Re-risking is permitted if the funded status deteriorates. • The risk-protection asset is defined as the combination of the Barclays Long
Government Credit and the 30-year Treasury that matches the duration of plan
liabilities.
• The allocation to the current risk-protection asset is increased as certain milestones, based on the funding target, are reached.
• Re-risking is not permitted if the funded status deteriorates. • The risk-protection asset is defined as an insurance product, or more specifically is
designed to transfer the economic risks and, in certain cases, demographic risk to an insurance company.
• The current allocation to the risk-protection assets is increased as certain milestones, based on the funding target, are reached.
• Re-risking, or increasing the allocation to the risk-seeking asset, is permitted if the
funded status deteriorates.
Graded allocation
Traditional LDI
Insured solution

Confidential – All Rights Reserved Charting the course — A framework to evaluate pension de-risking strategies | 14
Setting up the glide path
In strategies that use a glide path, the asset allocation is reset based on the funded status of the plan at the end of each year. If
the funded status improves, more assets are allocated to the risk-protection assets. On the other hand, if the funded status
deteriorates, more assets are allocated to the risk-seeking assets. The following figure illustrates the linear rebalancing path
followed by the strategies that use a glide path.
Glide path asset allocation
6.4 Analyzing the results
6.4.1 Modeling the selected strategies
In this section, we provide an overview of our modeling approach. Further detail can be found in the Appendices.
In section 6.4.2, we will explore the relative performance of each strategy using a set of management scenarios the CFO has
selected. These strategies represent both the baseline economic outcomes which the CFO believes are most likely and alternatives
the CFO believes are possible and would have a negative impact on the plan.
In section 6.4.3, we will use a set of stochastic scenarios to analyze the strategies by customized risk metrics. This will allow us to
stress the performance of the strategies against the CFO’s objectives over a wide variety of economic outcomes.
Defining the strategies
Static allocation: In this strategy, the target asset allocation is unchanged throughout the strategy at the current mix: 60% return-
seeking assets and 40% risk-protection assets. When the portfolio is more than 5% outside the target allocation at any December 31,
the portfolio is rebalanced to 60/40 the following January 1. For simplicity, rebalancing occurs once annually for all strategies. The
risk-protection asset is the Barclays Long GC (Barclays Long Government/Credit Index).
Graded allocation: In this strategy, the target asset allocation is set throughout the projection period based on the funded status
(defined on a PPA basis) at the end of the current year. As the plan’s funded status improves, the allocation to the risk-protection
asset increases; conversely, if the plan’s funded status deteriorates, the allocation to the risk-protection asset decreases. The
portfolio is rebalanced once annually on January 1. The risk-protection asset is the same as that in the static allocation strategy: the
Barclays Long GC.
Traditional LDI: Similar to the graded allocation strategy, the target asset allocation is determined using a glide-path. The difference
is that the risk-protection asset is composed of two assets: the 30-year Treasury bill and the Barclays Long GC. The relative
weighting is set to match the dollar duration of the liability; with the restriction that short selling is not permitted.
60%
40%
100%
InitialFundedStatus
Fully Funded
Ass
et
allo
ca
tio
n
Risk-seeking assets Risk-protection assetReturn-seeking assets
Initial funded status
Fully funded

Confidential – All Rights Reserved Charting the course — A framework to evaluate pension de-risking strategies | 15
While there are more sophisticated LDI strategies available in the market, we have chosen to model the traditional LDI in this way
because many companies with plan assets of a similar magnitude as those in the case study rely on a variant of the simple strategy
described above. Plans with a more sophisticated LDI strategy will see results that are more consistent with those plans that
undertake an insured solution as described below.
Insured solution: Similar to the graded allocation and traditional LDI strategies, the target asset allocation is determined using a
glide-path. The distinction is that in this strategy, the risk-protection asset is defined as an insurance product where the liability is
“insured” — or held in the risk-protection asset — is fully hedged against changes in the economic environment. Certain products that
fit into this category also hedge the liabilities against unexpected changes in the plan’s expected mortality. In our projections, we
have assumed that the product does not hedge longevity risk.
In all strategies, the return-seeking asset is allocated to a basket of indices representative of the portfolio of a mid-size plan sponsor.
The initial allocation is 40% large cap equities; 15% international equities and 5% alternative assets; the relative weight of each class
is maintained as the allocation to the return-seeking portfolio increases and decreases.
Each of the strategies discussed above has associated investment management costs. For the static allocation, graded allocation and
traditional LDI strategies, the cost of investing in each asset class is based on current market expectations. The cost for the
insurance solution is linked to the economy at the time of purchase and other factors: therefore, we have used indicative pricing data
and created a simplified pricing algorithm such that the cost varies depending on the underlying liability duration and the economic
environment at the time of purchase.
Further detail with respect to the parameterization of the strategies under consideration can be found in Appendix D.
Estimating the cost of plan termination
The cost of plan termination can be expressed as a multiple of the liabilities on either a PPA basis or a GAAP accounting basis — and
this multiple can be used as the funding target when constructing the glide-path. In our example, the company is most concerned
about the volatility of cash contributions that are driven by the liabilities calculated on a PPA basis; therefore, we will express our
target in those terms.
Indicative pricing for the company’s two plans showed that, in today’s environment, the termination multiples are approximately
120% of the PPA liabilities. We have used the termination multiple to set the Funding Target for plan termination.
It is important to adjust this metric over time to account for changes in the economic environment. To accomplish this, we use an
algorithm that measures changes in the US Treasury curve and the S&P 500 to forecast their effects on these prices and have
applied this during our projections.
6.4.2 How do the candidate strategies perform in the management scenarios?
For strategic planning purposes the Company has developed management scenarios. The management scenarios are used to explain
how the strategies perform in response to changes in interest rates, corporate spreads and equity returns that are of top concern
to management.
We will focus on four scenarios:
• The baseline scenario: equity returns are in line with historical averages and interest rates rise to their long term average over three years
• The slow recovery: equity returns are in line with historical averages and interest rates rise to their long term average over five years
• The volatile equity scenario: equity returns drop in the second year of the projection; and there is an initial period of high inflation
• The Japan scenario: interest rates remain low and equity returns are depressed
The charts for the Salaried and Hourly Plans are similar in each of the scenarios described above; therefore, only the results for the
Salaried Plan are presented.

Confidential – All Rights Reserved Charting the course — A framework to evaluate pension de-risking strategies | 16
The baseline scenario
We first look at how the strategies perform in our base scenario: interest rates rise to the long term average over a 3 year period,
and equity market returns are in line with historical averages.
The baseline scenario assumes that the 10-year Treasury rate increases from current levels to its expected long-term average of
4.85% over four years. (A forecast similar to that published by Moody’s Analytics.4) For illustration, to create the full yield curve, we
have assumed that the shape of the curve is the same as that at the beginning of the projection period, and that any credit spread
from the Treasury rate is fixed over the full yield curve. We will stress both of these assumptions later in the analysis. Finally, we have
assumed that return-seeking assets return 7.5% annually, which is the average historical return of the S&P 500 (including dividends)
over the past 10 years. We will stress this assumption as well in later analyses.
The results for the Salaried Plan are shown in Chart 4 below.
Chart 4
Percent of funded target achieved by year — Salaried Plan
In this scenario, the combination of increasing interest rates and moderate equity returns means that all strategies achieve the
funding target –the termination premium — within the five-year window. As expected in this environment, those strategies that
maintain a higher allocation to equity reach the funding target more quickly. While the static allocation strategy is the quickest to
achieve the funding target, all strategies accomplish this by the end of Year 4.
The outlier in this chart is the traditional LDI portfolio. Because this strategy is heavily invested in long duration Treasuries, portfolio
returns are lower than those invested in shorter duration securities. In a decreasing interest rate environment we would expect
traditional LDI to outperform the graded allocation and insured solution, all else being equal.
4 “US Macroeconomic Outlook Alternative Scenarios,” Moody’s Analytics, https://www.economy.com/home/products/samples/Moodys-Analytics-
US-Alternative-Scenarios.pdf, September 2013.
70%
80%
90%
100%
0 1 2 3 4 5
Chart 4: Percent of funded target achieved by year – salaried plan
Static allocation Graded allocation
Traditional LDI Insured solution

Confidential – All Rights Reserved Charting the course — A framework to evaluate pension de-risking strategies | 17
Chart 5
Percent of funded target achieved by year — Hourly Plan
Chart 5 shows the results for the Hourly Plan where the funded status on a PPA basis was already 95%. The results are consistent
with those of the Salaried Plan, save that the funding target is achieved even more quickly (i.e., by the end of Year 3).
What if the economy is slow to recover?
In this scenario, the increase in interest rates happens over a five year period instead of the three year period in the baseline
scenario; equity returns are in line with historical levels which is unchanged from the baseline scenario. Chart 6 illustrates the results
for the Salaried Plan.
Chart 6
Percent of funded target achieved by year — Salaried Plan
Similar to the baseline scenario, the combination of increasing interest rates and moderate equity returns means that all strategies
achieve the funding target within five years.
In this scenario we see an example of the traditional LDI strategy outperforming the other strategies in the first few years while
interest rates remain low.
70%
80%
90%
100%
0 1 2 3 4 5
Chart 5: Percent of funded target achieved by year – hourly plan
Static allocation Graded allocation
Traditional LDI Insured solution

Confidential – All Rights Reserved Charting the course — A framework to evaluate pension de-risking strategies | 18
What if there is a sharp drop in equities, and we experienced a period of high inflation?
In this scenario, there is a one-time deviation from the historical average as equity returns drop by 20% in the second year. In
addition, interest rates spike in Year 1 and then return to the pattern described in the previous scenario — traveling from current
levels to the long term average over five years. Chart 7 shows the results of this scenario for the Salaried Plan.
Chart 7
Percent of funded target achieved by year — Salaried Plan
All strategies continue to achieve termination with the five-year window; however, the static allocation strategy is an outlier. In this
strategy, gains are not “locked in” by increasing the allocation to the risk-protection asset; therefore, a higher proportion of the
portfolio is affected by the drop in equities in Year 2.
In this scenario, we are assuming only one year of negative equity returns; it is easy to see that if equities continued to underperform
the historical average for another year that the static allocation strategy may not achieve the funding target within five years.
In addition, those strategies with shorter fixed income duration — i.e., the graded allocation and the insured solution — reach the
funding target more quickly than those with longer fixed income duration — i.e., traditional LDI. These strategies lock in the gains
from the increase in interest rates and equity returns in Year 1, and in Year 2 they are less sensitive to the sharp downturn in rates
brought on by the dollar crash than the longer-duration portfolio.

Confidential – All Rights Reserved Charting the course — A framework to evaluate pension de-risking strategies | 19
Finally, what happens if interest rates increase slowly and equity returns are depressed?
In this scenario, equity returns are in line with inflation over the entire projection period. In addition, interest rates increase from
current levels to the long-term average over five years. Chart 8 presents the results for the Salaried Plan.
Chart 8
Percent of funded target achieved by year — Salaried Plan
Initially, the traditional LDI strategy outperforms the other strategies as longer duration assets outperform shorter duration assets.
As interest rates slowly increase, all strategies achieve the funding target within six years.
The performance of the strategies depends heavily on the economic environment between now and the date of termination. The
table below shows the year in which the strategy achieves full termination for the Salaried Plan. Because contributions are the same
across all of the scenarios, the lowest cost strategies are those where the funding target is reached in the shortest number of years.
Scenario Static allocation Graded allocation Traditional LDI Insured solution
Baseline 3 4 4 4
Economy is slow to recover 4 5 5 5
Drop in equities; period of high inflation 5 3 4 3
Low equity returns, low interest rates 5 6 6 6
We can draw a few conclusions from these results. When equity markets perform well, static allocation strategies with a high
allocation to equity achieve the funding target more quickly. When interest rates rise at a slower rate, and equity markets perform
modestly, the strategies with higher allocation to shorter duration risk-protection assets reach the termination target faster. And
finally, when interest rates are falling, the strategies with longer duration risk-protection assets provide the quickest time to
termination.
6.4.3 How do the candidate strategies perform under stochastic scenarios?
In this section, we’ll shift the focus to look at the aggregate results of 2,000 randomly generated scenarios. The scenarios have been
calibrated to reflect management’s general expectations of future market returns, the risk free rate, and credit spreads. Further
detail with respect to the development of the interest rate, corporate spread and equity market assumptions can be found in
Appendix C.
We will use the results of the stochastic analysis to evaluate the strategies by customized risk metrics. This will allow us to stress the
performance of the strategies against the CFO’s objectives over a wide variety of economic outcomes.

Confidential – All Rights Reserved Charting the course — A framework to evaluate pension de-risking strategies | 20
Objective 1: Minimizing the expected total cost of termination
The CFO is focused on minimizing the expected cost to terminate the plan over a five year horizon, subject to the condition that the
strategy chosen shows a reasonable probability of achieving plan termination within the five year window. The plans will be
terminated once available assets are sufficient to cover the termination premium.
Chart 9 shows the cumulative probability of termination in each year across all scenarios for the Salaried Plan.
Chart 9
Cumulative number of scenarios where funding target is attained
The static allocation has a slightly higher probability of achieving the funding target and; therefore, plan termination in the first three
years of the projection. This is a function of the higher allocation to return-seeking assets. As above, by Year 4 and Year 5, the
downside protection offered by the insured solution allows more scenarios to achieve termination.
Based on the chart above, it is unclear which strategy has the lowest cost over the five year period since the ranking of the scenarios
changes over time.
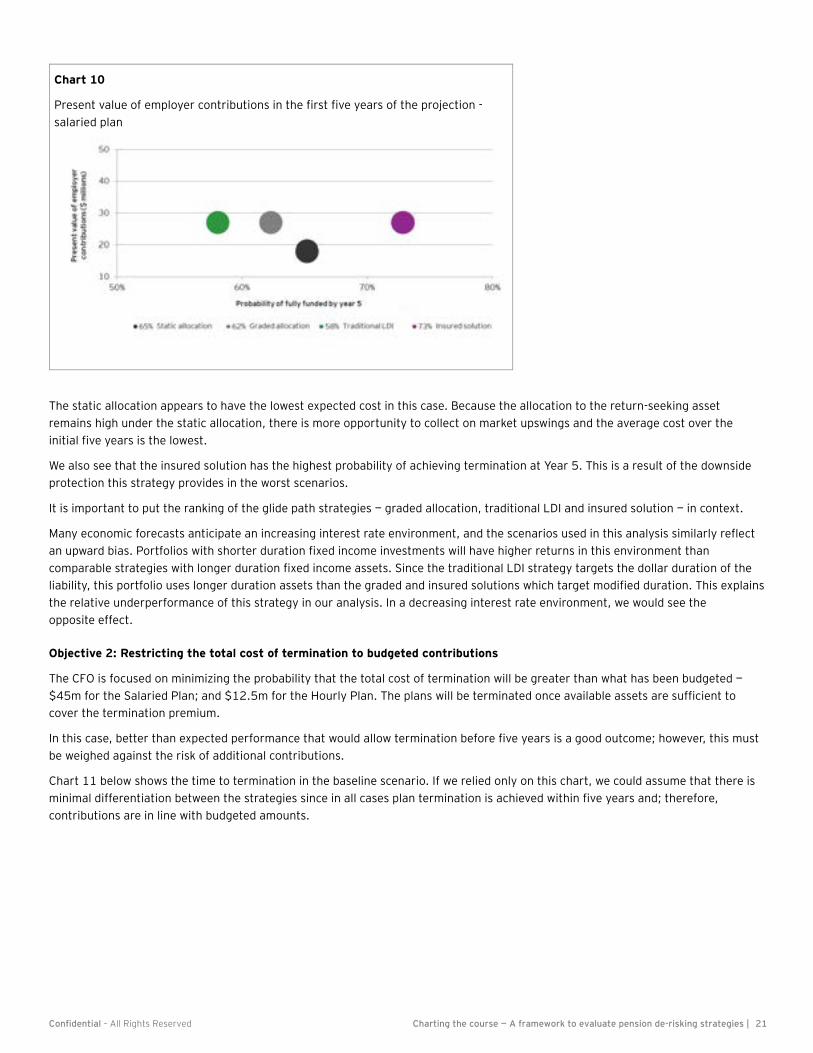
Chart 10 shows the average total employer contributions remitted in the first five years of the projection against the probability of
being fully funded by Year 5. Remitted contributions are less than budgeted contributions when plan termination occurs before the
end of the fifth year.
0%
10%
20%
30%
40%
50%
60%
70%
80%
90%
100%
0 1 2 3 4 5
Cu
mu
lati
ve
te
rmin
ati
on
ra
te
Year
Chart 9: Cumulative number of scenarios where funding target is attained
Fixed Allocation Fixed Glide Path Traditional LDI Insured LDIStatic allocation Graded allocation Traditional LDI Insured solution
Confidential – All Rights Reserved Charting the course — A framework to evaluate pension de-risking strategies | 21
Chart 10
Present value of employer contributions in the first five years of the projection -
salaried plan
The static allocation appears to have the lowest expected cost in this case. Because the allocation to the return-seeking asset
remains high under the static allocation, there is more opportunity to collect on market upswings and the average cost over the
initial five years is the lowest.
We also see that the insured solution has the highest probability of achieving termination at Year 5. This is a result of the downside
protection this strategy provides in the worst scenarios.
It is important to put the ranking of the glide path strategies — graded allocation, traditional LDI and insured solution — in context.
Many economic forecasts anticipate an increasing interest rate environment, and the scenarios used in this analysis similarly reflect
an upward bias. Portfolios with shorter duration fixed income investments will have higher returns in this environment than
comparable strategies with longer duration fixed income assets. Since the traditional LDI strategy targets the dollar duration of the
liability, this portfolio uses longer duration assets than the graded and insured solutions which target modified duration. This explains
the relative underperformance of this strategy in our analysis. In a decreasing interest rate environment, we would see the
opposite effect.
Objective 2: Restricting the total cost of termination to budgeted contributions
The CFO is focused on minimizing the probability that the total cost of termination will be greater than what has been budgeted —
$45m for the Salaried Plan; and $12.5m for the Hourly Plan. The plans will be terminated once available assets are sufficient to
cover the termination premium.
In this case, better than expected performance that would allow termination before five years is a good outcome; however, this must
be weighed against the risk of additional contributions.
Chart 11 below shows the time to termination in the baseline scenario. If we relied only on this chart, we could assume that there is
minimal differentiation between the strategies since in all cases plan termination is achieved within five years and; therefore,
contributions are in line with budgeted amounts.

Confidential – All Rights Reserved Charting the course — A framework to evaluate pension de-risking strategies | 22
Chart 11
Percent of funded target achieved by year: 50th percentile — Salaried Plan
However, to properly assess the risk that contributions will exceed budgeted amounts, we need to look at more adverse scenarios.
Chart 12 shows the probability of being fully funded by Year 5, charted against the unfunded termination liability at the end of Year
5 for those scenarios in which available assets are insufficient to pay the termination premium.
Chart 12
Unfunded termination liability vs. probability of being
fully funded by Year 5 — Salaried Plan
50%
60%
70%
80%
90%
100%
0 1 2 3 4 5
Chart 2: Percent of funded target achieved by year: 50th percentile
Static allocation Graded allocation
Traditional LDI Insured solution

Confidential – All Rights Reserved Charting the course — A framework to evaluate pension de-risking strategies | 23
We can read the data for the static allocation strategy in the following way:
• In approximately 65% of the 2,000 scenarios, the strategy achieved the funding target by Year 5.
• In those scenarios for which the funding target was not achieved by Year 5 — the remaining cost to fully terminate the plan is approximately $43m for the case in the 95th percentile. By 95th percentile, we mean that, if there were 100 cases ranked from the lowest termination cost to the highest termination cost, this case would be the 95th least expensive— or 5th most expensive scenario.
Based on this information, it appears that the strategy with the lowest expected cost in excess of the budget is the insured solution.
Let’s also look at the total cost of plan termination. In the following charts, we assume that the plans will be terminated once
available assets are sufficient to cover the termination premium, but that the CFO will contribute any shortfall in plan assets at the
end of year 10. Chart 13 illustrates the percentage of plans that, after 10 years, have spent more or less than the original budgeted
contributions. Negative numbers indicate that the ultimate cost of termination is less than budgeted; and positive numbers show the
average additional cost to terminate the plan over the budgeted amount at the end of the 10th year.
Based on this chart, the CFO’s decision becomes clearer: traditional LDI and the insured solution have a lower average shortfall than
the static and graded allocation strategies. In addition, the insured solution shows a higher probability of plan termination within the
five year window. In this case, the CFO is likely to choose in the insured solution for the Salaried Plan.
In our example, we have chosen to model a simple version of the traditional LDI strategy; however, plans with a more sophisticated
LDI strategy will see results that are more consistent with those plans that undertake an insured solution. In those cases, the
traditional LDI strategy show results more in line with the insured solution and may be viable alternative for the CFO.
$(17.1)m) $(16.3)m) $(15.4)m $(15.4)m
$23.8m $22.7m $20.5m $17.4m
0%
10%
20%
30%
40%
50%
60%
70%
80%
90%
100%
Static allocation Graded allocation Traditional LDI Insured solution
Pe
rce
nta
ge
of
sce
na
rio
s
Chart 13
10 year aggregate contribution variance– Salaried Plan
Within budget At budget Over budget

Confidential – All Rights Reserved Charting the course — A framework to evaluate pension de-risking strategies | 24
The last question that we will look at is whether the relative performance of the strategies is different if we start with a plan that is
better funded. To answer this question, we can look at the analysis for the Hourly Plan.
Chart 14 below shows the unfunded liability at the end of Year 5 at the 95th percentile, or the 100th most expensive outcome out of
the 2,000 scenarios. When we look at this chart we see that the distribution of outcomes is much smaller than what we saw for the
Salaried Plan. Since the distribution is smaller, the CFO may conclude that the potential upside in the static allocation strategy
outweighs the potential cost of de-risking in the worst scenarios and may choose the static or graded allocation strategies.
Chart 14
Unfunded termination liability vs. probability of being fully funded by Year 5 —
Hourly Plan
We can test this by looking to the total cost of termination over the 10 year projection period, as shown in Chart 15 below.
We can see that the average savings for those scenarios where the cost of plan termination is less than that budgeted is highest in
the static and graded allocation strategies.
The narrow distribution of results means that the right choice isn’t obvious. The insured solution may also be a good choice: in this
strategy, the probability of termination within five years is higher. In addition, for the scenarios where available assets are insufficient
to fund the termination premium after five years, the average additional cost is smaller than that for the other strategies.
$(5.3)m) $(5.2)m $(4.3)m
$(5.0)m
$7.5m $7.3m $6.3m
$5.9m
0%
10%
20%
30%
40%
50%
60%
70%
80%
90%
100%
Static allocation Graded allocation Traditional LDI Insured solution
Pe
rce
nta
ge
of
sce
na
rio
s
Chart 15 10 year aggregate contribution variance – Hourly Plan
Within budget At budget Over budget

Confidential – All Rights Reserved Charting the course — A framework to evaluate pension de-risking strategies | 25
The CFO’s decision will be based on her risk tolerance. Strictly speaking, the expected cost savings related to the static and graded
allocation strategies is higher than in the other strategies. However, given the narrow distribution of the total costs, if she is more
risk averse, she may choose the insured solution based on the higher probability of termination.
The work that we have presented here has shown that the relative performance of the strategies depends on the funded status of the
plans and the constraints of the company. And it’s safe to say that these are not the only factors: for example, the starting funded
status of the plan, the proportion of participants that are receiving monthly benefits at the start of the projection period, and the
size of the termination premium relative to the liabilities all play a part in the relative performance of the strategies.
That is what makes the use of a framework like this so effective: the Company’s objectives, constraints, and the plan attributes can
all be considered under an objective and unbiased lens. Because we’ve taken a holistic view– we have given the CFO the confidence to
act on her decisions.

Confidential – All Rights Reserved Charting the course — A framework to evaluate pension de-risking strategies | 26
7. Closing remarks
Plan sponsors have experienced a reprieve as financial pressures on DB pension plans have eased in recent years. As a result,
pension risk management strategies once again appear affordable.
In addition, there are more options available. Across the four types of solutions — design, financial, investment and insurance — plan
advisors, investment managers and insurers have created a variety of tools and techniques focused on the challenges US plan
sponsors face.
There are still challenges that can’t be ignored: the underlying issues that have driven up the costs of DB plan management have not
gone away: administrative expenses, including PBGC premiums, are climbing; increases in plan liabilities are imminent as updated
population mortality rates are adopted; the threat of changing reporting requirements remains; and the capacity of insurers to take
on corporate plan liabilities may change, or grow more expensive, over time.
Given where we stand today, we are encouraging our clients to determine their objectives, constraints and priorities; to evaluate the
alternative strategies that exist to help accomplish those objectives; and to implement a pension risk management strategy that is
aligned to corporate strategy.
We acknowledge that within the wide range of alternatives available, it can be difficult to settle on a course of action. Crucially, there
has been a void with respect to the process that should be used to evaluate options against CFO objectives in a holistic way.
Through the demonstration of our framework, we hope to empower plan sponsors with the tools to take informed action while these
risk management solutions are affordable — and before the window for change closes once again.
There are tangible benefits to starting early:
• De-risking — and re-risking — steps can be timed to take advantage of market movements.
• Liabilities can be valued on an economic basis (both interest rate and demographic assumptions) so that the transparency of the transaction cost is clearer to senior management.
• If the ultimate goal is to fully terminate the plan, plan data must exist at a level to support insurer pricing. The process to collect and clean plan data can be long and should be started 12 to 18 months before any possible transaction.
• Again, if the ultimate goal is full termination, extra lead time allows the asset portfolio to be fine-tuned such that the cost of buying and selling assets either to refine the investment allocation or purchase an insurance product is not punitive.
• Finally, the company can begin to build relationships with potential transaction partners now to better understand and discuss how to make the terms of a transaction more cost effective.
As plans inch closer to full funding, companies should harness the latest tools and proactively select the strategy that best suits their
needs. Plan sponsors should work with their advisors to identify the strategy that will carry them through the next five to ten years.
The alternative may be to lose the opportunity to act and expose the company to unnecessary risk and volatility.

Confidential – All Rights Reserved Charting the course — A framework to evaluate pension de-risking strategies | 27
Appendix A: Census data specifications
The census for both the salaried and hourly plans has been created to be representative of the demographic profile of plans with
similar attributes to those described below. Figure 1 below provides the key characteristics of the three plans.
Figure 1: Key characteristics of plans
Salaried plan Hourly plan
General description • Salaried plan with
relatively rich benefits
• Plan has been closed for
ten years; therefore,
members are relatively
older than the Hourly
Plan
• Hourly plan
Plan assets (initial)
• Plan assets
• Funding target (plan
termination basis)
• Funded ratio (plan
termination basis)
• $107m
• $150m
• $43m
• 72%
• $41m
• $52m
• $11m
• 80%
Participant information
• Proportion
• Average age
• Average benefit
In pay Not in pay
80% 20%
70 53
$1,500 $1,000
In pay Not in pay
55% 45%
70 43
$500 $250
Benefit type • Final average pay • Flat dollar plan

Confidential – All Rights Reserved Charting the course — A framework to evaluate pension de-risking strategies | 28
The distribution of gender, age, and monthly benefits of the generated plans are displayed in Figure 2 below.
Figure 2: In pay distribution — gender, age and monthly benefits
In pay Not in pay
Salaried plan Hourly plan Salaried plan Hourly plan
Gender
Female 23% 10% 21% 17%
Male 77% 90% 79% 83%
Total 100% 100% 100% 100%
Age
93—88 1% 0% — —
88—83 5% 2% — —
83—78 9% 13% — —
78—73 17% 19% — —
73—68 28% 27% 1% 0%
68—63 26% 21% 8% 1%
63—58 12% 15% 16% 2%
58—53 2% 3% 29% 6%
53—48 — — 23% 20%
48—43 — — 12% 25%
43—38 — — 8% 21%
38—33 — — 3% 12%
33—28 — — 0% 10%
28—23 — — 0% 3%
Total 100% 100% 100% 100%
Monthly benefit ($)
0—200 24% 71% 18% 69%
200—400 19% 8% 14% 13%
400—600 15% 1% 21% 6%
600—800 11% 2% 8% 5%
800—1000 5% 3% 5% 2%
1000—2000 16% 6% 17% 5%
2000—3000 2% 5% 14% 1%
3000—4000 3% 5% 3% 0%
4000—100000 4% 0% 1% 0%
Total 100% 100% 100% 100%

Confidential – All Rights Reserved Charting the course — A framework to evaluate pension de-risking strategies | 29
Appendix B: Actuarial valuation assumptions and methods
Figure 3: Summary of valuation assumptions and methods for all pension plans
Attribute Description
Funding basis Pension Protection Act (PPA), as amended
Life events applicable
to participants
Termination, retirement, and death
Mortality IRS 2008 Generational Mortality Table
Retirement age • 100% at age 65
• No early retirement
Termination T-8 Less 51 GAT-M
Alternate mortality
used for experience
projections
• Mortality table: RP-2000
• Mortality improvement: Scale BB
• Early retirement incidence: None
Benefit definition —
Normal payment form:
• Single participants
• Married participants
• Deferred to age 65 single life annuity
• Deferred to age 65 50% joint and contingent survivor life annuity
Retirement eligibility Age 65 and 5 years of service
Disability benefits None
Valuation interest
rates
At valuation date:
• 30 September 2013 PPA Full Yield Curve
Future years:
• Projected full yield curves are constructed using stochastic simulation of treasury yields and corporate
bonds spreads. Please refer to Appendix C for further details.
Employer
contributions
MAP-21 provisions were not applied.
Target yearly contributions were set to achieve fully funded status at the end of Year 5 on a termination
basis — $45m for the Salaried Plan; and $12.5m for the Hourly Plan. Regulatory contribution caps and
floors are applied throughout the projection.
Salary inflation 0%
Cost of living
adjustments
0%
Lump sum and other
payment forms
Not applicable
PBGC variable
premium liability
Premiums paid out of plan assets; the Budget Reconciliation Act of December 2013 is not reflected
ERISA asset valuation
method
Market value
Administrative
expenses
0.5%, included in funding cost

Confidential – All Rights Reserved Charting the course — A framework to evaluate pension de-risking strategies | 30
Appendix C: Capital market scenario generation
Capital market scenario files were generated for a ten-year projection period using an EY Economic Scenario Engine (ESE).
The engine uses advanced “real-world” stochastic processes, including:
• Interest rate processing (Rendleman and Bartter) that includes mean reversion (Vasicek)
• Correlated return with yield curve movements
• Spline interpolation functionality for full yield curve extrapolation
• Geometric Brownian motion processing
• Capital Asset Pricing Model (CAPM) methodology
• “Rational Expectation” economic theory
To generate the capital market scenario files parameters using data through September 2013 were used as inputs to the process. A
discussion of each of the key parameters is found below.
Source data
Figure 4 provides the fund categories and mapping data used for calibration purposes. Market index returns data was sourced from
Bloomberg; and US Treasury rate return data was sourced from the US Treasury.
Figure 4: Source of asset class data
Fund class Fund mapping
Large cap S&P 500 Total Return index
International MSCI EAFE index
Bond Barclays US Long Government/Credit Bond index
Alternative NAREIT Equity real estate investment trust index

Confidential – All Rights Reserved Charting the course — A framework to evaluate pension de-risking strategies | 31
Economic Scenario Parameters
Fund return correlations
The correlation matrix produced using index values from January 1985 through September 2013 is found in Figure 5 below.
Figure 5: Correlation matrix
Large cap International Bond fund Alternative
Large cap 1.00
International 0.69 1.00
Bond fund 0.12 0.10 1.00
Alternative 0.58 0.49 0.16 1.00
Risk premium and volatility
Figure 6 below provides the risk premia and volatility of returns used to generate asset returns. The large cap class risk premium is
set to 4.5%. The risk premia for the remaining equity classes are set using the correlation of the volatilities between the large cap
class return and the other asset class returns. The risk premia is inclusive of dividend yields.
Figure 6: Risk premium and standard deviation
Risk premium
Standard
deviations
Large cap 4.50% 15.61%
International 6.24% 18.11%
Bond fund 0.30% 8.75%
Alternative 3.09% 18.57%
* The standard deviations are produced using fund returns from January 1985 through September 2013.
Treasury yield curve and mean reversion targets
Figure 7 below provides the beginning yield, the standard deviation, and the mean reversion target assumptions.
Figure 7: Treasury yield curve and mean reversion targets
Treasury type Beginning yield*
Standard
deviation**
Mean reversion
target
1 year 0.12% 32.51% 3.50%
7 years 2.22% 22.86% 4.25%
30 years 3.79% 14.61% 5.00%
* The Treasury yield is the monthly rate for September 2013.
** The standard deviation is calculated using Treasury return data from January 1985 through September 2013.
The reversion strength assumed in the Vasicek model was 20.0%. The maximum treasury yield parameter was set to 25.0%.
Investment expense
The investment expense is assumed to be 30 basis points for Treasury bonds, and 50 basis points for the remaining asset classes.
The investment expense assumptions are reflective of the market quotes for similar managed asset volume.

Confidential – All Rights Reserved Charting the course — A framework to evaluate pension de-risking strategies | 32
Summary statistics
After updating the assumptions used to generate the scenario file, key statistics were developed for each fund category and de-
risking strategy (see details of each strategy in Appendix D). Figures 8, 9 and 10 below summarize the calculated statistics for the
generated scenarios over five year and ten year projection periods.
Figure 8: Treasury rate statistics
Treasury type
Average yield rate
at year 5
Average yield rate
at year 10
Standard deviation
of yield rates at
year 10
1—year 2.41% 3.16% 1.81%
7—year 3.59% 4.05% 1.55%
30—year 4.61% 4.90% 1.16%
Figure 9: Equity and fixed fund return statistics
Fund Class
Average return
over five year
projection
Average return
over ten year
projection
Standard deviation
of returns over ten
years
Large cap 6.76% 7.25% 5.79%
International 8.65% 9.08% 6.79%
Bond fund 1.93% 2.62% 2.70%
Alternative 5.38% 5.86% 6.72%
Figure 10: Nominal return by strategy statistics
Strategy
Average return
over five year
projection
Average return
over ten year
projection
Standard deviation
of returns over ten
years
Static allocation 5.01% 5.63% 3.72%
Graded allocation 3.76% 3.45% 2.65%
Traditional LDI 3.63% 3.44% 2.55%
Insured solution 4.39% 4.24% 1.61%
PPA treasury high quality market corporate bond yield curve
For liability valuation throughout the projection, we forecasted the High Quality Market (HQM) corporate bond spreads using a linear
explanatory model whose main purpose is to create spreads that are consistent and reactive to (1) changes in interest rate levels and
(2) changes in the economic environment as reflected by equity returns and captured by the S&P 500 total index return.

Confidential – All Rights Reserved Charting the course — A framework to evaluate pension de-risking strategies | 33
To calibrate the model, we used economic data from 1985 to September 2013. Figure 11 below compares the estimated spread
against actual spreads.
Figure 11
Estimated vs. actual 30-year corporate spread
Figure 12 below shows historical spreads and the range of forecasted spreads.
Figure 12
Historical and forecasted 30-year corporate bond spread
0.0%
0.5%
1.0%
1.5%
2.0%
2.5%
3.0%
19
85
19
86
19
87
19
88
19
89
19
90
19
91
19
92
19
93
19
94
19
95
19
96
19
97
19
98
19
99
20
00
20
01
20
02
20
03
20
04
20
05
20
06
20
07
20
08
20
09
20
10
20
11
20
12
20
13
Actual 30-year Corporate Spread Estimated 30-year Corporate Spread
0.0%
0.5%
1.0%
1.5%
2.0%
2.5%
3.0%
19
85
19
87
19
89
19
91
19
93
19
95
19
97
19
99
20
01
20
03
20
05
20
07
20
09
20
11
20
13
Historical 30-year corporate spread
0.0%
0.5%
1.0%
1.5%
2.0%
2.5%
3.0%
20
14
20
24
Forecasted 30-year corporate spread

Confidential – All Rights Reserved Charting the course — A framework to evaluate pension de-risking strategies | 34
Appendix D: Asset liability management modeling
Initial asset allocation
The initial asset allocation for all de-risking strategies is 60% in return-seeking assets and 40% in risk-protection assets, which is
reflective of the current allocation of similar plans today. Figure 13 below provides the starting asset allocations in each strategy.
Figure 13: initial asset allocations in each strategy
Strategy Large Cap International Alternative Bond Fund
30-yr Treasury
bond Insurance
Static allocation 40% 15% 5% 40% — —
Graded allocation 40% 15% 5% 40% — —
Traditional LDI 40% 15% 5% 40%* —
Insured solution 40% 15% 5% — — 40%
* For Traditional LDI, the combined allocation in the bond fund and 30-year Treasury is 40%. The specific allocations within each
class are determined based on a dollar-duration matching strategy (see details below).
Additional assumptions
• Target employer contributions remain constant within all strategies throughout the projection, with regulatory caps and floors applicable as needed.
• When the plan is a 100% funded on a termination basis, the plan is fully terminated through a buy-out transaction.
De-risking strategy parameterization
Strategy 1 — static allocation
The target asset allocation is unchanged throughout the strategy at the current mix: 60% return-seeking assets and 40% risk-
protection assets. When the portfolio is more than 5% outside the target allocation at any December 31, the portfolio is rebalanced
to 60/40 the following January 1. For simplicity, rebalancing occurs once annually for all strategies. The risk-protection asset is the
Barclays Long GC (Barclays Long Government/Credit Index)..
Strategy 2 — graded allocation
In this strategy, the target asset allocation is set throughout the projection period based on the funded status (defined on a PPA
basis) at the end of the current year. As the plan’s funded status improves, the allocation to the risk-protection asset increases;
conversely, if the plan’s funded status deteriorates, the allocation to the risk-protection asset decreases. The portfolio is rebalanced
once annually on January 1. The risk-protection asset is the same as that in the static allocation strategy: the Barclays Long GC. The
following figure illustrates the linear rebalancing path (the ‘glide path’) followed in the model.

Confidential – All Rights Reserved Charting the course — A framework to evaluate pension de-risking strategies | 35
Figure 14:
Glide path asset allocation
Strategy 3 — traditional LDI
Similar to the graded allocation strategy, the target asset allocation is determined using a glide-path. The difference is that the risk-
protection asset is composed of two assets: the 30-year Treasury bill and the Barclays Long GC. The relative weighting is set to
match the dollar duration of the liability. No swaps, derivatives, or other complex financial instruments are used to achieve dollar
duration. Short-selling is not allowed.
Strategy 4 — insured solution
Similar to the graded allocation and traditional LDI strategies, the target asset allocation is determined using a glide-path. However,
there are two major differences. First, the risk-protection asset is solely insurance coverage. There is no direct investment in bond
funds or Treasury bonds. The insurance product is designed to perfectly hedge the PPA liability under valuation assumptions,
effectively transferring all the economic risks embedded in the plan. The plan sponsor only retains non-economic risks such as the
deviation from expected mortality and early retirement incidence. Second, re-risking is not allowed. Once the plan purchases
insurance coverage for a percentage of the liabilities, it cannot reduce the insurance coverage and increase the investment in return-
seeking assets.
Figure 15 below summarizes the key characteristics for each de-risking strategy.
Figure 15: Summary of parameterization of strategies
Strategy Risk-protection asset Rebalancing Glide path Re-risking
Static allocation Barclays US Long Government/Credit Bond index × ×
Graded allocation Barclays US Long Government/Credit Bond index
Traditional LDI Barclays US Long Government/Credit Bond index and 30-
year Treasury bonds
Insured solution Fixed income portfolio that perfectly hedges the economic
basis of the liabilities ×
60%
40%
100%
Initial FundedStatus
Fully Funded
Ass
et
allo
ca
tio
n
Funded status
Risk-seeking assets Risk-protection assetReturn-seeking assets
Initial funded
status
Fully
funded

Confidential – All Rights Reserved Charting the course — A framework to evaluate pension de-risking strategies | 36
Estimating the cost of plan termination
The cost of plan termination can be expressed as a multiple of the liabilities on either a PPA basis or a GAAP accounting basis — and
this multiple can be used as the funding target when constructing the glide-path. In our example, the company is most concerned
about the volatility of cash contributions that are driven by the liabilities calculated on a PPA basis; therefore, we will express our
target in those terms.
Indicative pricing for the company’s two plans showed that, in today’s environment, the termination multiples are approximately
120% of the PPA liabilities.
It is important to adjust this metric over time to account for changes in the economic environment. To accomplish this, we use an
algorithm that measures changes in the US Treasury curve and the S&P 500 to forecast their effects on these prices and have
applied this algorithm throughout the projection period.

Confidential – All Rights Reserved Charting the course — A framework to evaluate pension de-risking strategies | 37
Appendix E: Model analytics
Strategies are analyzed under 2,000 stochastic economic scenarios (for further details, see Appendix C). Plan assets and liabilities
were projected until either the available assets were sufficient to fund termination liabilities, or the 10 year projection horizon was
reached.
To measure the relative performance of each strategy in each plan, we focused on the following metrics:
• Years to achieve full plan termination
• Total employer contributions required such that available assets equal the termination premium
• Unfunded termination liability in a given projection year
• Total cost of plan termination, defined as the cumulative contributions made to the plan, plus any shortfall between plan assets and the funding target at the end of the projection period.
The following exhibits show the results of our analytics by metric for each plan.
Years to achieve full plan termination
Figures 16 and 17 show the percentage of scenarios that achieve full termination prior to, or during a given year on a
cumulative basis.
Figure 16
Cumulative termination rate — salaried plan
0%
10%
20%
30%
40%
50%
60%
70%
80%
90%
100%
1 2 3 4 5 6 7 8 9 10
Cu
mu
lati
ve
te
rmin
ati
on
ra
te
Year
Static allocation Graded allocation Traditional LDI Insured solution

Confidential – All Rights Reserved Charting the course — A framework to evaluate pension de-risking strategies | 38
Figure 17
Cumulative termination rate — hourly plan
0%
10%
20%
30%
40%
50%
60%
70%
80%
90%
100%
1 2 3 4 5 6 7 8 9 10
Cu
mu
lati
ve
te
rmin
ati
on
ra
te
Year
Static allocation Graded allocation Traditional LDI Insured solution

Confidential – All Rights Reserved Charting the course — A framework to evaluate pension de-risking strategies | 39
Aggregate employer contributions
Employer contributions were set such that available assets would be sufficient to fund the termination premium at the end of five
years. Budgeted contributions remained constant between both scenarios and strategies.
Figures 18 and19 illustrate the percentage of scenarios under which, at the end of the 10-year projection period, the plan sponsor
had been required to remit less than, equal to, or greater than budgeted amounts. Negative values reflect the average savings in
scenarios where the cost of plan termination was less than that budgeted; positive values reflect the average additional contributions
that were required over and above budgeted amounts.
Figure 18
10 year aggregate contribution — Salaried Plan
Figure 19
10 year aggregate contribution — Hourly Plan
$(17.1)m $(16.3)m $(15.4)m $(15.4)m
$23.8m $22.7m $20.5m $17.4m
0%
10%
20%
30%
40%
50%
60%
70%
80%
90%
100%
Static allocation Graded allocation Traditional LDI Insured solution
Pe
rce
nta
ge
of
sce
na
rio
s
Within Budget At Budget Over Budget
$(5.3) $(5.2) $(4.3)m
$(5.0)m
$7.5m $7.3m $6.3m
$5.9m
0%
10%
20%
30%
40%
50%
60%
70%
80%
90%
100%
Static allocation Graded allocation Traditional LDI Insured solution
Pe
rce
nta
ge
of
sce
na
rio
s
Within Budget At Budget Over BudgetWithin budget At budget Over budget
Within budget At budget Over budget

Confidential – All Rights Reserved Charting the course — A framework to evaluate pension de-risking strategies | 40
Unfunded termination liability
Figures 20 and 21 illustrate the percentage of scenarios that achieved full termination at the end of Year 5 versus those that did not.
For those cases where the available assets were insufficient to cover the termination premium, Figures 20 and 21 show the average
and standard deviation of the funded status on a termination basis.
Figure 20
Year 5 funded status — Salaried Plan
Figure 21
Year 5 funded status — Hourly Plan
83% +/-1.13% 86% +/-1.15% 87% +/-1.02% 88% +/-0.91%
0%
10%
20%
30%
40%
50%
60%
70%
80%
90%
100%
Static allocation Graded allocation Traditional LDI Insured solution
Pe
rce
nta
ge
of
sce
na
rio
s
Fully terminated Not terminated
83% +/-1.1% 85% +/-1.18% 89% +/-0.66%
87% +/-0.98%
0%
10%
20%
30%
40%
50%
60%
70%
80%
90%
100%
Static allocation Graded allocation Traditional LDI Insured solution
Pe
rce
nta
ge
of
sce
na
rio
s
Fully terminated Not terminated
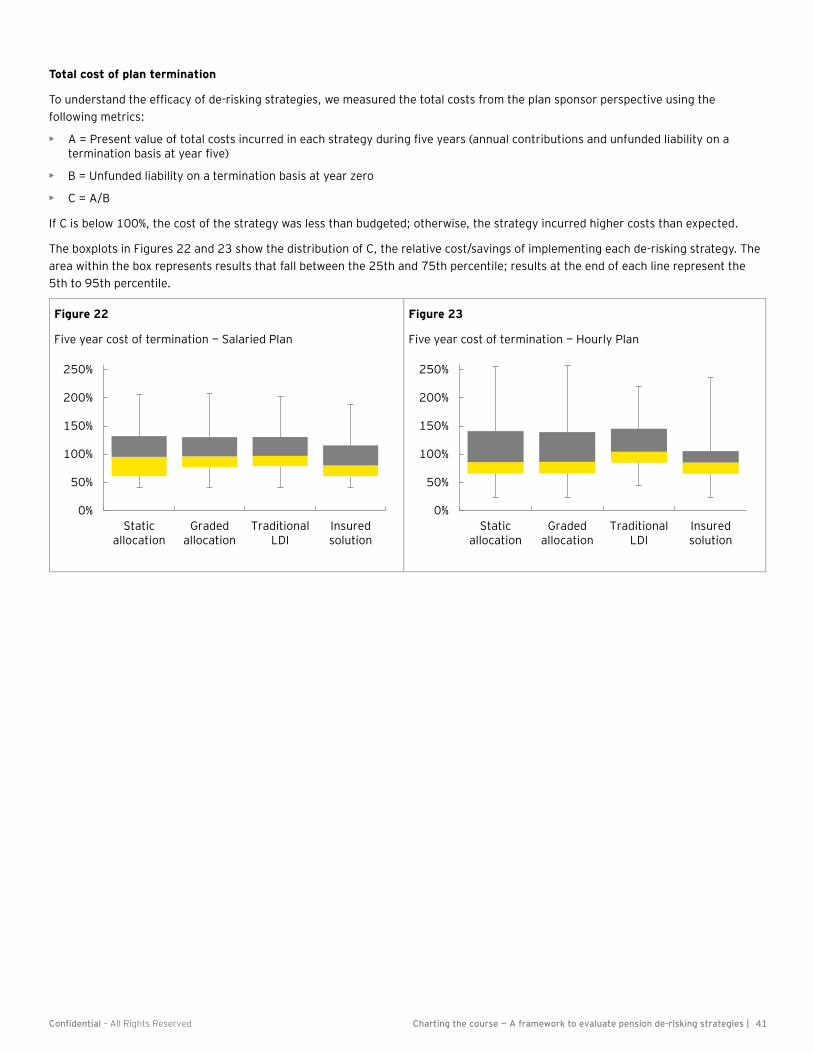
Confidential – All Rights Reserved Charting the course — A framework to evaluate pension de-risking strategies | 41
Total cost of plan termination
To understand the efficacy of de-risking strategies, we measured the total costs from the plan sponsor perspective using the
following metrics:
• A = Present value of total costs incurred in each strategy during five years (annual contributions and unfunded liability on a termination basis at year five)
• B = Unfunded liability on a termination basis at year zero
• C = A/B
If C is below 100%, the cost of the strategy was less than budgeted; otherwise, the strategy incurred higher costs than expected.
The boxplots in Figures 22 and 23 show the distribution of C, the relative cost/savings of implementing each de-risking strategy. The
area within the box represents results that fall between the 25th and 75th percentile; results at the end of each line represent the
5th to 95th percentile.
Figure 22
Five year cost of termination — Salaried Plan
Figure 23
Five year cost of termination — Hourly Plan
0%
50%
100%
150%
200%
250%
Staticallocation
Gradedallocation
TraditionalLDI
Insuredsolution
0%
50%
100%
150%
200%
250%
Staticallocation
Gradedallocation
TraditionalLDI
Insuredsolution

EY | Assurance | Tax | Transactions | Advisory About EY EY is a global leader in assurance, tax, transaction and advisory services. The insights and quality services we deliver help build trust and confidence in the capital markets and in economies the world over. We develop outstanding leaders who team to deliver on our promises to all of our stakeholders. In so doing, we play a critical role in building a better working world for our people, for our clients and for our communities. EY refers to the global organization, and may refer to one or more, of the member firms of Ernst & Young Global Limited, each of which is a separate legal entity. Ernst & Young Global Limited, a UK company limited by guarantee, does not provide services to clients. For more information about our organization, please visit ey.com. Ernst & Young LLP is a client-serving member firm ofErnst & Young Global Limited operating in the US. EY is a leader in serving the global financial services marketplace Nearly 43,000 EY financial services professionals around the world provide integrated assurance, tax, transaction and advisory services to our asset management, banking, capital markets and insurance clients. In the Americas, EY is the only public accounting organization with a separate business unit dedicated to the financial services marketplace. Created in 2000, the Americas Financial Services Office today includes more than 6,900 professionals at member firms in over 50 locations throughout the US, the Caribbean and Latin America. EY professionals in our financial services practices worldwide align with key global industry groups, including EY’s Global Wealth & Asset Management Center, Global Banking & Capital Markets Center, Global Insurance Center and Global Private Equity Center, which act as hubs for sharing industry-focused knowledge on current and emerging trends and regulations in order to help our clients address key issues. Our practitioners span many disciplines and provide a well-rounded understanding of business issues and challenges, as well as integrated services to our clients. With a global presence and industry-focused advice, EY’s financial services professionals provide high-quality assurance, tax, transaction and advisory services, including operations, process improvement, risk and technology, to financial services companies worldwide. © 2016 Ernst & Young LLP. All Rights Reserved. SCORE: CK0802 1601-1812936 This material has been prepared for general informational purposes only and is not intended to be relied upon as accounting, tax or other professional advice. Please refer to your advisors for specific advice.
ey.com
Pacific Life Insurance Company commissioned EY to write this report. Adam Berk, Chris Raham, Jennifer Haid, Phil Hur and Francisco Orduña are not employees of, nor affiliated with, Pacific Life.
Content does not represent investment advice or provide an opinion regarding the fairness of any transaction to any and all parties. The opinions expressed are valid only for the purpose stated herein and as of the date hereof. Public information and industry and statistical data are from sources Ernst & Young deems to be reliable, and are not guaranteed as to accuracy.
Pacific Life Insurance Company is licensed to issue life insurance and annuity products in all states except New York. Product availability and features may vary by state. Each insurance company is solely responsible for the financial obligations accruing under the products it issues.