Charting Federal Costs and BeneFits - U.S. Chamber of Commerce
16
CHARTING FEDERAL COSTS AND BENEFITS Environment, Technology & Regulatory Affairs Division
Transcript of Charting Federal Costs and BeneFits - U.S. Chamber of Commerce

Charting Federal Costs and BeneFits
Environment, Technology & Regulatory Affairs Division

Page 2
ACKNOWLEDGMENTS
AUTHORSWilliam L. Kovacs, Senior Vice President, Environment, Technology & Regulatory Affairs
Joseph M. Johnson, Executive Director, Federal Regulatory Process Review & Analysis
Keith W. Holman, Senior Policy Counsel and Managing Director
The authors work in the U.S. Chamber’s Environment, Technology & Regulatory Affairs Division.
The U.S. Chamber of Commerce is the world’s largest business federation representing the interests of more than 3 million businesses of all sizes, sectors, and regions, as well as state and local chambers and industry associations.
Copyright © 2014 by the United States Chamber of Commerce. All rights reserved. No part of this publication may be reproduced or transmitted in any form—print, electronic, or otherwise—without the express written permission of the publisher.
Page 1
The U.S. Chamber has highlighted over the past several years specific problems associated with the federal regulatory process, e.g., procedural barriers to securing permits for new projects, federal agencies taking control of state environmental programs, the impact that new regulations can have on employment, and the legal tactic used by advocacy groups known as “sue and settle.”
Understanding the roadblocks in the permitting process and their impact
Understanding federalism: How the federal government takes over state permitting
Understanding the impact of regulations on jobs
Understanding how private parties control agencies
Page 2
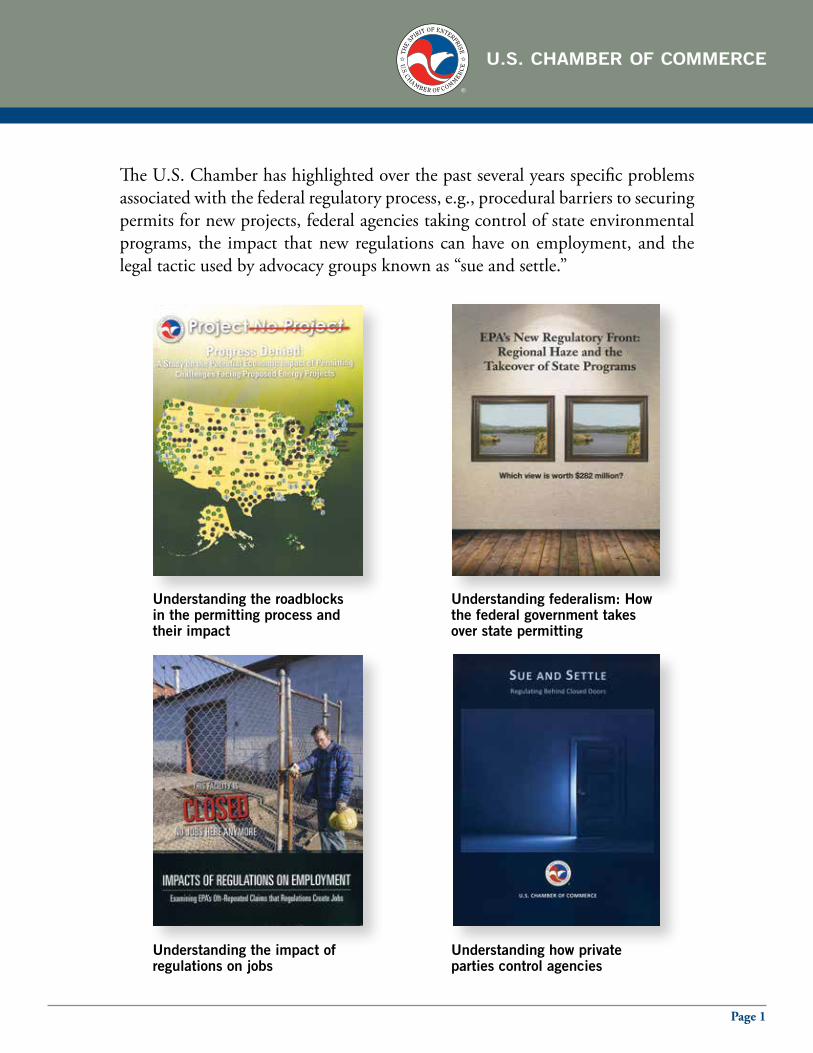
The U.S. Chamber has analyzed how to make better sense of the many regulations that agencies write each year. It sought to discover and understand the meaning and cumulative impact of each of the many thousands of regulations finalized over the past few decades.
Figure 1. Cumulative Federal Rules Since 1976
Source: Federal Register
Figure 2. Significant Final Rules: 2000–2013
Source: Federal Register
Note: “Significant” rules are defined by E.O. 12866 as more than $100 million in cost or of a novel character.
0
50,000
100,000
150,000
200,000
0
100
200
300
400
500
0
50,000
100,000
150,000
200,000
0
100
200
300
400
500
Num
ber o
f Rul
es D
eem
ed S
igni
fican
t Und
er E
.O. 1
2866
n Final Rulesn Cumulative Final Rules
290 297 284 337 321 259 163 180 427 368 424 427 359 332
2000
2001
2002
2003
2004
2005
2006
2007
2008
2009
2010
2011
2012
2013
1976
1982
1988
1994
2000
2006
2013

Page 3
A careful analysis of the federal agencies’ own economic data, summarized in the following charts, clearly identifies the rules that impose the largest nationwide cost.
The data in Figure 3 show that from 2000 to 2013 a total of 30 rules from executive branch agencies had a compliance cost of more than $1 billion.1
Figure 3. Rules With Annual Cost >$1 Billion: 2000–2013EPA vs. All Other Federal Agencies
Sources: EPA rules from agency RIAs: other agencies’ rules from OMB Draft 2013 and Draft 2014 Reports to Congress on Costs and Benefits of Regulations
1. Independent regulatory agencies (e.g., the Federal Communications Commission (FCC), Securities and Exchange Commission (SEC), and Commodities Futures Trading Commission (CFTC)) are not subject to executive branch oversight by the Office of Management and Budget (OMB) and do not routinely perform RIAs as directed by OMB Circular A-4 guidance on cost-benefit analysis. Consequently, even in the cases when independent regulatory agencies estimate the costs and benefits of their regulations, they generally do not adhere to the standards established and enforced by OMB, and the cost estimates are often not complete or comparable. See Table 3 for a list of recent independent agency regulations that potentially exceed the $1 billion threshold.
$0
$20
$40
$60
$80
$100
$0
$20
$40
$60
$80
$100
17 Rules$90.3 Billion
13 Rules$19.1 Billion
All Other Agency Rules EPA Rules
$ Bi
llion
s 20
13

Page 4
Seventeen of those rules were written by EPA, while the remaining 13 were issued by other executive branch agencies. Despite thousands of final rules issued by federal agencies each year, only a handful of rules carry the greatest costs and regulatory impact.
Figure 4. Rules Costing More Than $1 Billion by Agency2000–2013
Sources: EPA rules from agency RIAs; other agencies’ rules from OMB Draft 2013 and Draft 2014 Reports to Congress on Costs and Benefits of Regulations
$0
$20
$40
$60
$80
$100
$0
$20
$40
$60
$80
$10017 Rules
7 Rules
EPA DOT DOE DOL HHS HUD
2 Rules 2 Rules1 Rule1 Rule
$ Bi
llion
s 20
13

Page 5
Focusing on EPA as the primary driver of billion-dollar rules and their costs, the Chamber examined EPA’s rulemaking record to determine the number of rules for which EPA estimated compliance costs.
Figure 5. Total Number of EPA Final Rules2000–2013
Sources: Federal Register and agency RIAs
The annual costs imposed by the rules for which EPA estimated costs have risen sharply in recent years.
Figure 6. Annualized Cost of New EPA Rules2000–2013
Sources: Federal Register and agency RIAs
$0
$20
$40
$60
$80
$100
$0
$20
$40
$60
$80
$100
Final Rules With No Estimated Compliance Costs
98%
Final Rules With Compliance Cost Estimates
2%
$0
$5
$10
$15
$20
$25
$0
$5
$10
$15
$20
$25
2000
2001
2002
2003
2004
2005
2006
2007
2008
2009
2010
2011
2012
2013
$ Bi
llion
s 20
13
Total Number of Final Rules in Period: 7,615Total Number of Rules With Estimated Compliance Costs: 166
Page 6
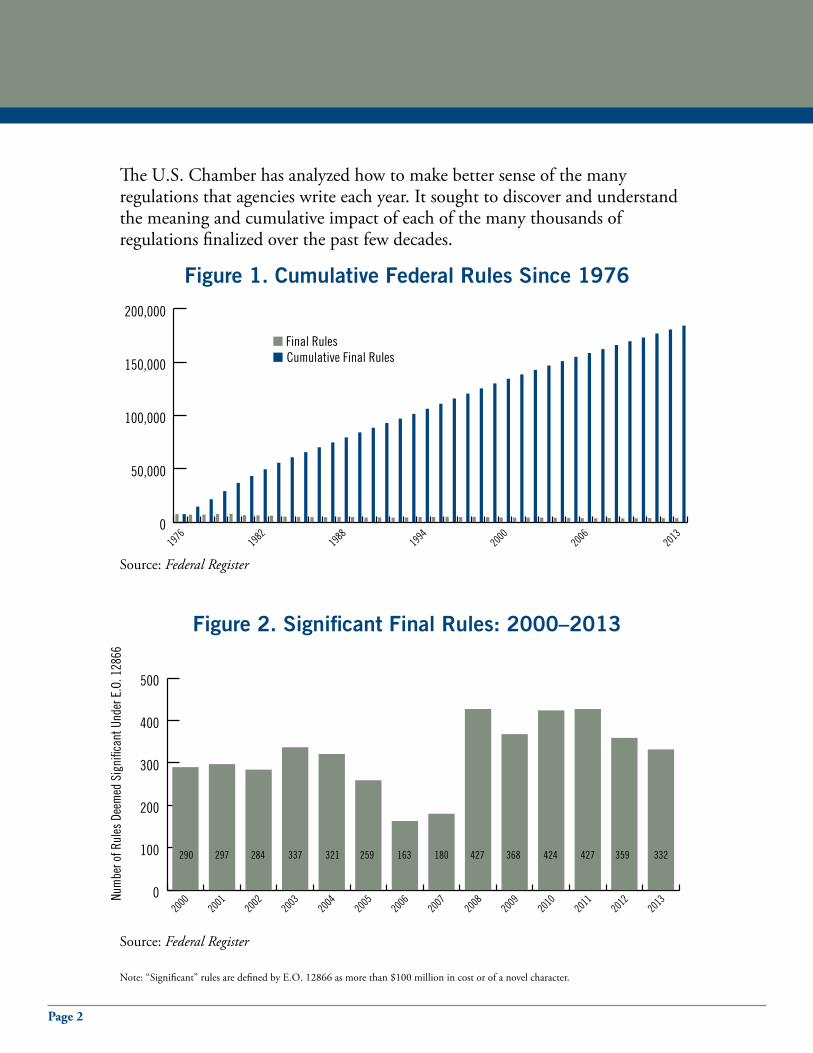
While EPA does not finalize billion-dollar rules every year, such rules have been the driver of total costs imposed by the agency. Years with lower total costs tend to be those with no billion-dollar plus rules. Further, EPA has been writing more billion-dollar rules, each with greater costs, than ever before.
Figure 7. EPA New Annual Regulatory Costs by Size of Rule2000–2013
Sources: Federal Register and agency RIAs
$0
$5
$10
$15
$20
$25
$0
$5
$10
$15
$20
$25
n Cost of All Rules < $1Billionn Cost of All Rules > $1Billion
$ Bi
llion
s 20
13
2000
2001
2002
2003
2004
2005
2006
2007
2008
2009
2010
2011
2012
2013

Page 7
EPA justifies high regulatory costs of its biggest rules with even greater claimed benefits. However, the benefits are more concentrated in just a handful of rules. Virtually all the benefits come from reductions of a single pollutant, PM2.5, which is often not even the pollutant that EPA cites as the justification for promulgating a regulation but, rather, a pollutant incidentally reduced by the primary regulatory requirements.
Figure 8. New EPA Rule Annual Benefits97.2% of All EPA Benefits From 2000 to 2013 Are From PM2.5
Sources: Federal Register and agency RIAs
$ Bi
llion
s 20
13
$0
$30
$60
$90
$120
$150
3 Rules
2 Rules
2 Rules 2 Rules
3 Rules
3 Rules
6 Rules
2 Rules
5 Rules
1 Rule
6 Rules
5 Rules
3 Rules
3 Rules
2000
2001
2002
2003
2004
2005
2006
2007
2008
2009
2010
2011
2012
2013
n Non-PM Benefitsn PM Benefits

Page 8
While EPA claims significant co-benefits from reducing PM2.5, nationwide emissions of the pollutant are below the national standard set by EPA in 2013.
Figure 9. PM2.5 Air Quality, 2000–201233% Decrease in National Annual Average PM2.5 Levels
Source: EPA
6
7
8
9
10
11
12
13
14
15
16
2013 NAAQS PM2.5 Standard
1997–2012 NAAQS PM2.5 Standard
National Annual Average
2000
2001
2002
2003
2004
2005
2006
2007
2008
2009
2010
2011
2012
Conc
entra
tion,
ug/
m3

Page 9
Recommendations
• Transparency must be improved: The key to making good regulatory decisions is transparency. The highest level of transparency must be applied to those few rules that have the greatest impact on the nation. For the regulatory system to work properly, regulators must get the facts, the economics, and the science correct; otherwise, the regulatory process is merely a political process. Agencies should be required to inform the public of pending regulatory decisions on high impact rules earlier in the process, and extensive data, assessment, and documentation should be provided at the earliest stages of rule development.
• Independent agencies should be held to the same standards as executive branch agencies: Independent regulatory agencies should be held to identical standards as executive branch agencies for high impact rulemakings. Only Congress has the authority to require independent agencies to comply with the same standards required of all other regulatory agencies.
• Congress must provide clear legislative standards: Congress must provide clear statutory directives to the agencies, conduct rigorous oversight based on those directives, and set a more rigorous standard of review that the courts must use in evaluating agency action.
• Evaluation of the impact on employment must be undertaken: Congress clearly recognized that regulations—particularly environmental regulations—impose significant burdens on businesses and workers and need to be clearly analyzed. For this reason, Congress requires EPA to evaluate potential nationwide losses or shifts in employment because of its regulations. Unfortunately, the agency has never done so. Congress needs to know whether EPA’s rules are causing losses or shifts in employment, especially in areas that have already been hit hard economically. All agencies, including independent regulatory agencies, should be required to analyze employment impacts for high impact rules.
• Citizens must be allowed to participate in the regulatory process: Citizens must be welcomed into the regulatory process by being given access to all the information used by agencies to make decisions and given the right to challenge agency data and decisions—rights they do not have today.

Page 10
Table 1. 17 EPA Rules With Costs Greater Than $1 Billion: 2000–2013 (in millions of 2013 dollars)
Rule Title Year Annual Cost ($)
Annual PM2.5 Benefits ($)
Annual Non-PM Benefits ($)
2017 and Later Model Year Light-Duty Vehicle GHG Emissions and CAFE Standards* 2012 $11,372 $1,737 $17
Light-Duty Vehicle GHG Emission Standards and CAFE Standards* 2010 11,277 909 985
National Emission Standards and Standards of Performance: Hazardous Air Pollutants From Coal- and Oil-Fired Electric Utility Steam Generating Units
2012 10,511 61,860 400
National Ambient Air Quality Standards for Ozone 2008 9,216 5,788 697
Clean Air Fine Particle Implementation Rule 2007 8,917 93,167 0
National Ambient Air Quality Standards for Particulate Matter 2006 7,187 19,964 0
Heavy-Duty Engine and Vehicle Standards and Highway Diesel Fuel Sulfur Control Requirements 2001 5,590 91,836 1,810
Tier 2 Motor Vehicle Emission Standards and Gasoline Sulfur Control Requirements 2000 5,458 33,433 355
Clean Air Interstate Rule 2005 4,791 114,463 399
Interstate Ozone Transport: Response to Court Decisions on the NOx 2004 3,968 3,687 0
Regional Haze Regulations and Guidelines for Best Available Retrofit Technology (BART) Determinations 2005 1,966 8,538 307
Control of Emissions From New Marine Compression-Ignition Engines at or Above 30 Liters per Cylinder 2010 2,079 79,124 674
National Ambient Air Quality Standards for Lead 2008 1,894 1,073 736
Control of Emissions of Air Pollution From Nonroad Diesel Engines and Fuel 2004 1,879 51,371 1,301
NESHAP for Major Sources: Industrial, Commercial, and Institutional Boilers and Process Heaters 2011 1,718 37,315 0
Regulation of Fuels and Fuel Additives: Renewable Fuel Standard Program 2007 1,442 0 0
Primary National Ambient Air Quality Standard for Sulfur Dioxide 2010 1,079 29,222 2
TOTAL $90,344 $633,487 $7,683
Sources: Federal Register records and rule RIAs* We include both the 2010 and 2012 EPA/DOT joint GHG/CAFE standards rules in the database. The costs of the two rules are not additive as the model years covered are consecutive and do not overlap. Further, the annual costs shown above for the 2010 rule covering model years 2012 through 2016 are for the 2014 model year, the most recent modeled by EPA in the rulemaking. Annual costs from this rule peak in 2016 at nearly 50% greater than shown above. While costs of the two separate rules are not strictly additive as shown (because the costs shown above are specific model year costs), the annual costs are also not mutually exclusive. There are carryover effects of the 2010 rule that impose costs going forward, and because the 2017 and later model year rule is a significant change in requirements, annualized compliance costs have likely already begun to be accrued by automakers to get into compliance for 2017.

Page 11
Table 2. 13 Other Agency Rules With Costs Greater Than $1 Billion: 2000–2013
(in millions of 2013 dollars)
Rule Title Agency Year Annual Cost ($)
Annual Benefits ($)
Statutory Exemption for Provision of Investment Advice DOL 2011 $3,893 $13,887
Hours of Service Drivers; Driver Rest and Sleep for Safe Operation DOT 2003 1,677 878
Advanced Air Bags: Response to Petitions Federal Motor Vehicle Safety Standards; Occupant Crash Protection DOT 2000 1,527 1,107
Updates to Electronic Transactions (Version 5010) (CMS-0009-F) HHS 2009 1,342 2,740
Energy Efficiency Standards for Pool Heaters and Direct Heating Equipment and Water Heaters DOE 2010 1,306 1,763
Tire Pressure Monitoring Systems DOT 2002 1,244 859
Electronic Stability Control (ESC) DOT 2007 1,164 10,941
Roof Crush Resistance DOT 2009 1,140 829
Ejection Mitigation DOT 2011 1,140 2,464
Positive Train Control DOT 2010 1,135 45
Medicaid, Exchanges, and Children’s Health Insurance Programs: Eligibility, Appeals, and Other Provisions Under the Affordable Care Act HHS 2013 1,331 Not estimated
Real Estate Settlement Procedures Act (RESPA); To Simplify and Improve the Process of Obtaining Mortgages and Reduce Consumer Costs HUD 2008 1,125 2,930
Energy Efficiency Standards for Residential Refrigerators, Refrigerator-Freezers, and Freezers DOE 2011 1,069 2,337
TOTAL $19,093 $40,780
Sources: OMB Draft 2013 and Draft 2014 Annual Reports to Congress

Page 12
Table 3. Recent Independent Agency Rules With Annual Costs in Excess of $1 Billion
2012–2014
Rule Title Year Agency
Regulatory Capital Rules: Regulatory Capital, Enhanced Supplementary Leverage Ratio Standards for Certain Bank Holding Companies and Their Subsidiary Insured Depository Institutions
2014 OCC, Fed, and FDIC
Prohibitions and Restrictions on Proprietary Trading and Certain Interests in, and Relationships With, Hedge Funds and Private Equity Funds 2013 FDIC, OCC, SEC, and Fed
Integrated Mortgage Disclosures Under the Real Estate Settlement Procedures Act (Regulation X) and the Truth in Lending Act (Regulation Z) 2013 CFPB
Risk-Based Capital Guidelines: Market Risk 2012 OCC, Fed, and FDIC
Protection of Cleared Swaps Customer Contracts and Collateral; Conforming Amendments to the Commodity Broker Bankruptcy Provisions 2012 CFTC
Conflict Minerals 2012 CFTC
Disclosure of Payments by Resource Extraction Issuers 2012 SEC

Page 13
Notes and Methodology for Regulatory Costs
• All costs are agency estimates. In the case of EPA, they are from Regulatory Impact Analyses (RIAs); for other agencies, they are taken from OMB’s 2013 and 2014 Annual Report to Congress on the Costs and Benefits of Regulations.
• Costs are not necessarily cumulative, as some rules, such as the two CAFE standards and vehicle GHG reduction rules, cover two separate time periods and requirements to build upon the prior rule.
• All rules included in the cost estimates are from executive branch agencies; all rules from independent regulatory agencies are not covered, including those from the FCC, CFTC, SEC, FDIC, and Federal Reserve.
• Only rules for which the promulgating agency conducted a quantitative cost-benefit analysis are included in the regulatory cost and benefit figures.
• All costs and benefits for EPA rules are reported using a 7% discount rate and, where appropriate, calculated as the mean of the upper and lower bound when the agency reported a range of values.

1615 H Street, NW | Washington, DC 20062-2000www.uschamber.com