Charter Schools and Labor Market Outcomes · PDF fileCharter Schools and Labor Market Outcomes...
77
Charter Schools and Labor Market Outcomes * Will Dobbie Princeton University and NBER Roland G. Fryer Harvard University and NBER July 2016 Abstract We estimate the impact of charter schools on early-life labor market outcomes using admin- istrative data from Texas. We find that, at the mean, charter schools have no impact on test scores and a negative impact on earnings. No Excuses charter schools increase test scores and four-year college enrollment, but have a small and statistically insignificant impact on earnings, while other types of charter schools decrease test scores, four-year college enrollment, and earn- ings. Moving to school-level estimates, we find that charter schools that decrease test scores also tend to decrease earnings, while charter schools that increase test scores have no discernible impact on earnings. In contrast, high school graduation effects are predictive of earnings effects throughout the distribution of school quality. The paper concludes with a speculative discussion of what might explain our set of facts. * We thank the Texas Education Research Center at the University of Texas at Austin’s Ray Marshall Center for providing the data used in our analysis. We also thank David Card, Raj Chetty, Matt Davis, Hank Farber, Edward Glaeser, Hilary Hoynes, Lawrence Katz, Pat Kline, Michal Koles´ ar, Alan Krueger, Alex Mas, Parag Pathak, Jesse Rothstein, Adam Sacarny, Jesse Shapiro, Doug Staiger, Chris Walters, Danny Yagan, Seth Zimmerman, and numerous seminar participants for helpful comments and suggestions. Elijah De la Campa, Tanaya Devi, Matt Farber, Samsun Knight, William Murdock III, Namrata Narain, Rucha Vankudre, Dan Van Duesen, Jessica Wagner, and Brecia Young provided exceptional research assistance. Correspondence can be addressed to the authors by e-mail at [email protected] [Dobbie] or [email protected] [Fryer]. The research presented here utilizes confidential data from the State of Texas supplied by the Education Research Center (ERC) at The University of Texas at Austin. The views expressed are those of the authors and should not be attributed to the ERC or any of the supporting organizations mentioned herein, including The University of Texas at Austin or the State of Texas. Any errors are attributable to the authors.
Transcript of Charter Schools and Labor Market Outcomes · PDF fileCharter Schools and Labor Market Outcomes...

Charter Schools and Labor Market Outcomes ∗
Will DobbiePrinceton University and NBER
Roland G. FryerHarvard University and NBER
July 2016
Abstract
We estimate the impact of charter schools on early-life labor market outcomes using admin-istrative data from Texas. We find that, at the mean, charter schools have no impact on testscores and a negative impact on earnings. No Excuses charter schools increase test scores andfour-year college enrollment, but have a small and statistically insignificant impact on earnings,while other types of charter schools decrease test scores, four-year college enrollment, and earn-ings. Moving to school-level estimates, we find that charter schools that decrease test scoresalso tend to decrease earnings, while charter schools that increase test scores have no discernibleimpact on earnings. In contrast, high school graduation effects are predictive of earnings effectsthroughout the distribution of school quality. The paper concludes with a speculative discussionof what might explain our set of facts.
∗We thank the Texas Education Research Center at the University of Texas at Austin’s Ray Marshall Centerfor providing the data used in our analysis. We also thank David Card, Raj Chetty, Matt Davis, Hank Farber,Edward Glaeser, Hilary Hoynes, Lawrence Katz, Pat Kline, Michal Kolesar, Alan Krueger, Alex Mas, Parag Pathak,Jesse Rothstein, Adam Sacarny, Jesse Shapiro, Doug Staiger, Chris Walters, Danny Yagan, Seth Zimmerman, andnumerous seminar participants for helpful comments and suggestions. Elijah De la Campa, Tanaya Devi, MattFarber, Samsun Knight, William Murdock III, Namrata Narain, Rucha Vankudre, Dan Van Duesen, Jessica Wagner,and Brecia Young provided exceptional research assistance. Correspondence can be addressed to the authors bye-mail at [email protected] [Dobbie] or [email protected] [Fryer]. The research presented here utilizesconfidential data from the State of Texas supplied by the Education Research Center (ERC) at The University ofTexas at Austin. The views expressed are those of the authors and should not be attributed to the ERC or any ofthe supporting organizations mentioned herein, including The University of Texas at Austin or the State of Texas.Any errors are attributable to the authors.

I. Introduction
Charter schools are publicly funded, but privately managed, educational institutions that have
grown in popularity across the U.S. and U.K. over the past 20 years. Currently, five percent of
all American public students attend charter schools, and school districts such as New Orleans,
Detroit, Camden, and District of Columbia are now majority charter. There is an intense political
debate over the further expansion of charter schools. Many believe that charter schools are the
most important education reform of the 21st century, and the National Alliance for Public Charter
Schools estimates that there are over 1 million children on charter wait lists across America. Yet, 23
out of the 43 states that permit charter schools also impose a quantity constraint on their growth.
There are several arguments both for and against constraining charter growth (e.g. Bettinger
2000, Miron and Nelson 2001, Holmes, DeSimone, and Rupp 2003, Schneider and Buckley 2003).
For example, some charter critics argue that charter schools redirect funds and students from regular
public schools. According to this view, while charters may benefit their own students, they hurt
those left behind by reducing district budgets and increasing the concentration of disadvantaged
students. Others believe that charter schools are a risky and unproven gamble with children’s lives
and the government’s resources. A third argument is that charter schools can only increase test
scores through intense test prep (Haladyna, Nolen, and Haas 1991, Haladyna 2006), a paternalistic
environment (Whitman 2008), strategic resource allocation, or blatant cheating, without instilling
long-term or general knowledge in even their own students.
The case for charter expansion relies, at least in part, on the idea that high-performing charter
schools can increase long-term outcomes such as employment and earnings. There is a robust liter-
ature that certain charter schools – particularly those that implement the “No Excuses” approach
– increase test scores (Abdulkadiroglu et al. 2011, Dobbie and Fryer 2011, Angrist, Pathak, and
Walters 2013, Tuttle et al. 2013) and college enrollment (Dobbie and Fryer 2015, Angrist et al.
2016). Both test scores and college enrollment are correlated with labor market outcomes such as
employment and earnings (e.g. Griliches and Mason 1972, O’Neill 1990, Neal and Johnson 1996,
Currie and Thomas 2001, Chetty et al. 2011, Chetty, Friedman, and Rockoff 2014). Thus, charter
schools – particularly No Excuses charter schools – seem likely to increase employment and earnings
and potentially reduce intergenerational poverty. Consistent with this argument, Dobbie and Fryer
(2015) show that students who were admitted by lottery into the Promise Academy Charter School
in the Harlem Children’s Zone have lower rates of female teen pregnancy and male incarceration.1
If high-performing charters can increase long-term outcomes, then the argument for constraining
charter school growth at the margin seems incongruent with increasing equality of opportunity. If,
1The effects of the Promise Academy on these medium-run outcomes is larger than would have been expected fromthe test score increases alone, suggesting that charter schools may develop non-tested forms of intelligence or changestudents’ social networks that independently impact longer-term outcomes (Heckman and Rubinstein 2001, Heckman,Stixrud, and Urzua 2006, Segal 2008, Whitman 2008, Chetty et al. 2011, Jackson 2012). There is also evidence thatstudents assigned to high test score value-add teachers are more likely to attend college, earn higher salaries as adults,and are less likely to become pregnant as teenagers (Chetty, Friedman, and Rockoff 2014). Additionally, attending ahigh-quality public school can reduce crime and increase college enrollment even when there is little impact on statetest scores (Cullen, Jacob, and Levitt 2006, Deming 2011, Deming et al. 2014).
1

on the other hand, charter schools have no detectable long-term benefit, then there is an argument
for constraining their growth until we better understand what types of schools benefit students in
the long run.
In this paper, we estimate the impact of charter schools on early-life labor market outcomes using
administrative data from the state of Texas. The combination of high-stakes accountability and a
large and varied charter school sector makes Texas an archetypal laboratory to measure the effect
of charter schools on labor market outcomes. Texas introduced high-stakes accountability in 1993 –
eight years before the No Child Left Behind Act – and, two years later in 1995, enacted legislation
that allowed for the opening of charter schools. The Texas charter sector has subsequently grown
into one of the largest in the nation, with approximately 3.5 percent of Texas public students
now enrolled in a charter school. Texas also boasts several of the most successful charter school
networks. The Knowledge is Power Program (KIPP) and YES Prep schools – both winners of the
Broad prize for most effective charter networks – have their flagship schools in Houston, and the
IDEA Public Schools – another exemplar of the charter community – opened its first school in
the lower Rio Grande Valley in 2000. Conversely, there are a relatively large number of charter
schools in Texas that have been closed due to under enrollment, low student achievement, or fiscal
mismanagement (Baude et al. 2014).
Ideally, we would use admission lotteries to identify the effect of charter schools on earnings.
Unfortunately, Texas charter schools are only required to retain admissions lottery records for
two years, and none of the schools in our sample that we were able to successfully contact had
admissions lottery data for the relevant cohorts.2 Moreover, even if these data were available for
the schools in our sample, estimates using admissions lotteries are unlikely to yield sufficiently
precise estimates on earnings to be informative. For example, consider if we had lottery data for all
of the approximately 5,000 students in our Texas charter sample and another 5,000 lottery losers.
If we assume an intra-cluster correlation 0.2 – a typical correlation observed in the charter lottery
school data in other districts – we would only be able to reliably detect treatment effects of about
$7,000 per year on a base of $16,515, a 42 percent increase. Even if we assume an intra-cluster
correlation of zero, we could still only observe treatment effects of $1,490 per year, a 9 percent
increase.
In our analysis, we therefore use a combination of matching and regression to adjust for baseline
differences between charter and non-charter students. Our primary specification controls for elemen-
tary school by race by gender fixed effects and for a rich set of background characteristics including
third-order polynomials in baseline math and reading test scores. We identify school-specific effects
by comparing the outcomes of students who attended the same non-charter elementary school, but
different middle or high schools. This specification yields relatively precise earnings estimates while
2We successfully contacted 28 of the 45 schools in our analysis sample. Two of the 28 schools initially reportedthat they had lottery data available. However, both schools discovered that the data did not actually extend to oursample period when they were preparing the lottery data for the research team. The other 26 schools we were able tocontact reported not having lottery data for more than a few years or not having binding lotteries during our sampleperiod.
2

controlling for any observable differences between charter and non-charter students.
The key identifying assumption of our empirical design is that gender-race-cohort-school effects
and baseline controls account for all observed and unobserved differences between charter and non-
charter students. Put differently, we assume unobserved determinants of students’ labor market
outcomes are orthogonal to our school value-added measures. Abdulkadiroglu et al. (2011) and
Dobbie and Fryer (2013) find that this empirical design yields similar test score estimates as lottery-
based designs for oversubscribed charter schools in Boston and New York City, respectively. Deming
(2014) demonstrates similar results using a less restrictive set of controls for regular public schools
in Charlotte-Mecklenburg that have oversubscribed choice lotteries. Abdulkadiroglu et al. (2015)
show that this empirical approach works less well in Denver, with observational estimates yielding
treatment effects of 0.3 standard deviations (hereafter σ) while lottery based estimates are closer to
0.5σ. In Section IV, we provide a partial test of our identifying assumption in our setting, showing
that selection into Texas charter schools is remarkably similar to selection in environments in which
lottery and observational strategies yield similar point estimates. Nevertheless, our estimates should
be interpreted with this strong identifying assumption in mind.
A second limitation of our analysis is that we are only able to observe earnings outcomes for
individuals employed in the state of Texas. For the approximately 36 percent of students in our
sample with missing earnings outcomes, we do not know if they are unemployed or employed in
another state. We consider the extent to which out-state migration may threaten our estimates
by (1) examining the characteristics of individuals with missing earnings outcomes, (2) estimating
results leaving these observations as missing, and (3) imputing missing earnings data using several
different approaches. None of these results suggest that selective out-state migration significantly
biases our main results.
We begin our analysis by estimating the mean impact of charter schools in our sample on
test scores, educational attainment, and labor market outcomes. We find that, at the mean,
charter schools in Texas are no more effective at increasing test scores or educational attainment
than regular public schools. This is a recurring theme in the charter literature (e.g., Gleason et
al. 2010, Baude et al. 2014). We estimate that attending a Texas charter school for one year
increases state test scores by a statistically insignificant 0.006σ (se=0.005). Similarly, charter
attendance increases high school graduation by 1.2 (se=0.2) percentage points, two-year college
enrollment by 1.5 (se=0.3) percentage points, and four-year college enrollment by 0.3 (se=0.3)
percentage points. Turning to labor market outcomes, the focus of our analysis, we find that charter
attendance is associated with a $163 (se=98) decrease in annual earnings, with no detectable impact
on employment rates. Taken together, these results suggest little positive impact of the average
charter school in Texas.
However, investigating charter effects at the mean masks considerable heterogeneity by charter
type. No Excuses charter schools – schools that tend to have higher behavioral expectations, stricter
disciplinary codes, uniform requirements, and an extended school day and year – are effective at
increasing human capital on almost every dimension we are able to measure in our data. State
3

test scores increase by 0.097σ (se=0.008) per year of attendance, high school graduation increases
by 2.5 (se=0.3) percentage points, and enrollment in two- and four-year colleges increases by 1.2
(se=0.5) and 2.8 (se=0.5) percentage points, respectively. We also find that attending a No Excuses
charter school increases persistence in both two- and four-year colleges. Yet, despite these short-run
human capital benefits, the impact of attending a No Excuses charter school on earnings is only a
statistically insignificant $101 (se=176) per year of attendance.
Regular charters (defined as charters not implementing the No Excuses approach) decrease state
test scores by 0.054σ (se=0.006) per year of attendance, increase high school graduation by only 0.4
(se=0.3) percentage points, and decrease four-year college enrollment by 1.3 (se=0.3) percentage
points. Two-year college enrollment increases by 1.6 (se=0.3) percentage points, suggesting regular
charters may move students from four- to two-year colleges. Moreover, the impact of enrollment in
regular charter schools on earnings is -$322 (se=114) per year of attendance.
Estimates by race yield similar anomalies. No Excuses charter schools are particularly effective
at increasing the human capital of minority students. No Excuses charter schools increase the
test scores of black and Hispanic students by 0.169σ (se=0.010), similar to the treatment effects
observed in No Excuses schools in other districts (Abdulkadiroglu et al. 2011, Dobbie and Fryer
2011, Angrist, Pathak, and Walters 2013). Black and Hispanic children in No Excuses charter
schools are also significantly more likely to graduate from high school or enroll in a two- or four-
year college. Yet, the impact on earnings is only $154 (se=215) for minority students. In other
words, while there are economically and statistically significant effects of attending a No Excuses
school on the test scores and educational attainment of minority students, the earnings effect is
both small and measured with considerable noise.
In the second part of the paper, we examine the correlation between school-level education
effects and school-level labor market effects. These estimates provide information on the effect of
charter schools on labor market outcomes at other points in the distribution, not just the mean.
We also allow the correlation between the school-level effects to differ above and below zero to
examine trends in both the left and right tails of the distribution.
Separately estimating the school-level correlation between test scores and earnings effects above
and below zero yields another set of surprising results. Below zero, a 0.1σ increase in a school’s
state test score effect is associated with a $984 (se=232) increase in the school’s earnings effect.
Above zero, however, a 0.1σ increase in a school’s test score effect is associated with a statistically
insignificant $169 (se=439) increase in earnings. Similar to the test score results, schools that have
positive impacts on two- or four-year college enrollment have little impact on earnings, while schools
that have negative effects on college enrollment also tend to have negative effects on earnings.
In sharp contrast, there is a robust positive correlation of high school graduation effects with
labor market outcomes throughout the distribution. Below zero, a ten percentage point increase
in a school’s high school graduation effect is associated with a $912 (se=272) increase in earnings.
Similarly, above zero, a ten percentage point increase in a school’s high school graduation effect
is associated with a $2,175 (se=761) increase in earnings. These results are consistent with the
4

seminal work in Heckman, Lochner and Todd (2008), who argue that the internal rate of return
on high school completion is between 33 percent and 52 percent for white men and between 38
percent and 56 percent for black men between 1960 and 2000.3 These estimates also suggest that
high school graduation may be an additional short-run instrument along with state test scores to
evaluate the efficacy of charter schools, particularly in the right tail of the test score distribution.
We conclude with a more speculative discussion designed to help interpret our set of facts,
though we are quite limited in the breadth of hypotheses we can test due to data constraints.
First, we show that the age of the sample is unlikely to be driving the reported results. Estimates
using only a subset of older cohorts are, if anything, stronger than the main results. Moreover, our
estimates are remarkably stable over the time horizons we are able to examine. Second, we show that
our results do not appear to be driven by the negative effects of high dropout rates observed among
some charter schools. Estimates on program completers suggest the same qualitative conclusions.
Third, we consider the extent to which one might predict our earnings effects given the observed
changes across our set of human capital outcomes. Using the cross-sectional relationship between
human capital outcomes and earnings in our data, we find that regular charters have smaller effects
on earnings than their test score and attainment effects would have suggested. However, No Excuses
schools have earnings effects that are approximately equal to what their score and attainment effects
would have suggested. A similar pattern emerges at the school level. The smaller than anticipated
earnings in non-No Excuses charters may be driven by at least three channels: (a) compensating
differentials for students who attend negative test score schools (e.g. a terrific art program); (b)
parents lack adequate information about which schools are negative test score value-added; or
(c) selection bias – the types of students who knowingly attend schools with negative test score
value-added are negatively selected on unobservables that are also predictive of earnings.
Our results are also consistent with the classic substitution effect in models of multitasking.
Unfortunately, our ability to directly test this hypothesis is also severely limited by the data. We
provide indirect evidence using detailed data on school policies and practices from Dobbie and Fryer
(2013) – there is some evidence that schools that increase test scores spend less time on art, history,
and foreign language. To the extent that these skills are important either directly or through the
acquisition of future skills, they might explain our results. This theory, however, is unlikely to
explain why students in negative value-add schools have lower than expected earnings unless, in a
Lazear (2006) way, teaching to the test builds human capital among low achieving students.
In parallel work, Sass et al. (2016) estimate the impact of attending a charter high school on
3These results are related to an important literature estimating the impact of school quality on labor marketearnings. Changes in school inputs, such as pupil teacher ratios, annual teacher pay, and term length, help explaindifferences in state-specific returns to education (Card and Krueger 1992a) and the narrowing of the black-whiteearnings gap between 1960 and 1980 (Card and Krueger 1992b). There is also evidence of large gains of Catholicschool attendance for urban minorities that would have otherwise attended poor public schools (Neal 1997, Groggerand Neal 2000). Recent work suggests students assigned to high-quality kindergarten classrooms or high test scorevalue-add teachers in grades 4-8 are also less likely to become pregnant as teenagers, more likely to attend college,and earn higher salaries as adults (Chetty et al. 2011, Chetty, Friedman, and Rockoff 2014). There is also evidencethat smaller class sizes increase educational attainment and earnings in Sweden (Fredriksson, Ockert, and Oosterbeek2013).
5

college persistence and age 23-25 earnings in Florida. Their empirical design compares students
who attended both a charter middle and high school to students who attended a charter middle
school but non-charter high school. Using this empirical design, they find that attending a charter
high school increases maximum annual earnings by over $2,000. In the specification most similar to
ours where both charter and non-charter middle school students are included, the effect of attending
a charter high school falls to $493. Beyond the impact of charter schools on mean earnings, there
is not much overlap between Sass et al. (2016) and our approach.4
The remainder of the paper is structured as follows. Section II discusses the institutional setting
of education reform in Texas. Section III describes our data. Section IV discusses our research
design and its potential limitations. Section V presents student-level results on human capital and
earnings. Section VI estimates the correlation between a school’s human capital effects and its
labor market effects. Section VII discusses potential interpretations of our results, and Section
VIII concludes. There are three online appendices. Online Appendix A provides additional results.
Online Appendix B is a data appendix that details our sample and variable construction. Online
Appendix C provides additional details on the empirical Bayes procedure we use to adjust our
estimated school effects for estimation error.
II. Education Reform in Texas
Texas introduced both charter schools and high-stakes accountability in the early 1990s, making it
a rich setting for our set of research questions. In this section, we briefly discuss both the charter
sector and the high-stakes accountability system in Texas during our sample period.
A. The Texas Charter School Sector
Texas enacted legislation allowing for the establishment of charter schools in 1995. The Texas
charter sector has subsequently grown into one of the largest in the nation. Today, there are more
than 600 charter schools in Texas educating approximately 3.5 percent of public school students.
The vast majority of charter schools in Texas are open-enrollment charters granted by the
Texas State Board of Education.5 Open-enrollment charter schools receive public funding but are
not subject to the regulatory restrictions of regular public schools. For example, charter schools
have almost no restrictions on hiring and firing teachers outside of the requirements for teachers in
core areas imposed by the No Child Left Behind legislation. In practice, open-enrollment charters
often hire teachers who currently lack certification or bring skills and experiences that may not
4Unfortunately it is not possible to replicate the Sass et al. (2016) empirical specification in our data. Duringour sample period, there are only two students who graduate from a charter middle school and attend a differentcharter high school. This result is due, at least in part, to the fact that the majority of charter schools serve bothmiddle and high school students. See Appendix Table 1 for additional details on the charter schools in our sample.
5There are four types of charter schools operating in Texas: open-enrollment charters, university/college campuscharters, independent school district charters, and home-rule district charters. University charters operate similarlyto open-enrollment charters. Independent district charters are established by and accountable to the school districtsin which they reside. Texas also allows for home-rule district charters, although none of them were established as of2015.
6

be rewarded in conventional public schools (Baude et al. 2014). Open-enrollment charters are
subject to the same accountability and testing requirements as regular public schools. However,
these schools are accountable to the Texas State Board of Education, not the school district in
which the school is located.
From 1995 to 2000, there was no statutory limit on the number of open-enrollment charters
as long as 75 percent of enrolled students were classified as at risk of dropping out. Following
reports of poor performance and mismanagement at some open-enrollment schools, the legislature
relaxed the constraint on the number of at risk students and put a cap on the number of open-
enrollment charters in 2001. Consistent with these reports, Baude et al. (2014) find that the
test score value-added of Texas charter schools in the early 2000s was highly variable and, on
average, lower than the regular public schools. However, by 2011 the test score value-added of
Texas charter schools was roughly equal to regular public schools due to the closure of ineffective
charters, improvements among existing charters, and the opening of new charters by successful
charter management organizations such as the Knowledge is Power Program (KIPP), Yes Prep,
and IDEA Public Schools.
We make three sample restrictions to the charter schools examined in our analysis. First, we
restrict our analysis to open-enrollment charter schools that target the general population of public
school students but are not run by the regular public school system. We exclude both district
charters that are operated by the public school districts, and alternative charter schools that typi-
cally work with non-traditional students such as high-school dropouts and operate under different
accountability standards. We also exclude charter schools for abused students, autistic students,
shelters, residential treatment centers, juvenile detention centers, juvenile justice alternative edu-
cation programs, virtual charter schools, and sports academies. Second, we restrict our analysis
to charter schools whose oldest cohort graduated high school in or before 2005-2006. This restric-
tion ensures that students in our sample are approximately 25 years old or older in the most recent
earnings data. Third, we drop schools who have fewer than ten students enrolled during our sample
period. These sample restrictions leave us with 128 school by cohort observations from 45 different
charter schools. Appendix Table 1 provides additional details on our sample charter schools.
Throughout the text, we present results for three categories of charter schools: all charter
schools, No Excuses charter schools, and regular charter schools. All charters refers to the com-
plete set of charter schools in our estimation sample. No Excuses charters have higher behavioral
expectations, stricter disciplinary codes, are more likely to have uniform requirements, and are more
likely to have an extended school day and year (e.g. Thernstrom and Thernstrom 2003). Regular
charters are defined as all charters in Texas that are not No Excuses schools. These partitions are
motivated by the literature which demonstrates small, if any, gains in student achievement from
attending average charter schools but a large achievement effect of attending schools that adopt the
No Excuses approach. Cheng et al. (2015) conduct a meta analysis of seven studies and report that
No Excuses charters improve math scores by 0.25σ and literacy achievement by 0.16σ. They also
conclude that students who attend No Excuses charter schools have 0.15σ higher math achievement
7

and 0.07σ higher reading achievement than students attending a more general sample of random
assignment charter schools. We classify No Excuses schools using information from school mission
statements, charter applications, and public statements. Appendix Table 1 provides a complete list
of the No Excuses and regular charter schools in our sample, and Appendix B contains additional
information on how we coded No Excuses and regular charter schools.
B. High-Stakes Accountability in Texas
In 1993, Texas implemented a high-stakes accountability system in order to rate both school districts
and individual schools. Under the high-stakes system, school accountability ratings are based
on school-wide and subgroup specific performance on mandated state tests, and school-wide and
subgroup specific dropout rates if applicable. School ratings are determined by the lowest scoring
test-subgroup combination (e.g math for whites), giving some schools strong incentives to focus on
particular students, subjects, and grade cohorts.6 Test-subgroup rates were calculated for African
American, Hispanic, white, and economically disadvantaged students. School ratings were then
published in full page spreads in local newspapers, and the lowest rated schools were forced to
undergo an evaluation process with the possibility of being reconstituted or otherwise sanctioned,
including an allowance for students to transfer to better-performing schools inside or outside the
district. The highest rated schools were also exempt from some regulations and requirements, and
in many years there have been financial awards for schools that are either high performing or showed
substantial improvement (Texas Education Agency 1994, Haney 2000, Cullen and Reback 2006). No
Child Left Behind incorporated most of the main features of the Texas system, including reporting
and rating schools based on exam pass rates, additional reporting requirements, an increased focus
on performance among poor and minority students, and raising standards over time.
There was a rapid rise in high-stakes test scores following the introduction of the high-stakes
accountability system in Texas (Klein et al. 2000, Haney 2000). For example, pass rates on the 8th
grade math exam rose from 58 percent for the 1994 cohort to 91 percent in the 2000 cohort. Pass
rates on the 10th grade exam, a high-stakes exit exam for students during this period, rose from
57 percent to 78 percent over the same time period. Reading test scores also increased following
the introduction of the high-stakes accountability system, although the magnitudes were smaller.
However, there is also evidence that the accountability system led schools to narrow their
curriculum and instructional practices at the expense of low-stakes subjects, students, and grade
cohorts (Haney 2000, McNeil and Valenzuela 2001, Jacob 2005, Cullen and Reback 2006, Figlio
2006, Figlio and Getzler 2006, Vasquez Heilig and Darling-Hammond 2008, McNeil et al. 2008,
Jennings and Beveridge 2009). Finally, recent work suggests that there is no overall impact of
6The high-stakes accountability system categorized all schools as exemplary, recognized, acceptable, or low per-forming. In the first year of the accountability system, schools were rated as exemplary if 90 percent of each studentsubgroup passed the mandated state tests and the school drop-out rate did not exceed 1 percent, recognized if 65percent of each student subgroup passed the mandated state tests and the school drop-out rate did not exceed 3.5percent, and acceptable if 25 percent of each student subgroup passed the mandated state tests and the school drop-out rate did not exceed 6.0 percent. The standards for recognized and acceptable ratings have slowly increased overtime. See Haney (2000) and Cullen and Reback (2006) for additional details.
8

increased pressure to achieve a higher accountability rating on postsecondary attainment and early-
life earnings, with large declines in both for low-scoring students, who typically have little impact
on a school’s accountability rating (Deming et al. 2014). These findings are consistent with a large
literature suggesting that high-stakes performance incentives may have distortionary effects (e.g.
Holmstrom and Milgrom 1991, Baker 1992).
III. Data
We use administrative data from the Texas Education Research Center (ERC) that allows us to
follow all Texas public school students from kindergarten to college through to the labor market.
The data include information on student demographics and outcomes from the Texas Education
Agency, college enrollment records from the Texas Higher Education Coordinating Board, and
administrative earnings records from the Texas Workforce Commission. Appendix B contains all
relevant information on the data and coding of variables. This section summarizes the most relevant
information from the appendix.
A. Data Sources
The Texas Education Agency (TEA) data include information on student gender, a mutually ex-
clusive and collectively exhaustive set of race dummies, and indicators for whether a student is
eligible for free or reduced-price lunch or other forms of federal assistance, whether a student re-
ceives accommodations for limited English proficiency, whether a student receives special education
accommodations, or whether a student is categorized as “at risk”. The TEA data also include in-
formation on each student’s grade, school, state math and reading test scores in each year, and
graduation year. These data are available for all Texas public school students for the 1994-1995 to
2012-2013 school years.
Information on college outcomes comes from the Texas Higher Education Coordinating Board
(THECB). The THECB collects and centralizes data for students attending Texas public univer-
sities, private universities, community colleges, and health related institutions. The data includes
information on each student’s enrollment, graduation, and grade in each year. All students missing
from these files are assumed to have not enrolled in or graduated from college. The THECB data
are available for the 2004-2005 to 2012-2013 school years.
An important limitation of the THECB data is that it only contains students who attend Texas
colleges or universities. If charter schools increase the probability that a student attends out-of-
state four year universities, for instance, our estimates using the THECB will be biased. To explore
the robustness of our college results and measure the effect of charters on out-of-state college
attendance, we supplement our analysis with data from the National Student Clearinghouse (NSC)
that contain information on student enrollment for over 90 percent of all colleges and universities
in the United States. The NSC data is only available from 2008 to 2009. In practice, the estimated
effects of charter school attendance on college-going are almost identical in the NSC and THECB
9

data in the years where we have both. This provides some confidence that differential out-of-state
migration to attend college is not driving our results.
Employment and earnings outcomes are measured using data from the Texas Workforce Com-
mission (TWC). The TWC data record quarterly earnings for all Texas employees, with information
on approximately 12 million individuals each year. The data include information on each individ-
ual’s earning, number of employers, and size of each employer. The TWC data are available from
2002 to 2014.
We assume that individuals with no reported earnings in a given year are unemployed. In
Section V, we report results showing that our results are robust to excluding all zero earnings
outcomes, imputing zero earnings outcomes using baseline covariates, and imputing zero earnings
outcomes using both baseline covariates and realized educational outcomes.
The TEA, THECB, NSC, and TWC data are housed at the Texas ERC. Using a unique identifier
based on an individual’s social security number to link the data from these four sources, these data
allow us to follow each Texas student from Kindergarten to college to the job market as long as
this individual resides in Texas. These data are not publicly available, but interested researchers
can apply to the Texas Education Research Center.
B. Sample Restrictions
We make six sample restrictions to the student data with the overarching goal of having a valid
comparison sample. Table 1 provides details on the number of students dropped by each sample
restriction. With no restrictions, there are 1,420,877 students in regular public schools, 1,358
students in No Excuses charter schools, and 4,905 students in regular charter schools. Column 2
omits students who did not attend a public elementary school in 4th grade. This decreases the
sample by 7,646 students in non-charters, but only by 13 students in No Excuses Charters and 75
in regular charters. Column 3 leaves out students with missing baseline covariates such as gender or
race. Column 4 drops students with no middle or high school test score. Column 5 drops students
who transferred to an out-of-state primary or secondary school. Column 6 drops charter schools
with a cohort size fewer than ten. In our final estimation sample – which includes all students for
which there is a match cell on 4th grade school, cohort, gender, and race – there are 188,666 students
in non-charters, 1,039 in No Excuses charters, and 3,860 students in regular charter schools. The
majority of the non-charter sample was dropped due to not matching individuals in the charter
sample, primarily because these students attend schools in districts without a charter school.
C. Summary Statistics
Table 2 presents summary statistics for non-charter students, students enrolled in No Excuses
charter schools, and students enrolled in regular charter schools – for both the full sample (columns
1-3) and the estimation sample (columns 4-6). In the full sample, relative to the non-charter sample,
regular charter schools are overwhelmingly minority, more likely to enroll students who are free or
reduced-price lunch eligible or classified as needing special education accommodations, and have
10

students with lower baseline test scores in reading and math. No Excuses charters have a higher
fraction of Hispanic students, which might be driven by the IDEA public schools in the lower Rio
Grande Valley, are less likely to enroll special education students, and have students with higher
baseline test scores.
The summary statistics between the full sample and the estimation sample are strikingly similar
on most dimensions. In the estimation sample, No Excuses charter schools are more likely to be
female, more likely to be free lunch, and have higher baseline test scores than students in non-
charters. The average number of years in a Texas charter school is three years for No Excuses
schools and two years for regular charter schools. Students in any charter are more likely to be
labeled at risk of dropping out. Hispanics are more represented in charter schools than non-charter
schools. Black students in Texas are less likely to attend No Excuses schools relative to regular
charters or non-charter schools.
Putting these pieces together, the summary statistics paint a familiar portrait of the character-
istics of charter school enrollees. Students in charter schools are more likely to be minority, more
likely to be on free lunch (a measure of poverty), and more likely to be labeled at risk of dropping
out, and yet those in No Excuses charter schools enroll with higher test scores. Consistent with
this, Allen and Consoletti (2007, 2008) state that charter schools attract minority students who
are more probable of receiving free lunch and being at risk.
IV. Research Design
Our empirical analysis has two objectives: (1) to estimate the effect of attending charter schools
on labor market outcomes such as earnings and employment, and (2) to estimate the correlation
between a school’s effect on labor market outcomes and its effect on human capital outcomes such
as test scores. This section discusses our empirical strategy for each objective.
A. Estimating the Effect of Charter Schools on Labor Market Outcomes
Estimation Framework: We model the effect of a charter school on student outcomes as a linear
function of the number of years spent at the school:
yit = γXi +∑s
βsCharterits + εit (1)
where yit is the outcome of interest for student i in year t, Xi is a vector of baseline demographic
controls such as baseline test scores, gender, race, special education status, free and reduced-price
lunch eligibility, limited English proficiency, gifted designation, at risk designation, and the number
of years spent at charter schools not included in our analysis sample, and εit is noise. Charterits
is the number of years student i has attended school s by year t.
The effect of attending charter school s is βs. Prior research has provided a set of causal
estimates of this parameter for short and medium run outcomes using admissions lottery data (e.g.
11

Abdulkadiroglu et al. 2011, Dobbie and Fryer 2011, Angrist, Pathak, and Walters 2013, Dobbie
and Fryer 2015, Angrist et al. 2016). Unfortunately, Texas charter schools are only required to
retain admissions lottery records for two years. As a result of this requirement, none of the charter
schools in our sample have admissions lottery data for cohorts in our sample period. Moreover,
as discussed in the introduction, using admissions lotteries are unlikely to yield sufficiently precise
estimates on earnings even if these data were available for our sample.
We therefore identify the effect of each charter school using a combination of matching and
regression analysis to partially control for selection into schools in our sample. Specifically, we follow
Angrist, Pathak, and Walters (2013) and Dobbie and Fryer (2013) and match students attending
sample charters to a control sample of regular public school students using “cells” consisting of the
4th grade school, gender, race, and cohort. Charter students are included in the estimates if they
are matched to a cell with at least one regular public school student. Traditional school students
are included if they are matched to a cell with at least one charter student.
We then include these “matched cell” fixed effects when estimating equation (1). We also control
for third-order polynomials in 4th grade math and reading scores, 4th grade special education status,
4th grade free and reduced-price lunch eligibility, 4th grade limited English proficiency, 4th grade
gifted designation, 4th grade at risk designation, and the number of years spent at charter schools
not included in our analysis sample. Standard errors are clustered at the matched cell level to
account for serial correlation in outcomes.
Our matching and regression approach semi-parametrically controls for any differences between
gender-race-cohort-school cells that may bias our estimates by comparing the outcomes of observa-
tionally similar students who attended the same elementary school, but attended different middle
or high schools. Any differences in human capital or labor market outcomes are attributed to
differences in the number of years spent at each charter school.
Selective Charter Enrollment: The key identifying assumption of our approach is that our gender-
race-cohort-school effects and baseline controls account for all observed and unobserved differences
between charter and non-charter students. We therefore assume that unobserved determinants of
students’ labor market outcomes are orthogonal to our school value-added measures.
Consistent with this identifying assumption, Abdulkadiroglu et al. (2011), Angrist, Pathak, and
Walters (2013) and Dobbie and Fryer (2013) find that a similar observational empirical design yields
similar test score estimates as lottery-based designs for oversubscribed charter schools in Boston
and New York City, respectively. Deming (2014) finds similar results using a less restrictive set of
controls for regular public schools in Charlotte-Mecklenburg that have oversubscribed choice lotter-
ies. However, it is possible that the selection processes are different for Texas charter schools than
in charter schools in Boston or New York City or regular public schools in Charlotte-Mecklenburg.
It is also possible that the selection processes for test scores and labor market outcomes may
be different. For example, Chetty, Friedman, and Rockoff (2014) find that while controlling for
lagged test scores effectively absorbs most unobserved determinants of student achievement on how
students are sorted to classrooms, it does not account for unobserved determinants of earnings.
12

Specifically, Chetty, Friedman, and Rockoff (2014) show substantial “effects” of earnings value-
added estimates on baseline parent income and family characteristics, indicating that their set
of baseline controls is unable to fully account for sorting when estimating earnings value added.
Unfortunately we do not have information on parent income or family characteristics, and are
therefore unable to replicate the Chetty, Friedman, and Rockoff (2014) tests in our context.
We partially test for selection bias on observable characteristics in our data in three ways. First,
in Panel A of Appendix Table 2A, we regress each baseline characteristic on the number of years at
the indicated charter school type, gender-race-cohort-school effects, and all baseline controls other
than the indicated dependent variable. Column 1 reports the mean and standard deviation for
non-charter schools in our estimation sample. Column 2 reports results pooling all charter schools
in our sample. Columns 3-4 report results for No Excuses and regular charter schools separately.
Students who attend charter schools are more likely to have reached 4th grade on time – 0.8 (0.2)
percentage points on a base of 83.2 percent. Yet, due to the precision of our estimates, this difference
is statistically significant. Similarly, both 4th grade LEP and math scores differ between students
in charter and non-charter schools. As before, they are statistically significant but do not seem
economically meaningful.
Second, Panel B of Appendix Table 2A conducts a number of falsification tests using outcomes
that we do not directly control for: 3rd grade math and reading scores, and an indicator for having
been held back before 3rd grade. On all but one outcome – 3rd grade math scores for No Excuses
charters – there is no relationship between charter attendance and these baseline characteristics.
Students who attend No Excuses charters have 0.023σ (se=0.012) higher math test scores. This is
substantively small and marginally significant.
Finally, Panel C of Appendix Table 2A conducts a similar exercise using predicted earnings and
employment for ages 24-26. We predict earnings using the relationship between actual earnings and
employment with the baseline controls used in equation (1). Consistent with the previous results,
we find statistically significant but economically small differences between those who attend charters
and those who attend non-charters. The predicted difference in earnings between charter and non-
charter students is 0.001 percent (a $28.68 difference on a non-charter mean of $22,478.66). It
therefore appears that, because of our large sample, several coefficients are statistically significant
but none of them are economically large.
To better understand how to interpret these results, we conduct an identical exercise in an en-
vironment where we believe both lottery-based and observational estimates of charter effectiveness
have been shown to be highly correlated. Appendix Table 2B replicates our specifications from Ap-
pendix Table 2A using information from NYC charter schools where Dobbie and Fryer (2013) have
shown that lottery-based and observational estimates are highly correlated. If anything, Appendix
Table 2B reveals more selection on charter attendance in NYC than in Texas. We interpret these
results as suggesting that there is some modest selection into charter schools based on observable
characteristics, but that our estimates from equation (1) are unlikely to be significantly biased.
Selective Attrition from the Earnings Data: Another concern is that charter students may be either
13

more or less likely to leave the state, and hence more or less likely to be missing from our earnings
data. If charter students are more or less likely to migrate out of Texas, or the types of charter
students that migrate out of Texas are different than the types of non-charter students who migrate,
estimates of equation (1) may be biased.7
Unfortunately we are unable to directly observe out-state migration in our data. We therefore
explore attrition from of our sample in three ways. First, Appendix Table 3 examines the charac-
teristics of charter and non-charter students with no observed earnings outcomes. While far from
an ideal test, these results help us understand the types of individuals for whom we do not observe
earnings, and whether selective attrition is likely to be a serious concern in our setting. Similar to
the test of selective attrition into charter schools, there are small differences in six out of seventeen
variables that are statistically significant but substantively small. Female students who attend non-
charter schools are three percent less likely to be in the earnings data than male students. Among
charter students this number is 2.8 percentage points – the p-value of the difference is 0.001. There
is a similar pattern among the other variables that show statistical differences.
Second, we test whether charter students are more likely to attend an out-of-state college in
the two cohorts where NSC data – which include college enrollment outcomes from all states – is
available. Appendix Table 4 presents these results. At the mean, charter students are no more
likely to attend two- or four-year schools in Texas or two-year colleges outside of Texas. They
are, however, 0.9 (se=0.2) percentage points more likely to attend out-of-state four-year colleges.
The largest coefficients in the table are from No Excuses students who attend out-of-state colleges.
They are 1.8 (se=0.03) percentage points more likely to attend an out-of-state four-year college
compared to a non-charter mean of 4.4 percentage points.
We also show in Section V that our earnings results are robust to (1) excluding all zero earnings
outcomes, (2) imputing zero earnings outcomes using baseline covariates, (3) and imputing zero
earnings outcomes using both baseline covariates and observed attainment outcomes. We interpret
these results as suggesting that any selective out-state migration is likely to be modest in our
sample.
B. Correlation of School Effects on Earnings and Academic Outcomes
Estimation Framework: We estimate the correlation between a school’s effect on labor market
outcomes and its effect on short-run outcomes such as test scores using the following specification:
βycs = λβtcs + εcs (2)
7More generally, one can compare the types of attrition observed in our data with other well-known datasets. Forinstance, in the Current Population Survey (CPS), we find that 8.4 percent of 23-26 year olds had migrated out ofTexas sometime during the five years prior to taking the CPS. Individuals that attended at least some college, servedin the armed forces, and were 23-26 in 2005 (as compared to 2015) were more likely to migrate out of Texas. Wealso find that the employment rate among 23-26 year olds in Texas is 70.8 percent in the CPS. For minority youthin Texas, the rate is 65.5 percent. In comparison, we observe non-zero earnings for 64.1 percent of individuals in ourTexas data. This is strikingly consistent with our data.
14

where βycs is a school’s effect for cohort c on labor market outcomes y, and βtcs is a school’s predicted
effect on short-run outcomes such as test scores. We report results using a simple linear relationship,
and a linear spline with a change in slope when the short-run effect is equal to zero. The linear
spline results will help us understand whether low- and high-performing schools (as measured by
short-run test score or attainment outcomes) have different effects on long-run outcomes.8 We
estimate equation (2) at the school-cohort level and cluster standard errors at the school level.
Mechanical Bias in Student-Level Errors: Following Chetty, Friedman, and Rockoff (2014), we
calculate our academic school effects using a leave-cohort-out measure. Specifically, school effects
in a given cohort c are predictions of school quality for cohort c based on outcomes from all cohorts
excluding outcomes from cohort c. For example, when predicting a school’s effects on the outcomes
of students graduating in 2002-2003, we estimate βcs based on academic outcomes from students
in all cohorts of the sample except 2002-2003. Further, we maximize precision by calculating these
leave-out school effects estimates using data from all cohorts graduating high school, not just the
subset of older cohorts for which we observe earnings outcomes.
Using a leave-cohort-out estimate of βcs is necessary to obtain unbiased estimates of equation
(2) because of correlated errors in students’ short-run outcomes and later outcomes. Intuitively, if a
school is randomly assigned unobservably high-ability students, its estimated impact on short-run
outcomes will also tend to be higher. The same unobservably high-ability students are likely to
have high levels of earnings, generating a mechanical correlation between short-run impacts and
earnings impacts even if the school has no causal effect. The leave-cohort-out approach eliminates
this correlated estimation error bias because βcs is estimated using a sample that excludes the
observations on the left hand side of equation (2).
Attenuation Bias from Estimation Error: A final concern is estimation error. The median school
in our sample has fewer than 70 students in the relevant cohorts, and we observe fewer than 50
students in the relevant cohorts for 38.6 percent schools in our sample. The stochastic nature of
our outcomes combined with the relatively small number of students in some schools means that
some of our school effects will be estimated with considerable error, leading to attenuation bias in
our analysis of the relationship between these effects and outcomes.
We apply an empirical Bayes procedure to adjust for estimation error in our estimates of βcs
(e.g. Morris 1983). The empirical Bayes procedure is based on the idea that there is likely to be
positive (negative) estimation error if a school’s estimated effect is above (below) the mean school
effect. The expected school effect is therefore a convex combination of the estimated school effect
and the mean of the underlying distribution of school effects. The relative weight on the estimated
school effect is proportional to the precision of the estimate, which is based on the standard error
8We formally test for the location of the trend breaks in Appendix Figure 1. Specifically, we plot the R2 fromequation (2) estimated for every possible break point in the data. The natural break point is slightly below zero formost specifications – though simply assuming zero is a reasonable approximation. We prefer to use zero because ofease of interpretation and consistency across outcomes.
15

of the coefficient estimate. Online Appendix C provides a detailed description of this procedure in
our context.
V. The Impact of Charter Schools on Human Capital and Labor Market
Outcomes
Below, we provide a series of estimates of the impact of charter schools on human capital out-
comes such as test scores and college enrollment, and labor market outcomes such as earnings and
employment.
A. Human Capital Outcomes
Table 3 presents estimates of equation (1) for math scores, reading scores, and both math and
reading scores together. The odd numbered columns control for the baseline characteristics in
Table 2, third-order polynomials in 4th grade math and reading state test scores, number of years
spent at charter schools not included in our analysis sample, and 4th grade school x cohort fixed
effects. The even numbered columns add 4th grade school x cohort x race x gender fixed effects
– the specification that aligns with the lottery estimates in Abdulkadiroglu et al. (2011), Angrist,
Pathak, and Walters (2013), and Dobbie and Fryer (2013). We report the coefficient on the number
of years attended at the indicated charter school and standard errors clustered at the 4th grade x
cohort level. Appendix Tables 5-7 report results using an indicator for having ever attended the
indicated charter school as an alternative.
Consistent with the prior literature, the mean impact of charter schools on test scores is roughly
zero (e.g. Gleason et al. 2010, Baude et al. 2014). In our preferred specification with 4th grade
school x cohort x race x gender fixed effects, we find that the impact of attending a charter school
for one year is -0.009σ (se=0.006) on math scores and 0.022σ (se=0.005) on reading scores. Stacking
both math and reading test scores, we find that attending a charter school for one year increases
test scores by 0.006σ (se=0.005). None of the estimates suggest economically large impacts of
charter attendance on test scores at the mean.
However, and again consistent with the prior literature (e.g. Abdulkadiroglu et al. 2011,
Angrist, Pathak, and Walters 2013, Dobbie and Fryer 2013), the test score estimates differ markedly
for No Excuses and non-No Excuses charter schools. In our preferred specification, the impact of
attending a No Excuses charter school for one year is 0.095σ (se=0.009) in math, 0.099σ (se=0.008)
in reading, and 0.097σ (se=0.008) stacking both math and reading scores. In contrast, the impact
of attending a regular, or non-No Excuses charter school, is -0.078σ (se=0.007) in math, -0.029σ
(se=0.007) in reading, and -0.054σ (se=0.006) stacking scores from both subjects.9
9Appendix Figure 2 plots school-specific estimates of the test score effects for both No Excuses and regular charterschools. We estimate the school-specific estimates using equation (1) and adjust the coefficients for estimation errorusing the procedure outlined in Online Appendix C. The reported means are weighted by the number of studentsat each school in the earnings effects estimation sample. The distribution of regular charter school effectiveness issimilar to distribution of charter school effectiveness in Gleason et al. (2010), providing more evidence that the Texascharter sector is not an outlier. Another interesting feature of Appendix Figure 2 is the consistency of the No Excuses
16

Table 4 presents similar estimates for high school graduation, two-year college enrollment, and
four-year college enrollment. Appendix Table 8 presents analogous results for the number of years
enrolled at two- and four-year colleges.10 At the mean, the effect of attending a charter school
is 1.2 (se=0.2) percentage points for high school graduation, 1.5 (se=0.3) percentage points for
two-year college enrollment, and 0.3 (se=0.3) percentage points for four-year college enrollment.
Consistent with the test score results from Table 3, the effects differ by charter type, particularly
for four-year college enrollment. No Excuses charters increase four-year college enrollment by 2.8
(se=0.5) percentage points, compared to -1.3 (se=0.3) percentage points for regular charters. High
school graduation effects are also larger for No Excuses and regular charters, while two-year college
enrollment effects are similar. These results are consistent with No Excuses charters increasing
the number of students attending all types of colleges, while regular charters shift students who
otherwise would have attended a four-year school to a two-year school.11
The consistency between our results and the previous literature – much of which employs a
lottery-based design – for the test scores and attainment results provides a bit of confidence that
our matched cell research design is valid in our setting. Moreover, if anything, our test score
effects for No Excuses charters are smaller than those found in much of the literature. This too,
is a similar feature of analyses that have employed both lottery-based and matched-cell designs.
In Dobbie and Fryer (2013), the matched cell specification estimates are biased downwards and
the correlation between lottery based estimates and observational estimates is 0.768 for math test
scores and 0.526 for reading test scores.
B. Labor Market Outcomes
Table 5 presents estimates of equation (1) for average earnings and employment for ages 24-26.12
Columns 1-2 present earnings results using our baseline set of controls and with matched cell
fixed effects, respectively, mirroring the specifications used in Tables 3-4. At the mean, the effect of
attending a charter school for one year is -$163.65 (se=98.86). Thus, if a student attended a charter
school for 5 years, expected annual earnings would be over $800 lower. Consistent with our test
score and attainment results, No Excuses charters have better outcomes. The impact of attending a
No Excuses charter for one year is a statistically insignificant $101.04 (se=176.12). Regular charters
school test score effects, with all of the point estimates concentrated between zero and 0.25σ. An important caveatto these results is that the distribution adjusted for estimation error has lower variance than the true distribution ofschool-specific estimates. See Jacob and Rothstein (forthcoming) for additional discussion of this issue.
10Deming et al. (forthcoming) estimate that less than nine percent of the graduating students in the Texas ERCdata attend out of state colleges or universities and their test scores are drawn from the top deciles of the academicdistribution – even conditional on college enrollment. In Appendix Table 4 we use data from the National StudentClearinghouse to demonstrate the robustness of the college enrollment results to out-state migration.
11Following our test score results from Appendix Figure 2, Appendix Figure 3 plots school-specific estimates of theattainment effects for both No Excuses and regular charter schools. There is significant variation in the school-specificestimates, with the effects centered at or below zero for regular charters. For No Excuses charters, the effects arecentered around zero for high school graduation and two-year college enrollment, and above zero for four-year collegeenrollment.
12Appendix Table 9 presents results for the maximum observed earnings for ages 24-26. The results are nearlyidentical to the average earnings presented in Table 5.
17

have a surprisingly negative impact on earnings of -$322.28 (se=114.52).13 Results for employment
are less precise and are not statistically distinguishable from zero for either No Excuses or regular
charters.14
As discussed in Section III, an important limitation of our data is that we only observe the
earnings of individuals working in the state of Texas. If No Excuses charter schools increase or
decrease the probability of leaving Texas, our estimates may be biased. This problem is analogous
to the well-known missing earnings problem in labor economics (see Blundell and MaCurdy 1999
for a review). Columns 3-5 of Table 5 explore the robustness of our earnings results to various
assumptions about missing earnings observations. Column 3 presents results dropping all zero
earnings observations. In this scenario, the effect that is being estimated is the impact of charters
on earnings, conditional on employment. Column 4 imputes the missing earnings observations using
the baseline characteristics in Table 2, third-order polynomials in 4th grade math and reading state
test scores, the number of years spent at charter schools not included in our analysis sample, and
4th grade school x cohort x race x gender fixed effects. Column 5 imputes the missing earnings
observations using the same baseline characteristics and the observed test score and academic
attainment outcomes from Tables 3-4. Specifically, for both imputation procedures, we regress
non-missing earnings on all characteristics. We then take the median predicted earnings in each
4th grade school x cohort x race x gender cell. Results are similar using the 25th or 75th percentile
of each 4th grade school x cohort x race x gender cell instead.
Our earnings results are broadly similar regardless of how we deal with missing earnings. The
estimated effect of No Excuses charters is modestly more positive when dropping missing earnings
observations or imputing outcomes, while the estimated effects of regular charters is somewhat
more negative. The largest estimates (in absolute value) suggest that No Excuses charters increase
earnings by a statistically insignificant $237.44 (se=152.79) and that regular charters decrease
earnings by $443.56 (se=138.42). In results available upon request, we find nearly identical results
if we impute earnings at different percentiles of the predicted earnings distribution. We also estimate
results using a grouped Heckit procedure (e.g. Gronau 1974, Heckman 1979). Specifically, for each
4th grade school x cohort we compute the fraction with valid earnings data. We then include the
implied control function for each group as a control variable to re-center the residuals in our sample.
Using this approach, we find nearly identical results as those reported in Table 5.
Broadly, any selection correction or imputation method that uses the differential attrition from
earnings data between charters and non-charters will lead to qualitatively similar results because,
as discussed in Section IV, there is little differential attrition on average or across observable
characteristics. Importantly, however, any “worse case” type bound that assumes the missing
13Regular charters can be further subdivided into three categories: college preparatory charters, special missioncharter schools (e.g. religious or STEM education), and the remaining we categorize as miscellaneous. In resultsavailable upon request, we find that the negative earnings effects are driven almost entirely by special mission andmiscellaneous charter schools.
14Appendix Figure 4 plots school-specific estimates of the earnings effects for both No Excuses and regular charterschools. There is significant variation in the school-specific estimates, with the effects centered at or below zero forregular charters and just above zero for No Excuses charters.
18

observations from non-charter schools are significantly lower earning earners will substantially alter
the results. For example, our estimates will significantly understate the true effect of charter
schools if all missing charter observations are due to out-state migration for high paying jobs and
all missing non-charter observations are due to incarceration. Our robustness results should be
interpreted with this caveat in mind.
C. Subsample Results
Appendix Tables 10A-10C report estimates by gender, baseline test scores, and race. At the mean,
charter schools are equally (in)effective at educating male and female students and high- and low-
skill students. For gender, the only variable in which there is a statistical difference is high school
graduation – charter schools and, in particular No Excuses charter schools, have a larger impact
on the likelihood that male students will graduate from high school. There is no difference in
the impact of charter schools on earnings by gender, however. For baseline test scores, high-skill
students are also more likely to experience gains in high school graduation. Earnings effects are
also larger for high-skill students, but the difference is not statistically significant.
More interesting results emerge when we divide the sample by ethnicity. Of the four education
outcomes we consider, three are statistically larger for black and Hispanic students. For the average
charter school, the impact on test scores is 0.030σ (se=0.006) for blacks and Hispanics and -0.040σ
(se=0.007) for whites and Asians. The difference, 0.070σ, is statistically significant at conventional
levels. Treatment effects on the attainment outcomes are similar. The only academic outcome for
which charter schools do not produce better results for blacks and Hispanics is two-year college
enrollment. Consistent with these markedly different test score and attainment results, the impact
on average earnings is $41 (se=114) for blacks and Hispanics and -$509 (se=196) for white and
Asians.
No Excuses schools display a similar pattern for educational outcomes, though the effect sizes are
larger. For example, the impact of No Excuses charter schools on test scores is 0.169σ (se=0.010) for
black and Hispanic students and -0.001σ (se=0.009) for white and Asian students. Our estimates
imply that if a black or Hispanic student spends 5 years in a No Excuses charter school, she or he
would have 0.845σ higher test scores. These effects are similar in size to estimates of No Excuses
schools in urban environments (e.g. Angrist, Pathak, and Walters 2013) and efforts to transport
the best practices from these schools (Fryer 2014).
However, the positive human capital benefits of No Excuses schools do not translate into mea-
surable improvements in earnings or employment for blacks or Hispanics, though the effects are
estimated with considerable error. For blacks and Hispanics, the coefficient on earnings from No
Excuses charters is $154.35 (se=215.09). For whites and Asians, the earnings effect from No Ex-
cuses charters is $30.37 (se=319.62). The p-value on the difference is 0.757 for No Excuses charters.
Of course, the 95 percent confidence interval of these estimates contains modest effect sizes, but
these results are surprisingly small compared to the rhetoric on the power of charter schools to
increase intergenerational mobility among poor minority students.
19
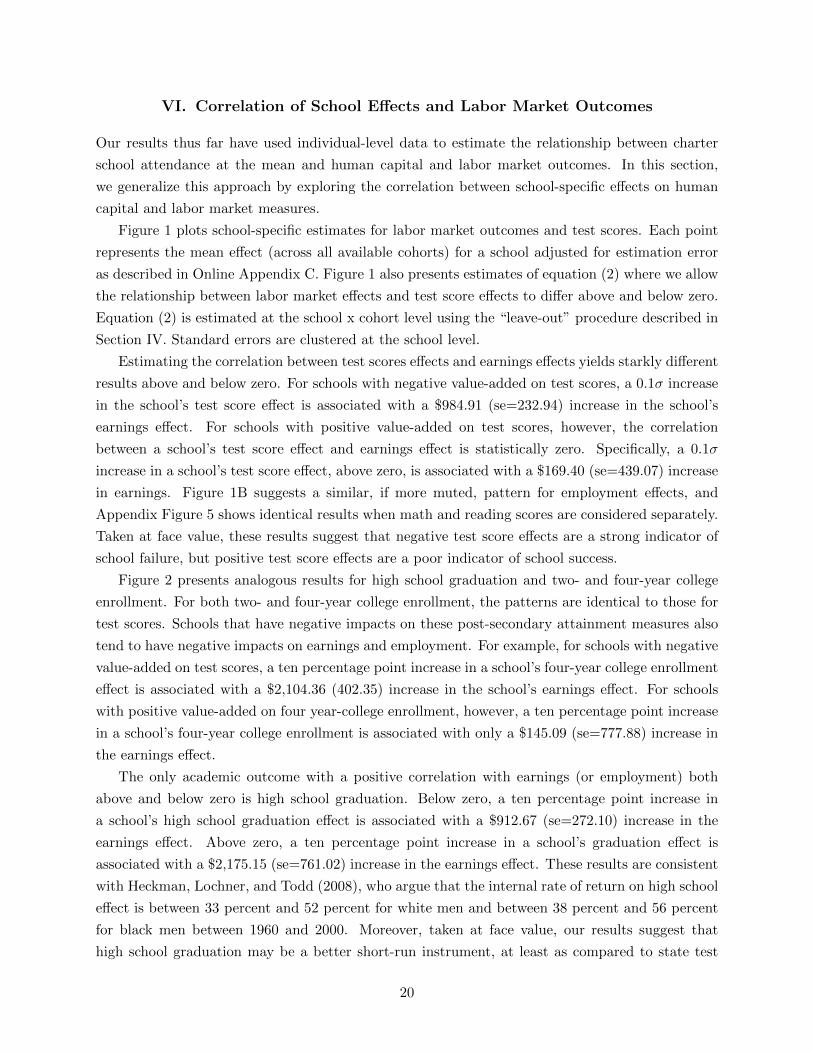
VI. Correlation of School Effects and Labor Market Outcomes
Our results thus far have used individual-level data to estimate the relationship between charter
school attendance at the mean and human capital and labor market outcomes. In this section,
we generalize this approach by exploring the correlation between school-specific effects on human
capital and labor market measures.
Figure 1 plots school-specific estimates for labor market outcomes and test scores. Each point
represents the mean effect (across all available cohorts) for a school adjusted for estimation error
as described in Online Appendix C. Figure 1 also presents estimates of equation (2) where we allow
the relationship between labor market effects and test score effects to differ above and below zero.
Equation (2) is estimated at the school x cohort level using the “leave-out” procedure described in
Section IV. Standard errors are clustered at the school level.
Estimating the correlation between test scores effects and earnings effects yields starkly different
results above and below zero. For schools with negative value-added on test scores, a 0.1σ increase
in the school’s test score effect is associated with a $984.91 (se=232.94) increase in the school’s
earnings effect. For schools with positive value-added on test scores, however, the correlation
between a school’s test score effect and earnings effect is statistically zero. Specifically, a 0.1σ
increase in a school’s test score effect, above zero, is associated with a $169.40 (se=439.07) increase
in earnings. Figure 1B suggests a similar, if more muted, pattern for employment effects, and
Appendix Figure 5 shows identical results when math and reading scores are considered separately.
Taken at face value, these results suggest that negative test score effects are a strong indicator of
school failure, but positive test score effects are a poor indicator of school success.
Figure 2 presents analogous results for high school graduation and two- and four-year college
enrollment. For both two- and four-year college enrollment, the patterns are identical to those for
test scores. Schools that have negative impacts on these post-secondary attainment measures also
tend to have negative impacts on earnings and employment. For example, for schools with negative
value-added on test scores, a ten percentage point increase in a school’s four-year college enrollment
effect is associated with a $2,104.36 (402.35) increase in the school’s earnings effect. For schools
with positive value-added on four year-college enrollment, however, a ten percentage point increase
in a school’s four-year college enrollment is associated with only a $145.09 (se=777.88) increase in
the earnings effect.
The only academic outcome with a positive correlation with earnings (or employment) both
above and below zero is high school graduation. Below zero, a ten percentage point increase in
a school’s high school graduation effect is associated with a $912.67 (se=272.10) increase in the
earnings effect. Above zero, a ten percentage point increase in a school’s graduation effect is
associated with a $2,175.15 (se=761.02) increase in the earnings effect. These results are consistent
with Heckman, Lochner, and Todd (2008), who argue that the internal rate of return on high school
effect is between 33 percent and 52 percent for white men and between 38 percent and 56 percent
for black men between 1960 and 2000. Moreover, taken at face value, our results suggest that
high school graduation may be a better short-run instrument, at least as compared to state test
20

scores, to evaluate the efficacy of charter schools, particularly in the right tail of the achievement
distribution.
VII. Interpretation
Our analysis has established six facts. First, at the mean, charter schools in Texas have little impact
on test scores, educational attainment, or earnings. Second, No Excuses charter schools increase test
scores and educational attainment, but have a small and statistically insignificant effect on earnings.
Third, regular charters modestly increase two-year college enrollment but decrease test scores,
four-year college enrollment, and earnings. Fourth, the impact of charter schools on employment
is small and statistically insignificant throughout. Fifth, at the school level, charter schools that
decrease test scores or college enrollment also tend to decrease earnings and employment, while
charter schools that increase test scores or college enrollment demonstrate no measurable earnings
or employment benefits. Sixth, there is a robust positive correlation of school-level high school
graduation effects with school-level labor market effects throughout the distribution.
In this section, we provide a speculative discussion of the potential mechanisms that could
explain these six facts. Unfortunately, data limitations prevent us from directly testing a large set
of potential mechanisms. For example, it is possible that the null effect of No Excuses charter schools
on earnings is due to the fact that neighborhood quality and social networks are left unchanged.
Consistent with this idea, Chetty, Hendren, and Katz (2016) show that moving disadvantaged
youth to lower poverty neighborhoods has a significant impact on future earnings, despite little
measurable effect on human capital outcomes. Our data do not allow us to observe students’ home
addresses or neighborhood quality, making it impossible to test whether students living in better
neighborhoods benefit more from charter attendance. These data limitations mean that we are
more confident with our set of facts than our ability to credibly identify the mechanisms that
generated them.
Yet, we can still make some progress by exploiting the kink around zero in the correlation
between school human capital effects and school earnings effects. Many intuitive theories conflict
with this result, allowing us to make at least some progress in identifying potential mechanisms. For
example, it is unlikely that neighborhood quality is an important mechanism driving our results,
as the effects of better neighborhoods are likely to be monotonic through zero. Specifically, while
it is possible that the importance of better neighborhoods can explain why the correlation between
school test score effects and school earnings effects is zero for schools that have a positive value-add
on test scores, it seems difficult to explain the strong correlation for these effects among schools
that have negative test score value-add.
Thus, any potential mechanism must have different predictions for schools that increase and
decrease test scores. Below, we explore four such potential explanations: (1) the relative young age
of our sample, (2) the negative effects of high dropout rates at high-performing charter schools, (3)
low returns to human capital in Texas, and (4) multitasking. Another theory potentially consistent
with the data is that Texas labor markets do not reward high test scores. This is inconsistent with
21

our estimates of the return to test scores calculated with Texas data that are strikingly consistent
with those calculated in Chetty, Friedman, and Rockoff (2014).
A. Age of the Sample
One potential explanation for our results is that the individuals in our sample are too young for
us to accurately measure their earnings. It is possible that students who attended charter schools
with high test score value-added will eventually earn more, but we observe them in our data too
soon after schooling to capture these increased earnings. This concern is particularly reasonable
given the fact that earning trajectories are typically increasing in years of education, and that No
Excuses charters increase both two- and four-year college enrollment. If No Excuses students are
on an upward trajectory relative to the comparison group, then we may underestimate the charter
effect on earnings.
We explore the robustness of our results to this concern in three ways. First, we explore the
typical earning trajectories of students in our sample. Appendix Figure 6 plots average earnings by
educational attainment for students in our sample who are at least 30 years old. We plot results both
with and without zero earnings observations included. Not surprisingly, earnings for individuals
with at least four years of college are relatively low for ages 19-22 when these individuals are likely
still enrolled in school. Earnings for these individuals sharply increase for ages 22-26, leveling off
for ages 26-30. In contrast, earning trajectories are relatively stable over all ages for individuals
with some college, only a high school diploma, or less than a high school diploma. Importantly,
average earnings for college educated students exceed the average earnings of other students by age
23, providing some assurance that our sample is not too young.
These results suggest that since students at No Excuses and other high test score value-added
charter schools are more likely to enroll in a four-year college, their earnings schedule is likely flatter
than regular charter students through age 22. Their earnings are then likely to increase sharply
until about age 26. All else equal, this suggests that measuring earnings outcomes for ages 24-26,
as we do in our analysis, is likely to modestly understate the earnings benefits of attending a high
test score value-added charter school. We also find that the correlation of age 26 earnings with age
30 earnings is 0.673 if zeros are included and 0.613 if zeros are not included (see Appendix Table
11). These results are again consistent with our main earnings measure accurately measuring labor
market outcomes.
Appendix Table 12 presents additional evidence on this issue by presenting results for earnings
at ages 28-30, when observed earnings are more indicative of lifetime earnings (Neal and Johnson
1996, Chetty et al. 2014). Columns 1-2 present results using true earnings for the subset of indi-
viduals we observe at ages 28-30. Columns 3-4 present results for our full sample using predicted
earnings at ages 28-30. We calculate predicted earnings using indicators for high school graduation,
two-year college enrollment, four-year college enrollment, and employment from ages 24-26; cubic
polynomials in grades 5-11 math and reading scores, years of two-year college, years of four-year
college, earnings from ages 24-26, and median industry earnings from ages 24-26; and the base-
22

line controls used in all other specifications. If anything, the results are more exacerbated when
estimating our earnings effects on older cohorts.
The coefficient on any charter is twice as large as the full sample, driven by large negative results
from attendance in regular charter schools. The impact of attending a regular charter school for one
year for age 28-30 earnings is -$753.76 (se=229.68). The coefficient on No Excuses attendance is
positive but measured with considerable noise at $308.09 (se=477.68). Appendix Figure 7 presents
results separately for each year relative to high school graduation. Consistent with the results from
Appendix Table 12, earnings and employment effects are constant for No Excuses charter schools
from years 5 to 10. The effect of regular charters is, if anything, becoming more negative from years
5 to 10. None of the results suggest that our main results understate the effects of No Excuses
charters.
Finally, we investigate whether charter school students are more likely to be employed in high
growth industries that may not be reflected in their early-life earnings. Consider the following
thought experiment. Imagine that 26-year-olds in the biotech industry earn similar earnings as
26-year-old managers of McDonald’s. In our analysis thus far, we mask these differences. Yet, the
expected lifetime earnings of an entry-level biotech employee are higher than the lifetime earnings of
a McDonald’s manager. Investigating industry earnings at different percentiles will capture these
differences. Appendix Table 13 presents estimates of the effect of charter school attendance on
industry earnings measured at the 25th, 50th, and 75th percentiles. Of the eighteen coefficients
estimated in the table, not one of them is statistically significant. If anything, all charter students
seem to be in lower paying industries.
B. High Dropout Rates Among High-Performing Charter Schools
A second potential explanation for our results is that high-performing charter schools only help
the select subset of students that are able to endure a more rigorous education program. In this
scenario, our estimates combine the positive effects of “completing” a charter education with the
negative effects of dropping out early. While our empirical design accounts for the number of years
at each charter school, it is possible that students do particularly poorly after leaving a particular
charter school, and that this masks the true potential of these schools.
We provide evidence on this potential mechanism in Appendix Table 14. For each human capital
and earnings outcome, we estimate the effects separately for students who completed a charter (i.e.
those who enrolled in the highest grade offered by a particular charter school) and those that failed
to complete (i.e. those who never enrolled in the highest grade offered by a particular charter
school). On almost every dimension of human capital, students who complete No Excuses schools
have better results than those who did not complete the charter program through the last grade
offered. Yet, again, although the coefficients are markedly different and even of opposite sign,
earnings are measured with such error that we fail to reject that the average earnings of students
who do and do not complete are the same. Regular charters display the opposite pattern – students
who complete have lower human capital and lower earnings, though we fail to reject the null of no
23

difference on earnings or employment.
C. Cross-Sectional Correlations Between Human Capital and Labor Market Outcomes
A third, very simple, explanation for our results is that the estimates are consistent with the re-
turns to human capital observed in cross-sectional data. To put the magnitude of our estimates in
perspective, Appendix Table 15 describes the cross-sectional correlations between academic achieve-
ment in grades 5-10 and various adult outcomes in our data.15 There is a strong correlation between
academic achievement and high school graduation, college attendance, earnings, and employment
both with and without additional controls. With no additional controls, a one σ increase in grade
5-10 reading scores is associated with a $3,545.89 (se=42.99) increase in earnings at ages 24-26, and
one σ increase in grade 5-10 math scores is associated with a $4,129.76 (se=41.74) increase. Condi-
tional on our standard set of the baseline variables and matched cell fixed effects, a one σ increase
in reading scores is associated with a $1,547.60 (se=58.93) increase in earnings, and one σ increase
in math scores is associated with a $2,343.50 (se=56.87) increase. These estimates represent 9.3
and 14.1 percent increases from the sample mean, respectively. These cross-sectional estimates
are strikingly consistent with the cross-sectional correlations between test scores and earnings es-
timated in other settings. For instance, using the estimates from Chetty, Friedman, and Rockoff
(2014), a one standard deviation gain in test scores is associated with an 11 percent increase in
earnings.
In our data, students who attend No Excuses schools demonstrate an increase in test scores of
approximately 0.1σ per year. Thus, based on the cross-sectional estimates from Appendix Table
15, we would expect an approximately 0.9 to 1.4 percent increase in earnings for each year a student
attends a No Excuses school. In practice, we estimate that attending a No Excuses charter school
increases earnings by about 1.1 percent for each year of attendance, or about the same as we might
have expected given our cross-sectional results. For regular charter schools, we estimate that test
scores decrease by approximately 0.05σ per year of attendance, suggesting an earnings decrease of
about 0.45 to 0.7 percent per year. In practice, we estimate effects of approximately negative 1.95
percent per year, larger than we would have expected.
Comparing these results at the mean may mask interesting heterogeneity that is captured in our
school level results. Figure 3 plots the relationship between school-level pooled test score effects
and school-level earnings effects (similar to Figure 1), but imposes a line which represents the
cross-sectional relationship estimated between test scores and earnings in Chetty, Friedman, and
Rockoff (2014) and our internal calculations using data from Texas. For charter schools that have
negative effects on student achievement, the correlation between test score and earnings effects is
steeper than the cross-sectional correlation between test scores and earnings reported by Chetty,
Friedman, and Rockoff (2014) or computed with data from Texas – implying that their students
have more negative earnings than one would expect given the test score decrease. In contrast, the
15Appendix Figure 8 presents analogous non-parametric results graphically. The main conclusions remain thesame in these results.
24

correlation between test score and earnings effects is approximately equal to the cross-sectional
prediction. The smaller than anticipated earnings in non-No Excuses charters may be driven by
any of three channels: (a) compensating differentials for students who attend negative test score
schools (e.g. a terrific art program); (b) parents lack adequate information about which schools are
negative test score value-added; or (c) selection bias – the types of students who knowingly attend
negative test score value-added schools are worse on unobservables that are predictive of earnings.
Unfortunately, we cannot test between these mechanisms.
D. Multitasking
It is also plausible that the positive value-added charter schools have learned to improve test scores,
but (un)intentionally substituted away from other non-tested skills that have value in the labor
market (i.e. creativity or adaptation to language). In this case, schools that are ineffective at
increasing test scores are unwilling to tradeoff the skills they believe are important for long-term
success to demonstrate short term gains on particular measured skills. Conversely, schools that
are effective at increasing short-run measured test scores are willing to make that tradeoff. It is
also plausible that schools that increase test scores simply work harder or smarter and their gains
will have no deleterious impacts on other non-measured skills. This theory may have difficulty
explaining why students in negative value added schools have lower than anticipated earnings
unless “teaching to the test” can potentially build human capital if a school is very low performing
(Lazear 2006) and they are actively choosing to avoid this strategy by continuing to focus on a
more holistic approach.
Unfortunately, we cannot directly test the multitasking theory with our data as it relies on
important, but subtle, changes in curriculum or the management of schools. For instance, one
might want to compare the scope and content of lessons in high-test-score schools versus low-test-
score schools. In low-test-score schools, under this theory, one would expect more lessons that were
not correlated with the content on the state test but which one could argue might be correlated
with labor market success.
In an effort to make modest progress on this theory, we explore detailed data on the inner-
workings of charter schools in New York City, described in Dobbie and Fryer (2013). An enor-
mous amount of information was collected from each school. A principal interview asked about
teacher development, instructional time, data-driven instruction, parent outreach, and school cul-
ture. Teacher interviews asked about professional development, school policies, school culture, and
student assessment. Student interviews asked about school environment, school disciplinary pol-
icy, and future aspirations. Lesson plans were used to measure curricular rigor and the scope and
sequence of instruction. Importantly for this paper, the instruction time variables in the principal
interview gleaned the amount of time that each school spends per week on both tested (e.g. math
and reading) and non-tested subjects (e.g. art, history, foreign language).
Appendix Table 16 investigates differences across a wide set of variables – using the NYC
charter data from Dobbie and Fryer (2013) – that might be consistent with multitasking. At the
25

mean, charters that increase test scores spend 4.5 percent more time on math and reading relative
to charters that decrease test scores. The p-value on the difference – 0.569 – is not significant.
Moreover, they spend 6.3 percent more time on non-tested subjects. The p-value is 0.413. These
data do not seem consistent with multitasking.
Digging deeper, however, there are some differences between achievement-increasing charter
schools in New York City and those that decrease achievement that may be applicable to our
earnings results for charters in Texas. For instance, achievement-increasing charter schools spend
significantly less time on foreign languages and history. This is consistent with Jacob (2005).
Whether this is important for labor market earnings is unknown – but it does provide some evidence
of differences in time focus for schools that increase versus decrease short-run test scores. Some
argue that familiarity with a foreign language, adeptness with social studies, and immersion in
the arts are important elements of a liberal arts education that instill creativity, problem-solving
skills, grit, and other non-cognitive skills that are important for labor market success (Bialystok
and Martin 2004, Mindes 2005, Elpus 2013, Elpus 2014, Catterall 2009, Catterall, Dumais, and
Hampden-Thompson 2012, Bradley, Bonbright, and Dooling 2013). Others believe that these skills
are essentially a “luxury good” and students (particularly those who are low-income), would be
better served by focusing on basic math and reading.
Settling this debate is beyond the scope of this paper. In the end, there is some evidence that
schools that increase achievement do so at the expense of subjects such as foreign language and
history. Whether that can explain the patterns in our data is unknown.
VIII. Conclusion
In this paper, we estimate the impact of charter schools on early-life labor market outcomes using
administrative data from Texas. We find that, at the mean, charter schools have no impact on
test scores and a negative impact on earnings. No Excuses charter schools increase test scores and
four-year college enrollment, but have a small and statistically insignificant impact on earnings,
while regular charter schools decrease test scores, four-year college enrollment, and earnings. Using
school-level estimates, we find that charter schools that decrease test scores also tend to decrease
earnings, while charter schools that increase test scores have no discernible impact on earnings.
In contrast, high school graduation effects are predictive of earnings effects for both low- and
high-value added schools.
The underlying mechanism that drives these results is elusive. We test four hypotheses. Stu-
dents in our main specifications are in their mid-twenties, but investigating older cohorts of students
only strengthens the results. High attrition rates of achievement-increasing charters also fails to
explain the results. The final two mechanisms are, at least, generally consistent with the data.
Some – though not all – of the estimates reported are consistent with the impact on earnings one
might expect given the cross-sectional correlation between test scores and earnings documented in
the literature. Finally, there is some evidence that schools may put subjects such as art and history
on the back burner when they increase test scores and the effects of this practice on labor market
26

outcomes is unknown.
Charter schools, in particular No Excuses charter schools, are considered by many to be the
most important education reform of the past quarter century. At the very least, however, this
paper cautions that charter schools may not have the large effects on earnings many predicted.
It is plausible this is due to the growing pains of an early charter sector that was “building the
plane as they flew it.” This will be better known with the fullness of time. Much more troubling,
it seems, is the possibility that what it takes to increase achievement among the poor in charter
schools deprives them of other skills that are important for labor markets.
References
[1] Abdulkadiroglu, Atila, Joshua D. Angrist, Susan M. Dynarski, Thomas J. Kane, and Parag
A. Pathak. 2011. “Accountability in Public Schools: Evidence from Boston’s Charters and
Pilots.” Quarterly Journal of Economics, 126(2): 699-748.
[2] Abdulkadiroglu, Atila, Joshua D. Angrist, Yusuke Narita, and Parag A. Pathak. 2015. “Re-
search Design Meets Market Design: Using Centralized Assignment for Impact Evaluation.”
NBER Working Paper Series No. 21705.
[3] Allen, Jeanne, and Alison Consoletti. 2007. “Annual Survey of America’s Charter Schools.”
Washington, DC: Center for Education Reform.
[4] Allen, Jeanne, and Alison Consoletti. 2008. “Annual Survey of America’s Charter Schools.”
Washington, DC: Center for Education Reform.
[5] Angrist, Joshua D., Sarah Cohodes, Susan Dynarski, Parag A. Pathak, and Christopher Wal-
ters. 2016. “Stand and Deliver: Effects of Boston’s Charter High Schools on College Prepara-
tion, Entry, and Choice.” Journal of Labor Economics, 34(2): 275-318.
[6] Angrist, Joshua D., Parag A. Pathak and Christopher R. Walters. 2013. “Explaining Charter
School Effectiveness.” American Economic Journal: Applied Economics, 5(4): 1-27.
[7] Baker, George P. 1992. “Incentive Contracts and Performance Measurement.” Journal of Po-
litical Economy, 100(3): 598-614.
[8] Baude, Patrick L., Marcus Casey, Eric A. Hanushek, and Steven G. Rivkin. 2014. “The Evo-
lution of Charter School Quality.” NBER Working Paper No. 20645.
[9] Bettinger, Eric Perry. 2000. “The Effects of Charter Schools and Educational Vouchers on
Students.” Ph.D. diss., Massachusetts Institute of Technology.
[10] Bialystok, Ellen and Michelle M. Martin. 2004. “Attention and Inhibition in Bilingual Children:
Evidence from the Dimensional Change Card Sort Task.” Developmental Sciences, 7(3): 325-
339.
27

[11] Blundell, Richard, and Thomas MaCurdy. 1999. “Labor Supply: A Review of Alternative
Approaches.” Handbook of Labor Economics, Volume 3(A): 1559-1695.
[12] Bradley, Karen, Jane Bonbright, and Shannon Dooling. 2013. “Evidence: A Report on the
Impact of Dance in the K-12 Setting.” National Dance Education Organization.
[13] Card, David and Alan B. Krueger. 1992a. “Does School Quality Matter? Returns to Education
and the Characteristics of Public Schools in the United States.” Journal of Political Economy,
100(1): 1-40.
[14] Card, David and Alan B. Krueger. 1992b. “School Quality and Black-White Relative Earnings:
A Direct Assessment.” Quarterly Journal of Economics, 107(1): 151-200.
[15] Catterall, James S. 2009. Doing Well and Doing Good by Doing Art: The Effects of Education
in the Visual and Performing Arts on the Achievements and Values of Young Adults. Los
Angeles/London: Imagination Group/IGroup Books.
[16] Catterall, James S., Susan A. Dumais, and Gillian Hampden-Thompson. 2012. The Arts and
Achievement in At-Risk Youth: Findings from Four Longitudinal Studies. Washington, DC:
National Endowment for the Arts.
[17] Chandra, Amitabh, Amy Finkelstein, Adam Sacarny, and Chad Syverson. “Healthcare Excep-
tionalism? Performance and Allocation in the U.S. Healthcare Sector.” Forthcoming in the
American Economic Review.
[18] Cheng, Albert, Collin Hitt, Brian Kisida, and Jonathan N. Mills. 2015. “No Excuses Charter
Schools: A Meta-Analysis of the Experimental Evidence on Student Achievement.” EDRE
Working Paper No. 2014-11.
[19] Chetty, Raj, Nathaniel Hendren, and Lawrence F. Katz. 2016. “The Effects of Exposure to Bet-
ter Neighborhoods on Children: New Evidence from the Moving to Opportunity Experiment.”
American Economic Review, 106(4): 855-902.
[20] Chetty, Raj, John N. Friedman, Nathaniel Hilger, Emmanuel Saez, Diane Whitmore Schanzen-
bach, and Danny Yagan. 2011. “How Does Your Kindergarten Classroom Affect Your Earnings?
Evidence from Project STAR.” Quarterly Journal of Economics, 126(4): 1593-1660.
[21] Chetty, Raj, John N. Friedman, and Jonah E. Rockoff. 2014. “Measuring the Impacts of
Teachers II: Teacher Value Added and Student Outcomes in Adulthood.” American Economic
Review, 104(9): 2633-2679.
[22] Chetty, Raj, Nathaniel Hendren, Patrick Kline, and Emmanuel Saez. 2014. “Where is the
Land of Opportunity? The Geography of Intergenerational Mobility in the United States.”
Quarterly Journal of Economics, 129(4): 1553-1623.
28

[23] Cullen, Julie Berry, Brian A. Jacob, and Steven Levitt. 2006. “The Effect of School Choice on
Participants: Evidence from Randomized Lotteries.” Econometrica, 74(5): 1191-1230.
[24] Cullen, Julie Berry, and Randall Reback. 2006. “Tinkering Toward Accolades: School Gaming
Under a Performance Accountability System.” T. J. Gronberg and D. W. Jansen, eds. Improv-
ing School Accountability (Advances in Applied Microeconomics.) Emerald Group Publishing
Limited, 14: 1-34.
[25] Currie, Janet, and Duncan Thomas. 2001. “Early Test Scores, School Quality and SES: Long
Run Effects on Wage and Employment Outcomes.” Worker Wellbeing in a Changing Labor
Market, Volume 20, 103-132.
[26] Deming, David J. 2011. “Better Schools, Less Crime?” Quarterly Journal of Economics, 126(4):
2062-2115.
[27] Deming, David J. 2014. “Using School Choice Lotteries to Test Measures of School Effective-
ness.” American Economic Review Papers and Proceedings, 104(5): 406-411.
[28] Deming, David J., Justine S. Hastings, Thomas J. Kane, and Douglas S. Staiger. 2014. “School
Choice, School Quality, and Postsecondary Attainment.” American Economic Review 104(3):
991-1013.
[29] Deming, David J., Sarah Cohodes, Jennifer Jennings, and Christopher Jencks. “School Ac-
countability, Postsecondary Attainment and Earnings.” Forthcoming in the Review of Eco-
nomics and Statistics.
[30] Dimick, Justin B., Douglas O. Staiger, Onur Baser, and John D. Birkmeyer. 2009. “Composite
Measures for Predicting Surgical Mortality in the Hospital.” Health Affairs 28(4): 1189-1198.
[31] Dobbie, Will, and Roland G. Fryer. 2011. “Are High-Quality Schools Enough to Increase
Achievement among the Poor? Evidence from the Harlem Children’s Zone.” American Eco-
nomic Journal: Applied Economics, 3(3): 158-187.
[32] Dobbie, Will, and Roland G. Fryer. 2013. “Getting Beneath the Veil of Effective Schools:
Evidence from New York City.” American Economic Journal: Applied Economics, 5(4): 28-
60.
[33] Dobbie, Will, and Roland G. Fryer. 2015. “The Medium-Term Impacts of High-Achieving
Charter Schools.” Journal of Political Economy, 123(5): 985-1037.
[34] Elpus, Kenneth. 2013. “Arts Education and Positive Youth Development: Cognitive, Behav-
ioral, and Social Outcomes of Adolescents Who Study the Arts.” National Endowment for the
Arts.
[35] Elpus, Kenneth. 2014. “Arts Education as a Pathway to College: College Admittance, Selec-
tivity, and Completion by Arts and Non-Arts Students.” National Endowment for the Arts.
29

[36] Figlio, David N. 2006. “Testing, Crime and Punishment.” Journal of Public Economics, 90(4):
837-851.
[37] Figlio, David N., and Lawrence S. Getzler. 2006. “Accountability, Ability and Disability: Gam-
ing the System?” T. J. Gronberg and D. W. Jansen, eds. Improving School Accountability
(Advances in Applied Microeconomics). Emerald Group Publishing Limited, 14: 35-49.
[38] Fredriksson, Peter, Bjorn Ockert, and Hessel Oosterbeek. 2013. “Long-Term Effects of Class
Size.” Quarterly Journal of Economics, 128(1): 249-285.
[39] Fryer, Roland G. 2014. “Injecting Successful Charter School Strategies into Traditional Public
Schools: Early Results from an Experiment in Houston.” Quarterly Journal of Economics,
129(3): 1355-1407.
[40] Gleason, Philip, Melissa Clark, Christina Clark Tuttle, Emily Dwoyer, and Marsha Silver-
berg. 2010. “The Evaluation of Charter School Impacts: Final Report.” National Center for
Education and Evaluation and Regional Assistance, 2010-4029.
[41] Griliches, Zvi, and William M. Mason. 1972. “Education, Income, and Ability.” Journal of
Political Economy, 80(3): 74-103.
[42] Grogger, Jeff, and Derek Neal. 2000. “Further Evidence on the Effects of Catholic Secondary
Schooling.” Brookings-Wharton Papers on Urban Affairs, 151-193.
[43] Gronau, Reuben. 1974. “Wage Comparisons-A Selectivity Bias.” Journal of Political Economy,
82(6): 1119-1143.
[44] Haney, Walt. 2000. “The Myth of the Texas Miracle in Education.” Education Policy Analysis
Archives, 8: 41.
[45] Haladyna, Thomas M. 2006. “Perils of Standardized Achievement Testing.” Educational Hori-
zons, 85(1): 30-43.
[46] Haladyna, Thomas M., Susan Bobbit Nolen, and Nancy S. Haas. 1991. “Raising Standardized
Achievement Test Scores and the Origins of Test Score Pollution.” Educational Researcher,
20(5): 2-7.
[47] Heckman, James J. 1979. “Sample Selection Bias as a Specification Error.” Econometrica,
47(1): 153-161.
[48] Heckman, James. J., Jora Stixrud, and Sergio Urzua. 2006. “The Effects of Cognitive and
Noncognitive Abilities on Labor Market Outcomes and Social Behavior.” Journal of Labor
Economics, 24(3): 411-482.
[49] Heckman, James J., Lance J. Lochner, and Petra E. Todd. 2008. “Earnings Functions and
Rates of Return.” IZA Discussion Paper No. 3310.
30

[50] Heckman, James J., and Yona Rubinstein. 2001. “The Importance of Noncognitive Skills:
Lessons from the GED testing program.” American Economic Review, 91(2): 145-149.
[51] Holmes, George M., Jeff DeSimone, and Nicholas G. Rupp. 2003. “Does School Choice Increase
School Quality?” NBER Working Paper No. 9683.
[52] Holmstrom, Bengt, and Paul Milgrom. 1991. “Multitask Principal-Agent Analyses: Incentive
Contracts, Asset Ownership, and Job Design.” Journal of Law, Economics, and Organization,
7: 24-52.
[53] Jackson, C. Kirabo. 2012. “School Competition and Teacher Labor Markets: Evidence from
Charter School Entry in North Carolina.” Journal of Public Economics, 96(5): 431-448.
[54] Jacob, Brian A. 2005. “Accountability, Incentives and Behavior: The Impact of High-Stakes
Testing in the Chicago Public Schools.” Journal of Public Economics, 89(5-6): 761-796.
[55] Jacob, Brian A., and Jesse Rothstein. “The Measurement of Student Ability in Modern As-
sessment Systems.” Forthcoming in Journal of Economic Perspectives.
[56] Jacob, Brian A. and Lars Lefgren. 2007. “What Do Parents Value in Education? An Empirical
Investigation of Parents’ Revealed Preferences for Teachers.” Quarterly Journal of Economics,
122(4): 1603–1637.
[57] Jennings, Jennifer L., and Andrew A. Beveridge. 2009. “How Does Test Exemption Affect
Schools’ and Students’ Academic Performance?” Educational Evaluation and Policy Analysis,
31(2): 153-175.
[58] Klein, Stephen P., Laura Hamilton, Daniel F. McCaffrey, and Brian Stecher. 2000. “What Do
Test Scores in Texas Tell Us?” Santa Monica, CA: Rand Corporation.
[59] Lazear, Edward P. 2006. “Speeding, Terrorism, and Teaching to the Test.” Quarterly Journal
of Economics, 121(3): 1029-1061.
[60] McNeil, Linda McSpadden, and Angela Valenzuela. 2001. “The Harmful Impact of the TAAS
System of Testing in Texas: Beneath the Accountability Rhetoric.” Raising Standards or
Raising Barriers? Inequality and High Stakes Testing in Public Education. New York, NY:
Century Foundation, 127-150.
[61] McNeil, Linda McSpadden, Eileen Coppola, Judy Radigan, and Julian Vasquez Heilig. 2008.
“Avoidable Losses: High-Stakes Accountability and the Dropout Crisis.” Education Policy
Analysis Archives, 16(3).
[62] Mindes, Gayle. 2005. “Social Studies in Today’s Early Childhood Curricula.” Young Children,
60(5): 12-18.
31

[63] Miron, Gary, and Christopher Nelson. 2001. “Student Academic Achievement in Charter
Schools: What We Know and Why We Know So Little.” Taking Account of Charter Schools:
What’s Happened and What’s Next, 161-175.
[64] Morris, Carl N. 1983. “Parametric Empirical Bayes Inference: Theory and Applications.”
Journal of the American Statistical Association, 78(381): 47-55.
[65] Neal, Derek A., and William R. Johnson. 1996. “The Role of Pre-Market Factors in Black-
White Wage Differences.” Journal of Political Economy, 104(5): 869-895.
[66] Neal, Derek. 1997. “The Effects of Catholic Secondary Schooling on Educational Achievement.”
Journal of Labor Economics, 15(1): 98-123.
[67] O’Neill, June. 1990. “The Role of Human Capital in Earnings Differences between Black and
White Men.” Journal of Economic Perspectives, 4(4): 25-45.
[68] Sass, Tim R., Ronald W. Zimmer, Brian Gill, and Kevin Booker. 2016. “Charter High Schools’
Effects on Long Term Attainment and Earnings.” Journal of Policy Analysis and Management,
35: 683-706.
[69] Schneider, Mark, and Jack Buckley. 2003. “Making the Grade: Comparing DC Charter Schools
to Other DC Public Schools.” Educational Evaluation and Policy Analysis, 25(2): 203-215.
[70] Segal, Carmit. 2008. “Classroom Behavior.” Journal of Human Resources, 43(4): 783-814.
[71] Texas Education Agency. 1994. “Texas Student Assessment Program Technical Digest for the
Academic Year 1993-1994.” Austin, TX: National Computer System.
[72] Thernstrom, Abigail, and Stephan Thernstrom. 2003. No Excuses: Closing the Racial Gap in
Learning. New York: Simon and Schuster.
[73] Tuttle, Christina Clark, Brian Gill, Philip Gleason, Virginia Knechtel, Ira Nichols-Barrer, and
Alexandra Resch. 2013. “KIPP Middle Schools: Impacts on Achievement and Other Out-
comes.” Mathematica Policy Research, Princeton, NJ.
[74] Vasquez Heilig, Julian, and Linda Darling-Hammond. 2008. “Accountability Texas-Style: The
Progress and Learning of Urban Minority Students in a High-Stakes Testing Context.” Edu-
cational Evaluation and Policy Analysis, 30(2): 75-110.
[75] Whitman, David. 2008. Sweating the Small Stuff: Inner-City Schools and the New Paternalism.
Washington, D.C.: Thomas B. Fordham Foundation and Institute.
32

Table 1Students in Estimation Sample
Full Trad. Baseline Test In Cohort MatchedSample Elem. Covars Scores Texas Size Cell
(1) (2) (3) (4) (5) (6) (7)Non-Charters 1420877 1413231 1319580 1226527 1162148 1162148 188666No Excuses Charters 1358 1345 1192 1164 1051 1039 1039Regular Charters 4905 4830 4633 4365 4090 3860 3860
Notes: This table details the number of students in our estimation sample. All rows are restricted to Texas publicschool students expected to graduate high school in or before 2005-2006. Column 1 is the total number of studentswith no additional restrictions. Column 2 drops students who did not attend a traditional elementary school in 4thgrade. Column 3 drops students with missing gender and race. Column 4 drops students with no middle or highschool test scores. Column 5 drops students who transferred to an out-of-state school. Column 6 drops charter schoolcohorts of fewer than 10 students. Column 7 drops students who are not in a matched cell of 4th grade school, cohort,gender, and race.
33

Table 2Summary Statistics
Full Sample Estimation SampleNon- No Regular Non- No Regular
Charters Excuses Charters Charters Excuses ChartersBaseline Characteristics (1) (2) (3) (4) (5) (6)
Female 0.488 0.539 0.487 0.511 0.546 0.494Black 0.140 0.108 0.329 0.224 0.116 0.337Hispanic 0.363 0.586 0.344 0.288 0.525 0.332Asian 0.022 0.063 0.010 0.006 0.075 0.009Free Lunch 0.518 0.627 0.647 0.476 0.576 0.6354th On Time 0.813 0.827 0.786 0.833 0.832 0.8064th Grade Spec. Ed 0.138 0.063 0.157 0.103 0.066 0.1294th Grade Gifted 0.090 0.106 0.063 0.100 0.120 0.0684th Grade LEP 0.140 0.371 0.147 0.115 0.321 0.1334th Grade At Risk 0.425 0.545 0.509 0.392 0.504 0.4944th Grade Math 0.010 0.206 -0.329 0.030 0.217 -0.3044th Grade Reading 0.007 0.193 -0.234 0.064 0.215 -0.214Missing 4th Math 0.216 0.346 0.284 0.176 0.313 0.245Missing 4th Reading 0.225 0.352 0.300 0.185 0.321 0.259
TreatmentYears Any Charter 0.000 2.871 1.858 0.000 2.919 1.892Years No Excuses 0.000 2.803 0.000 0.000 2.835 0.000Years Regular Charters 0.000 0.068 1.858 0.000 0.084 1.892
Outcomes5th-11th Grade Math -0.089 0.251 -0.560 -0.085 0.243 -0.5325th-11th Grade Reading -0.089 0.224 -0.419 -0.050 0.242 -0.391High School Graduation 0.713 0.736 0.623 0.761 0.828 0.663Any Two-Year College 0.310 0.279 0.264 0.322 0.337 0.302Years Two-Year College 0.929 0.895 0.814 0.971 1.090 0.937Any Four-Year College 0.238 0.262 0.138 0.291 0.320 0.159Years Four-Year College 0.944 1.012 0.478 1.155 1.236 0.546Avg. Earnings (24-26) 14816.180 13411.150 11188.850 16598.530 15986.780 12563.630Avg. Employment (24-26) 0.582 0.503 0.551 0.642 0.592 0.599
N Schools 9983 5 40 7290 5 40N Students 1420877 1358 4905 188666 1039 3860
Notes: This table reports descriptive statistics for Texas public school students in our data graduating high schoolby 2005-2006. Columns 1-3 report means for all Texas public school students in the indicated schools. Columns 4-6report means for students who are in the final estimation sample described in Table 1. See Online Appendix B foradditional details on the variable definitions and sample.
34

Table 3Charter School Attendance and Test Scores
Math Scores Reading Scores Pooled ScoresPanel A: Pooled Results (1) (2) (3) (4) (5) (6)
Any Charter −0.011∗ −0.009 0.021∗∗∗ 0.022∗∗∗ 0.005 0.006(0.006) (0.006) (0.005) (0.005) (0.005) (0.005)
Panel B: By Charter TypeNo Excuses 0.092∗∗∗ 0.095∗∗∗ 0.098∗∗∗ 0.099∗∗∗ 0.095∗∗∗ 0.097∗∗∗
(0.009) (0.009) (0.008) (0.008) (0.008) (0.008)Regular Charter −0.080∗∗∗ −0.078∗∗∗ −0.030∗∗∗ −0.029∗∗∗ −0.055∗∗∗ −0.054∗∗∗
(0.007) (0.007) (0.007) (0.007) (0.006) (0.006)Baseline Controls Yes Yes Yes Yes Yes YesMatched Cell FE No Yes No Yes No YesN Students x Years 903281 903281 900712 900712 1803993 1803993Dep. Variable Mean -0.006 -0.006 0.030 0.030 0.012 0.012
Notes: This table reports OLS estimates of the effect of charter attendance on test scores. We report the coefficientand standard error on the number of years spent at the indicated charter school type. Odd columns control forthe number of years spent at charter schools not in our main sample, the baseline controls listed in Table 2, cubicpolynomials in grade 4 math and reading scores, and 4th grade school x cohort effects. Even columns add 4thgrade school x cohort x race x gender effects. All specifications stack 5th-11th grade test score outcomes and clusterstandard errors by student. *** = significant at 1 percent level, ** = significant at 5 percent level, * = significant at10 percent level. See Online Appendix B for additional details on the variable definitions and sample.
35

Table 4Charter School Attendance and Academic Attainment
High School Grad. Two-Year Enrollment Four-Year EnrollmentPanel A: Pooled Results (1) (2) (3) (4) (5) (6)
Any Charter 0.012∗∗∗ 0.012∗∗∗ 0.015∗∗∗ 0.015∗∗∗ 0.002 0.003(0.002) (0.002) (0.003) (0.003) (0.003) (0.003)
Panel B: By Charter TypeNo Excuses 0.024∗∗∗ 0.025∗∗∗ 0.012∗∗ 0.012∗∗ 0.026∗∗∗ 0.028∗∗∗
(0.003) (0.003) (0.005) (0.005) (0.005) (0.005)Regular Charter 0.004 0.004 0.016∗∗∗ 0.016∗∗∗ −0.013∗∗∗ −0.013∗∗∗
(0.003) (0.003) (0.003) (0.003) (0.003) (0.003)Baseline Controls Yes Yes Yes Yes Yes YesMatched Cell FE No Yes No Yes No YesN Students 193565 193565 193565 193565 193565 193565Dep. Variable Mean 0.760 0.760 0.322 0.322 0.289 0.289
Notes: This table reports OLS estimates of the effect of charter attendance on academic attainment. We report thecoefficient and standard error on the number of years spent at the indicated charter school type. Odd columns controlfor the number of years spent at charter schools not in our main sample, the baseline controls listed in Table 2, cubicpolynomials in grade 4 math and reading scores, and 4th grade school x cohort effects. Even columns add 4th gradeschool x cohort x race x gender effects. All specifications include one observation per student and cluster standarderrors at the 4th grade school by cohort level. *** = significant at 1 percent level, ** = significant at 5 percentlevel, * = significant at 10 percent level. See Online Appendix B for additional details on the variable definitions andsample.
36
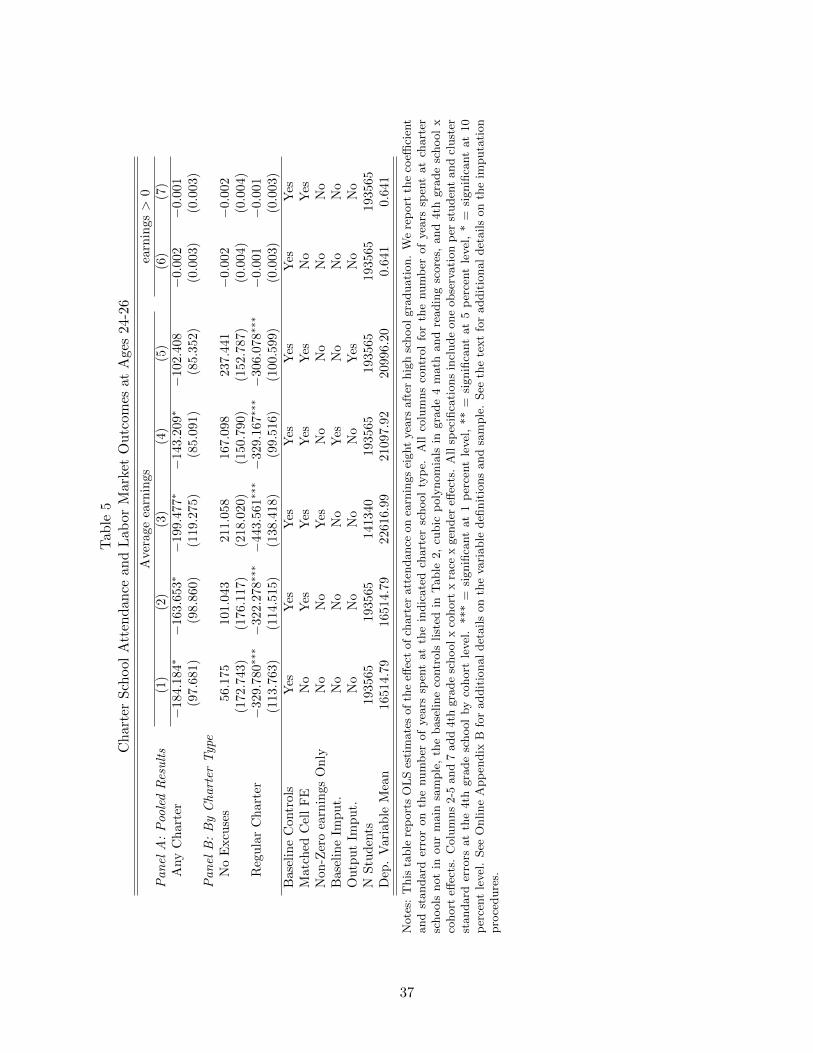
Tab
le5
Ch
arte
rS
chool
Att
end
ance
and
Lab
orM
arket
Ou
tcom
esat
Age
s24
-26
Ave
rage
earn
ings
earn
ings>
0Panel
A:PooledResults
(1)
(2)
(3)
(4)
(5)
(6)
(7)
Any
Char
ter
−18
4.184∗
−163.6
53∗
−199.4
77∗
−143.2
09∗
−102.4
08
−0.
002
−0.
001
(97.
681)
(98.
860)
(119.
275)
(85.
091)
(85.
352)
(0.0
03)
(0.0
03)
Panel
B:ByCharter
Type
No
Excu
ses
56.1
75
101.
043
211.
058
167.
098
237.
441
−0.
002
−0.
002
(172.7
43)
(176.1
17)
(218.0
20)
(150.7
90)
(152.7
87)
(0.0
04)
(0.0
04)
Reg
ula
rC
har
ter
−32
9.7
80∗∗
∗−
322.2
78∗∗
∗−
443.5
61∗∗
∗−
329.1
67∗∗
∗−
306.0
78∗∗
∗−
0.001
−0.
001
(113.7
63)
(114.5
15)
(138.4
18)
(99.5
16)
(100.5
99)
(0.0
03)
(0.0
03)
Bas
elin
eC
ontr
ols
Yes
Yes
Yes
Yes
Yes
Yes
Yes
Mat
ched
Cel
lF
EN
oY
esY
esY
esY
esN
oY
esN
on-Z
ero
earn
ings
On
lyN
oN
oY
esN
oN
oN
oN
oB
asel
ine
Imp
ut.
No
No
No
Yes
No
No
No
Ou
tpu
tIm
pu
t.N
oN
oN
oN
oY
esN
oN
oN
Stu
den
ts19
3565
193565
141340
193565
193565
193565
193565
Dep
.V
aria
ble
Mea
n16
514.7
916514.7
922616.9
921097.9
220996.2
00.6
41
0.6
41
Note
s:T
his
table
rep
ort
sO
LS
esti
mate
sof
the
effec
tof
chart
eratt
endance
on
earn
ings
eight
yea
rsaft
erhig
hsc
hool
gra
duati
on.
We
rep
ort
the
coeffi
cien
tand
standard
erro
ron
the
num
ber
of
yea
rssp
ent
at
the
indic
ate
dch
art
ersc
hool
typ
e.A
llco
lum
ns
contr
ol
for
the
num
ber
of
yea
rssp
ent
at
chart
ersc
hools
not
inour
main
sam
ple
,th
ebase
line
contr
ols
list
edin
Table
2,
cubic
poly
nom
ials
ingra
de
4m
ath
and
readin
gsc
ore
s,and
4th
gra
de
school
xco
hort
effec
ts.
Colu
mns
2-5
and
7add
4th
gra
de
school
xco
hort
xra
cex
gen
der
effec
ts.
All
spec
ifica
tions
incl
ude
one
obse
rvati
on
per
studen
tand
clust
erst
andard
erro
rsat
the
4th
gra
de
school
by
cohort
level
.***
=si
gnifi
cant
at
1p
erce
nt
level
,**
=si
gnifi
cant
at
5p
erce
nt
level
,*
=si
gnifi
cant
at
10
per
cent
level
.See
Online
App
endix
Bfo
raddit
ional
det
ails
on
the
vari
able
defi
nit
ions
and
sam
ple
.See
the
text
for
addit
ional
det
ails
on
the
imputa
tion
pro
cedure
s.
37

Figure 1Correlation of Labor Market and Test Score Effects
(A) Earnings and Test Scores (B) Employment and Test Scores
βx<0 = 9849.156 (2329.473)
βx>0 = 1694.026 (4390.765)
-500
0-2
500
025
0050
00Ea
rnin
gs E
ffect
-.2 -.1 0 .1 .2Pooled Test Effect
Regular Charters No Excuses
βx<0 = 0.131 (0.044)
βx>0 = -0.149 (0.083)
-.15
0.1
5Em
ploy
men
t Effe
ct
-.2 -.1 0 .1 .2Pooled Test Effect
Regular Charters No Excuses
Notes: These figures plot the correlation between school-level labor market effects and school-level test score effects.Observations are weighted by the number of students at each school in the earnings estimation sample. The solidline is estimated at the school-cohort level. See Table 2 notes for details on the sample and variable construction andOnline Appendix C for details on estimation of the school effects.
38
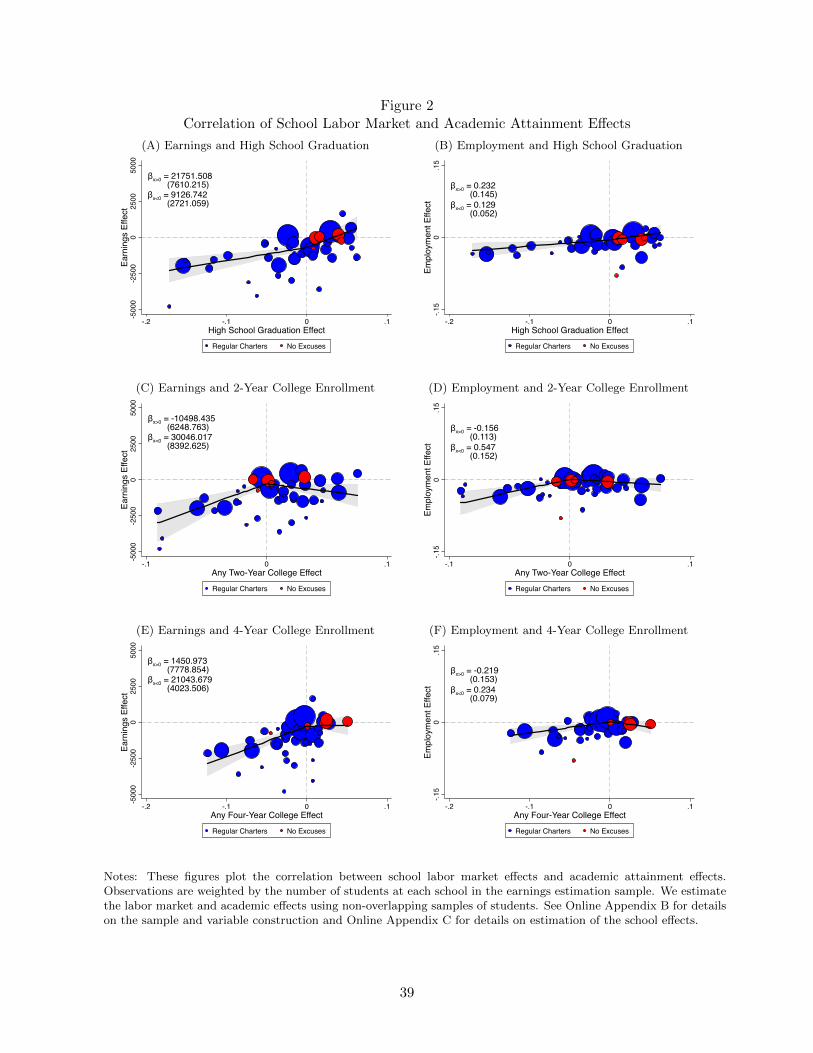
Figure 2Correlation of School Labor Market and Academic Attainment Effects
(A) Earnings and High School Graduation (B) Employment and High School Graduation
βx<0 = 9126.742 (2721.059)
βx>0 = 21751.508 (7610.215)
-500
0-2
500
025
0050
00Ea
rnin
gs E
ffect
-.2 -.1 0 .1High School Graduation Effect
Regular Charters No Excuses
βx<0 = 0.129 (0.052)
βx>0 = 0.232 (0.145)
-.15
0.1
5Em
ploy
men
t Effe
ct
-.2 -.1 0 .1High School Graduation Effect
Regular Charters No Excuses
(C) Earnings and 2-Year College Enrollment (D) Employment and 2-Year College Enrollment
βx<0 = 30046.017 (8392.625)
βx>0 = -10498.435 (6248.763)
-500
0-2
500
025
0050
00Ea
rnin
gs E
ffect
-.1 0 .1Any Two-Year College EffectRegular Charters No Excuses
βx<0 = 0.547 (0.152)
βx>0 = -0.156 (0.113)
-.15
0.1
5Em
ploy
men
t Effe
ct
-.1 0 .1Any Two-Year College EffectRegular Charters No Excuses
(E) Earnings and 4-Year College Enrollment (F) Employment and 4-Year College Enrollment
βx<0 = 21043.679 (4023.506)
βx>0 = 1450.973 (7778.854)
-500
0-2
500
025
0050
00Ea
rnin
gs E
ffect
-.2 -.1 0 .1Any Four-Year College EffectRegular Charters No Excuses
βx<0 = 0.234 (0.079)
βx>0 = -0.219 (0.153)
-.15
0.1
5Em
ploy
men
t Effe
ct
-.2 -.1 0 .1Any Four-Year College EffectRegular Charters No Excuses
Notes: These figures plot the correlation between school labor market effects and academic attainment effects.Observations are weighted by the number of students at each school in the earnings estimation sample. We estimatethe labor market and academic effects using non-overlapping samples of students. See Online Appendix B for detailson the sample and variable construction and Online Appendix C for details on estimation of the school effects.
39

Figure 3Correlation of Earnings and Test Score Effects
βx<0 = 9849.156 (2329.473)
βx>0 = 1694.026 (4390.765)
-500
0-2
500
025
0050
00Ea
rnin
gs E
ffect
-.2 -.1 0 .1 .2Pooled Test Effect
Regular Charters No ExcusesTexas Chetty, Friedman, and Rockoff
Notes: This figure plots the correlation between school-level earnings effects and school-level test score effects. Ob-servations are weighted by the number of students at each school in the earnings estimation sample. The solid line isestimated at the school-cohort level. The dotted and dashed lines are student-level correlations estimated in the givensample. See Table 2 notes for details on the sample and variable construction and Online Appendix C for detailson estimation of the school effects. See Appendix Table 14 notes for details on the estimation of the student-levelcorrelations in the Texas sample. See Chetty, Friedman, and Rockoff (2014) for details on their estimation of thecorrelation in a sample of students from a large urban school district.
40

Online Appendix A: Supplemental Results
Appendix Table 1Charter Schools in Estimation Sample
District Years Open Grades Cohorts StudentsPanel A: No Excuses Charters (1) (2) (3) (4) (5)
Harmony Science Academy Houston 2001-2014 6-12 2 95IDEA College Prep Donna 2001-2014 5-12 1 24KIPP Academy* Houston 1996-2014 5-12 5 211Yes College Preparatory Houston 1999-2014 5-12 5 331Uplift Education - North Hills Prep Irving 1998-2014 5-12 5 351
Panel B: Regular Charter - College PrepA+ Academy Dallas 2001-2014 5-12 2 72Arlington Classics Academy Arlington 2000-2014 5-9 3 43Bright Ideas Charter Wichita Falls 1999-2014 5-12 2 33Chaparral Star Academy Austin 1999-2014 5-12 4 71Girls & Boys Prep Academy Houston 1997-2014 5-12 5 465Katherine Anne Porter Wimberly 2000-2014 9-12 5 221Life Charter School of Oak Cliff Lancaster 1999-2014 5-12 3 130Pineywoods Community Academy Lufkin 2000-2014 5-9 3 83Rick Hawkins HS* San Antonio 2005-2014 5-12 5 324The Ehrhart School Beaumont 2002-2014 5-12 3 56Treetops School International Fort Worth 1999-2014 5-12 5 137Two Dimensions Preparatory* Houston 1999-2014 5-8 1 10Universal Academy* Irving 1999-2014 5-12 3 141
Panel C: Regular Charter - Special MissionAristoi Academy Arlington 1997-2014 5-6 5 144Eden Park Academy Austin 1999-2014 5-8 2 36Guardian Angel Performance Arts San Antonio 2000-2010 6-8 3 68Heritage Academy Dallas 2000-2000 9-11 1 16Inspired Vision Dallas 2002-2014 5-9 1 12Kaleidoscope/Caleidoscopio Houston 1998-2012 6-8 3 80Nyos Charter School Austin 1999-2014 5-12 3 67Oak Cliff Academy Dallas 2000-2014 5-8 1 12Odyssey Academy Galveston 2000-2014 5-8 2 143Tekoa Academy Port Arthur 2000-2014 5-9 1 12Texas Empowerment Academy Austin 1999-2014 5-12 3 59Waxahachie Faith Family Academy Desoto 2000-2014 5-12 4 105West Houston Charter 2 Katy 1999-2007 6-12 1 14XXI Century Academy Corpus Christi 2001-2001 9-11 1 11
Panel D: Regular Charter - Misc.Accelerated Intermediate Charter Houston 2002-2010 6-8 2 38Crossroad Community Charter Houston 2001-2006 9-12 5 225CSAS Academy of Beaumont Beaumont 2000-2009 5-8 1 25CSAS Academy of Houston Houston 1999-2003 5-8 2 62CSAS Academy of San Antonio San Antonio 2000-2014 5-8 1 25Emma L Harrison Charter Waco 1999-1999 5-9 4 52Education Center International Rowlett 2002-2014 5-12 4 73Fruit of Excellence School Bastrop 2000-2010 5-12 3 46Mainland Preparatory Academy Texas City 1999-2014 5-8 2 36
41

Rameses School San Antonio 1999-1999 5-10 1 10Raul Yzaguirre School for Success* Houston 1997-2014 5-12 5 475Renaissance Charter HS Irving 1997-2000 5-11 5 228
Notes: This table describes the charter schools in our estimation sample. Column 2 reports the first and last datesof the school operation in our data. Column 3 reports the largest grade span attended by students in our estimationsample. Column 4 reports the number of distinct entry cohorts in the estimation sample. Column 5 reports the totalnumber of students in the estimation sample. * indicates schools with multiple campus IDs.
42

Appendix Table 2ACharter Attendance and Baseline Characteristics
Non-Charter Any No RegularMean Charter Excuses Charters
Panel A: Leave-Out Controls (1) (2) (3) (4)Free Lunch 0.480 −0.002 −0.014∗∗∗ 0.005
(0.003) (0.004) (0.003)4th Grade On Time 0.832 0.008∗∗∗ 0.014∗∗∗ 0.005∗
(0.002) (0.003) (0.003)4th Grade Spec. Ed 0.103 0.003∗ 0.001 0.005∗∗
(0.002) (0.002) (0.002)4th Grade Gifted 0.100 −0.001 0.003 −0.003∗
(0.002) (0.004) (0.002)4th Grade LEP 0.116 0.004∗∗ 0.010∗∗∗ 0.000
(0.002) (0.003) (0.002)4th Grade At Risk 0.395 0.001 0.001 0.002
(0.002) (0.003) (0.003)4th Grade Math 0.021 −0.010∗∗ 0.016∗∗∗ −0.025∗∗∗
(0.004) (0.005) (0.005)4th Grade Reading 0.049 0.003 0.004 0.003
(0.003) (0.004) (0.004)
Panel B: Characteristics not in Controls3rd Grade On Time 0.853 0.001 0.001 0.001
(0.001) (0.001) (0.001)3rd Grade Math 0.047 0.003 0.023∗ −0.009
(0.006) (0.012) (0.007)3rd Grade Reading 0.060 0.004 0.014 −0.002
(0.006) (0.010) (0.007)
Panel C: Predicted OutcomesPredicted Earnings 22478.66 −28.679∗∗∗ 44.315∗∗∗ −72.397∗∗∗
(9.322) (10.618) (12.616)Predicted Employment 64.108 −0.038∗∗∗ 0.005 −0.064∗∗∗
(0.014) (0.021) (0.019)N Students 188666 4899 1039 3860
Notes: This table reports OLS estimates of the correlation between charter attendance and baseline variables. Column1 reports the mean of the indicated variable for students at non-charter schools. Column 2 reports the coefficientand standard error on the number of years at any charter school controlling for the baseline controls listed in Table2 and 4th grade school x cohort x race x gender effects. Columns 3-4 report the coefficient and standard error onthe number of years at the indicated charter school type controlling for the baseline controls listed in Table 2 and4th grade school x cohort x race x gender effects. In Panel A, the controls do not include the indicated dependentvariable. In Panels B and C all controls from Table 2 are used. Predicted earnings and employment are calculated inthe full estimation sample using the baseline controls listed in Table 2 and 4th grade school x cohort x race x gendereffects. *** = significant at 1 percent level, ** = significant at 5 percent level, * = significant at 10 percent level.See Online Appendix B for additional details on the variable construction and sample. See the text for additionaldetails on the specification.
43

Appendix Table 2BCharter Attendance and Baseline Characteristics in NYC Data
Non-Charter Any No RegularMean Charter Excuses Charters
Panel A: Leave-Out Controls (1) (2) (3) (4)Free Lunch 0.924 −0.001 −0.005∗∗ 0.003
(0.001) (0.002) (0.002)4th Grade On Time 0.851 0.005∗∗∗ 0.006∗∗∗ 0.003
(0.001) (0.002) (0.002)4th Grade Spec. Ed 0.132 −0.003∗∗∗ −0.004∗∗∗ −0.002
(0.001) (0.001) (0.002)4th Grade LEP 0.164 −0.002∗∗ −0.000 −0.004∗∗∗
(0.001) (0.002) (0.002)4th Grade Math −0.278 0.002 0.007∗ −0.002
(0.003) (0.004) (0.004)4th Grade Reading −0.246 0.005∗ 0.013∗∗∗ −0.003
(0.003) (0.003) (0.004)
Panel B: Characteristics not in Controls3rd Grade On Time 0.868 0.001 −0.000 0.002
(0.001) (0.001) (0.001)3rd Grade Math −0.225 −0.001 0.004 −0.005
(0.003) (0.004) (0.004)3rd Grade Reading −0.223 0.000 0.007∗ −0.007
(0.003) (0.004) (0.004)N Students 70898 8036 2678 5358
Notes: This table reports OLS estimates of the correlation between charter attendance and baseline variables in theNYC data used by Dobbie and Fryer (2013). Specifically, we focus on the sample of charter schools with experimentalestimates in Dobbie and Fryer (2013). Column 1 reports the mean of the indicated variable for students at non-charter schools. Column 2 reports the coefficient and standard error on the number of years at any charter schoolin the sample controlling for free lunch status, if a student reached 4th grade on time, 4th grade special educationstatus, 4th grade Limited English Proficiency status, 4th grade math and ELA test scores, and 4th grade schoolx cohort x race x gender effects. Columns 3-4 report the coefficient and standard error on the number of years atthe indicated charter school type with the same controls as Column 2. In Panel A, the controls do not include theindicated dependent variable. In Panel B all controls are used. *** = significant at 1 percent level, ** = significantat 5 percent level, * = significant at 10 percent level.
44

Ap
pen
dix
Tab
le3
Zer
oE
arn
ings
and
Bas
elin
eC
har
acte
rist
ics
Non-
Any
Non-
No
Reg
ula
rC
hart
erC
hart
er(1
)-(2
)C
hart
erE
xcu
ses
Chart
ers
(4)-
(5)
(4)-
(6)
(5)-
(6)
Panel
A:BaselineVars.
(1)
(2)
(3)
(4)
(5)
(6)
(7)
(8)
(9)
Fem
ale
−0.0
31∗∗
∗−
0.0
28∗∗
0.0
01
−0.0
31∗∗
∗−
0.0
33
−0.0
28∗
0.7
90
0.9
37
0.8
56
(0.0
03)
(0.0
14)
(0.0
03)
(0.0
25)
(0.0
16)
Bla
ck0.0
48
−0.0
63
0.7
58
0.0
48
0.7
13∗∗
∗−
0.2
35
0.0
00
0.4
20
0.0
03
(0.1
05)
(0.2
90)
(0.1
05)
(0.0
68)
(0.3
09)
Whit
e0.0
90
−0.0
12
0.7
27
0.0
90
0.7
44∗∗
∗−
0.1
84
0.0
00
0.4
31
0.0
03
(0.1
05)
(0.2
91)
(0.1
05)
(0.0
50)
(0.3
09)
His
panic
0.0
05
−0.1
31
0.7
24
0.0
05
0.6
35∗∗
∗−
0.3
00
0.0
00
0.3
81
0.0
03
(0.1
05)
(0.2
90)
(0.1
05)
(0.0
59)
(0.3
08)
Asi
an
0.1
45
0.0
86
0.7
79
0.1
45
0.8
23∗∗
∗−
0.0
38
0.0
00
0.5
87
0.0
08
(0.1
03)
(0.2
88)
(0.1
03)
(0.0
60)
(0.3
12)
Fre
eL
unch
0.0
03
−0.0
08
0.3
23
0.0
03
−0.0
56
0.0
05
0.1
12
0.9
22
0.1
38
(0.0
03)
(0.0
15)
(0.0
03)
(0.0
37)
(0.0
17)
4th
Gra
de
On
Tim
e−
0.0
19∗∗
∗−
0.0
15
0.1
08
−0.0
19∗∗
∗−
0.0
36
−0.0
12
0.6
98
0.6
44
0.5
78
(0.0
03)
(0.0
17)
(0.0
03)
(0.0
41)
(0.0
19)
4th
Gra
de
Sp
ec.
Ed
−0.0
62∗∗
∗−
0.0
91∗∗
∗0.0
06
−0.0
62∗∗
∗−
0.0
20
−0.0
97∗∗
∗0.5
64
0.1
48
0.2
96
(0.0
05)
(0.0
24)
(0.0
05)
(0.0
68)
(0.0
26)
4th
Gra
de
Gif
ted
0.0
35∗∗
∗0.0
12
0.6
82
0.0
35∗∗
∗0.0
10
0.0
10
0.6
83
0.4
43
0.9
96
(0.0
04)
(0.0
29)
(0.0
04)
(0.0
62)
(0.0
32)
4th
Gra
de
LE
P−
0.0
90∗∗
∗−
0.0
95∗∗
∗0.2
44
−0.0
90∗∗
∗−
0.0
79∗
−0.0
99∗∗
∗0.8
48
0.6
98
0.6
94
(0.0
05)
(0.0
25)
(0.0
05)
(0.0
43)
(0.0
31)
4th
Gra
de
At
Ris
k−
0.0
24∗∗
∗−
0.0
24
0.2
67
−0.0
24∗∗
∗−
0.0
48
−0.0
20
0.5
60
0.7
61
0.5
07
(0.0
03)
(0.0
16)
(0.0
03)
(0.0
40)
(0.0
17)
4th
Gra
de
Math
−0.0
11∗∗
∗−
0.0
05
0.0
31
−0.0
11∗∗
∗−
0.0
17
−0.0
03
0.8
44
0.3
43
0.5
82
(0.0
02)
(0.0
09)
(0.0
02)
(0.0
25)
(0.0
10)
4th
Gra
de
Rea
din
g−
0.0
07∗∗
∗−
0.0
15
0.0
07
−0.0
07∗∗
∗−
0.0
09
−0.0
15
0.8
92
0.4
07
0.8
18
(0.0
02)
(0.0
10)
(0.0
02)
(0.0
25)
(0.0
11)
Mis
sing
4th
Math
0.1
98∗∗
∗0.2
08∗∗
∗0.6
20
0.1
98∗∗
∗0.2
22
0.2
00∗∗
∗0.8
83
0.9
71
0.8
96
(0.0
08)
(0.0
44)
(0.0
08)
(0.1
65)
(0.0
46)
Mis
sing
4th
Rea
din
g0.1
10∗∗
∗0.1
54∗∗
∗0.0
05
0.1
10∗∗
∗0.1
81
0.1
49∗∗
∗0.6
32
0.3
28
0.8
50
(0.0
07)
(0.0
44)
(0.0
07)
(0.1
62)
(0.0
46)
Panel
B:PredictedOutcomes
Pre
dic
ted
Earn
ings
−0.0
04∗∗
∗−
0.0
05∗∗
∗0.2
23
−0.0
04∗∗
∗−
0.0
12∗∗
∗−
0.0
04∗∗
0.0
70
0.7
85
0.0
78
(0.0
00)
(0.0
01)
(0.0
00)
(0.0
04)
(0.0
02)
Pre
dic
ted
Em
plo
ym
ent
−0.0
11∗∗
∗−
0.0
13∗∗
∗0.0
00
−0.0
11∗∗
∗−
0.0
14∗∗
∗−
0.0
12∗∗
∗0.0
00
0.0
21
0.0
88
(0.0
00)
(0.0
01)
(0.0
00)
(0.0
01)
(0.0
01)
NStu
den
ts188666
4899
188666
1039
3860
45

Note
s:T
his
table
rep
ort
sO
LS
esti
mate
sof
the
corr
elati
on
bet
wee
nze
roobse
rved
earn
ings
bet
wee
nages
24-2
6and
base
line
vari
able
s.C
olu
mns
1-2
and
4-6
rep
ort
sth
eco
effici
ent
and
standard
erro
ron
the
indic
ate
dva
riable
inth
ein
dic
ate
dsc
hool
typ
e.C
olu
mns
3and
7-9
rep
ort
the
p-v
alu
eon
the
F-t
est
that
the
indic
ate
dco
effici
ents
are
equal.
Pre
dic
ted
earn
ings
and
emplo
ym
ent
are
calc
ula
ted
usi
ng
the
base
line
contr
ols
list
edin
Table
2and
4th
gra
de
school
xco
hort
xra
cex
gen
der
effec
ts.
All
spec
ifica
tions
contr
ol
for
4th
gra
de
school
xco
hort
effec
tsand
clust
erst
andard
erro
rsat
the
4th
gra
de
school
by
cohort
level
.***
=si
gnifi
cant
at
1p
erce
nt
level
,**
=si
gnifi
cant
at
5p
erce
nt
level
,*
=si
gnifi
cant
at
10
per
cent
level
.See
Online
App
endix
Bfo
raddit
ional
det
ails
on
the
vari
able
const
ruct
ion
and
sam
ple
.
46

Ap
pen
dix
Tab
le4
Ch
arte
rS
chool
Att
end
ance
and
In-
and
Ou
t-of
-Sta
teC
olle
geA
tten
dan
ce
Tex
as
Coll
eges
Non
-Tex
as
Coll
eges
Any
Tw
o-Y
ear
Any
Fou
r-Y
ear
Any
Tw
o-Y
ear
Any
Fou
r-Y
ear
Panel
A:PooledResults
(1)
(2)
(3)
(4)
Any
Ch
arte
r−
0.00
3−
0.004
0.002
0.002
0.000
0.000
0.009∗∗
∗0.
009∗∗
∗
(0.0
03)
(0.0
03)
(0.0
03)
(0.0
03)
(0.0
01)
(0.0
01)
(0.0
02)
(0.0
02)
Panel
B:ByCharter
Type
No
Excu
ses
−0.
013∗∗
∗−
0.014∗∗
∗0.0
17∗∗
∗0.
016∗∗
∗0.
000
0.000
0.018∗∗
∗0.
019∗∗
∗
(0.0
04)
(0.0
04)
(0.0
04)
(0.0
04)
(0.0
01)
(0.0
01)
(0.0
03)
(0.0
03)
Reg
ula
rC
har
ter
0.00
8∗∗
0.007∗∗
−0.0
15∗∗
∗−
0.015∗∗
∗0.
000
0.000
−0.0
02∗∗
−0.
002∗∗
(0.0
04)
(0.0
04)
(0.0
03)
(0.0
03)
(0.0
01)
(0.0
01)
(0.0
01)
(0.0
01)
Bas
elin
eC
ontr
ols
Yes
Yes
Yes
Yes
Yes
Yes
Yes
Yes
Mat
ched
Cel
lF
EN
oY
esN
oY
esN
oY
esN
oY
esN
Stu
den
ts12
7898
127898
127898
127898
127898
127898
127898
127898
Dep
.V
aria
ble
Mea
n0.
268
0.2
68
0.2
30
0.2
30
0.0
06
0.0
06
0.0
44
0.0
44
Note
s:T
his
table
rep
ort
sO
LS
esti
mate
sof
the
effec
tof
chart
eratt
endance
on
in-
and
out-
of-
state
colleg
eatt
endance
mea
sure
dusi
ng
the
Nati
onal
Stu
den
tC
leari
nghouse
.T
he
sam
ple
isre
stri
cted
toT
exas
public
school
studen
tsin
our
esti
mati
on
sam
ple
who
gra
duate
dhig
hsc
hool
bet
wee
n2008
and
2009.
We
rep
ort
the
coeffi
cien
tand
standard
erro
ron
the
num
ber
of
yea
rssp
ent
at
the
indic
ate
dch
art
ersc
hool
typ
e.O
dd
colu
mns
contr
ol
for
the
num
ber
of
yea
rssp
ent
at
chart
ersc
hools
not
inour
main
sam
ple
,th
ebase
line
contr
ols
list
edin
Table
2,
cubic
poly
nom
ials
ingra
de
4m
ath
and
readin
gsc
ore
s,and
4th
gra
de
school
xco
hort
effec
ts.
Even
colu
mns
add
4th
gra
de
school
xco
hort
xra
cex
gen
der
effec
ts.
***
=si
gnifi
cant
at
1p
erce
nt
level
,**
=si
gnifi
cant
at
5p
erce
nt
level
,*
=si
gnifi
cant
at
10
per
cent
level
.See
Online
App
endix
Bfo
raddit
ional
det
ails
on
the
vari
able
const
ruct
ion
and
sam
ple
.
47

Appendix Table 5Ever Attended Results: Test ScoresMath Scores Reading Scores Pooled Scores
Panel A: Pooled Results (1) (2) (3) (4) (5) (6)Any Charter −0.071∗∗∗ −0.067∗∗∗ 0.012 0.014 −0.029∗∗∗ −0.027∗∗
(0.012) (0.012) (0.011) (0.011) (0.011) (0.011)Panel B: By Charter Type
No Excuses 0.246∗∗∗ 0.254∗∗∗ 0.262∗∗∗ 0.264∗∗∗ 0.254∗∗∗ 0.259∗∗∗
(0.023) (0.023) (0.021) (0.020) (0.020) (0.020)Regular Charter −0.188∗∗∗ −0.185∗∗∗ −0.081∗∗∗ −0.079∗∗∗ −0.135∗∗∗ −0.132∗∗∗
(0.013) (0.013) (0.013) (0.013) (0.012) (0.012)Baseline Controls Yes Yes Yes Yes Yes YesMatched Cell FE No Yes No Yes No YesN Students x Years 903281 903281 900712 900712 1803993 1803993Dep. Variable Mean -0.006 -0.006 0.030 0.030 0.012 0.012
Notes: This table reports OLS estimates of the effect of charter attendance on test score outcomes. We report thecoefficient and standard error on ever attending the indicated charter school type. Odd columns control for the numberof years spent at charter schools not in our main sample, the baseline controls listed in Table 2, cubic polynomials ingrade 4 math and reading scores, and 4th grade school x cohort effects. Even columns add 4th grade school x cohortx race x gender effects. All specifications stack 5th-11th grade test score outcomes and cluster standard errors bystudent. *** = significant at 1 percent level, ** = significant at 5 percent level, * = significant at 10 percent level.See Online Appendix B for additional details on the variable construction and sample.
48

Ap
pen
dix
Tab
le6
Eve
rA
tten
ded
Res
ult
s:A
cad
emic
Att
ain
men
tH
igh
Sch
ool
Gra
d.
Tw
o-Y
ear
En
roll
men
tF
ou
r-Y
ear
En
roll
men
tPanel
A:PooledResults
(1)
(2)
(3)
(4)
(5)
(6)
Any
Ch
arte
r−
0.016∗∗
∗−
0.0
15∗∗
∗0.0
20∗∗
∗0.
020∗∗
∗−
0.030∗∗
∗−
0.0
29∗∗
∗
(0.0
07)
(0.0
07)
(0.0
07)
(0.0
07)
(0.0
06)
(0.0
06)
Panel
B:ByCharter
Type
No
Excu
ses
0.0
70∗∗
∗0.0
72∗∗
∗0.0
27∗
0.025
0.048∗∗
∗0.0
53∗∗
∗
(0.0
13)
(0.0
14)
(0.0
16)
(0.0
16)
(0.0
14)
(0.0
15)
Reg
ula
rC
har
ter
−0.
037∗∗
∗−
0.0
37∗∗
∗0.
020∗∗
∗0.0
20∗∗
∗−
0.051∗∗
∗−
0.0
51∗∗
∗
(0.0
08)
(0.0
08)
(0.0
07)
(0.0
07)
(0.0
06)
(0.0
07)
Bas
elin
eC
ontr
ols
Yes
Yes
Yes
Yes
Yes
Yes
Mat
ched
Cel
lF
EN
oY
esN
oY
esN
oY
esN
Stu
den
ts193565
193565
193565
193565
193565
193565
Dep
.V
aria
ble
Mea
n0.7
60
0.7
60
0.3
22
0.3
22
0.2
89
0.2
89
Note
s:T
his
table
rep
ort
sO
LS
esti
mate
sof
the
effec
tof
chart
eratt
endance
on
aca
dem
icatt
ain
men
toutc
om
es.
We
rep
ort
the
coeffi
cien
tand
standard
erro
ron
ever
att
endin
gth
ein
dic
ate
dch
art
ersc
hool
typ
e.O
dd
colu
mns
contr
ol
for
the
num
ber
of
yea
rssp
ent
at
chart
ersc
hools
not
inour
main
sam
ple
,th
ebase
line
contr
ols
list
edin
Table
2,
cubic
poly
nom
ials
ingra
de
4m
ath
and
readin
gsc
ore
s,and
4th
gra
de
school
xco
hort
effec
ts.
Even
colu
mns
add
4th
gra
de
school
xco
hort
xra
cex
gen
der
effec
ts.
All
spec
ifica
tions
incl
ude
one
obse
rvati
on
per
studen
tand
clust
erst
andard
erro
rsat
the
4th
gra
de
school
by
cohort
level
.***
=si
gnifi
cant
at
1p
erce
nt
level
,**
=si
gnifi
cant
at
5p
erce
nt
level
,*
=si
gnifi
cant
at
10
per
cent
level
.See
Online
App
endix
Bfo
raddit
ional
det
ails
on
the
vari
able
const
ruct
ion
and
sam
ple
.
49

Ap
pen
dix
Tab
le7
Eve
rA
tten
ded
Res
ult
s:L
abor
Mar
ket
Ou
tcom
esat
Age
s24
-26
Ave
rage
Earn
ings
Earn
ings>
0Panel
A:PooledResults
(1)
(2)
(3)
(4)
(5)
(6)
(7)
Any
Ch
arte
r−
1648.6
77∗∗
∗−
1586.6
02∗∗
∗−
1733.
941∗∗
∗−
1292.
095∗∗
∗−
1281.2
49∗∗
∗−
0.023∗∗
∗−
0.0
24∗∗
∗
(239.0
87)
(238.6
35)
(300.0
99)
(207.7
82)
(210.6
86)
(0.0
07)
(0.0
07)
Panel
B:ByCharter
Type
No
Excu
ses
−10
04.6
66∗
−825.0
59
−278.5
36
−265.2
92
−87.1
98
−0.
028∗
−0.0
29∗
(571.8
99)
(584.2
44)
(713.7
03)
(474.2
29)
(482.0
66)
(0.0
15)
(0.0
15)
Reg
ula
rC
har
ter
−17
79.4
49∗∗
∗−
1748.8
70∗∗
∗−
2075.
884∗∗
∗−
1539.
423∗∗
∗−
1574.0
41∗∗
∗−
0.022∗∗
∗−
0.0
21∗∗
∗
(250.3
38)
(248.9
79)
(321.7
89)
(223.7
85)
(227.6
41)
(0.0
07)
(0.0
07)
Bas
elin
eC
ontr
ols
Yes
Yes
Yes
Yes
Yes
Yes
Yes
Mat
ched
Cel
lF
EN
oY
esY
esY
esY
esN
oY
esN
on-Z
ero
Ear
nin
gsO
nly
No
No
Yes
No
No
No
No
Bas
elin
eIm
pu
t.N
oN
oN
oY
esN
oN
oN
oO
utp
ut
Imp
ut.
No
No
No
No
Yes
No
No
NS
tud
ents
1935
65193565
141340
193565
193565
193565
193565
Dep
.V
aria
ble
Mea
n16
514.
79
16514.7
922616.9
921097.9
220996.2
00.6
41
0.6
41
Note
s:T
his
table
rep
ort
sO
LS
esti
mate
sof
the
effec
tof
chart
eratt
endance
on
earn
ings
eight
yea
rsaft
erhig
hsc
hool
gra
duati
on.
We
rep
ort
the
coeffi
cien
tand
standard
erro
ron
ever
att
endin
gth
ein
dic
ate
dch
art
ersc
hool
typ
e.A
llco
lum
ns
contr
ol
for
the
num
ber
of
yea
rssp
ent
at
chart
ersc
hools
not
inour
main
sam
ple
,th
ebase
line
contr
ols
list
edin
Table
2,
cubic
poly
nom
ials
ingra
de
4m
ath
and
readin
gsc
ore
s,and
4th
gra
de
school
xco
hort
effec
ts.
Colu
mns
2-5
and
7add
4th
gra
de
school
xco
hort
xra
cex
gen
der
effec
ts.
All
spec
ifica
tions
incl
ude
one
obse
rvati
on
per
studen
tand
clust
erst
andard
erro
rsat
the
4th
gra
de
school
by
cohort
level
.***
=si
gnifi
cant
at
1p
erce
nt
level
,**
=si
gnifi
cant
at
5p
erce
nt
level
,*
=si
gnifi
cant
at
10
per
cent
level
.See
Online
App
endix
Bfo
raddit
ional
det
ails
on
the
vari
able
const
ruct
ion
and
sam
ple
.
50

Ap
pen
dix
Tab
le8
Ch
arte
rS
chool
Att
end
ance
and
Yea
rsof
Col
lege
Yea
rsT
wo-Y
ear
Yea
rsF
ou
r-Y
ear
Panel
A:PooledResults
(1)
(2)
(3)
(4)
(5)
(6)
Any
Ch
arte
r0.
053∗∗
∗0.
051∗∗
∗0.
005
−0.0
09
−0.
006
−0.
052∗∗
(0.0
09)
(0.0
09)
(0.0
13)
(0.0
13)
(0.0
13)
(0.0
22)
Panel
B:ByCharter
Type
No
Excu
ses
0.0
29∗∗
0.028∗∗
−0.
032∗
0.0
93∗∗
∗0.
101∗∗
∗−
0.006
(0.0
14)
(0.0
14)
(0.0
16)
(0.0
22)
(0.0
23)
(0.0
27)
Reg
ula
rC
har
ter
0.067∗∗
∗0.
065∗∗
∗0.
031∗
−0.0
70∗∗
∗−
0.070∗∗
∗−
0.116∗∗
∗
(0.0
11)
(0.0
11)
(0.0
18)
(0.0
12)
(0.0
12)
(0.0
33)
Bas
elin
eC
ontr
ols
Yes
Yes
Yes
Yes
Yes
Yes
Mat
ched
Cel
lF
EN
oY
esY
esN
oY
esY
esE
ver
En
roll
edO
nly
No
No
Yes
No
No
Yes
NS
tud
ents
193565
193565
86815
193565
193565
61088
Dep
.V
aria
ble
Mea
n0.9
71
0.9
71
2.7
29
1.1
43
1.1
43
3.9
01
Note
s:T
his
table
rep
ort
sO
LS
esti
mate
sof
the
effec
tof
chart
eratt
endance
on
aca
dem
icatt
ain
men
t.W
ere
port
the
coeffi
cien
tand
standard
erro
ron
the
num
ber
of
yea
rssp
ent
at
the
indic
ate
dch
art
ersc
hool
typ
e.O
dd
colu
mns
contr
ol
for
the
num
ber
of
yea
rssp
ent
at
chart
ersc
hools
not
inour
main
sam
ple
,th
ebase
line
contr
ols
list
edin
Table
2,
cubic
poly
nom
ials
ingra
de
4m
ath
and
readin
gsc
ore
s,and
4th
gra
de
school
xco
hort
effec
ts.
Colu
mns
2,
3,
5,
and
6add
4th
gra
de
school
xco
hort
xra
cex
gen
der
effec
ts.
All
spec
ifica
tions
incl
ude
one
obse
rvati
on
per
studen
tand
clust
erst
andard
erro
rsat
the
4th
gra
de
school
by
cohort
level
.***
=si
gnifi
cant
at
1p
erce
nt
level
,**
=si
gnifi
cant
at
5p
erce
nt
level
,*
=si
gnifi
cant
at
10
per
cent
level
.See
Online
App
endix
Bfo
raddit
ional
det
ails
on
the
vari
able
defi
nit
ions
and
sam
ple
.
51

Appendix Table 9Charter School Attendance and Labor Market Outcomes at Ages 24-26
Max EarningsPanel A: Pooled Results (1) (2) (3) (4) (5)
Any Charter −211.365∗ −196.244∗ −231.837∗ −169.857∗ −134.625(113.861) (114.578) (133.532) (94.207) (94.038)
Panel B: By Charter TypeNo Excuses 71.157 107.83 242.255 197.053 264.586
(195.141) (198.259) (233.803) (159.338) (160.802)Regular Charter −382.502∗∗∗ −378.466∗∗∗ −513.708∗∗∗ −389.736∗∗∗ −373.871∗∗∗
(135.998) (136.155) (157.911) (112.58) (113.588)Baseline Controls Yes Yes Yes Yes YesMatched Cell FE No Yes Yes Yes YesNon-Zero Earnings Only No No Yes No NoBaseline Imput. No No No Yes NoOutput Imput. No No No No YesN Students 193565 193565 141340 193565 193565Dep. Variable Mean 21507.26 21507.26 29454.18 28000.59 27835.08
Notes: This table reports OLS estimates of the effect of charter attendance on earnings eight years after high schoolgraduation. We report the coefficient and standard error on the number of years spent at the indicated charter schooltype. All columns control for the number of years spent at charter schools not in our main sample, the baselinecontrols listed in Table 2, cubic polynomials in grade 4 math and reading scores, and 4th grade school x cohorteffects. Columns 2-5 add 4th grade school x cohort x race x gender effects. All specifications include one observationper student and cluster standard errors at the 4th grade school by cohort level. *** = significant at 1 percent level,** = significant at 5 percent level, * = significant at 10 percent level. See Online Appendix B for additional detailson the variable definitions and sample. See the text for additional details on the imputation procedures.
52

Appendix Table 10AResults by Student Gender
Pooled HS 2-Year 4-Year AverageScores Grad College College Earnings Earnings>0
Panel A: Pooled Results (1) (2) (3) (4) (5) (6)Male x Any Charter 0.003 0.014∗∗∗ 0.017∗∗∗ 0.000 −153.975 0.000
(0.007) (0.003) (0.004) (0.004) (152.426) (0.004)Female x Any Charter 0.011 0.010∗∗∗ 0.012∗∗∗ 0.005 −163.845 −0.003
(0.007) (0.003) (0.004) (0.004) (126.182) (0.003)p-value 0.443 0.337 0.379 0.399 0.961 0.466
Panel B: By Charter TypeMale x No Excuses 0.099∗∗∗ 0.035∗∗∗ 0.020∗∗∗ 0.029∗∗∗ −81.548 −0.010
(0.012) (0.005) (0.007) (0.007) (317.817) (0.006)Female x No Excuses 0.095∗∗∗ 0.017∗∗∗ 0.006 0.027∗∗∗ 256.301 0.003
(0.010) (0.004) (0.006) (0.007) (193.375) (0.005)p-value 0.837 0.003 0.097 0.851 0.368 0.080
Male x Regular Charter −0.050∗∗∗ 0.004 0.015∗∗∗ −0.013∗∗∗ −189.568 0.005(0.009) (0.004) (0.004) (0.004) (173.618) (0.004)
Female x Regular Charter −0.056∗∗∗ 0.005 0.017∗∗∗ −0.012∗∗ −468.044∗∗∗ −0.008(0.009) (0.004) (0.005) (0.005) (159.515) (0.005)
p-value 0.656 0.904 0.806 0.747 0.255 0.042Baseline Controls Yes Yes Yes Yes Yes YesMatched Cell FE Yes Yes Yes Yes Yes YesN Students 193565 193565 193565 193565 193565 193565
Notes: This table reports results for male and female students. *** = significant at 1 percent level, ** = significantat 5 percent level, * = significant at 10 percent level. See Online Appendix B for additional details on the variabledefinitions and Tables 3-5 notes for details on the estimation framework.
53

Appendix Table 10BResults by Student Baseline Test Score
Pooled HS 2-Year 4-Year AverageScores Grad College College Earnings Earnings>0
Panel A: Pooled Results (1) (2) (3) (4) (5) (6)Low Scores x Any Charter −0.017∗∗∗ 0.006∗∗ 0.015∗∗∗ −0.005 −207.361 0.000
(0.007) (0.003) (0.005) (0.005) (206.656) (0.004)High Scores x Any Charter −0.001 0.016∗∗∗ 0.021∗∗∗ 0.009∗∗ −2.752 0.002
(0.009) (0.005) (0.005) (0.004) (146.563) (0.004)p-value 0.114 0.051 0.380 0.042 0.437 0.690
Panel B: By Charter TypeLow Scores x No Excuses 0.029∗∗∗ 0.013∗∗ 0.004 0.024∗∗∗ 173.203 0.003
(0.008) (0.003) (0.006) (0.007) (309.895) (0.006)High Scores x No Excuses 0.118∗∗∗ 0.037∗∗ 0.041∗∗∗ 0.036∗∗∗ 425.189 0.003
(0.015) (0.008) (0.010) (0.009) (322.342) (0.008)p-value 0.000 0.001 0.000 0.284 0.592 0.962
Low Scores x Regular Charter −0.069∗∗∗ −0.002 0.027∗∗∗ −0.034∗∗∗ −607.823∗∗ −0.002(0.010) (0.005) (0.007) (0.006) (248.965) (0.005)
High Scores x Regular Charter −0.044∗ 0.009 0.014∗∗∗ 0.000 −139.855 0.002(0.010) (0.005) (0.005) (0.005) (176.374) (0.005)
p-value 0.085 0.133 0.140 0.000 0.127 0.517Baseline Controls Yes Yes Yes Yes Yes YesMatched Cell FE Yes Yes Yes Yes Yes YesN Students 193565 193565 193565 193565 193565 193565
Notes: This table reports results for students with below and above median baseline test scores. *** = significantat 1 percent level, ** = significant at 5 percent level, * = significant at 10 percent level. See Online Appendix B foradditional details on the variable definitions and Tables 3-5 notes for details on the estimation framework.
54

Appendix Table 10CResults by Student Ethnicity
Pooled HS 2-Year 4-Year AverageScores Grad College College Earnings Earnings>0
Panel A: Pooled Results (1) (2) (3) (4) (5) (6)Black/Hispanic x Any Charter 0.030∗∗∗ 0.016∗∗∗ 0.017∗∗∗ 0.006∗∗ 41.150 0.000
(0.006) (0.003) (0.003) (0.003) (114.733) (0.003)White/Asian x Any Charter −0.040∗∗∗ 0.005 0.011∗∗ −0.004 −509.073∗∗∗ −0.004
(0.007) (0.004) (0.005) (0.005) (196.619) (0.004)p-value 0.000 0.020 0.284 0.076 0.019 0.384
Panel B: By Charter TypeBlack/Hispanic x No Excuses 0.169∗∗∗ 0.034∗∗∗ 0.023∗∗∗ 0.032∗∗∗ 154.348 −0.003
(0.010) (0.004) (0.005) (0.007) (215.088) (0.005)White/Asian x No Excuses −0.001 0.012∗∗ −0.004 0.022∗∗∗ 30.369 −0.001
(0.009) (0.005) (0.007) (0.007) (319.615) (0.007)p-value 0.000 0.000 0.000 0.257 0.757 0.817
Black/Hispanic x Regular Charter −0.042∗∗∗ 0.006 0.013∗∗∗ −0.007∗∗ −17.790 0.002(0.007) (0.004) (0.004) (0.003) (129.015) (0.004)
White/Asian x Regular Charter −0.081∗∗∗ 0.001 0.023∗∗∗ −0.023∗∗∗ −923.750∗∗∗ −0.007(0.011) (0.005) (0.006) (0.006) (224.460) (0.005)
p-value 0.003 0.421 0.188 0.015 0.001 0.161Baseline Controls Yes Yes Yes Yes Yes YesMatched Cell FE Yes Yes Yes Yes Yes YesN Students 193565 193565 193565 193565 193565 193565
Notes: This table reports results for white/Asian and black/Hispanic students. *** = significant at 1 percent level,** = significant at 5 percent level, * = significant at 10 percent level. See Online Appendix B for additional detailson the variable definitions and Tables 3-5 notes for details on the estimation framework.
55

Appendix Table 11Correlation of Earnings Over the Life Cycle
Texas DataCorrelation with Correlation withAge 30 Earnings Age 30 Earnings
Age Including Zeros Excluding Zeros(1) (2) (3)21 0.316 0.18322 0.391 0.27223 0.502 0.41324 0.580 0.51125 0.614 0.54426 0.673 0.61327 0.742 0.68928 0.822 0.77529 0.922 0.88730 1.000 1.000
Notes: This table reports the correlation between individual earnings at the indicated age with age 30 earnings. Thesample includes students in our estimation sample graduating high school in 2002 - 2003. See text for additionaldetails.
56

Appendix Table 12Charter School Attendance and Realized and Predicted Earnings at Ages 28-30
Realized Earnings Predicted EarningsPanel A: Pooled Results (1) (2) (3) (4)
Any Charter −423.736∗ −399.507∗ 5.639 11.306(230.377) (229.871) (13.302) (13.122)
Panel B: By Charter TypeNo Excuses 273.501 308.086 65.192∗∗∗ 82.141∗∗∗
(485.044) (477.682) (23.961) (23.400)Regular Charter −776.191∗∗∗ −753.757∗∗∗ −30.270∗∗ −30.943∗∗
(230.060) (229.681) (15.239) (14.984)Baseline Controls Yes Yes Yes YesMatched Cell FE No Yes No YesOutput-Based Imputation No No Yes YesN Students 90590 90590 193514 193514Dep. Variable Mean 21211.070 21211.070 12902.940 12902.940
Notes: This table reports OLS estimates of the effect of charter attendance on realized and predicted earningsat ages 28-30. The dependent variable for columns 1-2 is realized average earnings for ages 28-30 for studentsgraduating between 2002-2004. The dependent variable for columns 3-4 is predicted earnings for ages 28-30 Texasstudents graduating between 2002-2006. We predict earnings in the sample of students graduating between 2002-2004 with non-zero earnings using indicators for high school graduation, two-year college enrollment, four-year collegeenrollment, and employment from ages 24-26; cubic polynomials in grade 5-11 math and reading scores, years of two-year college, years of four-year college, earnings from ages 24-26, and median industry earnings from ages 24-26; andthe baseline controls used in all other specifications. We report the coefficient and standard error on the number ofyears attended at the indicated charter school type. Odd columns control for the number of years spent at charterschools not in our main sample, the baseline controls listed in Table 2, cubic polynomials in grade 4 math and readingscores, and 4th grade school x cohort effects. Even columns add 4th grade school x cohort x race x gender effects.*** = significant at 1 percent level, ** = significant at 5 percent level, * = significant at 10 percent level. See OnlineAppendix B for additional details on the variable construction and sample.
57
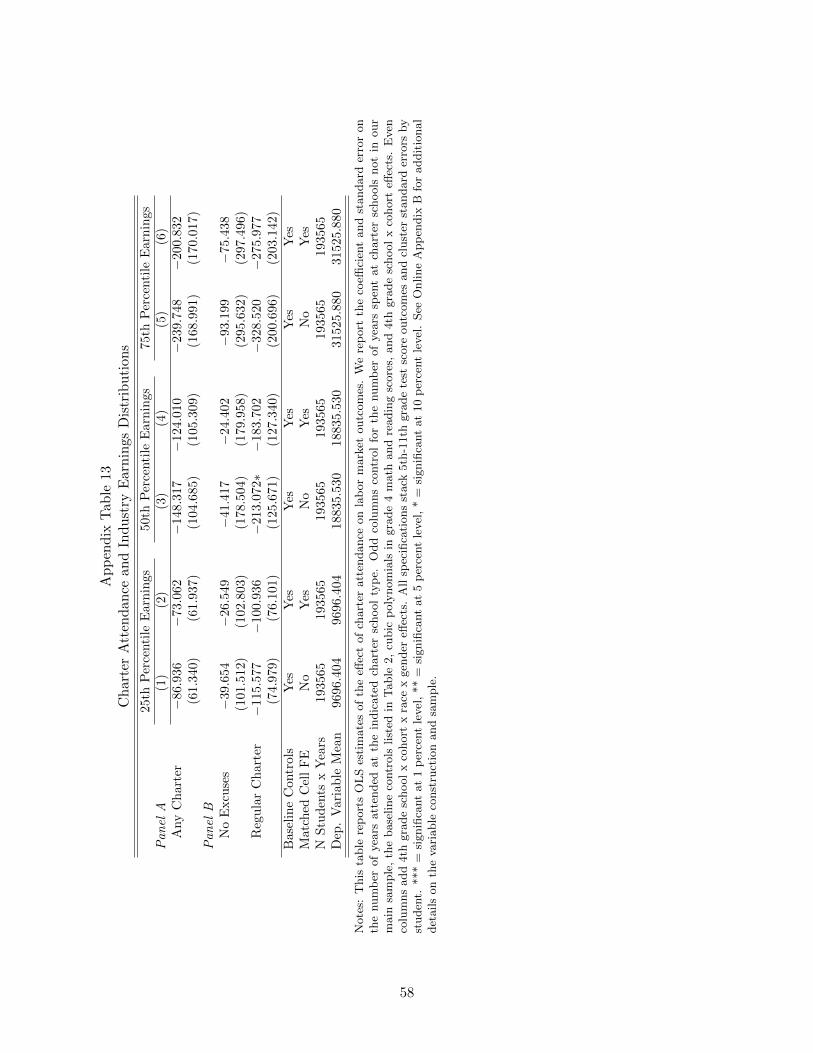
Ap
pen
dix
Tab
le13
Ch
arte
rA
tten
dan
cean
dIn
du
stry
Ear
nin
gsD
istr
ibu
tion
s
25th
Per
centi
leE
arn
ings
50th
Per
centi
leE
arn
ings
75th
Per
centi
leE
arn
ings
Panel
A(1
)(2
)(3
)(4
)(5
)(6
)A
ny
Ch
arte
r−
86.9
36
−73.0
62
−148.3
17
−124.0
10
−239.7
48
−200.8
32
(61.
340)
(61.9
37)
(104.6
85)
(105.3
09)
(168.9
91)
(170.0
17)
Panel
BN
oE
xcu
ses
−39.6
54
−26.5
49
−41.4
17
−24.4
02
−93.1
99
−75.4
38
(101.5
12)
(102.8
03)
(178.5
04)
(179.9
58)
(295.6
32)
(297.4
96)
Reg
ula
rC
har
ter
−11
5.577
−100.9
36
−213.0
72∗
−183.7
02
−328.5
20
−275.9
77
(74.
979)
(76.1
01)
(125.6
71)
(127.3
40)
(200.6
96)
(203.1
42)
Bas
elin
eC
ontr
ols
Yes
Yes
Yes
Yes
Yes
Yes
Mat
ched
Cel
lF
EN
oY
esN
oY
esN
oY
esN
Stu
den
tsx
Yea
rs19
3565
193565
193565
193565
193565
193565
Dep
.V
aria
ble
Mea
n96
96.4
04
9696.4
04
18835.5
30
18835.5
30
31525.8
80
31525.8
80
Note
s:T
his
table
rep
ort
sO
LS
esti
mate
sof
the
effec
tof
chart
eratt
endance
on
lab
or
mark
etoutc
om
es.
We
rep
ort
the
coeffi
cien
tand
standard
erro
ron
the
num
ber
of
yea
rsatt
ended
at
the
indic
ate
dch
art
ersc
hool
typ
e.O
dd
colu
mns
contr
ol
for
the
num
ber
of
yea
rssp
ent
at
chart
ersc
hools
not
inour
main
sam
ple
,th
ebase
line
contr
ols
list
edin
Table
2,
cubic
poly
nom
ials
ingra
de
4m
ath
and
readin
gsc
ore
s,and
4th
gra
de
school
xco
hort
effec
ts.
Even
colu
mns
add
4th
gra
de
school
xco
hort
xra
cex
gen
der
effec
ts.
All
spec
ifica
tions
stack
5th
-11th
gra
de
test
score
outc
om
esand
clust
erst
andard
erro
rsby
studen
t.***
=si
gnifi
cant
at
1p
erce
nt
level
,**
=si
gnifi
cant
at
5p
erce
nt
level
,*
=si
gnifi
cant
at
10
per
cent
level
.See
Online
App
endix
Bfo
raddit
ional
det
ails
on
the
vari
able
const
ruct
ion
and
sam
ple
.
58

Appendix Table 14Results by Charter Completion
Pooled HS 2-Year 4-Year AverageScores Grad College College Earnings Earnings>0
Panel A: Pooled Results (1) (2) (3) (4) (5) (6)Completed x Any Charter 0.056∗∗∗ 0.007∗∗∗ 0.011∗∗∗ 0.007∗ −161.781 −0.002
(0.012) (0.003) (0.004) (0.004) (121.661) (0.003)Not Completed x Any Charter 0.027∗ 0.022∗∗∗ 0.022∗∗∗ −0.007∗ −167.499 0.000
(0.014) (0.004) (0.004) (0.004) (178.378) (0.005)p-value 0.073 0.001 0.043 0.016 0.979 0.674
Panel B: By Charter TypeCompleted x No Excuses 0.140∗∗∗ 0.020∗∗∗ 0.011∗ 0.039∗∗∗ 269.335 −0.000
(0.014) (0.004) (0.006) (0.006) (210.614) (0.005)Not Completed x No Excuses 0.092∗∗∗ 0.037∗∗∗ 0.013∗ 0.001 −308.968 −0.008
(0.017) (0.006) (0.008) (0.008) (323.402) (0.008)p-value 0.119 0.010 0.846 0.000 0.137 0.398
Completed x Regular Charter −0.023 −0.001 0.011∗∗ −0.014∗∗∗ −446.104∗∗∗ −0.003(0.016) (0.004) (0.004) (0.004) (142.255) (0.004)
Not Completed x Regular Charter −0.023 0.015∗∗ 0.026∗∗∗ −0.011∗∗ −94.756 0.004(0.015) (0.005) (0.005) (0.005) (202.783) (0.005)
p-value 0.980 0.012 0.021 0.643 0.163 0.238
Baseline Controls Yes Yes Yes Yes Yes YesMatched Cell FE Yes Yes Yes Yes Yes YesN Students 193565 193565 193565 193565 193565 193565
Notes: This table reports results separately for charter students who did and did not attend until the last offeredgrade by the school. We report the coefficient on the number of years attended at the indicated school type. ***= significant at 1 percent level, ** = significant at 5 percent level, * = significant at 10 percent level. See OnlineAppendix B for additional details on the variable construction and sample and Tables 3-5 notes for details on theestimation framework.
59
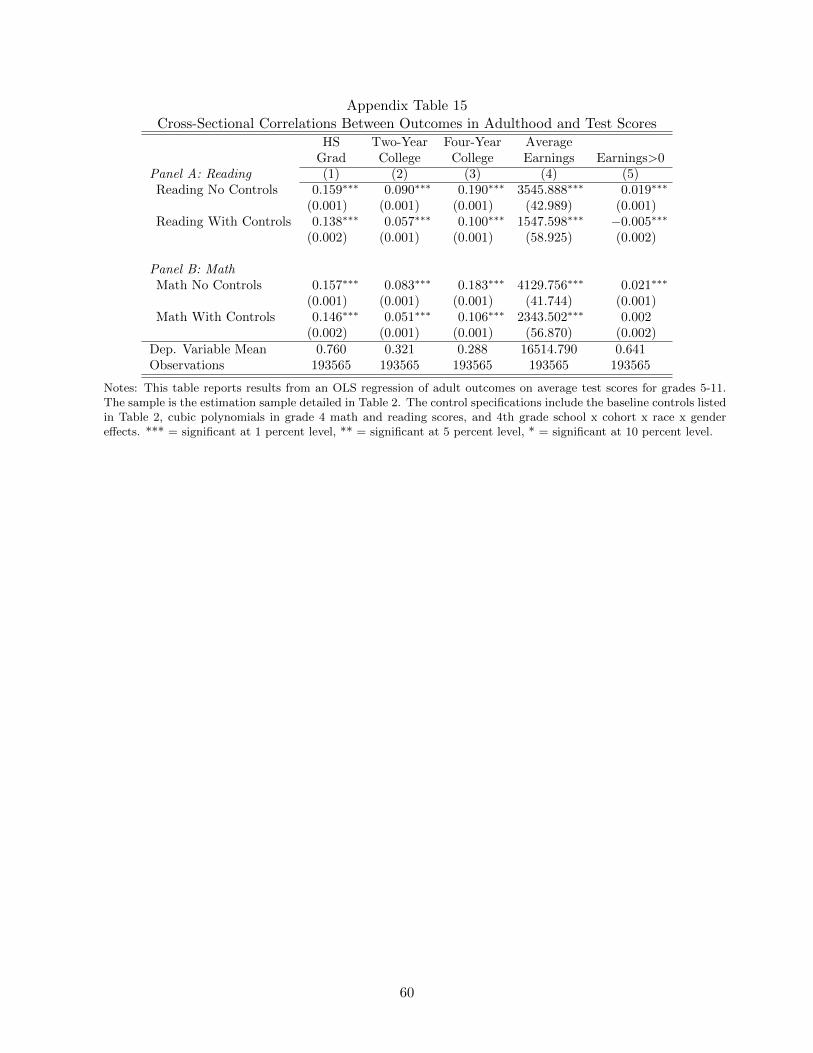
Appendix Table 15Cross-Sectional Correlations Between Outcomes in Adulthood and Test Scores
HS Two-Year Four-Year AverageGrad College College Earnings Earnings>0
Panel A: Reading (1) (2) (3) (4) (5)Reading No Controls 0.159∗∗∗ 0.090∗∗∗ 0.190∗∗∗ 3545.888∗∗∗ 0.019∗∗∗
(0.001) (0.001) (0.001) (42.989) (0.001)Reading With Controls 0.138∗∗∗ 0.057∗∗∗ 0.100∗∗∗ 1547.598∗∗∗ −0.005∗∗∗
(0.002) (0.001) (0.001) (58.925) (0.002)
Panel B: MathMath No Controls 0.157∗∗∗ 0.083∗∗∗ 0.183∗∗∗ 4129.756∗∗∗ 0.021∗∗∗
(0.001) (0.001) (0.001) (41.744) (0.001)Math With Controls 0.146∗∗∗ 0.051∗∗∗ 0.106∗∗∗ 2343.502∗∗∗ 0.002
(0.002) (0.001) (0.001) (56.870) (0.002)Dep. Variable Mean 0.760 0.321 0.288 16514.790 0.641Observations 193565 193565 193565 193565 193565
Notes: This table reports results from an OLS regression of adult outcomes on average test scores for grades 5-11.The sample is the estimation sample detailed in Table 2. The control specifications include the baseline controls listedin Table 2, cubic polynomials in grade 4 math and reading scores, and 4th grade school x cohort x race x gendereffects. *** = significant at 1 percent level, ** = significant at 5 percent level, * = significant at 10 percent level.
60

Appendix Table 16Average Practices of Achievement-Increasing Versus Achievement-Decreasing NYC Charters
Negative PostiveImpacts Impacts p-value
Panel A: Weekly Minutes in Tested Subjects (1) (2) (3)ELA 558.63 680.80 0.050
19 25Math 433.00 361.36 0.010
21 33Pooled Minutes 1000.89 1046.20 0.569
19 25
Panel B: Weekly Minutes in Non-Tested SubjectsArt 124.76 135.59 0.566
21 31Foreign Language 126.43 51.52 0.012
21 31History 128.10 64.52 0.018
21 31Music 100.48 145.27 0.195
21 31Physical Ed 103.33 145.71 0.037
21 33Science 190.71 178.94 0.468
21 33Social Studies 146.75 184.79 0.148
20 24Pooled Minutes 880.50 935.75 0.413
20 20
Panel C: Other InputsFrequency of Student Assessments 2.75 3.43 0.247
22 28Number of Ways Use Assessments 3.40 4.41 0.165
15 27Non-Academic Summer Programs 0.27 0.22 0.669
22 36
Notes: This table reports the average inputs for charter schools in the NYC data used by Dobbie and Fryer (2013).Specifically, we focus on the sample of charter schools with experimental estimates in Dobbie and Fryer (2013) andcompare charters with negative impacts on test scores to charters with positive impacts. Column 1 reports the meanof the indicated variable for schools with negative impacts. Column 2 reports the mean of the indicated variable forschools with positive impacts. Column 3 reports a two-sided p-value from a two-sample t test. Beneath each mean,we also report the number of schools that had non-missing responses for the given survey question. The last row ofPanel A and Panel B report results from summing all the other variables in the given panel. Note that this pooledvariable only exists for schools that had non-missing responses for all variables being summed together.
61

Appendix Figure 1Location of Trend Breaks
(A) Pooled Scores and Earnings (B) Pooled Scores and Employment
.13
.14
.15
.16
.17
R2
-.2 -.1 0 .1Pooled Test Effect Break = -0.016
.02
.04
.06
.08
.1R
2
-.2 -.1 0 .1Pooled Test Effect Break = -0.020
(C) High School Graduation and Earnings (D) High School Graduation and Employment
.16
.18
.2.2
2.2
4R
2
-.2 -.1 0 .1High School Graduation Effect Break = -0.064
.09
.095
.1.1
05.1
1R
2
-.2 -.1 0 .1High School Graduation Effect Break = -0.154
(E) Two-Year College and Earnings (F) Two-Year College and Employment
0.0
5.1
.15
R2
-.07 -.035 0 .035 .07Any Two-Year College Effect Break = -0.018
.02
.04
.06
.08
.1R
2
-.07 -.035 0 .035 .07Any Two-Year College Effect Break = -0.007
62

(G) Four-Year College and Earnings (H) Four-Year College and Employment
.19
.2.2
1.2
2.2
3R
2
-.1 -.05 0 .05Any Four-Year College Effect Break = -0.009
.02
.04
.06
.08
.1R
2
-.1 -.05 0 .05Any Four-Year College Effect Break = -0.007
Notes: These figures plot the R2 associated with different trend break locations. We report the value of the x variablefor the maximum R2. See text for details.
63

Appendix Figure 2School Test Score Effects
(A) Math (B) Reading
Regular Charter = -0.062 No Excuses = 0.067
05
1015
-.5 -.25 0 .25 .5
Regular Charter No Excuses
Regular Charter = -0.036 No Excuses = 0.063
05
1015
-.5 -.25 0 .25 .5
Regular Charter No Excuses
(C) Pooled
Regular Charter = -0.050 No Excuses = 0.065
05
1015
-.5 -.25 0 .25 .5
Regular Charter No Excuses
Notes: These figures plot school-level test score effects by charter school type. The reported means are weighted bythe number of students at each school in the earnings effects estimation sample. See Online Appendix B for detailson the sample and variable construction and Online Appendix C for details on estimation of the school effects.
64

Appendix Figure 3School Academic Attainment Effects
(A) High School Graduation (B) Two-Year College Enrollment
Regular Charter = -0.009 No Excuses = 0.024
05
1015
-.2 -.1 0 .1 .2
Regular Charter No Excuses
Regular Charter = 0.010 No Excuses = 0.009
05
1015
-.2 -.1 0 .1 .2
Regular Charter No Excuses
(C) Four-Year College Enrollment
Regular Charter = -0.019 No Excuses = 0.026
05
1015
-.2 -.1 0 .1 .2
Regular Charter No Excuses
Notes: These figures plot school-level academic attainment effects by charter school type. The reported means areweighted by the number of students at each school in the earnings effects estimation sample. See Online AppendixB for details on the sample and variable construction and Online Appendix C for details on estimation of the schooleffects.
65

Appendix Figure 4School Labor Market Effects
(A) Average Earnings 24-26 (B) Average Employment 24-26
Regular Charter = -673.232 No Excuses = 25.032
05
10
-5000 -4000 -3000 -2000 -1000 0 1000 2000 3000 4000 5000
Regular Charter No Excuses
Regular Charter = -0.007 No Excuses = -0.005
05
1015
-.1 -.05 0 .05 .1
Regular Charter No Excuses
Notes: These figures plot school-level earnings and employment effects by charter school type. Earnings and em-ployment are measured eight years after high school graduation. The reported means are weighted by the number ofstudents at each school in the earnings effects estimation sample. See Online Appendix B for details on the sampleand variable construction and Online Appendix C for details on estimation of the school effects.
66
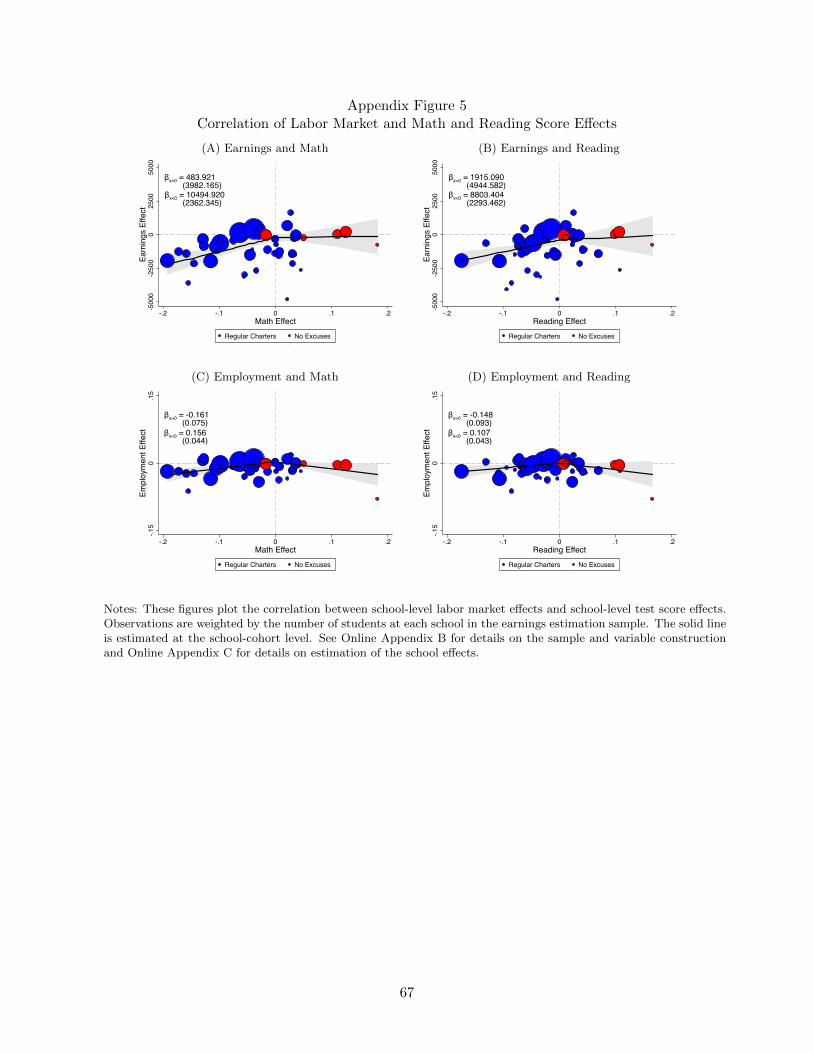
Appendix Figure 5Correlation of Labor Market and Math and Reading Score Effects
(A) Earnings and Math (B) Earnings and Reading
βx<0 = 10494.920 (2362.345)
βx>0 = 483.921 (3982.165)
-500
0-2
500
025
0050
00Ea
rnin
gs E
ffect
-.2 -.1 0 .1 .2Math Effect
Regular Charters No Excuses
βx<0 = 8803.404 (2293.462)
βx>0 = 1915.090 (4944.582)
-500
0-2
500
025
0050
00Ea
rnin
gs E
ffect
-.2 -.1 0 .1 .2Reading Effect
Regular Charters No Excuses
(C) Employment and Math (D) Employment and Reading
βx<0 = 0.156 (0.044)
βx>0 = -0.161 (0.075)
-.15
0.1
5Em
ploy
men
t Effe
ct
-.2 -.1 0 .1 .2Math Effect
Regular Charters No Excuses
βx<0 = 0.107 (0.043)
βx>0 = -0.148 (0.093)
-.15
0.1
5Em
ploy
men
t Effe
ct
-.2 -.1 0 .1 .2Reading Effect
Regular Charters No Excuses
Notes: These figures plot the correlation between school-level labor market effects and school-level test score effects.Observations are weighted by the number of students at each school in the earnings estimation sample. The solid lineis estimated at the school-cohort level. See Online Appendix B for details on the sample and variable constructionand Online Appendix C for details on estimation of the school effects.
67

Appendix Figure 6Earning Trajectories by Educational Attainment
(A) Earnings (B) Earnings with No Zeros
010
000
2000
030
000
4000
0W
ages
20 25 30Age
Less than HS HS GradSome College 4+ Years College
1000
020
000
3000
040
000
5000
0W
ages
with
No
Zero
s
20 25 30Age
Less than HS HS GradSome College 4+ Years College
Notes: These figures plot average earnings with and without zero earnings by educational attainment level. Thesample includes students in our estimation sample graduating high school in 2002 - 2003.
68

Appendix Figure 7Results by Year in the 2002-2004 Cohorts
(A) 2-Year College Enrollment (B) 4-Year College Enrollment
-.02
-.01
0.0
1.0
2Ef
fect
1 2 3 4 5 6 7 8 9 10Year Relative to HS Graduation
No Excuses Regular Charter
-.04
-.02
0.0
2.0
4Ef
fect
1 2 3 4 5 6 7 8 9 10Year Relative to HS Graduation
No Excuses Regular Charter
(C) Earnings (D) Employment
-200
0-1
000
010
00Ef
fect
1 2 3 4 5 6 7 8 9 10Year Relative to HS Graduation
No Excuses Regular Charter
-.04
-.02
0.0
2Ef
fect
1 2 3 4 5 6 7 8 9 10Year Relative to HS Graduation
No Excuses Regular Charter
Notes: These figures plot charter school effects and 95 percent confidence intervals by school type in the 2002-2004graduating cohorts. See Tables 3-5 notes for details on the sample and estimation framework.
69

Appendix Figure 8Correlations Between Outcomes in Adulthood and Test Scores
(A) Math and High School Graduation (B) Reading and High School Graduation
.4.6
.81
Gra
duat
e H
S
0 5 10 15 20Math Score Vingtile
No Controls With Controls
.4.5
.6.7
.8.9
Gra
duat
e H
S
0 5 10 15 20Reading Score Vingtile
No Controls With Controls
(C) Math and Two-Year College Enrollment (D) Reading and Two-Year College Enrollment
.4.6
.81
Any
2-Ye
ar C
olle
ge
0 5 10 15 20Math Score Vingtile
No Controls With Controls
.4.5
.6.7
.8.9
Any
2-Ye
ar C
olle
ge
0 5 10 15 20Reading Score Vingtile
No Controls With Controls
(E) Math and Four-Year College Enrollment (F) Reading and Four-Year College Enrollment
.4.6
.81
Any
4-Ye
ar C
olle
ge
0 5 10 15 20Math Score Vingtile
No Controls With Controls
.4.5
.6.7
.8.9
Any
4-Ye
ar C
olle
ge
0 5 10 15 20Reading Score Vingtile
No Controls With Controls
70
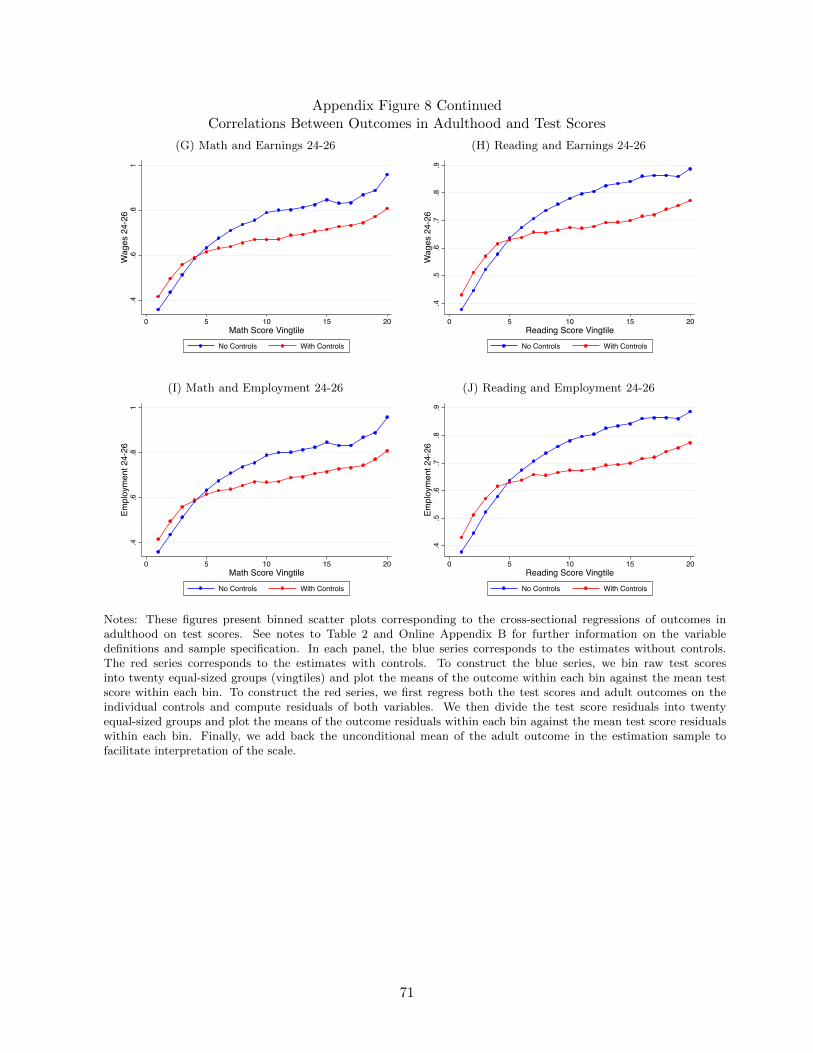
Appendix Figure 8 ContinuedCorrelations Between Outcomes in Adulthood and Test Scores
(G) Math and Earnings 24-26 (H) Reading and Earnings 24-26.4
.6.8
1W
ages
24-
26
0 5 10 15 20Math Score Vingtile
No Controls With Controls
.4.5
.6.7
.8.9
Wag
es 2
4-26
0 5 10 15 20Reading Score Vingtile
No Controls With Controls
(I) Math and Employment 24-26 (J) Reading and Employment 24-26
.4.6
.81
Empl
oym
ent 2
4-26
0 5 10 15 20Math Score Vingtile
No Controls With Controls
.4.5
.6.7
.8.9
Empl
oym
ent 2
4-26
0 5 10 15 20Reading Score Vingtile
No Controls With Controls
Notes: These figures present binned scatter plots corresponding to the cross-sectional regressions of outcomes inadulthood on test scores. See notes to Table 2 and Online Appendix B for further information on the variabledefinitions and sample specification. In each panel, the blue series corresponds to the estimates without controls.The red series corresponds to the estimates with controls. To construct the blue series, we bin raw test scoresinto twenty equal-sized groups (vingtiles) and plot the means of the outcome within each bin against the mean testscore within each bin. To construct the red series, we first regress both the test scores and adult outcomes on theindividual controls and compute residuals of both variables. We then divide the test score residuals into twentyequal-sized groups and plot the means of the outcome residuals within each bin against the mean test score residualswithin each bin. Finally, we add back the unconditional mean of the adult outcome in the estimation sample tofacilitate interpretation of the scale.
71

Online Appendix B: Data Appendix
We use administrative data from the Texas Education Research Center (ERC) that allows us to
follow all Texas public school students from Kindergarten to college to the labor market. The
ERC data include information on student demographics and outcomes from the Texas Education
Agency (TEA), college enrollment records from the Texas Higher Education Coordinating Board
(THECB), and administrative earnings records from the Texas Workforce Commission (TWC).
This appendix describes these data sets and details the procedures used to clean and match them.
Texas Education Agency
Overview : The TEA data include information on student race, gender, free and reduced-price lunch
eligibility, limited English proficiency, special education status, at risk designation, and graduation
year. The TEA data also include information on each student’s grade, school, and state math and
reading test scores in each year. These data are available for all Texas public school students for
the 1994-1995 to 2012-2013 school years.
State Assessments: Mathematics and reading assessments come from two statewide criterion-
referenced achievement tests that were administered during our period of study. From 1993-2003,
the Texas Assessment of Academic Skills (TAAS) was administered each spring to eligible students
enrolled in grades three through eight. An exit level test was also administered in grade 10 in
reading, writing, and mathematics as a requirement for graduation. In 2003, Texas introduced
a new exam called the Texas Assessment of Knowledge and Skills (TAKS). TAKS expanded the
number of subjects that students were required to demonstrate proficiency in and elevated the level
of difficulty of the tests. TAKS was administered to grades 3-10 in reading and mathematics. An
exit level test was also administered in grade 11 in English language arts, mathematics, science,
and social studies as a requirement for graduation. Spanish versions of the TAKS test were offered
for students with limited English proficiency in grades 3-6. TAKS assesses grade-specific content
in grades 3-8. In grades 9-11, TAKS assesses content from specific courses. In our analysis, we
normalize all math and reading scaled scores to have a mean of zero and a standard deviation of
one in each year and grade level for the entire state of Texas. Since TAAS and TAKS are taken in
different years, they are standardized separately.
High School Graduation Variables: We code a student as having graduated from high school if the
Texas graduation files indicate that (1) she received a valid diploma or (2) if she enrolled in a two-
or four-year college in any subsequent year. All students who are missing from both the graduation
files and the college enrollment files are assumed to have not graduated from high school.
Transfer Variables: We code students as having transferred to an out-of-state school if they reen-
rolled outside of Texas, intended to reenroll outside of Texas, returned to their home country, or
graduated from another state for the military. We also code a small number of students who are
deceased as having transferred to an out-of-state school.
72

Demographic Variables: Demographic variables that should not vary from year to year (race, gender,
immigrant status) were pulled from enrollment files, with precedence given to the most recent files.
Race consisted of the following categories: white, black, Hispanic, Asian, Native American, and
other race. These categories were considered mutually exclusive. Gender was coded as male,
female, or missing. Demographic variables that may vary from year to year (free lunch status,
English Language Learner status, at-risk status, gifted status, and special education designation)
were pulled from the relevant enrollment file.16,17
Texas Higher Education Coordinating Board
Overview : Information on college outcomes come from the THECB. The THECB collects and
centralizes data for students attending Texas public universities, private universities, community
colleges, and health related institutions. The data include information on each student’s enrollment,
graduation, and grade in each year. The THECB data are available for the 2004-2005 to 2012-2013
school years.
Enrollment Variables: We code a student as having enrolled in college if she ever attends a school in
the THECB data. Two-year and four-year college results are coded similarly. All students missing
from these files are assumed to have not enrolled in college.
Texas Workforce Commission
Overview : Employment and earnings outcomes are measured using data from the TWC. The
TWC data record quarterly earnings for all Texas employees, with information on approximately
12 million individuals each year. The data include information on each individual’s earnings,
number of employers, and size of each employer. The TWC data are available from 2002 to 2014.
16A student is income-eligible for free lunch if her family income is below 130 percent of the federal povertyguidelines, or categorically eligible if (1) the student’s household receives assistance under the Food Stamp Program,the Food Distribution Program on Indian Reservations (FDPIR), or the Temporary Assistance for Needy FamiliesProgram (TANF); (2) the student was enrolled in Head Start on the basis of meeting that program’s low-incomecriteria; (3) the student is homeless; (4) the student is a migrant child; or (5) the student is identified by the localeducation liaison as a runaway child receiving assistance from a program under the Runaway and Homeless YouthAct. Determination of special education or ELL status is done by HISD Special Education Services and the HISDLanguage Proficiency Assessment Committee.
17Texas Education Code Section 29.081 defines a student as at-risk of dropping out if any of the following is true:(1) the student was held back in one grade level; (2) the student is in grades 7-12, did not maintain an averageequivalent to 70 on a scale of 100 in two or more subjects in the foundation curriculum during a semester in thepreceding or current school year, or is not maintaining such an average in two or more subjects in the foundationcurriculum in the current semester; (3) did not perform satisfactorily on an assessment, and who has not in theprevious or current school year subsequently performed on that instrument or another appropriate instrument ata level equal to at least 110 percent of the level of satisfactory performance on that instrument; (4) if the studentis in PK-3 and did not perform satisfactorily on a readiness test or assessment instrument administered during thecurrent school year; (5) is pregnant or is a parent; (6) has been placed in an alternative education program during thepreceding or current school year; (7) has been expelled during the preceding or current school year; (8) is currently onparole, probation, deferred prosecution, or other conditional release; (9) was previously reported as having droppedout of school; (10) is a student of limited English proficiency; (11) is in the custody or care of the Department ofProtective and Regulatory Services or has been referred to the department during the current school year; (12) ishomeless; or (13) currently or in the past school year resided in a residential placement facility.
73

Earnings and Employment Variables: We assume that individuals with no reported earnings in a
given year are unemployed. Employment is an indicator for having nonzero earnings in the relevant
year. We also find that our main results are similar to dropping individuals with no reported
earnings.
National Student Clearinghouse
Overview : To explore the robustness of our college results, we also use data from the National
Student Clearinghouse (NSC) that contain information on student enrollment for over 90 percent
of all colleges and universities in the United States. The NSC data is only available from 2008 to
2009.
Enrollment Variables: We code a student as having enrolled in college if she ever attends a school
in the NSC data. Two-year and four-year college results are coded similarly. All students missing
from these files are assumed to have not enrolled in any college.
Sample Restrictions
School Level : We employ three sample restrictions at the school level. First, we restrict our analysis
to open-enrollment charter schools that target the general population of public school students.
We therefore exclude both district charters that are operated by the traditional public school
system, and “alternative instruction” charter schools that operate under different accountability
standards and typically work with non-traditional students such as high-school dropouts. We
also exclude charter schools for abused students, autistic students, shelters, residential treatment
centers, juvenile detention centers, juvenile justice alternative education programs, virtual charter
schools, and sports academies. Second, we drop schools who have fewer than ten students enrolled
during our sample period. In the school x cohort level analysis, we also drop cohorts with fewer than
10 students enrolled during our sample period. Third, we restrict our primary analysis sample to
charter schools whose oldest cohort graduated high school in or before 2005-2006. This restriction
ensures that students in our sample are approximately 26 years old or older in the most recent
earnings data.
Student Level : We also make six sample restrictions to the student data with the overarching
goal of having a valid comparison sample. Table 1 provides details on the number of students
dropped by each sample restriction. With no restrictions, there are 1,420,877 students in regular
public schools, 1,358 students in No Excuses charter schools, and 4,905 students in regular charter
schools. Column 2 omits students who did not attend a public elementary school in fourth grade.
This decreases the sample by 7,646 students in non-charters, but only by 13 students in No Excuses
Charters and 75 in regular charters. Column 3 leaves out students with missing baseline covariates
such as gender or race. Column 4 drops students with no middle or high school test score. Column
5 drops students who transferred to an out-of-state primary or secondary school. Column 6 drops
74

charter schools with a cohort size fewer than ten. In our final estimation sample – which includes all
students for which there is a match cell on fourth grade school, cohort, gender, and race – there are
188,666 students in non-charters, 1,039 in No Excuses charters, and 3,860 students in regular charter
schools. The majority of the non-charter sample was dropped due to not matching individuals in
the charter sample, primarily because these students attend schools in districts without a charter
school.
Classifying Charter Schools
We use information from the Texas Charter School Association and school websites to classify
eligible charters as No Excuses schools, college preparatory schools, specialized mission schools, or
regular charters. The Texas Charter School Association classifies schools as college preparatory,
specialized mission, or regular/unclassified. College preparatory schools have a stated mission to
prepare students for a 4-year college degree. Most college preparatory schools also have dedicated
college placement offices and track students through college graduation. Specialized mission charters
have distinctive focus areas such as religious study, fine arts, STEM, or classics. These schools may
also have strong college readiness programs. Regular charter schools are schools that do not fall
into any of the above categories.
Charter school classifications are available for 30 out of the 45 schools in our sample. For the 15
schools with missing classifications, we determined school type using mission statements from each
school’s website. For two schools, mission statements were unavailable. We coded both of these
schools as regular charters. Results are robust to coding all 28 schools with missing information as
regular charters, or coding all 28 schools as a separate group.
College preparatory charters are further classified as either No Excuses schools or regular col-
lege preparatory charters. Compared to regular college preparatory charters, No Excuses charters
have higher behavioral expectations, stricter disciplinary codes, are more likely to have uniform
requirements, and are more likely to have an extended school day and year. We classify No Ex-
cuses schools using information from school mission statements, charter applications, and public
statements. We verified our No Excuses categorizations with numerous school administrators in
Texas. The No Excuses classification in this paper largely follows the classification system used by
Dobbie and Fryer (2013) and Angrist, Pathak, and Walters (2013), but is somewhat more strict
than the classification system used by Baude et al. (2014). We use this stricter definition of No
Excuses to focus on exemplar schools in the category.
75

Online Appendix C: Empirical Bayes Procedure
This appendix describes the empirical Bayes (EB) procedure that we use to adjust our estimated
school effects for estimation error. The EB procedure is based on Morris (1983). Jacob and Lefgren
(2007), Dimick et al. (2009), and Chandra et al. (forthcoming) provide additional examples of the
EB procedure in other contexts.
The EB procedure is based on the idea that there is likely to be positive (negative) estimation
error if a school’s estimated effect is above (below) the mean school effect. Thus, the expected
school effect is a convex combination of the estimated school effect and the mean of the underlying
distribution of school effects. The relative weight on the estimated school effect is proportional to
the precision of the estimate, which is based on the standard error of the coefficient estimate.
To fix ideas, suppose that we have a noisy but unbiased estimate of the effect of attending school
s, βs = βs + ηs, where βs is the true effect of attending school s and ηs is a school-specific mean
zero error term. We assume that the estimated school effect is independently normally distributed
around the true school effect with known variance of π2s . In this context, π2s can be thought of as
the variance of the estimation error. We also assume that the true school effect βs is independently
normally distributed with an underlying mean of β and variance of σ2 for the full distribution of
schools.
The EB adjusted estimate is equal to the expected value of the school effect conditional on the
estimated effect βs and the parameters π2s , β, and σ2 is:
E[βs|βs, π2s , β, σ2] = λsβs + (1− λs)β
λs =π2s
π2s + σ2
As discussed above, the EB adjusted estimate attenuates the unadjusted estimated school effect
βs toward the underlying mean of the full distribution of school effects β. As the variance of the
estimation error π2s increases, the EB adjusted estimate increasingly converges to the underlying
mean of the school effects β.
In practice, the parameters needed to construct the EB adjusted estimate are unknown and must
be estimated. The estimated school effects βs are the unadjusted coefficient estimates from our main
student-level estimating equation described in the text. The standard errors on these unadjusted
coefficient estimates are an estimate of the standard deviation of the asymptotic distribution of
βs. We estimate π2s by squaring these standard errors. We estimate the mean of the distribution
of school effects β and the variance of the error term σ2 using the method proposed by Morris
(1983), which uses an iterative process to calculate the feasible best estimate of the appropriate
shrinkage factor λs. This method also incorporates a degrees of freedom adjustment to account for
the fact that we are estimating the mean and variance parameters. The above EB procedure yields
unbiased estimates of the expected effect of attending each school in our sample for any particular
outcome.
76