Charles Darwin University Patterns of primary health care ...
22
Charles Darwin University Patterns of primary health care service use of Indigenous Australians diagnosed with cancer Valery, Patricia C.; Bernardes, Christina M.; de Witt, Audra; Martin, Jennifer; Walpole, Euan; Garvey, Gail; Williamson, Daniel; Meiklejohn, Judith; Hartel, Gunter; Ratnasekera, Isanka U.; Bailie, Ross Published in: Supportive Care in Cancer DOI: 10.1007/s00520-019-04821-1 Published: 01/01/2020 Document Version Peer reviewed version Link to publication Citation for published version (APA): Valery, P. C., Bernardes, C. M., de Witt, A., Martin, J., Walpole, E., Garvey, G., Williamson, D., Meiklejohn, J., Hartel, G., Ratnasekera, I. U., & Bailie, R. (2020). Patterns of primary health care service use of Indigenous Australians diagnosed with cancer. Supportive Care in Cancer, 28(1), 317-327. https://doi.org/10.1007/s00520- 019-04821-1 General rights Copyright and moral rights for the publications made accessible in the public portal are retained by the authors and/or other copyright owners and it is a condition of accessing publications that users recognise and abide by the legal requirements associated with these rights. • Users may download and print one copy of any publication from the public portal for the purpose of private study or research. • You may not further distribute the material or use it for any profit-making activity or commercial gain • You may freely distribute the URL identifying the publication in the public portal Take down policy If you believe that this document breaches copyright please contact us providing details, and we will remove access to the work immediately and investigate your claim. Download date: 21. Oct. 2021
Transcript of Charles Darwin University Patterns of primary health care ...

Charles Darwin University
Patterns of primary health care service use of Indigenous Australians diagnosed withcancer
Valery, Patricia C.; Bernardes, Christina M.; de Witt, Audra; Martin, Jennifer; Walpole, Euan;Garvey, Gail; Williamson, Daniel; Meiklejohn, Judith; Hartel, Gunter; Ratnasekera, Isanka U.;Bailie, RossPublished in:Supportive Care in Cancer
DOI:10.1007/s00520-019-04821-1
Published: 01/01/2020
Document VersionPeer reviewed version
Link to publication
Citation for published version (APA):Valery, P. C., Bernardes, C. M., de Witt, A., Martin, J., Walpole, E., Garvey, G., Williamson, D., Meiklejohn, J.,Hartel, G., Ratnasekera, I. U., & Bailie, R. (2020). Patterns of primary health care service use of IndigenousAustralians diagnosed with cancer. Supportive Care in Cancer, 28(1), 317-327. https://doi.org/10.1007/s00520-019-04821-1
General rightsCopyright and moral rights for the publications made accessible in the public portal are retained by the authors and/or other copyright ownersand it is a condition of accessing publications that users recognise and abide by the legal requirements associated with these rights.
• Users may download and print one copy of any publication from the public portal for the purpose of private study or research. • You may not further distribute the material or use it for any profit-making activity or commercial gain • You may freely distribute the URL identifying the publication in the public portal
Take down policyIf you believe that this document breaches copyright please contact us providing details, and we will remove access to the work immediatelyand investigate your claim.
Download date: 21. Oct. 2021

1
Patterns of primary health care service use of Indigenous Australians diagnosed with cancer
Patricia C. Valery 1, Christina M Bernardes 1, Audra de Witt 2,3, Jennifer Martin 4, Euan Walpole 5, Gail Garvey 2, Daniel
Williamson 6, Judith Meiklejohn 1, 7, Gunter Hartel 1, Isanka U Ratnasekera 1,8, Ross Bailie 9
1 Population Health, QIMR Berghofer Medical Research Institute, Brisbane, Queensland, Australia
2 Menzies School of Health Research, Darwin, Australia
3 Queensland University of Technology, Faculty of Health, Translational Research Institute, Brisbane, Queensland, Australia
4 School of Medicine and Public Health, The University of Newcastle, Callaghan, NSW, Australia
5 Princess Alexandra Hospital, Woolloongabba, Queensland, Australia
6 Aboriginal and Torres Strait Islander Health Unit, Queensland Health, Brisbane, Queensland, Australia
7 Orange Sky Australia, Brisbane, Queensland, Australia
8 School of Medicine, The University of Queensland, Brisbane, Queensland, Australia
9 University Centre for Rural Health, The University of Sydney, Lismore, NSW, Australia
Corresponding author: Patricia C Valery
QIMR Berghofer Medical Research Institute
300 Herston Road, Herston QLD 4006
Locked Bag 2000 Royal Brisbane Hospital, QLD 4029
Tel +61 7 3362 0376 Fax +61 7 3845 3502 E-mail [email protected]
Running head: Effect of rurality on primary care visits for people with cancer
Key words: cancer care, primary care, general practitioners (GPs), Indigenous Australians
Word count: Manuscript text 3433 words (Abstract: 262 words, 45 references)
Acknowledgements: This work was supported by the National Health and Medical Research Council (no. 1044433). PCV
was supported by the National Health and Medical Research Council (Career Development Fellowship no. 1083090).
ADW was sup-ported by an Australian Postgraduate Award Scholarship from Charles Darwin University and a top up
scholarship from Menzies School of Health Research. GG was supported by a National Health and Medical Research
Council Early Career Research Fellowship (no. 1105399). This study was undertaken under the auspices of the Centre of
Research Excellence in Discovering Indigenous Strategies to Improve Cancer Outcomes Via Engagement, Research
Translation and Training (DISCOVER-TT CRE, funded by the National Health and Medical Research Council no. 1041111)
and the Strategic Research Partnership to improve Cancer control for Indigenous Australians (STREP Ca-CIndA, funded
through Cancer Council NSW (SRP 13-01) with supplementary funding from Cancer Council WA). The views expressed in
this publication are those of the authors and do not necessarily reflect the views of the funding agencies. The authors

2
would like to thank Aboriginal Community Controlled Health Organizations and primary health care staff at participating
centers for their support for this study.
Ethics: Ethics approvals for the study were obtained from the Human Research Ethics Committees of the Darling Downs
Hospital and Health Service, Menzies School of Research, and QIMR Berghofer Medical Research Institute.
Contributors: PCV, RB, GG and AdW contributed to the conception and design of the study. PCV performed the data
analysis and takes responsibility for the integrity and the accuracy of the data. PCV drafted the report. All authors
contributed the interpretation of data, revising draft critically for important intellectual content, and approved the final
version.

3
Abstract
Purpose
The role of general practitioners in cancer care has expanded in recent years. However, little is known about utilization
of primary health care (PHC) services by patients with cancer, particularly among socio-economically disadvantaged
groups. We describe utilization of PHC services by patients with cancer, and the nature of the care provided. The study
focus on a disadvantaged group in Australia, namely Indigenous Australians.
Methods
A retrospective audit of clinical records in ten PHC services in Queensland, Australia. Demographic and clinical data of
Indigenous Australians diagnosed with cancer during 2010-2016 were abstracted from patient’s medical records at the
PHC services. The rates of cancer-related visits were calculated using person years at risk as a denominator.
Results
A total of 138 patients’ records were audited. During 12 months following the cancer diagnosis, patients visited the PHC
service on average 5.95 times per year. Frequency of visits were relatively high in remote areas and among
socioeconomic disadvantaged patients (IRR=1.87, 95%CI 1.61-2.17; IRR=1.79, 95%CI 1.45-2.21, respectively). Over 80%
of visits were for seeking attention for symptoms, wound care, and emotional or social support. Patients who did not
undergo surgery, had greater comorbidity, received chemotherapy and/or radiotherapy, and male gender had
significantly greater rate of visits than their counterparts.
Conclusion
The frequency of utilization of PHC services, especially by patients with comorbidities, and the range of reasons for
attendance highlights the important role of PHC services in providing cancer care. The reliance on PHC services,
particularly by patients in remote and disadvantaged communities has important implications for appropriate resourcing
and support for services in these locations.

4
Introduction
Overall cancer survival has improved over the past decades in many high income countries. In the UK, for example,
cancer survival has doubled in the last 40 years [1]. In Australia, five-year relative survival from all cancers combined
increased from by 41% over a 30-year period (1984–2013) [2]. However, significant disparities in cancer outcomes exist
between minority groups and mainstream populations. Cancer disproportionately affects the most disadvantaged
groups in affluent countries, namely people living in more deprived areas [1, 3], ethnic minorities [3], patients who live
in rural areas [4], and indigenous populations [5-7].
Primary health care (PHC) services have a vital role in supporting patients living with and beyond cancer [8, 9]. In recent
years, in countries with universal health-care systems, the role of general practitioners (GPs) in cancer care has
expanded [10, 11 ]. With the prevalence of cancer survivors increasing[1, 2] in line with improvements in early detection
and treatment and aging populations, continued involvement of GPs is increasingly seen as a way to enhance cancer
care [8, 9, 11, 12]. High quality PHC is especially important for disadvantaged groups who experience disproportionate
barriers to access to care (e.g. people who live in rural areas).
Australia is a geographically vast country, and availability of health services generally decreases with increase in
remoteness [13, 14]. Australians in rural and remote areas generally have less access to health services, with shortages
in health professions and health-related infrastructure, including oncology services which are provided mostly through
tertiary and regional cancer centers [14, 15]. Rural Australians have worse cancer outcomes than those living in major
cities [16, 17]. Psychosocial morbidity and unmet needs have also been reported important issues and challenges facing
rural Australians with cancer [18]. While community-based PHC services play a fundamental role in prevention and
management of disease in general, GP involvement in cancer care in Australia is varied and may depend on where they
are based. GPs in rural and remote areas are reported to have a greater role in cancer care than their major city
counterparts [19].
Aboriginal and Torres Strait Islander people in Australia (referred to here as Indigenous Australians) are among the most
disadvantaged groups in Australia and experience persistent socioeconomic and health disparities [20]. High quality PHC
is especially important for this group as they experience disproportionate barriers to access to care. Rates of morbidity
and mortality are high for most conditions, including cancer, the second leading cause of death for this group [21]. The
marked inequalities in cancer mortality[22] and survival[6, 7, 23] for Indigenous and non-Indigenous cancer patients in
Australia is largely attributed to being diagnosed later [6, 7, 24], receiving less treatment [6, 7], and experiencing higher
rates of comorbidities [6, 7]. Many Indigenous Australians face challenges within the health system, namely language
barriers, racism, cultural misunderstandings, and emotional, physical, and financial stresses which can affect their cancer
outcomes [25, 26]. Indigenous Australians with cancer have high unmet needs, particularly in the

5
‘physical/psychological’ and ‘practical/cultural’ domains [27]. As a higher proportion of Indigenous Australians live in
rural and remote areas [28], they also face additional barriers to accessing cancer services [22, 28].
In order to improve access to first level healthcare delivered through the general practice sector, community controlled
PHC services (referred to here as the Aboriginal community controlled health services (ACCHSs)) exist in many parts of
Australia. Indigenous Australians value their accessibility [29], facilitated by welcoming social spaces, culturally safe and
appropriate care that is responsive to holistic needs [30].
The aim of this study was to describe utilization of primary health care (PHC) services by patients with cancer, and the
nature of the care provided. The study described here focused on a disadvantaged group in Australia, namely Indigenous
Australians. We described the characteristics of patients, and the frequency and reasons for visits to PHC services after
cancer diagnosis. As previous reports [27] have shown that financial and psychosocial concerns are prominent areas of
unmet needs of Indigenous Australians with cancer, we described access and referrals to psychological counselling and
assistance with travel and accommodation.
Methods
We conducted a retrospective audit of PHC service records of Indigenous cancer patients in Queensland, Australia. The
details about the selection of PHC services have been described previously [31]. In brief, a purposive convenience
sample of Queensland Health-operated and ACCHSs with at least ten Indigenous cancer patients currently attending
their service(s) (referred to as “active patients”) were invited to take part in the study. Ten PHC services agreed to
participate; except for one service, all were ACCHSs [31].
PHC services were asked to provide a list of all adult patients who were identified as Aboriginal or Torres Strait Islander,
had a cancer diagnosed after 2010, and were active patients. Additional searches of the service’s database were
conducted in eight services by study staff to identify any other potentially eligible patients. Patients identified as
Aboriginal or Torres Strait Islander, who had a cancer (any type except non-melanoma skin cancers) diagnosed after
2010, who were 18 years or older at diagnosis, and were active patients were eligible. The audit took place between 18
February 2015 and 1 December 2016. Data were collected for the period from the date of cancer diagnosis to the date
of audit (“audit period”).
Demographic characteristics and clinical data were abstracted from patients’ medical records at the PHC services.
Clinical data included: cancer type; date of diagnosis and source of information; cancer stage; presence of comorbidities;
and treatment received (e.g. type, date). A modified Charlson comorbidity index (CCI) score was calculated based on the

6
presence and severity of comorbid conditions with higher scores indicating higher comorbidity burden [32]. Detailed
information on patient’s visits to the services (e.g. date, reason) that were related to their cancer were collected. We
also describe access and referrals to psychological counselling and assistance with travel/accommodation. Data were
abstracted by trained reviewers (AdW, CB and JM) using a structured data collection form. CB (registered nurse) and IUR
(clinician) independently reviewed and categorized cancer type and stage [33]; where there was disagreement, a
discussion was held to facilitate consensus.
Data analysis
Analyses were conducted using Stata/SE (Version 15; Stata Corporation, College Station, TX). Patients’ and PHC services’
characteristics were presented as mean and standard deviation (data normally distributed), and proportions. Chi-square
tests were used to compare proportions (Fisher exact test was used when expected counts <5). Statistical significance
was set at alpha=0.05, and p values were 2-sided.
The rate of visits was calculated using person years at risk (PYAR) as a denominator (e.g. a patient who supplied six
months of data to the study [e.g. from cancer diagnosis to the date of medical chart audit] would contribute 0.5 years to
the denominator). All patients had follow up data for the audit period (all assumed to be alive at the time we audited
their records). Poisson regression was undertaken to compare rate of visits by PHC service, health service and patient
characteristics. The vce(robust) option was used to obtain robust standard errors for the parameter estimates to control
for mild violation of underlying assumptions. Incidence rate ratios (IRR) and 95% confidence interval (CI) were reported.
Results
Patient population
Of 475 patients identified, after medical chart review, 193 patients did not have cancer, 111 were excluded based on
eligibility criteria, and 16 did not have enough information to decide on eligibility (see Figure 1 for more details). Data
was not collected for 17 patients due to change of management at one service during the data collection period and
inadequate time to renegotiate this service’s participation. Data described hereafter includes 138 patients who were on
average 56.6 years at diagnosis (SD=11.9). Most resided in areas categorized as regional (48.2%) or remote/very remote
(26.3%), and low-intermediate (34.3%) or most disadvantaged (46.0%) (Table 1).
The most common primary cancer diagnosis was breast cancer (29.0%), followed by cancers of the female genital
(15.9%), and digestive organs (11.6%). An estimated date of diagnosis was available for 124 patients (89.9%); for 14
(10.1%) only the year of diagnosis was available. Most medical charts (74.6%) had cancer stage recorded or stage was
not applicable; for 35 (25.4%) this information was missing. Forty-three percent of patients had localized cancers. Most

7
patients (n=124, 89.9%) received cancer treatment (67.4% had surgery, 40.6% chemotherapy, and 39.1% radiotherapy)
and 65.2% had at least one comorbidity (CCI≥1); 34.8% patients had none.
The demographic and clinical characteristics of patient included here were on the whole similar to a previous study
which recruited 248 Indigenous cancer patients from hospitals in Queensland (Supplementary Table 1) [34]. The main
exception was cancer stage, where patients audited had a higher proportion of localized cancers and of missing cancer
stage.
Most patients (n=115, 83.3%) visited the PHC service for patient care during the audit period (e.g. presented with
symptoms, wound care, emotional and/or support for social issues). Twenty-three patients (16.7%) only visited the
service to check or request pathology or imaging tests, or for administrative reasons.
Patient visits to the PHC service
During the 12-month period following cancer diagnosis, the rate of patient visits to the PHC service to see a GP was 5.95
per PYAR. The rate of visits during the 12-month period following cancer diagnosis was nearly double the rate for the
audit period (7.78 vs. 4.08 per PYAR for all visits, 6.62 vs. 3.45 per PYAR for visits which included patient care, and 5.95
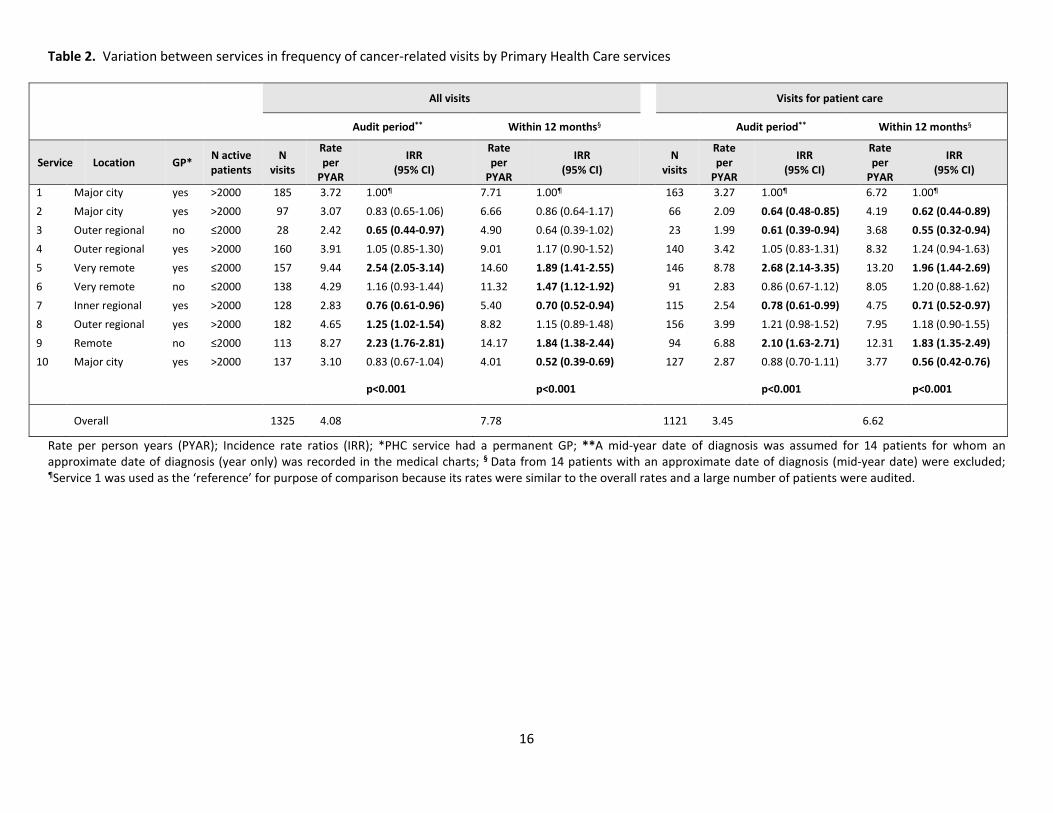
vs. 3,21 per PYAR for GP visits, respectively). The rate of visits to PHC services varied significantly by service (Table 2),
and by service and patients’ characteristics (Figure 2). Frequency of visits were relatively high in services located in
remote/very remote areas (IRR=1.87, 95%CI 1.61-2.17) and among socioeconomic disadvantaged patients (IRR=1.79,
95%CI 1.45-2.21). Patients who did not undergo surgery, had greater comorbidity, received chemotherapy and/or
radiotherapy, and male gender had significantly greater rate of visits compared to their respective counterparts.
Nature of the care provided
A total of 1325 visits to the PHC services that were related to the patient’s cancer were identified (Table 3). Most visits
(84.6%) involved patient care (e.g. request of medical prescription, patient presented with symptoms, wound care,
scheduled appointment for check-up or review, emotional and/or support for social issues); the remainder were
exclusively for or included administrative reasons (25.1%; e.g. arrangement of transport/accommodation, administrative
forms) or to check or request pathology, imaging or other tests (22.0%). Common reasons for a visit included request of
medical prescription (31.0%), patient presented with symptoms (26.5%) and for check-up or review (25.8%). A total of
868 visits occurred within 12 months following the patient’s cancer diagnosis with similar distributions of reasons for
visit.
Overall, most PHC service visits for patient care involved a consultation with a GP (n=911, 81.3%) and/or a health worker
(n=425, 37.9%), 11.1% involved a nurse (n=124), 1.8% (n=20) a care coordinator, and <1.5% involved a social worker, a

8
psychologist or counsellor, a physiotherapist, a dietician, a specialist, other allied health professional, or others service
staff (e.g. driver, receptionist, practice manager). Figure 3 displays PHC service staff seen by patients when they visited
PHC services for patient care during the audit period by service location.
Regarding referral to other services or health professionals, there were 303 visits (27.0%) with a referral. The most
common referrals were to pathology, radiology or imaging services (32.7%), followed by pharmacy (28.1%), specialists
(21.1%), transport/accommodation (5.0%), a hospital (4.6%), a physiotherapist (4.6%), a nurse (3.0%), and a psychologist
or counsellor (2.6%). Less than 2.0% of visits resulted in a referral to a dietician, a social worker, a dentist, a GP,
palliative, support services or other allied health professionals. Figure 4 displays patient referrals by service location. In
contrast to services located in major city or inner/outer regional areas, for services in remote and very remote areas the
most common referrals were to pharmacy, followed by referrals to pathology, radiology or imaging services.
Overall, <1.5% of the visits involved a social worker, a psychologist or counsellor, and there were 8 referrals to a
psychologist or counsellor recorded in the medical records. There were 84 (6.3%) PHC service visits during the audit
period for which the reason for the visit included emotional support and/or support for social issues. Of these, in 8 visits
(9.5%) patients were seen by a psychologist or counsellor at the PHC service, in 4 visits (4.8%) they were seen by a social
worker (one also was seen by the GP), in 57 visits (67.9%) patients were seen by a GP, and in 15 (17.9%) patients were
not seen by any of these health professionals (one saw the service nurse and 8 a health worker).
Discussion
The role of the GP in cancer care is growing. The frequency of contact with PHC services of Indigenous cancer patients
highlights the important role of the GP in providing cancer care, particularly for services located in remote areas where
the frequency of patient visits for cancer care was significantly higher. In a review of GPs and patients’ perspectives
across 58 studies [8], many supported a greater GP role in coordinating follow-up screening, symptom relief,
psychosocial care, general medical care and palliative care, particularly for rural GPs having a greater role than their
urban counterparts. Our findings regarding greater number of GP visits in PHC services located in remote/very remote
areas compared to their major city counterparts are in line with high involvement of GPs in cancer care in these areas [8,
19, 35].
National efforts to close the health disparities gap support initiatives such as the Aboriginal community controlled health
service sector. In Queensland, which constitutes 23% of Australia’s land mass, there are 25 ACCHSs and, where there is
an ACCHS, Indigenous Australians may have a preference for using it [29]. Quantifying PHC use by Indigenous cancer
patients is not straightforward as Indigenous identification is defined by self-assessment and not all PHC services have
the systems in place to identify the patient group [31]. In a report of the pattern of PHC service use (in general) by

9
Indigenous Australians, the average number of GP visits was 4 per person per year, and this number declined with
increasing remoteness [36]. Patients audited frequently visited PHC services for GP care related to their cancer, and
services located more remotely had more frequent visits than their major city counterparts. With a lack of cancer
treatment and support services in rural and remote areas [13, 14, 37], from the patients’ perspectives, out of preference
or necessity, some cancer patients may, regardless of advice to use the emergency arrangements of their oncology
service provider, contact their PHC service about cancer-related issues. From the perspectives of Australian GPs, out of
necessity many rural GPs play a more direct role in cancer care than metropolitan GPs [19].
Similar to previous reports of Indigenous Australians with cancer, two-thirds of the patients audited had at least one
comorbidity [6, 7]. Patients with comorbidities may be more likely to have existing relationships with PHC services or
GPs, which may be in part due to pre-existing health problems. This is reflected in the greater number of GP visits for
patients with higher levels of comorbidities in the study sample.
While many GPs report that they are well positioned to provide comprehensive, holistic approach to follow-up cancer
care,[19] they also report barriers for GP involvement, namely: transfer of information, GP knowledge [38, 39], time[8]
and resource[19] constraints experienced by GPs. In our study, for example, for over one-quarter of patients audited
cancer stage was not recorded in their medical charts. While up to 10% of Indigenous cancer patients with no
information on stage in their hospital medical chart have been previously reported [6, 7, 34], the higher proportion of
medical records at the PHC services with missing cancer stage may be attributed to poor communication between
hospitals and PHC services.
The routine assessment of psychosocial concerns and supportive care have been incorporated into many clinical
guidelines for cancer care [40]. GPs who often have many interactions with patients and existing knowledge of prior risk
factors (e.g. poor social support, personality factors) are well placed to detect and address psychosocial concerns [8].
However, many GPs reported having insufficient knowledge to effectively meet the psychosocial needs of cancer
patients, and some reported often lacking opportunity to discuss psychosocial aspects with their patients due to lack of
privacy, lack of time, or workload.[8] In our study, most visits to PHC services for which the reason included emotional
support and/or support for social issues appeared to have been addressed by the local GP. For a small proportion of
visits patients have seen the local psychologist or counsellor. Notably, for nearly one in five visits for which the reason
included emotional support and/or support for social, patients included in this audit appeared to have missed out on
such services. Our findings highlight the disparity between the patient’s visits to PHC service seeking emotional and/or
support for social issues and the low availability of specialist health workforce (e.g. social workers, psychologists, and
counsellors), and the corresponding low rates of referrals. These data also concur with a recent senate enquiry into
mental health services in regional areas where a cross sectional audit of over 3,000 Indigenous client records from 100

10
PHC services across Australia showed that most services lacked clear guidelines on best practice for screening and
follow-up of patients with emotional and/or support for social issues [41]. It is likely that patients audited are not
accessing psychological counselling because these services are lacking where they live [13, 28 , 37], local GPs are
managing these patients[19], patients under-recognize mental illness [42], or patients are not being routinely assessed
for psychosocial concerns. The use of the validated and culturally specific supportive care needs assessment tool for
Indigenous Australians has been shown to be feasible and acceptable in routine cancer care [43]. Routine screening with
a culturally specific tool coupled with greater availability of appropriate support services and with adequate
communication, training and support for psychological care for GPs, particularly in rural and remote areas, have the
potential to improve cancer care for Indigenous people with cancer.
The need for financial assistance as well as need for support with practical issues (e.g. transport, accommodation) have
been reported in previous studies of Indigenous cancer patients [27]. The financial concern as a result of having cancer
may be partially explained by the remoteness of residence and socioeconomic disadvantage of many Indigenous people
[22, 44]. The relatively high proportion of patients visiting the PHC services to organize transport or accommodation is a
reflection of such need.
To the best of our knowledge, this is the first study to examine the pattern of cancer care in the PHC setting of
Indigenous people diagnosed with cancer. Although slightly older and having more localized cancers [6, 7], with respect
to socioeconomic characteristics, patients audited appeared to be similar to the Indigenous cancer patients recruited in
previous studies in Queensland [6, 7, 34]. Despite the inclusion of PHC services from a mixture of remote, rural, and
urban areas, our findings may not necessarily be transferrable to all PHC services in Queensland. While the aim was not
to include only ACCHSs, with refusals or ineligibility of some non-ACCHSs invited to take part [31], most PHC services
included here were ACCHSs. Nevertheless, it is important to highlight that the quality of care delivered by ACCHSs are
generally at least on par with mainstream services [29, 45]. Lastly, results should be interpreted with caution due to the
small sample size, resulting in little statistical power to assess differences between groups with certainty; consequently,
there may have been differences between group comparisons that the study did not detect.
From an international perspective, Indigenous Australians with cancer described here form a useful case study as they
are a relatively disadvantaged group that experience poor health outcomes and relatively poor access to care. The
frequency of contact with PHC services of Indigenous cancer patients - especially by patients with comorbidities - and
the range of reasons for attendance, highlights the important role of the GP in providing cancer care. PHC services have
the potential to play a key role in supporting the most disadvantaged cancer patient groups, namely people living in
more deprived areas [1, 3], ethnic minorities [5-7], and patients who live in rural areas [4]. The high reliance on PHC
services, particularly by patients in remote and disadvantaged communities has important implications for appropriate

11
resourcing and support for services in these locations. With clear guidance, good communication between all care
providers, and adequate support and resourcing [10], GPs can potentially minimize the gap in access to health services
and improve cancer outcomes for disadvantaged groups.
Conflict of interest
There is no conflict of interest. Authors have no financial relationship with the organizations that sponsored the
research. PCV had full control of all primary data and agree to allow the journal to review our data if requested.
References
1. Cancer Research UK. Cancer survival statistics 2011; Available from: http://www.cancerresearchuk.org/health-
professional/cancer-statistics/survival/all-cancerscombined.
2. Australian Institute of Health and Wellfare, Cancer in Australia, in Cancer series no. 101. Cat. no. CAN 100.
Canberra: AIHW., Australian Bureau of Statistics, Editor. 2017.
3. Kish, J.K., et al., Racial and ethnic disparities in cancer survival by neighborhood socioeconomic status in
Surveillance, Epidemiology, and End Results (SEER) Registries. J Natl Cancer Inst Monogr, 2014. 2014(49): p. 236-
43.
4. Cramb, S.M., et al., Spatial variation in cancer incidence and survival over time across Queensland, Australia.
Spat Spatiotemporal Epidemiol, 2017. 23: p. 59-67.
5. McGahan, C.E., et al., Cancer in First Nations people living in British Columbia, Canada: an analysis of incidence
and survival from 1993 to 2010. Cancer Causes Control, 2017. 28(10): p. 1105-1116.
6. Moore, S.P., et al., Survival disparities in Australia: an analysis of patterns of care and comorbidities among
indigenous and non-indigenous cancer patients. BMC Cancer, 2014. 14: p. 517.
7. Valery, P.C., et al., Cancer diagnosis, treatment, and survival in Indigenous and non-Indigenous Australians: a
matched cohort study. Lancet, 2006. 367(9525): p. 1842-8.
8. Meiklejohn, J.A., et al., The role of the GP in follow-up cancer care: a systematic literature review. J Cancer
Surviv, 2016. 10(6): p. 990-1011.
9. Adam, R. and E. Watson, The role of primary care in supporting patients living with and beyond cancer. Curr Opin
Support Palliat Care, 2018. 12(3): p. 261-267.
10. Rubin, G., et al., The expanding role of primary care in cancer control. Lancet Oncol, 2015. 16(12): p. 1231-72.
11. Holtedahl, K., B.I. Scheel, and M.L. Johansen, General practitioners' participation in cancer treatment in Norway.
Rural Remote Health, 2018. 18(2): p. 4276.
12. DeMario, M.D. and M.J. Ratain, Oral chemotherapy: rationale and future directions. J Clin Oncol, 1998. 16(7): p.
2557-67.

12
13. Whop, L.J., et al., Cancer support services--are they appropriate and accessible for Indigenous cancer patients in
Queensland, Australia? Rural Remote Health, 2012. 12: p. 2018.
14. National Rural Health Alliance. The health of people living in remote Australia. 2016 25 Jun 2018]; Available
from: http://www.ruralhealth.org.au/factsheets/thumbs.
15. Adams, D. and G. Marx, Daily life as an Australian medical oncologist. J Oncol Pract, 2010. 6(3): p. 146-8.
16. Baade, P.D., et al., Geographic remoteness, area-level socioeconomic disadvantage and inequalities in colorectal
cancer survival in Queensland: a multilevel analysis. BMC Cancer, 2013. 13: p. 493.
17. Zucca, A., et al., Travelling all over the countryside: travel-related burden and financial difficulties reported by
cancer patients in New South Wales and Victoria. Aust J Rural Health, 2011. 19(6): p. 298-305.
18. Butow, P.N., et al., Psychosocial well-being and supportive care needs of cancer patients living in urban and
rural/regional areas: a systematic review. Support Care Cancer, 2012. 20(1): p. 1-22.
19. Johnson, C.E., et al., Australian general practitioners' preferences for managing the care of people diagnosed
with cancer. Asia Pac J Clin Oncol, 2014. 10(2): p. e90-8.
20. Gracey, M., Why closing the Aboriginal health gap is so elusive. Intern Med J, 2014. 44(11): p. 1141-3.
21. Australian Institute of Health and Welfare (AIHW) and Cancer Australia, Cancer in Aboriginal & Torres Strait
Islander people of Australia. 2018, AIHW Canberra.
22. Australian Institute of Health and Welfare (AIHW), The health and welfare of Australia’s Aboriginal and Torres
Strait Islander peoples 2015. 2015, AIHW: Canberra.
23. Chong, A. and D. Roder, Exploring differences in survival from cancer among Indigenous and non-Indigenous
Australians: implications for health service delivery and research. Asian Pac J Cancer Prev, 2010. 11(4): p. 953-61.
24. Condon, J.R., et al., Long-term trends in cancer mortality for Indigenous Australians in the Northern Territory.
Med J Aust, 2004. 180(10): p. 504-7.
25. Garvey, G., et al., Psychological distress among Indigenous Australian cancer survivors. Support Care Cancer,
2018. 26(6): p. 1737-1746.
26. Shahid, S., et al., 'Nowhere to room ... nobody told them': logistical and cultural impediments to Aboriginal
peoples' participation in cancer treatment. Aust Health Rev, 2011. 35(2): p. 235-41.
27. Valery, P.C., et al., Unmet supportive care needs of Australian Aboriginal and Torres Strait Islanders with cancer:
a prospective, longitudinal study. Support Care Cancer, 2017. 25(3): p. 869-877.
28. Australian Bureau of Statistics (ABS), Estimates and projections, Aboriginal and Torres Strait Islander Australians.
2014, ABS: Canberra.
29. Panaretto, K.S., et al., Prevention and management of chronic disease in Aboriginal and Islander Community
Controlled Health Services in Queensland: a quality improvement study assessing change in selected clinical
performance indicators over time in a cohort of services. BMJ Open, 2013. 3(4).

13
30. Gomersall, J.S., et al., What Indigenous Australian clients value about primary health care: a systematic review of
qualitative evidence. Aust N Z J Public Health, 2017. 41(4): p. 417-423.
31. de Witt, A., et al., Identification of Australian Aboriginal and Torres Strait Islander Cancer Patients in the Primary
Health Care Setting. Front Public Health, 2017. 5: p. 199.
32. Charlson, M.E., et al., A new method of classifying prognostic comorbidity in longitudinal studies: development
and validation. J Chronic Dis, 1987. 40(5): p. 373-83.
33. Young, J.L., et al., Summary Staging Manual 2000: Codes and Coding Instructions. 2001, National Cancer
Institute: Bethesda, MD
34. Garvey, G., et al., Psychometric properties of an Australian supportive care needs assessment tool for Indigenous
patients with cancer. Cancer, 2015. 121(17): p. 3018-26.
35. Holmberg, L., The role of the primary-care physician in oncology care. Primary healthcare and specialist cancer
services. Lancet Oncol, 2005. 6(2): p. 121-2.
36. Deeble, J., Assessing the health service use of Aboriginal and Torres Strait Islander peoples. 2009, Department of
Health and Ageing, Australian Government Canberra.
37. Australian Institute of Health and Welfare (AIHW). Mental health services in Australia. 2018 7 Jul 2018].
38. Brennan, M., et al., Follow up after breast cancer -- views of Australian women. Aust Fam Physician, 2011. 40(5):
p. 311-6.
39. Wind, J., et al., Follow-up after colon cancer treatment in the Netherlands; a survey of patients, GPs, and
colorectal surgeons. Eur J Surg Oncol, 2013. 39(8): p. 837-43.
40. Jacobsen, P.B. and L.I. Wagner, A new quality standard: the integration of psychosocial care into routine cancer
care. J Clin Oncol, 2012. 30(11): p. 1154-9.
41. Matthews, V., et al., Submission to the Senate Inquiry, “Accessibility and quality of mental health services in rural
and remote Australia” on behalf of the Centre for Research Excellence in Integrated Quality Improvement 2018.
42. Handley, T.E., et al., Self-recognition of mental health problems in a rural Australian sample. Aust J Rural Health,
2018. 26(3): p. 173-180.
43. Garvey, G., et al., Indigenous cancer patient and staff attitudes towards unmet needs screening using the SCNAT-
IP. Support Care Cancer, 2016. 24(1): p. 215-23.
44. Tzelepis, F., et al., Unmet supportive care needs of haematological cancer survivors: rural versus urban residents.
Ann Hematol, 2018. 97(7): p. 1283-1292.
45. Campbell, M.A., et al., Contribution of Aboriginal Community-Controlled Health Services to improving Aboriginal
health: an evidence review. Aust Health Rev, 2017.

14
Figure 1. Flow chart of case ascertainment
Cases ascertained N=475
Benign neoplasm n=126 Not cancer n=67 Non-Indigenous patient n=55 Diagnosed before 2010 n=48 Age <18 years n=3 Basal cell carcinoma n=1 Not considered an “active patient” n=1 Not enough information to decide on eligibility* n=16
Potentially eligible cases
N=158
Due to resource and time constraints review of medical
charts due was not possible n=17 Excluded after thorough review of the medical chart:
• Not cancer n=2 • Diagnosed before 2010 n=1
Included in the analysis
N=138
*A diagnosis of cancer was recorded on the clinical notes but details about diagnosis date, treatment, or communications to and from hospital or specialists related to the cancer were not available in the notes

15
Table 1. Sociodemographic and clinical characteristics of 138 Indigenous cancer patients
N=138 % Age at diagnosis*
20-39 13 9.4 40-59 69 50.0 ≥60 56 40.6
Sex Male 52 37.7 Female 86 62.3
Indigenous status Aboriginal 126 91.3 Torres Strait Islander 6 4.3 Aboriginal & Torres Strait Islander 6 4.3
Socioeconomic advantage/disadvantage§ Most affluent 27 19.7 Low to intermediate 47 34.3 Most disadvantaged 63 46.0
Rurality of residence (ARIA) § Major city 35 25.5 Outer/inner regional 66 48.2 Remote/very remote 36 26.3
Cancer type¶ Breast 40 29.0 Female genital organs 22 15.9 Digestive organs 16 11.6 Respiratory and intrathoracic organs 15 10.9 Male genital organs 14 10.1 Lymphoid, haematopoietic and related tissue 8 5.8 Lip, oral cavity and pharynx 7 5.1 Eye, brain and other parts of central nervous system 3 2.2
Other cancers** 11 8.0 Cancer stage
Local 59 42.8 Regional 20 14.5 Distant 16 11.6 Not applicable (e.g. leukaemias, lymphomas) 8 5.8 Missing 35 25.4
Cancer treatment Yes 124 89.9 No 10 7.2 Not clear in the medical notes 4 2.9
Cancer treatment by type¥ Surgery 93 67.4 Radiotherapy 54 39.1 Chemotherapy 56 40.6
Charlson comorbidity index CCI=0 (no comorbidity) 48 34.8 CCI=1 43 31.2 CCI≥2 47 34.1
* Approximate age for 14 patients for whom we had year of diagnosis; ** Other cancers include thyroid and other endocrine glands, bone and articular cartilage, urinary tract, and skin (excluding squamous cell and basal cell carcinoma); ¥ Totals do not add up to 100% as patients could have received more than one treatment, and it was not clear in the notes whether patients had surgery (n=4), chemotherapy (n=10) or radiotherapy (n=17); § Post code for place of residence was missing for 1 case; ¶ For 2 cases it was recorded in the notes that patient had cancer but cancer type was not clear.
16
Table 2. Variation between services in frequency of cancer-related visits by Primary Health Care services
All visits Visits for patient care
Audit period** Within 12 months§ Audit period** Within 12 months§
Service Location GP* N active patients
N visits
Rate per
PYAR
IRR (95% CI)
Rate per
PYAR
IRR (95% CI) N
visits
Rate per
PYAR
IRR (95% CI)
Rate per
PYAR
IRR (95% CI)
1 Major city yes >2000 185 3.72 1.00¶ 7.71 1.00¶ 163 3.27 1.00¶ 6.72 1.00¶ 2 Major city yes >2000 97 3.07 0.83 (0.65-1.06) 6.66 0.86 (0.64-1.17) 66 2.09 0.64 (0.48-0.85) 4.19 0.62 (0.44-0.89) 3 Outer regional no ≤2000 28 2.42 0.65 (0.44-0.97) 4.90 0.64 (0.39-1.02) 23 1.99 0.61 (0.39-0.94) 3.68 0.55 (0.32-0.94) 4 Outer regional yes >2000 160 3.91 1.05 (0.85-1.30) 9.01 1.17 (0.90-1.52) 140 3.42 1.05 (0.83-1.31) 8.32 1.24 (0.94-1.63) 5 Very remote yes ≤2000 157 9.44 2.54 (2.05-3.14) 14.60 1.89 (1.41-2.55) 146 8.78 2.68 (2.14-3.35) 13.20 1.96 (1.44-2.69) 6 Very remote no ≤2000 138 4.29 1.16 (0.93-1.44) 11.32 1.47 (1.12-1.92) 91 2.83 0.86 (0.67-1.12) 8.05 1.20 (0.88-1.62) 7 Inner regional yes >2000 128 2.83 0.76 (0.61-0.96) 5.40 0.70 (0.52-0.94) 115 2.54 0.78 (0.61-0.99) 4.75 0.71 (0.52-0.97) 8 Outer regional yes >2000 182 4.65 1.25 (1.02-1.54) 8.82 1.15 (0.89-1.48) 156 3.99 1.21 (0.98-1.52) 7.95 1.18 (0.90-1.55) 9 Remote no ≤2000 113 8.27 2.23 (1.76-2.81) 14.17 1.84 (1.38-2.44) 94 6.88 2.10 (1.63-2.71) 12.31 1.83 (1.35-2.49) 10 Major city yes >2000 137 3.10 0.83 (0.67-1.04) 4.01 0.52 (0.39-0.69) 127 2.87 0.88 (0.70-1.11) 3.77 0.56 (0.42-0.76)
p<0.001 p<0.001
p<0.001 p<0.001
Overall
1325 4.08 7.78 1121 3.45 6.62
Rate per person years (PYAR); Incidence rate ratios (IRR); *PHC service had a permanent GP; **A mid-year date of diagnosis was assumed for 14 patients for whom an approximate date of diagnosis (year only) was recorded in the medical charts; § Data from 14 patients with an approximate date of diagnosis (mid-year date) were excluded; ¶Service 1 was used as the ‘reference’ for purpose of comparison because its rates were similar to the overall rates and a large number of patients were audited.

17
Table 3. Frequency of visits to Primary Health Care services by reason
Within 12
months N (%) Audit period N (%)
Reason for visits* Total N=868 Total N=1325
Patient care 739 (85.1) 1121 (84.6) Medical prescription (e.g. provision or review of scripts) 274 (31.6) 411 (31.0) Patient presented with symptoms (e.g. pain) 222 (25.6) 351 (26.5) Scheduled appointment for check-up, review, palliative care 188 (21.6) 341 (25.8) Treatment plan, care coordination (e.g. case conference, discussion of or review of multidisciplinary team meeting reports, coordination of hospital transfer)
121 (14.0) 167 (12.6)
Wound care 106 (12.2) 112 (8.5) Emotional support and/or support for social issues 57 (6.6) 84 (6.3) Education or counselling (e.g. counselling to quit smoking, pre admission information) 55 (6.3) 84 (6.3) Provision of medical certificate 32 (3.7) 52 (3.9) Home or hospital visit (e.g. visit to patient’s home or to ward/emergency department) 61 (7.1) 102 (7.7) Post-operative review or post-operative complications 112 (12.9) 123 (9.2)
To check or request tests 181 (20.9) 292 (22.0) Pathology tests (e.g. blood tests, swab, urine test) 140 (16.1) 214 (16.2) Radiology / imaging tests (e.g. x-ray, CT scan) 53 (6.1) 96 (7.2) Other tests (e.g. electrocardiogram, spirometry, endoscopy, colonoscopy) 5 (0.6) 6 (0.5)
Administrative 226 (26.0) 332 (25.1) Arrangement of transport or accommodation 133 (15.3) 173 (13.1) Referrals (e.g. specialists, allied health, support services) 59 (6.8) 112 (8.5) Centrelink and other administrative forms (e.g. carer allowance, sickness benefit allowance,
42 (4.9) 65 (4.9)
transfer medical record, new patient) * Percentages are calculated out of the total number of visits and they do not add up to 100% because more than one reason could be present for the visit; reason missing for 5 visits;

Figure 2. Rate of visits to PHC services for patient care during the audit period and incidence rate ratios by key health
service and patient characteristics
Rate per person years (PYAR); Incidence rate ratios (IRR) (Poisson regression); For permanent GP vs. not the rate of visits to PHC services were similar, p-value=0.431 (data not shown); § All PHC visits to see a GP; ¥ p-value <0.001; € p-value=0.012;
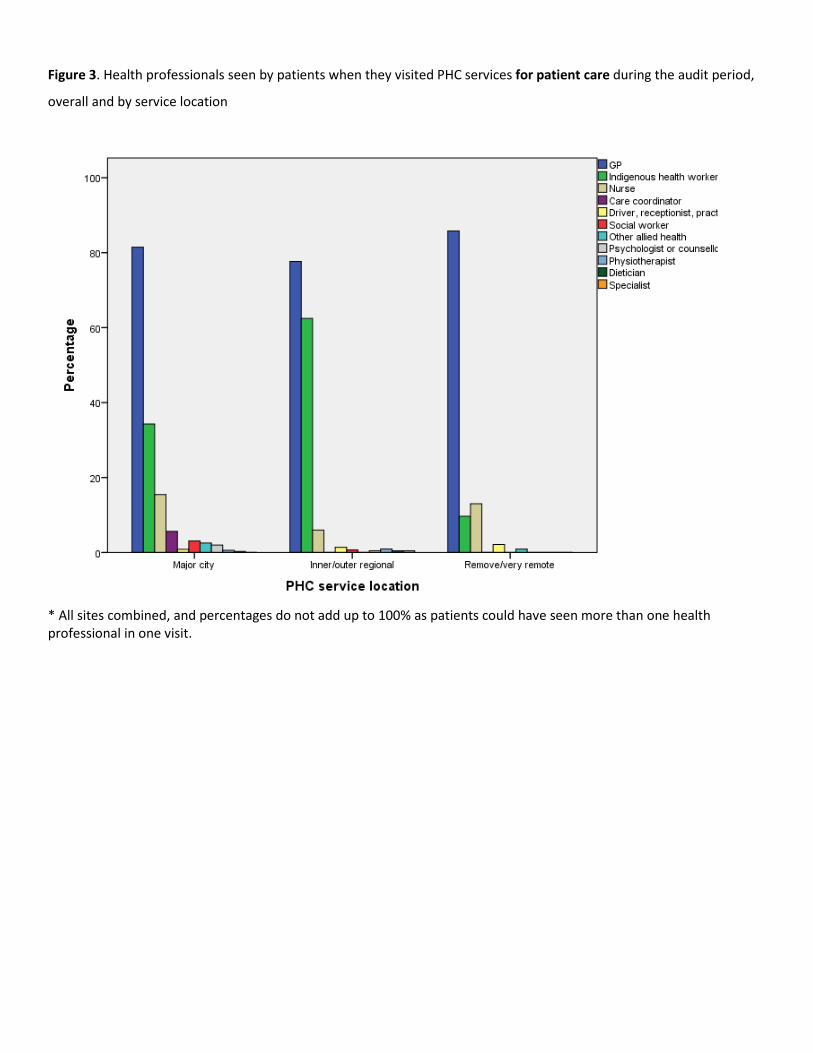
Figure 3. Health professionals seen by patients when they visited PHC services for patient care during the audit period,
overall and by service location
* All sites combined, and percentages do not add up to 100% as patients could have seen more than one health professional in one visit.

Figure 4. Referrals made during 303 patient visits to the PHC service during the audit period, overall and by service
location
* All sites combined, and percentages do not add up to 100% as patients could have seen more than one health professional in one visit.

Supplementary Table 1. Sociodemographic and clinical characteristics of 138 Indigenous cancer patients identified
through primary health care services compared with 248 Indigenous cancer patients identified as attending four large
treating hospitals in Queensland[34]
* Approximate age for 14 patients for whom we had year of diagnosis; ** Other cancers indicate thyroid and other endocrine glands, bone and articular cartilage, urinary tract, and skin (excluding squamous cell and basal cell carcinoma); § Post code place of residence was missing for 1 case; ¶ For 2 cases it was recorded in the notes that patient had cancer but cancer type was not clear;
PHC service cohort SCN Study N=138 % N=248 % p-value Age at diagnosis*
20-39 13 9.4 39 15.7 0.082 40-59 69 50.0 136 54.8 0.365 ≥60 56 40.6 73 29.4 0.025
Sex Male 52 37.7 107 43.1 0.302 Female 86 62.3 141 56.9 0.302
Indigenous status Aboriginal 126 91.3 189 76.2 <0.001 Torres Strait Islander 6 4.3 47 19.0 <0.001 Aboriginal & Torres Strait Islander 6 4.3 12 4.8 0.823
Socioeconomic advantage/disadvantage § Most affluent 27 19.7 44 17.7 0.627 Low to intermediate 47 34.3 132 53.2 <0.001 Most disadvantaged 63 46.0 72 29.0 <0.001
Rurality of residence (ARIA) § Major city 35 25.5 80 32.3 0.162 Outer/inner regional 66 48.2 112 45.2 0.570 Remote/very remote 36 26.3 56.0 22.6 0.414
Cancer type¶ Breast 40 29.0 60 24.2 0.302 Female genital organs 22 15.9 18 7.3 0.008 Digestive organs 16 11.6 31 12.5 0.796 Respiratory and intrathoracic organs 15 10.9 34 13.7 0.429 Male genital organs 14 10.1 18 7.3 0.339 Lymphoid, haematopoietic and related tissue 8 5.8 32 12.9 0.028 Lip, oral cavity and pharynx 7 5.1 22 8.9 0.175 Eye, brain and other parts of central nervous system 3 2.2 12 4.8 0.204 Other 11 8.0 16 6.5 0.581
Cancer stage** Local 59 42.8 61 24.6 <0.001 Regional 20 14.5 73 29.4 0.001 Distant 16 11.6 65 26.2 <0.001 Not applicable 8 5.8 35 14.1 0.013 Missing 35 25.4 14 5.6 <0.001