Charge variant analysis of proposed biosimilar to Trastuzumab variant analysis of... · Charge...
11
Charge variant analysis of proposed biosimilar to Trastuzumab Pravinkumar Dakshinamurthy a, 1 , Pavithra Mukunda a, 1 , Bhargav Prasad Kodaganti a , Bharath Ravindra Shenoy a , Bairavabalakumar Natarajan a , Amol Maliwalave a , Vivek Halan a , Sathyabalan Murugesan a , Sunit Maity a, b, * a Zumutor Biologics, Bangalore, India b Theramyt Novobiologics Pvt Ltd, Bangalore, India article info Article history: Received 4 April 2016 Received in revised form 4 November 2016 Accepted 20 December 2016 Available online xxx Keywords: Biosimilar Charge variants Binding kinetics In vitro potency abstract Trastuzumab is a humanized monoclonal antibody (mAb) employed for the treatment of HER2 Positive Breast Cancer. A HER2 overexpressing tumor cell binds to Trastuzumab and attracts immune cells which lead to induction of Antibody Dependent Cellular Cytotoxicity (ADCC) by binding to Fc receptors (CD16a or FcgRIIIa) on an effector cell, such as natural killer (NK) cells. The most commonly expressed receptor on NK cell is CD16a which binds to the Fc portion of Tras- tuzumab. The ligand-independent HER2eHER3 dimerization is the most potent stimulator of down- stream pathways for regulation of cell growth and survival. An attempt has been made in this study to understand the impact of charge heterogeneity on the binding kinetics and potency of the monoclonal antibody. Trastuzumab has a pI range of 8.7e8.9 and is composed of mixture of acidic and basic variants beside the main peak. Ion exchange chromatography was used to isolate the acidic, basic, and main peak fractions from in-house proposed biosimilar to Trastuzumab and their activities were compared to the Innovator Trastuzumab Herclon ® . Data from the mass analysis confirmed the potential modifications in both acidic and basic variant. Binding activity studies performed using Surface Plasmon Resonance (SPR) revealed that acidic variants had lesser binding to HER2 in comparison to the basic variants. Both acidic and basic variant showed no significant changes in their binding to soluble CD16a receptors. In vitro assay studies using a breast cancer cell line (BT-474) confirmed the binding potency of acidic variant to be lesser than basic variant, along with reduced anti-proliferative activity for the acidic variant of Trastu- zumab. Overall, these data has provided meaningful insights to the impact of antibody charge variants on in vitro potency and CD16 binding affinity of trastuzumab. © 2016 International Alliance for Biological Standardization. Published by Elsevier Ltd. All rights reserved. 1. Introduction There were 14.1 million new cancer cases, 8.2 million cancer deaths and 32.6 million people living with cancer (within 5 years of diagnosis) in 2012 worldwide [1]. The high mortality rate of cancer serves as a reminder of the need for more effective therapies. Over the last few decades, monoclonal antibodies have made a major impact with respect to human therapeutics for cancer. There are currently several mAb-based products which have been approved by the regulatory agencies for the treatment of a wide range of human cancers [2,3]. Beside cancer, mAbs are also being used for treatment of several other diseases including autoimmunity, organ transplant rejection, inflammation and infection etc. [4]. Monoclonal antibodies are Immunoglobulin G (IgG) type of proteins (approximately 150 kDa), comprising a pair of heavy and light chains connected by disulfide bonds. The heavy chains constitute of a variable domain (V H ), a hinge and three constant (C H1 ,C H2 and C H3 ) regions. The light chains contain one variable (V L ) and one constant (C L ) region. Immunoglobulin structure can also be subdivided into Fragment antigen binding (Fab) and the Fragment crystallizable (Fc) domain. The specificity of Antibodies (Abs) is represented by the Fab region where the interaction between an- tigen and antibody takes place. Fc domain is responsible for effector function of the immunoglobulins [2]. The specificity and affinity of antibody-antigen interactions are essential for elucidating the biological activity of monoclonal antibodies. In general, Monoclonal * Corresponding author. Theramyt Novobiologics Private Limited, Bangalore, 560022, India. E-mail address: [email protected] (S. Maity). URL: http://www.theramyt.com 1 Both the authors contributed equally. Contents lists available at ScienceDirect Biologicals journal homepage: www.elsevier.com/locate/biologicals http://dx.doi.org/10.1016/j.biologicals.2016.12.006 1045-1056/© 2016 International Alliance for Biological Standardization. Published by Elsevier Ltd. All rights reserved. Biologicals xxx (2017) 1e11 Please cite this article in press as: Dakshinamurthy P, et al., Charge variant analysis of proposed biosimilar toTrastuzumab, Biologicals (2017), http://dx.doi.org/10.1016/j.biologicals.2016.12.006
Transcript of Charge variant analysis of proposed biosimilar to Trastuzumab variant analysis of... · Charge...
lable at ScienceDirect
Biologicals xxx (2017) 1e11
Contents lists avai
Biologicals
journal homepage: www.elsevier .com/locate/bio logicals
Charge variant analysis of proposed biosimilar to Trastuzumab
Pravinkumar Dakshinamurthy a, 1, Pavithra Mukunda a, 1, Bhargav Prasad Kodaganti a,Bharath Ravindra Shenoy a, Bairavabalakumar Natarajan a, Amol Maliwalave a,Vivek Halan a, Sathyabalan Murugesan a, Sunit Maity a, b, *
a Zumutor Biologics, Bangalore, Indiab Theramyt Novobiologics Pvt Ltd, Bangalore, India
a r t i c l e i n f o
Article history:Received 4 April 2016Received in revised form4 November 2016Accepted 20 December 2016Available online xxx
Keywords:BiosimilarCharge variantsBinding kineticsIn vitro potency
* Corresponding author. Theramyt Novobiologics560022, India.
E-mail address: [email protected] (S. MaURL: http://www.theramyt.com
1 Both the authors contributed equally.
http://dx.doi.org/10.1016/j.biologicals.2016.12.0061045-1056/© 2016 International Alliance for Biologica
Please cite this article in press as: Dakshinamhttp://dx.doi.org/10.1016/j.biologicals.2016.1
a b s t r a c t
Trastuzumab is a humanized monoclonal antibody (mAb) employed for the treatment of HER2 PositiveBreast Cancer. A HER2 overexpressing tumor cell binds to Trastuzumab and attracts immune cells whichlead to induction of Antibody Dependent Cellular Cytotoxicity (ADCC) by binding to Fc receptors (CD16aor FcgRIIIa) on an effector cell, such as natural killer (NK) cells.
The most commonly expressed receptor on NK cell is CD16a which binds to the Fc portion of Tras-tuzumab. The ligand-independent HER2eHER3 dimerization is the most potent stimulator of down-stream pathways for regulation of cell growth and survival. An attempt has been made in this study tounderstand the impact of charge heterogeneity on the binding kinetics and potency of the monoclonalantibody. Trastuzumab has a pI range of 8.7e8.9 and is composed of mixture of acidic and basic variantsbeside the main peak. Ion exchange chromatography was used to isolate the acidic, basic, and main peakfractions from in-house proposed biosimilar to Trastuzumab and their activities were compared to theInnovator Trastuzumab Herclon®. Data from the mass analysis confirmed the potential modifications inboth acidic and basic variant. Binding activity studies performed using Surface Plasmon Resonance (SPR)revealed that acidic variants had lesser binding to HER2 in comparison to the basic variants. Both acidicand basic variant showed no significant changes in their binding to soluble CD16a receptors. In vitro assaystudies using a breast cancer cell line (BT-474) confirmed the binding potency of acidic variant to belesser than basic variant, along with reduced anti-proliferative activity for the acidic variant of Trastu-zumab. Overall, these data has provided meaningful insights to the impact of antibody charge variants onin vitro potency and CD16 binding affinity of trastuzumab.© 2016 International Alliance for Biological Standardization. Published by Elsevier Ltd. All rights reserved.
1. Introduction
There were 14.1 million new cancer cases, 8.2 million cancerdeaths and 32.6 million people living with cancer (within 5 years ofdiagnosis) in 2012 worldwide [1]. The high mortality rate of cancerserves as a reminder of the need for more effective therapies. Overthe last few decades, monoclonal antibodies have made a majorimpact with respect to human therapeutics for cancer. There arecurrently several mAb-based products which have been approvedby the regulatory agencies for the treatment of a wide range of
Private Limited, Bangalore,
ity).
l Standardization. Published by El
urthy P, et al., Charge varian2.006
human cancers [2,3]. Beside cancer, mAbs are also being used fortreatment of several other diseases including autoimmunity, organtransplant rejection, inflammation and infection etc. [4].
Monoclonal antibodies are Immunoglobulin G (IgG) type ofproteins (approximately 150 kDa), comprising a pair of heavy andlight chains connected by disulfide bonds. The heavy chainsconstitute of a variable domain (VH), a hinge and three constant(CH1, CH2 and CH3) regions. The light chains contain one variable (VL)and one constant (CL) region. Immunoglobulin structure can also besubdivided into Fragment antigen binding (Fab) and the Fragmentcrystallizable (Fc) domain. The specificity of Antibodies (Abs) isrepresented by the Fab region where the interaction between an-tigen and antibody takes place. Fc domain is responsible for effectorfunction of the immunoglobulins [2]. The specificity and affinity ofantibody-antigen interactions are essential for elucidating thebiological activity of monoclonal antibodies. In general, Monoclonal
sevier Ltd. All rights reserved.
t analysis of proposed biosimilar to Trastuzumab, Biologicals (2017),
P. Dakshinamurthy et al. / Biologicals xxx (2017) 1e112
antibodies function through three different mechanisms (a) byinducing Antibody-Dependent Cellular Cytotoxicity (ADCC) andComplement-Dependent Cytotoxicity (CDC), (ii) they directly targetantigen present on tumor cells and (iii) can be conjugated to a lethaldrug, toxin or radioisotope for enhanced specificity towards tumorcells [2].
In spite of their defined biological activities, heterogeneity hasbeen observed very commonly in monoclonal antibodies. Theheterogeneity of monoclonal antibodies can be introduced eitherby intracellular or extracellular process. Heterogeneity can also beintroduced by incubation with buffers, during purification processand also during storage. Both enzymatic and non-enzymaticmodifications including formation of disulfide bonds, glycosyla-tion, N-terminal glutamine cyclization, C-terminal lysine process-ing, deamidation, oxidation, glycation, and peptide bond cleavagewill contribute towards heterogeneity [5]. Chemical and enzymaticmodifications such as deamidation and sialylation, respectively,result in an increase in the net negative charge on the mAbs andcause a decrease in their pI values, thereby leading to the formationof acidic variants. C-terminal lysine cleavage results in the loss ofnet positive charge and also leads to acidic variant formation [6].Another mechanism for generating acidic variants is the formationof various types of covalent adducts, e.g., glycation, where glucoseor lactose can react with the primary amine of a lysine residueduring manufacturing process (in glucose-rich culture media) orduring storage if a reducing sugar is present in the formulation.Formation of the basic variants can result from the presence of C-terminal lysine or glycine amidation, succinimide formation, aminoacid oxidation or removal of sialic acid, which introduce additionalpositive charges or removal of negative charges; both types ofmodification cause an increase in pI values [5].
These variations in composition occur in many types of proteinand can impact the activity and stability of biotherapeutics. Asmentioned earlier, these variations are introduced either enzy-matically during antibody expression or by spontaneous degrada-tion during manufacturing and storage of the formulated material.Most degradation pathways occurring in proteins were alsoinvolved in charge-related heterogeneity of monoclonal antibodies.As more and more antibodies are characterized, the knowledge ofmodifications responsible for charge-related heterogeneity in an-tibodies will also increase. Therefore, the current challenge is tounderstand the effects that mAb micro-heterogeneity on the effi-cacy, potency, immunogenicity and clearance in patients [7e9].Several articles have been published with respect to the chargevariants of monoclonal antibodies which can be generated duringthe process [10e14]. In this paper, we decided to look at the acidicand basic variants of Trastuzumab and their effects on binding andpotency.
Trastuzumab (brand name Herceptin®/Herclon®) is a recombi-nant humanized IgG1k monoclonal antibody glycoprotein thatbinds specifically to extracellular domain of human epidermalgrowth factor receptor 2 (HER-2) [15e17]. Overexpression of ErbB2(HER-2), a member of the epidermal growth factor receptor (EGFR)family of receptor tyrosine kinases, occurs in 20e30% of invasivebreast cancers, is associated with poor prognosis and rapid relapse.The major mechanisms of action of trastuzumab are believed to beby interfering with the dimerization of HER2 thus leading toabrogation of intracellular HER-2 signalling through pathwaysincluding PI3K/Akt and Ras/MAPK leading to cell cycle arrest,reduction in angiogenesis, inhibition of extracellular domaincleavage, and antibody-dependent cell-mediated cytotoxicity(ADCC) [18]. Clynes et al. demonstrated that the activity of Tras-tuzumab on breast cancer xenografts was attenuated in knock-outmice lacking activating FcgRIII (CD16) receptor [19]. Once the Fcreceptor CD16 binds to the Fc region of Trastuzumab, the Natural
Please cite this article in press as: Dakshinamurthy P, et al., Charge varianhttp://dx.doi.org/10.1016/j.biologicals.2016.12.006
Killer cell releases cytokines, thus killing the target cells, The chargevariants for the study were isolated during the development ofproposed biosimilar to Trastuzumab. The goal of this work is toseparate the major charge variants (acidic, basic and main peakfractions) of the Trastuzumab, characterize some of their biophys-ical characteristics, their CD16 and HER2 binding activity and alsotheir potency in an in vitro cell based assay.
2. Materials and methods
Trastuzumab innovator Herclon® (Roche) was procured andused for comparison in all the analytical assays.
2.1. Purification and isolation of charge variants
Chromatographic runs were performed with GE AKTA PURE150 M system. All the columns were pre-equilibrated withrespective equilibration buffers prior to loading. Clarified harvestsamplewas loaded onto XK26/40MabSelect Sure Protein-A columnat pH 7.2 and target protein (mAb) was eluted using low pH buffer(30 mM PBS, pH 3.0) followed by viral inactivation at pH 3.0 for60 min. Virus inactivated protein-A elute was neutralized to pH 6.0and then loaded onto XK26/20 AEX Q-Sepharose column in flowthrough (FT) mode. FT of AEX was loaded onto XK26/40 CEXSOURCE 30S column in binding and elute mode, column was re-equilibrated with loading buffer (50 mM Histidine, pH 6.0, 2 mS/cm) and washed with wash buffer (50 mM Histidine, pH 6.0, 5 mS/cm) for 3 column volumes (CVs) prior to elution. Elution was per-formed in linear gradient mode from 0 to 100% mobile phase B in80 min where buffer A was 50 mM Histidine, 10 mM NaCl pH 6.0,5 mS/cm and buffer B was 50 mM Histidine, 200 mM NaCl pH 6.0,15 mS/cm respectively. Eluted fractions were collected and sub-jected to further ion-exchange analysis for determining percentageof acidic variants, main peak and basic variants in each fraction.
2.2. Protein concentration measurement of mAb fraction
The protein concentration of isolated charge variant fractionswere determined by Protein-A affinity chromatography by usingmAbPac Protein-A column (12 mm; 4 � 35 mm) on an ShimadzuProminence-i HPLC system. Two mobile phases used were Dul-becco's Phosphate Buffered Saline (mobile phaseeA) and 3% glacialacetic acid (mobile phase eB) at a flow rate of 2.5 ml/min. Thegradient involved: 0% B for 0.5 min; a linear increase from 0% to100% B in 0.25 min, a maintaining 100% B for 0.75 min, a lineardecrease from 100% to 0% B in 0.5 min; and equilibration at 0% B for1.0 min. The injection volumewas set at 50 mL, column temperaturewas maintained at 25 �C and eluted fractions were detected at280 nm. Chromatograms were integrated using Lab Solution Soft-ware and the concentration was estimated using Herclon Standardcurve.
2.3. SDS PAGE analysis
Antibody samples were analyzed by SDS-PAGE under reducingand non-reducing conditions. 8% (v/v) resolving gel was used fornon-reducing condition and 12% (v/v) resolving gel for the reducingcondition. Tris Glycine SDS PAGE was performed on the Mini-PROTEAN system (Biorad) as per the supplier's protocol [19].
Polyacrylamide gels were prepared from acrylamide and bis-acrylamide stock solution (29:1), Stacking buffer (1 M Tris-HCl pH6.8), Resolving buffer (2 M Tris-HCl pH 8.8), 10% SDS, APS andTEMED as the catalyst. Stacking gel was used at 4% concentration.
Antibody samples were mixed with 5X sample buffer (1 M Tris-HCl pH 6.8, 10% SDS, b-mercaptoethanol (in case of reducing
t analysis of proposed biosimilar to Trastuzumab, Biologicals (2017),
P. Dakshinamurthy et al. / Biologicals xxx (2017) 1e11 3
condition), 50% glycerol, 2% (w/v) Bromophenol Blue). The samplemixturewas then heated for 5min before loading on to the gel. 5 mgof the samples were loaded on to the gel for reduced condition and0.5 mg for the non-reduced condition. The electrophoresis wascarried out at 150 V for 60min until the tracking dye reaches 80% ofthe gel length. This was done to retain all smaller fragments on thegel. Protein Marker ladder (Biorad) with molecular weight rangedbetween 10 and 250 kDa was used as standard. Staining was per-formed with Coomasie brilliant blue 0.2% (w/v) [20]. The stainedgels were then destained with a mixture of methanol: acetic acidsolution (40%: 10%) and were scanned.
2.4. Immunoblotting
Antibody samples resolved in SDS-polyacrylamide gels (undernon-reducing condition), were then transferred to a PVDF mem-brane as reported by Matsudaira [21]. After blocking with 1% (w/v)BSA in 0.05% Tween/PBS (PBST) for 30 min, the membrane waswashed with PBST for 10 min and incubated further with a 1:10000dilution of Goat anti-human IgG Fc secondary antibody conjugatedwith HRP (Bethyl Laboratories Inc., USA) for 30 min at RT and thebands were later detected using DAB substrate.
2.5. Isoelectric focusing (IEF)
All samples were diluted to 1 mg/ml (WFI was used as samplediluent) and 15 mg protein samples were loaded on to IEF sampleapplicator. 1 M sodium hydroxide and 1 M ortho-phosphoric acidwere used as the cathode and anode buffer respectively. 5% (v/v) gelmixture used in this study. After the run, gels were fixed with 2%trichloroacetic acid for 30 min. Protein bands were stained withcoomassie brilliant blue R250 for visualization of the bands.
2.6. Ion exchange chromatography
Charge variants were separated on a Dionex ProPac cation ex-change (IEC) column WCX-10. 10 mM MES buffer pH 6.8 was usedasmobile phase-A and 10mMMES buffer pH 6.8with 250mMNaClwas used as mobile phase-B. The mobile phase gradient was pro-grammed for a total run-time of 21 min as follows: the initialcondition was set at 80% A and 20% B, and then the % B was raisedwith linear gradient from 20% to 42% in 17 min. Finally the % B wasbrought to 20% in 0.5 min with linear gradient; this condition wasmaintained for 3.5 min to equilibrate the column for the next in-jection. The column temperature was set at 30 �C, detection was at280 nm and 10 mg of sample was loaded on column for each sampleanalysis. Chromatograms were integrated using Lab Solution Soft-ware and relative percent peak areas were calculated [22e24].
2.7. Intact & reduced monoclonal antibody analysis by reversephase chromatography
The structural hydrophobic heterogeneity of intact and reducedmonoclonal antibody was determined by reverse phase chroma-tography (RPC) using an Agilent Zorbax C8 column (2.1 � 100 mm,1.8 mm, 300 Å) on aWaters Acquity™ UPLC H-Class instrument. Themobile phase consisted of 0.1% TFA in MilliQ Water (Mobile Phase -A) and 0.1% TFA in (80% Isopropyl alcohol: 10% Acetonitrile: 10%MilliQ Water) (Mobile Phase - B). For intact analysis, the samplewas diluted to 0.5 mg/mL and for reduced condition 0.5 mg/mL ofsample was incubated with 10 mM dithiothreitol (DTT) at 60 �C for30 min [25].
The injection volume was 5 mL and the mobile phase gradientwas programmed for a total run-time of 7 min as follows: the initialconditionwas set at 80% A and 20% B, and then the % Bwas raised in
Please cite this article in press as: Dakshinamurthy P, et al., Charge varianhttp://dx.doi.org/10.1016/j.biologicals.2016.12.006
a linear gradient fashion from 20% to 35% in 3 min, 35%e40% in1 min, 40% was maintained for 1 min and raised to 90% in 0.5 min.Finally the % B was brought to 20% in 0.5 min with linear gradient;this condition was maintained for 1 min to equilibrate the columnfor the next injection. Absorbance was monitored at 225 nm andthe data analysis was performed using Empower® software(Waters).
2.8. Size exclusion chromatography
Size variant distribution was determined by size exclusionchromatography (SEC) using a MabPac SEC-1 column (4� 300 mm,5 mm, 300 Å) at 30 �C on a Shimadzu Prominence-i HPLC system.The sample loaded on the columnwas 20 mg and eluted over 35minwith 0.2 mL/min flow rate of 0.2 M potassium phosphate, 0.25 Mpotassium chloride, pH 6.5 mobile phase monitored using a UVdetector at 214 nm. Chromatograms were integrated using LabSolution Software and relative percent peak areas calculated[26e29].
2.9. Enzymatic N-glycan release and labeling by GlycoWorksRapiFluor-MS N-Glycan Kit
The sample preparation for N-Glycan profiling was performedusing GlycoWorks RapiFluor-MSN-Glycan Kit (Waters, Milford, MA,USA) according to manufacturer's protocol [30].
2.9.1. UPLC-fluorescence HILIC N-glycan profilingThe labeled N-glycans were separated using Ultra-Performance
Liquid Chromatography (UPLC) with fluorescence detection on aWaters Acquity™ UPLC H-Class instrument consisting of a Qua-ternary solvent manager, sample manager and fluorescence de-tector under the control of Empower 3 chromatographyworkstation software (Waters, Milford, MA, USA). TheMobile phaseA was 50 mM Ammonium Formate Solution pH 4.4 and mobilephase B was Acetonitrile. The HILIC separations were performedusing Waters BEH Amide column (1.7 mm; 2.1 � 150 mm), using alinear gradient of 70e54% acetonitrile at 0.35 mL/min in 30 min.The injection volume of the sample was 20 mL and the columntemperature was maintained at 60 �C. The fluorescence wasmeasured at 265/425 nm wavelength. (Excitation/emission wave-lengths were ex ¼ 265 nm and em ¼ 425 nm respectively).
2.10. LC/MS analysis
The intact LC/MS analysis was performed using Agilent 1290Infinity LC System coupled to an Agilent 6530 Accurate-Mass Q-TOF. The LC/MS method was developed using isopropanol/water/acetonitrile with formic acid as the solvent systemwith a Poroshell300SB-C8 column. The LC-MS was operated under positive modewith scan range from 2000 to 5000 m/z. The data were analyzedusing Agilent MassHunter Bioconfirm Software.
2.11. Flow-cytometric analysis
Specific binding of the mAb samples to HER2 antigen wasinvestigated using indirect flow cytometry method [31] with slightmodifications. BT-474 cell line that expresses high levels of HER2receptors were obtained from ATCC. These cells were then main-tained in DMEM/F12 Growth medium supplemented with 1% So-dium pyruvate (Gibco) and 10% Fetal Bovine Serum (Moregate).
Cells were trypsinized with 0.25% Trypsin-EDTA. After centri-fugation at 1000 rpm for 3min, pellet was suspended in 2% BSA inDPBS buffer to achieve a desired concentration of 0.1 million cells/ml. Cells were treated with varying concentration viz., 0.05 mg/ml,
t analysis of proposed biosimilar to Trastuzumab, Biologicals (2017),
P. Dakshinamurthy et al. / Biologicals xxx (2017) 1e114
0.025 mg/ml and 0.00125 mg/ml of biotin labeled Innovator, main,Acidic and Basic fractions. Biotinylation of these antibody sampleswere carried out using EZ Sulfo-Link Biotinylation kit (ThermoScientific). Volume of the antibody samples and cells were main-tained at ratio of 1:1 and incubated at RT for 1 h. 20 ml of 0.1 mg/mlStrep-FITC was added to the reaction mixture and incubated on icebath for 30 min. All the treated samples were analyzed with BDAccuri Flow Cytometer (BD Biosciences).
2.12. SPR binding kinetics
Binding kinetics studies for different charge variants were per-formed using SPR using a Biacore 3000 instrument. Variants andmain species were analyzed for HER-2 binding kinetics and Fcgamma RIII (CD16a) binding kinetics. HER2 and CD16a ligands wereimmobilized on CM5 chip (GE Healthcare) using standard aminecoupling procedure as described by the manufacturer. Analysis wasperformed in duplicates.
2.12.1. HER2 binding kineticsHER2 ecto-domain receptor (Acro bio systems, USA) was diluted
in acetate buffer (pH 5.0) to 2 mg/mL and immobilized on CM5 chip.All anti-HER2mAbs were diluted with the running buffer (HBS EPþ1X buffer from GE Healthcare) in different concentrations from100 nM to 6.25 nM (2 fold). These individual concentrations wereinjected for 4 min (association time) and thereafter running bufferwas passed for 9 min (dissociation time). The surface was regen-erated with 30 s injection of 10 mM glycine buffer pH 2.0. Kineticswere determined using the Langmuir binding kinetics (1:1 bindingmodel).
2.12.2. CD16a binding kineticsCD16a Valine 158 receptor (Acro bio systems, USA) was used in
the study. All anti-HER2mAbs were diluted with the running buffer(HBS EPþ 1X buffer fromGE Healthcare) in different concentrationsfrom 0.83 mM to 0.05 mM. Samples were injected for 3 min (asso-ciation time) and thereafter running buffer was passed for 4 min(dissociation time). The surface was regenerated with 30 s injectionof 10 mM glycine buffer pH 2.0. Kinetics were determined using theLangmuir binding kinetics (1:1 binding model).
2.13. Cell based ELISA
In vitro cell based ELISA using BT-474 cell line was performed todetermine the HER2 binding affinity. BT-474 cells were plated at adensity of 5000 cells per well (100 mL) in 96well plate (delta treatedsurface) and allowed to adhere overnight at 37 �C and 5% CO2.Following day, cells were washed with 2 � 200 mL cold PBS toremove the non-adherent particles. Thereafter, cells were fixedwith 10% formalin and incubated for 10 min at room temperature.Blocking (200 mL of PBS þ 0.1% BSA) was carried out at roomtemperature for 1 h and washed afterwards with 2� 200 mL of coldPBS. 100 mL of sample/standard was added in each well and incu-bated for 30 min on a plate shaker. Anti-human Fc IgG1 HRP con-jugated antibody (1:5000) was used as secondary and incubated for1 h. At the end of incubation, 100 mL of TMB substrate was addedand reaction was stopped with 1 N H2SO4 before the color satura-tion reached. The plate was read at 450 nm with 620 nm as back-ground. All the samples/standards were analyzed in duplicates. PBSwas used to dilute the standard/samples and the concentrationrange was kept from 200 mg/mL to 0.000191 mg/mL. The platereadout values were determined using the four parameternonlinear regression curve fitting program (Gen 5 software) togenerate the binding curve data. Samples were measured againstthe standard for binding comparison.
Please cite this article in press as: Dakshinamurthy P, et al., Charge varianhttp://dx.doi.org/10.1016/j.biologicals.2016.12.006
2.14. Anti-proliferation assay
The effect of mAb charge variants on proliferation of BT-474, abreast cancer cell line was determined using Alamar blue basedassay as reported [32]. Alamar blue used in the assay was procuredfrom Invitrogen, USA. The BT-474 cells were diluted to a concen-tration of 0.1 million cells/ml in DMEM/F12 (1:1) (Gibco, USA) assaymedia supplemented with 2% FBS and 1% Pen-Strep solution(10000 units/ml).2000 cells/100 ml were added to each well in a 96microwell plate. 100 ml of antibody samples with concentrationranging from 2.5mg/ml- 3.9 ng/ml was added to the respectivewells. All the standard and the samples were also prepared in assaymedia. After the addition, the plates were incubated for 5 days inCO2 incubator at 37 �C to check the anti-proliferative effects of theantibody charge variant samples. After 5 days of incubation, 30 ml ofAlamar blue was added to the each well and further incubated for6e7 h in CO2 incubator at 37 �C. Fluorescence signals weremeasured at an excitation wavelength of 530e560 nm and anemission wavelength at 590 nm using Synergy HT MicroplateReader. These fluorescent signals were represented as RFU (RelativeFluorescence Unit). The data obtained from the experiment wasused to create 4-parametric inhibitory dose response curve usingGraph Pad Prism software and the IC50 values were recorded foreach of the antibody samples.
3. Results
3.1. Purification and isolation of charge variants
Purification steps and conditions involved in the isolation ofcharge variants from the harvest material shall be described in aseparate manuscript which is already in preparation. CEX (CationExchange) chromatography was employed for the separation ofcharge variants. The CEX elution was collected as fractions andsubjected to analysis using ProPac WCX-10 column. Based on theresults, the fractions were pooled to isolate the different variants.The peaks of the ion exchange profiles were typically identified asthree distinct variants. Early and late-eluting peaks were calledacidic and basic variants, respectively. The most abundant peak wasdesignated as the main peak and the CEX load has been taken asunfractionated material (Fig. 1a).
Acidic, Basic and Main peaks were resolved in a run time of21 min and the percentage of each variant along with main peak istabulated in Table 1 which depicts the charge distribution of tras-tuzumab as determined by WCX-LC method.
The relative abundance of acidic isoforms is attributed tooxidation, deamidation, and glycation process within the mAb [7]which in turn affects the distribution and clearance of the mAbwhen administrated intravenously (IV). On the other hand, thepresence of C-terminal Lysine and occurrence of amidation aremainly responsible for forming basic isoforms in the mAbs thatcould affect their clearance and tissue uptake; however, the pre-existing endogenous carboxypeptidases in the human blood-stream cleave the C-terminal Lysine from mAbs within the first 2 hof administration [6,22]; therefore, basic isoforms are not expectedto alter the PK of trastuzumab whose half-life is approximately 28days [6,33]. The role of these charge variants on the potency andbinding affinity is the primary interest of this paper.
3.2. Identification and characterization of the charge variants
Analysis of the separated fractions from the CEX column wasfirst carried out by IEF. IEF analysis revealed that the in-houseproduced trastuzumab main fraction has a comparable principalband pattern as that of Innovator, Herclon®. These principal bands
t analysis of proposed biosimilar to Trastuzumab, Biologicals (2017),
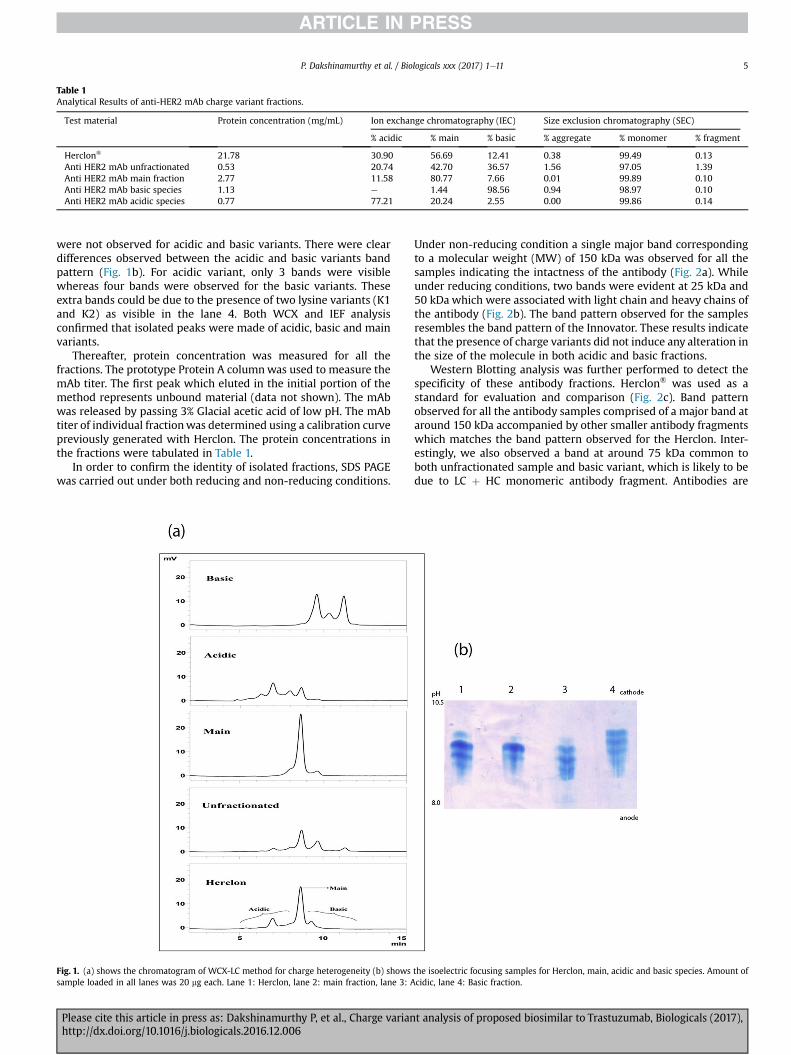
Table 1Analytical Results of anti-HER2 mAb charge variant fractions.
Test material Protein concentration (mg/mL) Ion exchange chromatography (IEC) Size exclusion chromatography (SEC)
% acidic % main % basic % aggregate % monomer % fragment
Herclon® 21.78 30.90 56.69 12.41 0.38 99.49 0.13Anti HER2 mAb unfractionated 0.53 20.74 42.70 36.57 1.56 97.05 1.39Anti HER2 mAb main fraction 2.77 11.58 80.77 7.66 0.01 99.89 0.10Anti HER2 mAb basic species 1.13 e 1.44 98.56 0.94 98.97 0.10Anti HER2 mAb acidic species 0.77 77.21 20.24 2.55 0.00 99.86 0.14
P. Dakshinamurthy et al. / Biologicals xxx (2017) 1e11 5
were not observed for acidic and basic variants. There were cleardifferences observed between the acidic and basic variants bandpattern (Fig. 1b). For acidic variant, only 3 bands were visiblewhereas four bands were observed for the basic variants. Theseextra bands could be due to the presence of two lysine variants (K1and K2) as visible in the lane 4. Both WCX and IEF analysisconfirmed that isolated peaks were made of acidic, basic and mainvariants.
Thereafter, protein concentration was measured for all thefractions. The prototype Protein A columnwas used to measure themAb titer. The first peak which eluted in the initial portion of themethod represents unbound material (data not shown). The mAbwas released by passing 3% Glacial acetic acid of low pH. The mAbtiter of individual fractionwas determined using a calibration curvepreviously generated with Herclon. The protein concentrations inthe fractions were tabulated in Table 1.
In order to confirm the identity of isolated fractions, SDS PAGEwas carried out under both reducing and non-reducing conditions.
Fig. 1. (a) shows the chromatogram of WCX-LC method for charge heterogeneity (b) showssample loaded in all lanes was 20 mg each. Lane 1: Herclon, lane 2: main fraction, lane 3: A
Please cite this article in press as: Dakshinamurthy P, et al., Charge varianhttp://dx.doi.org/10.1016/j.biologicals.2016.12.006
Under non-reducing condition a single major band correspondingto a molecular weight (MW) of 150 kDa was observed for all thesamples indicating the intactness of the antibody (Fig. 2a). Whileunder reducing conditions, two bands were evident at 25 kDa and50 kDa which were associated with light chain and heavy chains ofthe antibody (Fig. 2b). The band pattern observed for the samplesresembles the band pattern of the Innovator. These results indicatethat the presence of charge variants did not induce any alteration inthe size of the molecule in both acidic and basic fractions.
Western Blotting analysis was further performed to detect thespecificity of these antibody fractions. Herclon® was used as astandard for evaluation and comparison (Fig. 2c). Band patternobserved for all the antibody samples comprised of a major band ataround 150 kDa accompanied by other smaller antibody fragmentswhich matches the band pattern observed for the Herclon. Inter-estingly, we also observed a band at around 75 kDa common toboth unfractionated sample and basic variant, which is likely to bedue to LC þ HC monomeric antibody fragment. Antibodies are
the isoelectric focusing samples for Herclon, main, acidic and basic species. Amount ofcidic, lane 4: Basic fraction.
t analysis of proposed biosimilar to Trastuzumab, Biologicals (2017),
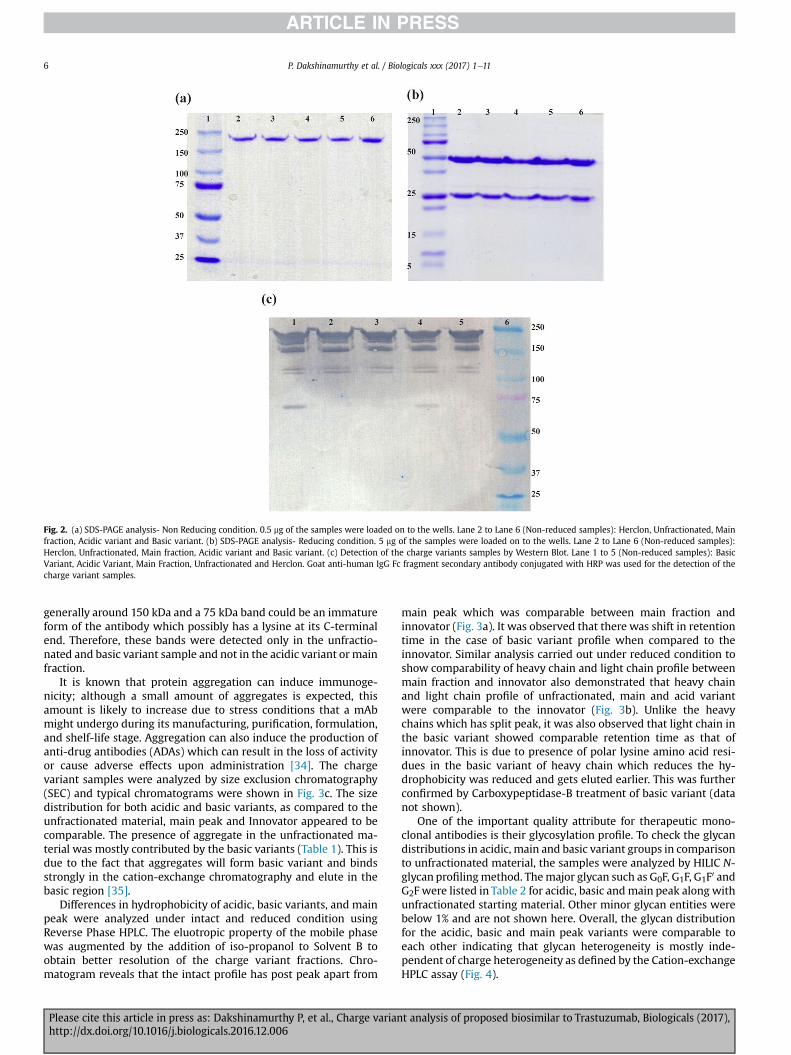
Fig. 2. (a) SDS-PAGE analysis- Non Reducing condition. 0.5 mg of the samples were loaded on to the wells. Lane 2 to Lane 6 (Non-reduced samples): Herclon, Unfractionated, Mainfraction, Acidic variant and Basic variant. (b) SDS-PAGE analysis- Reducing condition. 5 mg of the samples were loaded on to the wells. Lane 2 to Lane 6 (Non-reduced samples):Herclon, Unfractionated, Main fraction, Acidic variant and Basic variant. (c) Detection of the charge variants samples by Western Blot. Lane 1 to 5 (Non-reduced samples): BasicVariant, Acidic Variant, Main Fraction, Unfractionated and Herclon. Goat anti-human IgG Fc fragment secondary antibody conjugated with HRP was used for the detection of thecharge variant samples.
P. Dakshinamurthy et al. / Biologicals xxx (2017) 1e116
generally around 150 kDa and a 75 kDa band could be an immatureform of the antibody which possibly has a lysine at its C-terminalend. Therefore, these bands were detected only in the unfractio-nated and basic variant sample and not in the acidic variant or mainfraction.
It is known that protein aggregation can induce immunoge-nicity; although a small amount of aggregates is expected, thisamount is likely to increase due to stress conditions that a mAbmight undergo during its manufacturing, purification, formulation,and shelf-life stage. Aggregation can also induce the production ofanti-drug antibodies (ADAs) which can result in the loss of activityor cause adverse effects upon administration [34]. The chargevariant samples were analyzed by size exclusion chromatography(SEC) and typical chromatograms were shown in Fig. 3c. The sizedistribution for both acidic and basic variants, as compared to theunfractionated material, main peak and Innovator appeared to becomparable. The presence of aggregate in the unfractionated ma-terial was mostly contributed by the basic variants (Table 1). This isdue to the fact that aggregates will form basic variant and bindsstrongly in the cation-exchange chromatography and elute in thebasic region [35].
Differences in hydrophobicity of acidic, basic variants, and mainpeak were analyzed under intact and reduced condition usingReverse Phase HPLC. The eluotropic property of the mobile phasewas augmented by the addition of iso-propanol to Solvent B toobtain better resolution of the charge variant fractions. Chro-matogram reveals that the intact profile has post peak apart from
Please cite this article in press as: Dakshinamurthy P, et al., Charge varianhttp://dx.doi.org/10.1016/j.biologicals.2016.12.006
main peak which was comparable between main fraction andinnovator (Fig. 3a). It was observed that there was shift in retentiontime in the case of basic variant profile when compared to theinnovator. Similar analysis carried out under reduced condition toshow comparability of heavy chain and light chain profile betweenmain fraction and innovator also demonstrated that heavy chainand light chain profile of unfractionated, main and acid variantwere comparable to the innovator (Fig. 3b). Unlike the heavychains which has split peak, it was also observed that light chain inthe basic variant showed comparable retention time as that ofinnovator. This is due to presence of polar lysine amino acid resi-dues in the basic variant of heavy chain which reduces the hy-drophobicity was reduced and gets eluted earlier. This was furtherconfirmed by Carboxypeptidase-B treatment of basic variant (datanot shown).
One of the important quality attribute for therapeutic mono-clonal antibodies is their glycosylation profile. To check the glycandistributions in acidic, main and basic variant groups in comparisonto unfractionated material, the samples were analyzed by HILIC N-glycan profilingmethod. Themajor glycan such as G0F, G1F, G1F0 andG2F were listed in Table 2 for acidic, basic andmain peak along withunfractionated starting material. Other minor glycan entities werebelow 1% and are not shown here. Overall, the glycan distributionfor the acidic, basic and main peak variants were comparable toeach other indicating that glycan heterogeneity is mostly inde-pendent of charge heterogeneity as defined by the Cation-exchangeHPLC assay (Fig. 4).
t analysis of proposed biosimilar to Trastuzumab, Biologicals (2017),
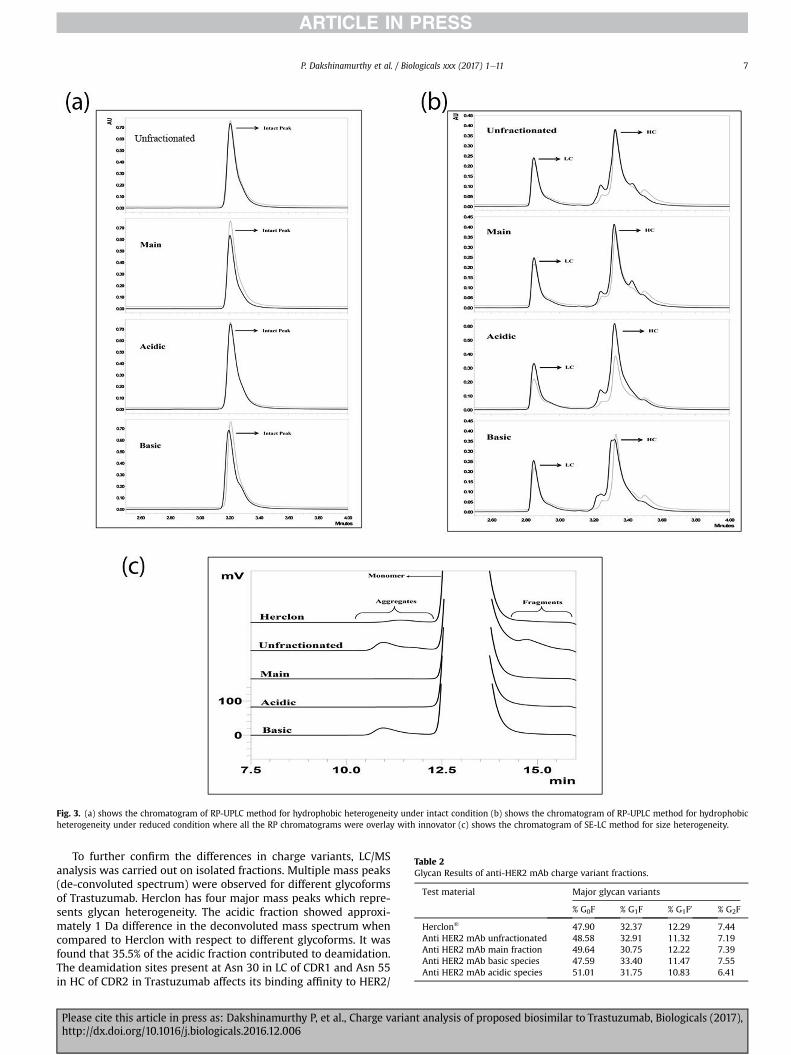
Fig. 3. (a) shows the chromatogram of RP-UPLC method for hydrophobic heterogeneity under intact condition (b) shows the chromatogram of RP-UPLC method for hydrophobicheterogeneity under reduced condition where all the RP chromatograms were overlay with innovator (c) shows the chromatogram of SE-LC method for size heterogeneity.
Table 2Glycan Results of anti-HER2 mAb charge variant fractions.
Test material Major glycan variants
% G0F % G1F % G1F0 % G2F
Herclon® 47.90 32.37 12.29 7.44Anti HER2 mAb unfractionated 48.58 32.91 11.32 7.19Anti HER2 mAb main fraction 49.64 30.75 12.22 7.39Anti HER2 mAb basic species 47.59 33.40 11.47 7.55Anti HER2 mAb acidic species 51.01 31.75 10.83 6.41
P. Dakshinamurthy et al. / Biologicals xxx (2017) 1e11 7
To further confirm the differences in charge variants, LC/MSanalysis was carried out on isolated fractions. Multiple mass peaks(de-convoluted spectrum) were observed for different glycoformsof Trastuzumab. Herclon has four major mass peaks which repre-sents glycan heterogeneity. The acidic fraction showed approxi-mately 1 Da difference in the deconvoluted mass spectrum whencompared to Herclon with respect to different glycoforms. It wasfound that 35.5% of the acidic fraction contributed to deamidation.The deamidation sites present at Asn 30 in LC of CDR1 and Asn 55in HC of CDR2 in Trastuzumab affects its binding affinity to HER2/
Please cite this article in press as: Dakshinamurthy P, et al., Charge variant analysis of proposed biosimilar to Trastuzumab, Biologicals (2017),http://dx.doi.org/10.1016/j.biologicals.2016.12.006
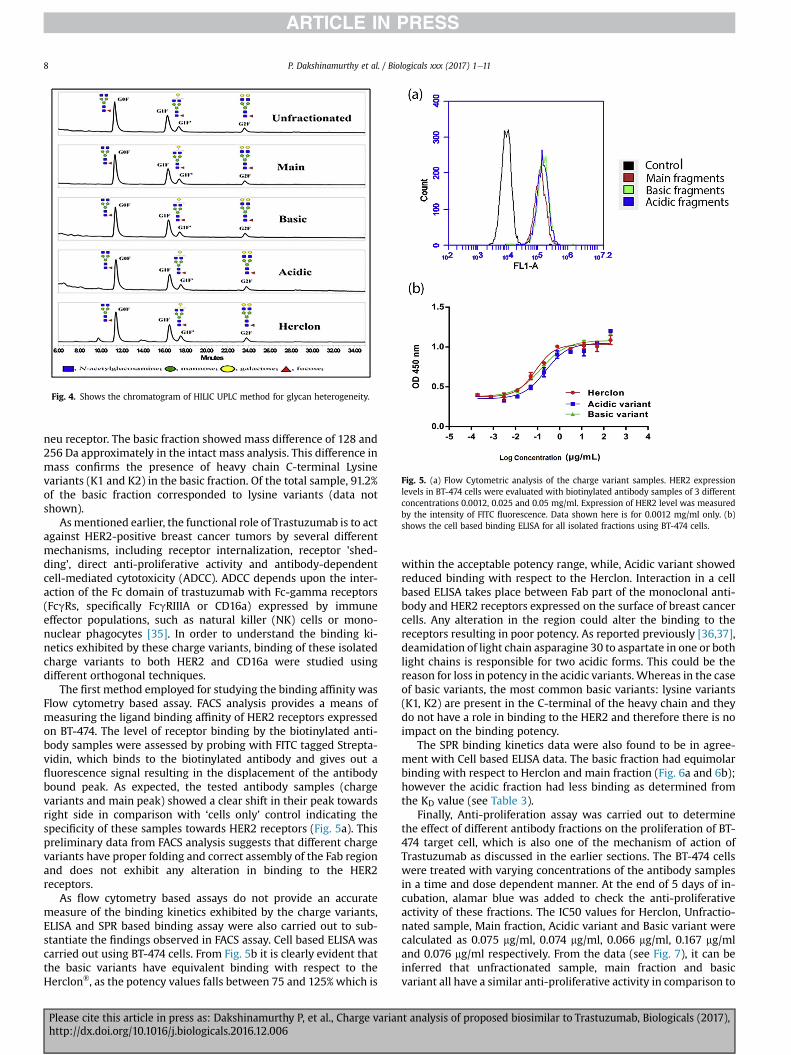
Fig. 4. Shows the chromatogram of HILIC UPLC method for glycan heterogeneity.
Fig. 5. (a) Flow Cytometric analysis of the charge variant samples. HER2 expressionlevels in BT-474 cells were evaluated with biotinylated antibody samples of 3 differentconcentrations 0.0012, 0.025 and 0.05 mg/ml. Expression of HER2 level was measuredby the intensity of FITC fluorescence. Data shown here is for 0.0012 mg/ml only. (b)shows the cell based binding ELISA for all isolated fractions using BT-474 cells.
P. Dakshinamurthy et al. / Biologicals xxx (2017) 1e118
neu receptor. The basic fraction showed mass difference of 128 and256 Da approximately in the intact mass analysis. This difference inmass confirms the presence of heavy chain C-terminal Lysinevariants (K1 and K2) in the basic fraction. Of the total sample, 91.2%of the basic fraction corresponded to lysine variants (data notshown).
Asmentioned earlier, the functional role of Trastuzumab is to actagainst HER2-positive breast cancer tumors by several differentmechanisms, including receptor internalization, receptor 'shed-ding', direct anti-proliferative activity and antibody-dependentcell-mediated cytotoxicity (ADCC). ADCC depends upon the inter-action of the Fc domain of trastuzumab with Fc-gamma receptors(FcgRs, specifically FcgRIIIA or CD16a) expressed by immuneeffector populations, such as natural killer (NK) cells or mono-nuclear phagocytes [35]. In order to understand the binding ki-netics exhibited by these charge variants, binding of these isolatedcharge variants to both HER2 and CD16a were studied usingdifferent orthogonal techniques.
The first method employed for studying the binding affinity wasFlow cytometry based assay. FACS analysis provides a means ofmeasuring the ligand binding affinity of HER2 receptors expressedon BT-474. The level of receptor binding by the biotinylated anti-body samples were assessed by probing with FITC tagged Strepta-vidin, which binds to the biotinylated antibody and gives out afluorescence signal resulting in the displacement of the antibodybound peak. As expected, the tested antibody samples (chargevariants and main peak) showed a clear shift in their peak towardsright side in comparison with ‘cells only’ control indicating thespecificity of these samples towards HER2 receptors (Fig. 5a). Thispreliminary data from FACS analysis suggests that different chargevariants have proper folding and correct assembly of the Fab regionand does not exhibit any alteration in binding to the HER2receptors.
As flow cytometry based assays do not provide an accuratemeasure of the binding kinetics exhibited by the charge variants,ELISA and SPR based binding assay were also carried out to sub-stantiate the findings observed in FACS assay. Cell based ELISA wascarried out using BT-474 cells. From Fig. 5b it is clearly evident thatthe basic variants have equivalent binding with respect to theHerclon®, as the potency values falls between 75 and 125% which is
Please cite this article in press as: Dakshinamurthy P, et al., Charge varianhttp://dx.doi.org/10.1016/j.biologicals.2016.12.006
within the acceptable potency range, while, Acidic variant showedreduced binding with respect to the Herclon. Interaction in a cellbased ELISA takes place between Fab part of the monoclonal anti-body and HER2 receptors expressed on the surface of breast cancercells. Any alteration in the region could alter the binding to thereceptors resulting in poor potency. As reported previously [36,37],deamidation of light chain asparagine 30 to aspartate in one or bothlight chains is responsible for two acidic forms. This could be thereason for loss in potency in the acidic variants. Whereas in the caseof basic variants, the most common basic variants: lysine variants(K1, K2) are present in the C-terminal of the heavy chain and theydo not have a role in binding to the HER2 and therefore there is noimpact on the binding potency.
The SPR binding kinetics data were also found to be in agree-ment with Cell based ELISA data. The basic fraction had equimolarbinding with respect to Herclon and main fraction (Fig. 6a and 6b);however the acidic fraction had less binding as determined fromthe KD value (see Table 3).
Finally, Anti-proliferation assay was carried out to determinethe effect of different antibody fractions on the proliferation of BT-474 target cell, which is also one of the mechanism of action ofTrastuzumab as discussed in the earlier sections. The BT-474 cellswere treated with varying concentrations of the antibody samplesin a time and dose dependent manner. At the end of 5 days of in-cubation, alamar blue was added to check the anti-proliferativeactivity of these fractions. The IC50 values for Herclon, Unfractio-nated sample, Main fraction, Acidic variant and Basic variant werecalculated as 0.075 mg/ml, 0.074 mg/ml, 0.066 mg/ml, 0.167 mg/mland 0.076 mg/ml respectively. From the data (see Fig. 7), it can beinferred that unfractionated sample, main fraction and basicvariant all have a similar anti-proliferative activity in comparison to
t analysis of proposed biosimilar to Trastuzumab, Biologicals (2017),
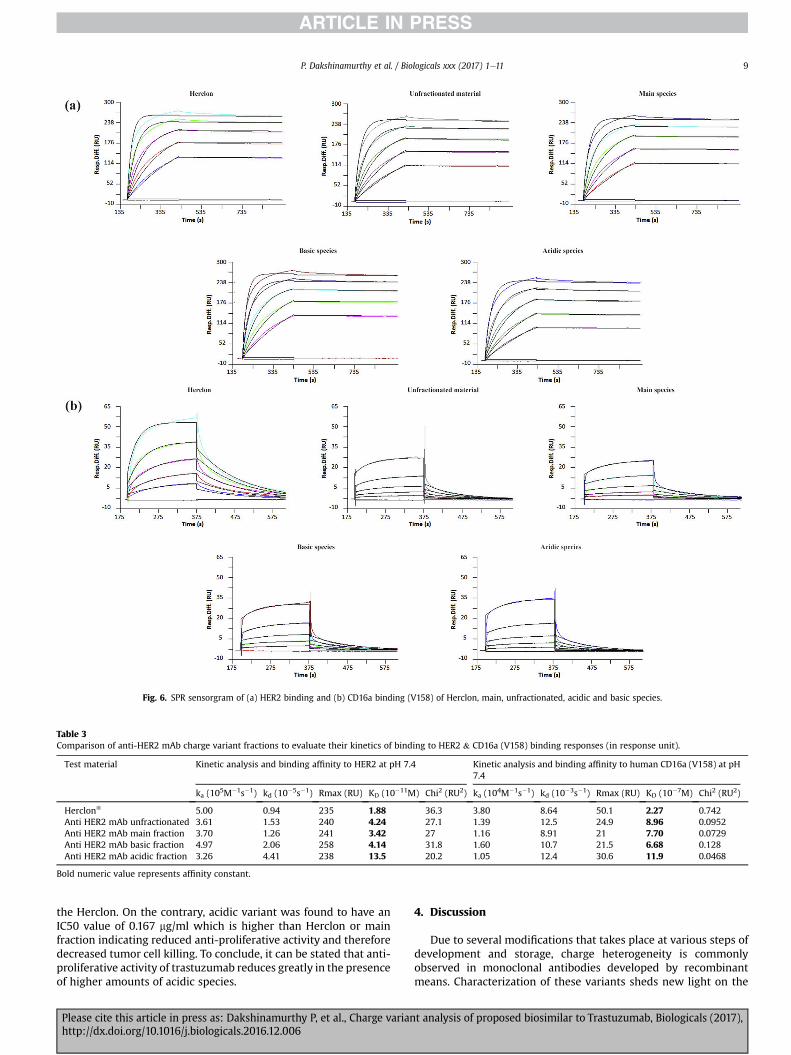
Fig. 6. SPR sensorgram of (a) HER2 binding and (b) CD16a binding (V158) of Herclon, main, unfractionated, acidic and basic species.
Table 3Comparison of anti-HER2 mAb charge variant fractions to evaluate their kinetics of binding to HER2 & CD16a (V158) binding responses (in response unit).
Test material Kinetic analysis and binding affinity to HER2 at pH 7.4 Kinetic analysis and binding affinity to human CD16a (V158) at pH7.4
ka (105M�1s�1) kd (10�5s�1) Rmax (RU) KD (10�11M) Chi2 (RU2) ka (104M�1s�1) kd (10�3s�1) Rmax (RU) KD (10�7M) Chi2 (RU2)
Herclon® 5.00 0.94 235 1.88 36.3 3.80 8.64 50.1 2.27 0.742Anti HER2 mAb unfractionated 3.61 1.53 240 4.24 27.1 1.39 12.5 24.9 8.96 0.0952Anti HER2 mAb main fraction 3.70 1.26 241 3.42 27 1.16 8.91 21 7.70 0.0729Anti HER2 mAb basic fraction 4.97 2.06 258 4.14 31.8 1.60 10.7 21.5 6.68 0.128Anti HER2 mAb acidic fraction 3.26 4.41 238 13.5 20.2 1.05 12.4 30.6 11.9 0.0468
Bold numeric value represents affinity constant.
P. Dakshinamurthy et al. / Biologicals xxx (2017) 1e11 9
the Herclon. On the contrary, acidic variant was found to have anIC50 value of 0.167 mg/ml which is higher than Herclon or mainfraction indicating reduced anti-proliferative activity and thereforedecreased tumor cell killing. To conclude, it can be stated that anti-proliferative activity of trastuzumab reduces greatly in the presenceof higher amounts of acidic species.
Please cite this article in press as: Dakshinamurthy P, et al., Charge varianhttp://dx.doi.org/10.1016/j.biologicals.2016.12.006
4. Discussion
Due to several modifications that takes place at various steps ofdevelopment and storage, charge heterogeneity is commonlyobserved in monoclonal antibodies developed by recombinantmeans. Characterization of these variants sheds new light on the
t analysis of proposed biosimilar to Trastuzumab, Biologicals (2017),
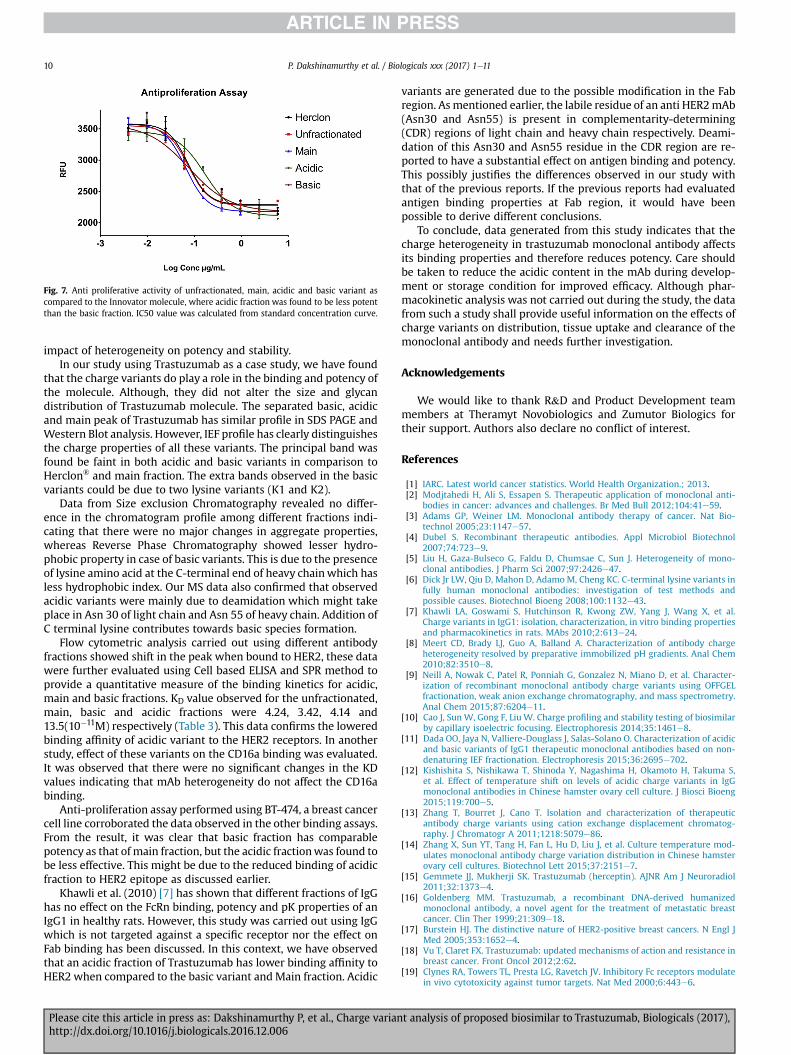
Fig. 7. Anti proliferative activity of unfractionated, main, acidic and basic variant ascompared to the Innovator molecule, where acidic fraction was found to be less potentthan the basic fraction. IC50 value was calculated from standard concentration curve.
P. Dakshinamurthy et al. / Biologicals xxx (2017) 1e1110
impact of heterogeneity on potency and stability.In our study using Trastuzumab as a case study, we have found
that the charge variants do play a role in the binding and potency ofthe molecule. Although, they did not alter the size and glycandistribution of Trastuzumab molecule. The separated basic, acidicand main peak of Trastuzumab has similar profile in SDS PAGE andWestern Blot analysis. However, IEF profile has clearly distinguishesthe charge properties of all these variants. The principal band wasfound be faint in both acidic and basic variants in comparison toHerclon® and main fraction. The extra bands observed in the basicvariants could be due to two lysine variants (K1 and K2).
Data from Size exclusion Chromatography revealed no differ-ence in the chromatogram profile among different fractions indi-cating that there were no major changes in aggregate properties,whereas Reverse Phase Chromatography showed lesser hydro-phobic property in case of basic variants. This is due to the presenceof lysine amino acid at the C-terminal end of heavy chainwhich hasless hydrophobic index. Our MS data also confirmed that observedacidic variants were mainly due to deamidation which might takeplace in Asn 30 of light chain and Asn 55 of heavy chain. Addition ofC terminal lysine contributes towards basic species formation.
Flow cytometric analysis carried out using different antibodyfractions showed shift in the peak when bound to HER2, these datawere further evaluated using Cell based ELISA and SPR method toprovide a quantitative measure of the binding kinetics for acidic,main and basic fractions. KD value observed for the unfractionated,main, basic and acidic fractions were 4.24, 3.42, 4.14 and13.5(10�11M) respectively (Table 3). This data confirms the loweredbinding affinity of acidic variant to the HER2 receptors. In anotherstudy, effect of these variants on the CD16a binding was evaluated.It was observed that there were no significant changes in the KDvalues indicating that mAb heterogeneity do not affect the CD16abinding.
Anti-proliferation assay performed using BT-474, a breast cancercell line corroborated the data observed in the other binding assays.From the result, it was clear that basic fraction has comparablepotency as that of main fraction, but the acidic fractionwas found tobe less effective. This might be due to the reduced binding of acidicfraction to HER2 epitope as discussed earlier.
Khawli et al. (2010) [7] has shown that different fractions of IgGhas no effect on the FcRn binding, potency and pK properties of anIgG1 in healthy rats. However, this study was carried out using IgGwhich is not targeted against a specific receptor nor the effect onFab binding has been discussed. In this context, we have observedthat an acidic fraction of Trastuzumab has lower binding affinity toHER2 when compared to the basic variant andMain fraction. Acidic
Please cite this article in press as: Dakshinamurthy P, et al., Charge varianhttp://dx.doi.org/10.1016/j.biologicals.2016.12.006
variants are generated due to the possible modification in the Fabregion. Asmentioned earlier, the labile residue of an anti HER2mAb(Asn30 and Asn55) is present in complementarity-determining(CDR) regions of light chain and heavy chain respectively. Deami-dation of this Asn30 and Asn55 residue in the CDR region are re-ported to have a substantial effect on antigen binding and potency.This possibly justifies the differences observed in our study withthat of the previous reports. If the previous reports had evaluatedantigen binding properties at Fab region, it would have beenpossible to derive different conclusions.
To conclude, data generated from this study indicates that thecharge heterogeneity in trastuzumab monoclonal antibody affectsits binding properties and therefore reduces potency. Care shouldbe taken to reduce the acidic content in the mAb during develop-ment or storage condition for improved efficacy. Although phar-macokinetic analysis was not carried out during the study, the datafrom such a study shall provide useful information on the effects ofcharge variants on distribution, tissue uptake and clearance of themonoclonal antibody and needs further investigation.
Acknowledgements
We would like to thank R&D and Product Development teammembers at Theramyt Novobiologics and Zumutor Biologics fortheir support. Authors also declare no conflict of interest.
References
[1] IARC. Latest world cancer statistics. World Health Organization.; 2013.[2] Modjtahedi H, Ali S, Essapen S. Therapeutic application of monoclonal anti-
bodies in cancer: advances and challenges. Br Med Bull 2012;104:41e59.[3] Adams GP, Weiner LM. Monoclonal antibody therapy of cancer. Nat Bio-
technol 2005;23:1147e57.[4] Dubel S. Recombinant therapeutic antibodies. Appl Microbiol Biotechnol
2007;74:723e9.[5] Liu H, Gaza-Bulseco G, Faldu D, Chumsae C, Sun J. Heterogeneity of mono-
clonal antibodies. J Pharm Sci 2007;97:2426e47.[6] Dick Jr LW, Qiu D, Mahon D, Adamo M, Cheng KC. C-terminal lysine variants in
fully human monoclonal antibodies: investigation of test methods andpossible causes. Biotechnol Bioeng 2008;100:1132e43.
[7] Khawli LA, Goswami S, Hutchinson R, Kwong ZW, Yang J, Wang X, et al.Charge variants in IgG1: isolation, characterization, in vitro binding propertiesand pharmacokinetics in rats. MAbs 2010;2:613e24.
[8] Meert CD, Brady LJ, Guo A, Balland A. Characterization of antibody chargeheterogeneity resolved by preparative immobilized pH gradients. Anal Chem2010;82:3510e8.
[9] Neill A, Nowak C, Patel R, Ponniah G, Gonzalez N, Miano D, et al. Character-ization of recombinant monoclonal antibody charge variants using OFFGELfractionation, weak anion exchange chromatography, and mass spectrometry.Anal Chem 2015;87:6204e11.
[10] Cao J, Sun W, Gong F, Liu W. Charge profiling and stability testing of biosimilarby capillary isoelectric focusing. Electrophoresis 2014;35:1461e8.
[11] Dada OO, Jaya N, Valliere-Douglass J, Salas-Solano O. Characterization of acidicand basic variants of IgG1 therapeutic monoclonal antibodies based on non-denaturing IEF fractionation. Electrophoresis 2015;36:2695e702.
[12] Kishishita S, Nishikawa T, Shinoda Y, Nagashima H, Okamoto H, Takuma S,et al. Effect of temperature shift on levels of acidic charge variants in IgGmonoclonal antibodies in Chinese hamster ovary cell culture. J Biosci Bioeng2015;119:700e5.
[13] Zhang T, Bourret J, Cano T. Isolation and characterization of therapeuticantibody charge variants using cation exchange displacement chromatog-raphy. J Chromatogr A 2011;1218:5079e86.
[14] Zhang X, Sun YT, Tang H, Fan L, Hu D, Liu J, et al. Culture temperature mod-ulates monoclonal antibody charge variation distribution in Chinese hamsterovary cell cultures. Biotechnol Lett 2015;37:2151e7.
[15] Gemmete JJ, Mukherji SK. Trastuzumab (herceptin). AJNR Am J Neuroradiol2011;32:1373e4.
[16] Goldenberg MM. Trastuzumab, a recombinant DNA-derived humanizedmonoclonal antibody, a novel agent for the treatment of metastatic breastcancer. Clin Ther 1999;21:309e18.
[17] Burstein HJ. The distinctive nature of HER2-positive breast cancers. N Engl JMed 2005;353:1652e4.
[18] Vu T, Claret FX. Trastuzumab: updated mechanisms of action and resistance inbreast cancer. Front Oncol 2012;2:62.
[19] Clynes RA, Towers TL, Presta LG, Ravetch JV. Inhibitory Fc receptors modulatein vivo cytotoxicity against tumor targets. Nat Med 2000;6:443e6.
t analysis of proposed biosimilar to Trastuzumab, Biologicals (2017),
P. Dakshinamurthy et al. / Biologicals xxx (2017) 1e11 11
[20] Fazekas de St Groth S, Webster RG, Datyner A. Two new staining proceduresfor quantitative estimation of proteins on electrophoretic strips. BiochimBiophys Acta 1963;71:377e91.
[21] Matsudaira P. Sequence from picomole quantities of proteins electroblottedonto polyvinylidene difluoride membranes. J Biol Chem 1987;262:10035e8.
[22] Antes B, Amon S, Rizzi A, Wiederkum S, Kainer M, Szolar O, et al. Analysis oflysine clipping of a humanized Lewis-Y specific IgG antibody and its relationto Fc-mediated effector function. J Chromatogr B Anal Technol Biomed Life Sci2007;852:250e6.
[23] Leyland-Jones B, Gelmon K, Ayoub JP, Arnold A, Verma S, Dias R, et al. Phar-macokinetics, safety, and efficacy of trastuzumab administered every threeweeks in combination with paclitaxel. J Clin Oncol 2003;21:3965e71.
[24] Rea JC, Moreno GT, Lou Y, Farnan D. Validation of a pH gradient-based ion-exchange chromatography method for high-resolution monoclonal antibodycharge variant separations. J Pharm Biomed Anal 2011;54:317e23.
[25] Le JC, Bondarenko PV. Trap for MAbs: characterization of intact monoclonalantibodies using reversed-phase HPLC on-line with ion-trap mass spectrom-etry. J Am Soc Mass Spectrom 2005;16:307e11.
[26] Cordoba AJ, Shyong BJ, Breen D, Harris RJ. Non-enzymatic hinge region frag-mentation of antibodies in solution. J Chromatogr B Anal Technol Biomed LifeSci 2005;818:115e21.
[27] Ishikawa T, Kobayashi N, Osawa C, Sawa E, Wakamatsu K. Prevention ofstirring-induced microparticle formation in monoclonal antibody solutions.Biol Pharm Bull 2010;33:1043e6.
[28] Shankar G, Pendley C, Stein KE. A risk-based bioanalytical strategy for theassessment of antibody immune responses against biological drugs. Nat Bio-technol 2007;25:555e61.
[29] Telikepalli SN, Kumru OS, Kalonia C, Esfandiary R, Joshi SB, Middaugh CR, et al.
Please cite this article in press as: Dakshinamurthy P, et al., Charge varianhttp://dx.doi.org/10.1016/j.biologicals.2016.12.006
Structural characterization of IgG1 mAb aggregates and particles generatedunder various stress conditions. J Pharm Sci 2014;103:796e809.
[30] Sanchez-De Melo I, Grassi P, Ochoa F, Bolivar J, Garcia-Cozar FJ, Duran-Ruiz MC. N-glycosylation profile analysis of Trastuzumab biosimilar candi-dates by normal phase liquid chromatography and MALDI-TOF MS ap-proaches. J Proteomics 2015;127:225e33.
[31] Milenic DE, Wong KJ, Baidoo KE, Ray GL, Garmestani K, Williams M, et al.Cetuximab: preclinical evaluation of a monoclonal antibody targeting EGFRfor radioimmunodiagnostic and radioimmunotherapeutic applications. CancerBiother Radiopharm 2008;23:619e31.
[32] Rampersad SN. Multiple applications of Alamar Blue as an indicator ofmetabolic function and cellular health in cell viability bioassays. Sensors(Basel) 2012;12:12347e60.
[33] Leveque D, Gigou L, Bergerat JP. Clinical pharmacology of trastuzumab. CurrClin Pharmacol 2008;3:51e5.
[34] Ratanji KD, Derrick JP, Dearman RJ, Kimber I. Immunogenicity of therapeuticproteins: influence of aggregation. J Immunotoxicol 2014;11:99e109.
[35] Nordstrom JL, Gorlatov S, Zhang W, Yang Y, Huang L, Burke S, et al. Anti-tumoractivity and toxicokinetics analysis of MGAH22, an anti-HER2 monoclonalantibody with enhanced Fcgamma receptor binding properties. Breast CancerRes 2011;13:R123.
[36] Du Y, Walsh A, Ehrick R, Xu W, May K, Liu H. Chromatographic analysis of theacidic and basic species of recombinant monoclonal antibodies. MAbs 2012;4:578e85.
[37] Harris RJ, Kabakoff B, Macchi FD, Shen FJ, Kwong M, Andya JD, et al. Identi-fication of multiple sources of charge heterogeneity in a recombinant anti-body. J Chromatogr B Biomed Sci Appl 2001;752:233e45.
t analysis of proposed biosimilar to Trastuzumab, Biologicals (2017),


![[Product Monograph Template - Standard]€¦ · Web view is a biosimilar biologic drug (biosimilar) to](https://static.fdocuments.us/doc/165x107/5ed9c1d0fa48703dd5136997/product-monograph-template-standard-web-view-is-a-biosimilar-biologic-drug-biosimilar.jpg)