CharacterizingUserMobilityinSecondLife -...
6
Characterizing User Mobility in Second Life * Chi-Anh La, Pietro Michiardi Eurecom 2229, Route des Cretes 06560 Sophia Antipolis, France {First.Last}@eurecom.fr ABSTRACT In this work we present a measurement study of user mobil- ity in Second Life. We first discuss different techniques to collect user traces and then focus on results obtained using a crawler that we built. Tempted by the question whether our methodology could provide similar results to those obtained in real-world experiments, we study the statistical distribu- tion of user contacts and show that user mobility in Second Life presents similar traits to those of real humans. We fur- ther push our analysis to radio networks that emerge from user interaction and show that they are highly clustered. Lastly, we focus on the spatial properties of user movements and observe that users in Second Life revolve around several points of interest traveling in general short distances. Using maximum likelihood estimation, we show that our empirical data best fit to power-law with cutoff distributions, indicating that contact time distributions in a virtual envi- ronment has very similar characteristics to those observed in real-world experiments. Categories and Subject Descriptors C2.1 [Computer-communication Networks]: Network Architecture and Design; J.4 [Computer Applications]: Social and Behavioral Science General Terms Measurement, Human Factors Keywords Contact times, Spatial Distribution, Radio networks * This work has been partially funded by the Integrated Project CASCADAS (FET Proactive Initiative, IST-2004- 2.3.4 Situated and Autonomic Communications) within the 6th IST Framework Program. Permission to make digital or hard copies of all or part of this work for personal or classroom use is granted without fee provided that copies are not made or distributed for profit or commercial advantage and that copies bear this notice and the full citation on the first page. To copy otherwise, to republish, to post on servers or to redistribute to lists, requires prior specific permission and/or a fee. WOSN’08, August 18, 2008, Seattle, Washington, USA. Copyright 2008 ACM 978-1-60558-182-8/08/08 ...$5.00. 1. INTRODUCTION Characterizing the mobility of users has been the sub- ject of several studies in a variety of domains, especially in that of wireless, mobile ad hoc networks (MANET) [5]. For example, the literature on MANET routing is rich in mobil- ity models that have been designed, analyzed and used for simulation-based performance evaluation of ad hoc routing schemes [4, 10, 13]. Some of these models have also been heavily criticized in the literature [17]. The tremendous rise in popularity of vehicular networks has also fostered a new wave of research in new mobility models adapted to the con- straints imposed by the particular application [9]. In recent years, a new class of problems rised by the delay tolerant networking (DTN) paradigm has encouraged the study of human mobility. For example, [6, 7, 11] conducted several experiments mainly in confined areas and studied an- alytical models of human mobility with the goal of assessing the performance of message forwarding in DTNs. Experi- mental approaches such as the ones discussed above, rely on users volunteering to take part in such experiments. Users are equipped with a wireless device (for example a sensor device, a mobile phone, ...) running a custom software that records temporal information about their contacts. Indi- vidual measurements are collected, combined and parsed to obtain the temporal distribution of contact times. Real-life experiments are hindered by several factors, including logis- tics, software/hardware failures, scalability and are bound to specific events (e.g. conferences, public events). In this paper we present a novel methodology to capture spatio-temporal dynamics of user mobility that overcomes most of the limitations of previous attempts: it is cheap, it requires no logistic organization, it is not bound to a specific wireless technology and can potentially scale up to a very large number of participants. Our measurement approach exploits the tremendous raise in popularity of Networked Virtual Environments (NVEs), wherein thousands of users connect daily to interact, play, do business and follow uni- versity courses just to name a few potential applications. Here we focus on the SecondLife (SL) “metaverse” [3] which has recently gained momentum in the on-line community. Our primary goal is to perform a temporal, spatial and topological analysis of user interaction in SL. Prior works that attempted the difficult task of measuring and collecting traces of human mobility and contact opportunities are re- stricted by logistic constraints (number of participants to the experiments, duration of the experiments, failures of hard- ware devices, wireless technology used). In general, position information of mobile users is not available, thus a spatial 79
Transcript of CharacterizingUserMobilityinSecondLife -...
Characterizing User Mobility in Second Life∗
Chi-Anh La, Pietro MichiardiEurecom
2229, Route des Cretes06560 Sophia Antipolis, France{First.Last}@eurecom.fr
ABSTRACT
In this work we present a measurement study of user mobil-ity in Second Life. We first discuss different techniques tocollect user traces and then focus on results obtained using acrawler that we built. Tempted by the question whether ourmethodology could provide similar results to those obtainedin real-world experiments, we study the statistical distribu-tion of user contacts and show that user mobility in SecondLife presents similar traits to those of real humans. We fur-ther push our analysis to radio networks that emerge fromuser interaction and show that they are highly clustered.Lastly, we focus on the spatial properties of user movementsand observe that users in Second Life revolve around severalpoints of interest traveling in general short distances.
Using maximum likelihood estimation, we show that ourempirical data best fit to power-law with cutoff distributions,indicating that contact time distributions in a virtual envi-ronment has very similar characteristics to those observedin real-world experiments.
Categories and Subject Descriptors
C2.1 [Computer-communication Networks]: NetworkArchitecture and Design; J.4 [Computer Applications]:Social and Behavioral Science
General Terms
Measurement, Human Factors
Keywords
Contact times, Spatial Distribution, Radio networks
∗This work has been partially funded by the IntegratedProject CASCADAS (FET Proactive Initiative, IST-2004-2.3.4 Situated and Autonomic Communications) within the6th IST Framework Program.
Permission to make digital or hard copies of all or part of this work forpersonal or classroom use is granted without fee provided that copies arenot made or distributed for profit or commercial advantage and that copiesbear this notice and the full citation on the first page. To copy otherwise, torepublish, to post on servers or to redistribute to lists, requires prior specificpermission and/or a fee.WOSN’08, August 18, 2008, Seattle, Washington, USA.Copyright 2008 ACM 978-1-60558-182-8/08/08 ...$5.00.
1. INTRODUCTIONCharacterizing the mobility of users has been the sub-
ject of several studies in a variety of domains, especially inthat of wireless, mobile ad hoc networks (MANET) [5]. Forexample, the literature on MANET routing is rich in mobil-ity models that have been designed, analyzed and used forsimulation-based performance evaluation of ad hoc routingschemes [4, 10, 13]. Some of these models have also beenheavily criticized in the literature [17]. The tremendous risein popularity of vehicular networks has also fostered a newwave of research in new mobility models adapted to the con-straints imposed by the particular application [9].
In recent years, a new class of problems rised by the delaytolerant networking (DTN) paradigm has encouraged thestudy of human mobility. For example, [6, 7, 11] conductedseveral experiments mainly in confined areas and studied an-alytical models of human mobility with the goal of assessingthe performance of message forwarding in DTNs. Experi-mental approaches such as the ones discussed above, rely onusers volunteering to take part in such experiments. Usersare equipped with a wireless device (for example a sensordevice, a mobile phone, ...) running a custom software thatrecords temporal information about their contacts. Indi-vidual measurements are collected, combined and parsed toobtain the temporal distribution of contact times. Real-lifeexperiments are hindered by several factors, including logis-tics, software/hardware failures, scalability and are boundto specific events (e.g. conferences, public events).
In this paper we present a novel methodology to capturespatio-temporal dynamics of user mobility that overcomesmost of the limitations of previous attempts: it is cheap, itrequires no logistic organization, it is not bound to a specificwireless technology and can potentially scale up to a verylarge number of participants. Our measurement approachexploits the tremendous raise in popularity of NetworkedVirtual Environments (NVEs), wherein thousands of usersconnect daily to interact, play, do business and follow uni-versity courses just to name a few potential applications.Here we focus on the SecondLife (SL) “metaverse” [3] whichhas recently gained momentum in the on-line community.
Our primary goal is to perform a temporal, spatial andtopological analysis of user interaction in SL. Prior worksthat attempted the difficult task of measuring and collectingtraces of human mobility and contact opportunities are re-stricted by logistic constraints (number of participants to theexperiments, duration of the experiments, failures of hard-ware devices, wireless technology used). In general, positioninformation of mobile users is not available, thus a spatial
79
analysis is difficult to achieve [7]. Some experiments withGPS-enabled devices have been done in the past [12, 14],but these experiments are limited to outdoor environments.
In this paper we discuss two monitoring architectures thatwe tested and focus on the most robust technique, which isbased on a custom software module (termed a crawler). Ourcrawler connects to SL and extracts position information ofall users concurrently connected to a sub-space of the meta-verse: all results presented in this paper have been obtainedwith this architecture.
One striking evidence of our results is that they approx-imately fit real life data, raising the legitimate questionwhether measurements taken in a virtual environment presentsimilar traits to those taken in a real setting. Our method-ology allows performing large experiments at a very low costand generate data that can be used in a variety of applica-tions. Although our plan is to use them to perform trace-driven simulations of communication schemes in delay toler-ant networks and their performance evaluation, our datasetcan be used for social science and epidemiology studies notto mention their value for the design and evaluation of vir-tual world architectures.
This paper is organized as follows: in Section 2 we presentthe monitoring architectures that we tested and focus inparticular on the one we used to obtain our results. Section 3illustrates the methodology we used for our experiments andSection 4 presents our results. We conclude in Section 5.
2. MONITORING ARCHITECTURESMining data in a NVE can be approached from different
angles. The first architecture we discuss exploits SL and itsfeatures to create objects capable of sensing user activitiesin the metaverse. However, there are several limitations in-trinsic to this approach that hinder our ultimate goal, whichis to collect a large data set of user mobility patterns. Theselimitations mostly come from inner design choices made bythe developers of SL to protect from external attackers aim-ing at disrupting the system operation. An example of suchattacks consists in indefinitely cloning of a simple object(such as a sphere). Due to the centralized nature of theSL architecture, which allocates a single physical machineto handle a land, its objects and its users, the simple pro-cedure outlined above constitutes a very effective denial ofservice attack. In the following, we describe (when relevant)the countermeasures adopted by SL and their implicationson our monitoring architectures. Most of the limitations wediscuss in the following can be circumvented by building acrawler that connects to SL as a normal user.
The task of monitoring user activity in the whole SLmetaverse is very complex: in this work we focus on mea-surements made on a selected subspace of SL, that we calleda land (or island). In the following we use the terminologytarget land to indicate the land we wish to monitor. Landsin SL can be private, public or conceived as sandboxes anddifferent restrictions apply: for example private lands forbidthe creation and the deployment of objects without priorauthorization.
We now detail the monitoring architectures we investi-gated in our work.
A sensor network architecture1: Our first approach hasbeen inspired by current research in the area of wireless sen-
1This approach has been used also in [15].
sor networks: it resembles what one would do in the realworld to measure physical data (temperature, movements,etc.) by deploying sensor devices in the area to be moni-tored. We built virtual sensors using the standard objectcreation tool accessible from a SL client software. Our sen-sors collect data and communicate with an external webserver that stores the location information of users connectedto the target land. The functionality of a sensor is definedusing a proprietary scripting language [2].
A key limitation imposed by the infrastructure of SL isthat sensors cannot be arbitrarily deployed on any land.While it is impossible to deploy objects on private landswithout authorization, objects on public lands expire aftera predicted lifetime, which is land dependent. To deal withthe restricted object lifetime, our system replicates all sen-sors in the same position at regular time intervals.
When a sensor is deployed on the target land, it detectsusers (a maximum of 16 users can be detected at the sametime) that are within the sensing range (96 meters) with atunable periodicity and stores this information in its localcache (16KB is the maximum storage space). Due to its lim-ited memory, a sensor initiates a connection with our webserver and flushes its memory using the HTTP protocol assoon as the maximal capacity has been reached. The techni-cal specification of a sensor imposes several challenges thathinder the task of covering an entire land. Moreover, thenumber of HTTP messages that can be exchanged betweensensors and the web server is restricted by the SL infrastruc-ture: this limits the quantity of data that can be retrievedfrom our sensors, hence a tradeoff exists between the gran-ularity of the sensed data and the duration of a monitoringexperiment.
Monitoring using an external crawler: An alternativeapproach is to build a custom SL client software (termeda crawler) using libsecondlife [1]. The crawler is ableto monitor the position of every user using a specific fea-ture of libsecondlife that enables the creation of simplemaps of the target land. Measurement data is stored in adatabase that can be queried through an interactive web ap-plication2. The crawler connects to the SL metaverse as anormal user, thus it is not confined by limitations imposedby private lands: any accessible land can be monitored in itstotality; the maximum number of users that can be trackedis bounded only by the SL architecture (as of today, roughlyconcurrent 100 users per land); communication between thecrawler and the database is not limited by SL.
During our experiments, we noted that introducing mea-surement probes in a NVE can cause unexpected effects thatperturb the normal behavior of users and hence the mea-sured user mobility patterns. Since our crawler is nothingbut a stripped-down version of the legacy SL client and re-quires a valid login/password to connect to the metaverse, itis perceived in the SL space as an avatar, and as such may at-tract the attention of other users that try to interact with it:our initial experiments showed a steady convergence of usermovements towards our crawler. To mitigate this perturb-ing effect we designed a crawler that mimics the behavior ofa normal user: our crawler randomly moves over the targetland and broadcasts chat messages chosen from a small setof pre-defined phrases.
2Access to the application can be requested via mail to theauthors.
80
3. MEASUREMENT METHODOLOGYUsing the physical coordinates of users connected to a tar-
get land, we create snapshots of radio networks: given anarbitrary communication range r, a communication link ex-ists two users vi, vj if their distance is less than r. In thefollowing we use a temporal sequence of networks extractedfrom the traces we collected using our crawler and analyzecontact opportunities between users, their spatial distribu-tion and graph-theoretic properties of their communicationnetwork.
A precondition for being able to gather useful data is toselect an appropriate target land and measurement param-eters. Choosing an appropriate target land in the SL meta-verse is not an easy task because a large number of lands hostvery few users and lands with a large population are usuallybuilt to distribute virtual money: all a user has to do is to sitand wait for a long enough time to earn money (for free). Inthis work, we manually selected and analyzed the followinglands: Apfel Land, a german-speaking arena for newbies;Dance Island, a virtual discotheque; Isle of View, a landin which an event (St. Valentines) was organized. Theselands have been chosen as they are representative of out-door(Apfel Land) and in-door (Dance Island) environments; thethird land represents an example of SL events which sup-posedly attract many users. In this paper we present resultsfor 24 hours traces: while the analysis of longer traces yieldsanalogous results to those presented here, long experimentsare sometimes affected by instabilities of libsecondlife un-der a Linux environment and we decided to focus on a set ofshorter but stable measurements. A summary of the traceswe analyzed can be defined based on the total number ofunique users and the average number of concurrently loggedin users: Isle of View had 2656 unique visitors with an av-erage of 65 concurrent users, Dance Island had 3347 uniqueusers and 34 concurrent users in average and Apfel Landhad 1568 users and 13 concurrent users in average.
We launched the crawler on the selected target lands andset the time granularity (intervals at which we take a snap-shot of the users’ positions) to τ = 10 sec. We selected acommunication range r to simulate users equipped with abluetooth and a WiFi (802.11a at 54 Mbps) device, respec-tively rb = 10 meters and rw = 80 meters. In this work weassume an ideal wireless channel : radio networks extractedfrom our traces neglect the presence of obstacles such asbuildings and trees.
User location in SL is expressed by coordinates {x, y, z}which are relative to the target land whose size is by default256 × 256 meters. However there is one exception: whena user sits on an object (e.g. a bench) her coordinates are{x = 0, y = 0, z = 0}. In the target lands we selected userswho did not sit.
3.1 Temporal analysisThe metrics we use to analyze mobility patterns are in-
spired by the work of Chaintreau et. al. [6] and allow theanalysis of the statistical distribution of contact opportuni-ties between users:
• Contact time (CT ): is defined as the time interval inwhich two users (vi, vj) are in direct communicationrange, given r;
• Inter-contact time (ICT ): is defined as the time in-terval which elapses between two contact periods of a
pair of users. Let
[t1(vi,vj)s, t1(vi,vj)e], [t
2(vi,vjj)s, t
2(vi,vj)e], ...[t
n(vi ,vj)s, t
n(vi,vj )e]
be the successive time intervals at which a contact be-tween user vi and vj occurs; then, the inter-contacttime between the k − th and the (k + 1) − th contactintervals is:
ICTk(vi,vj) = t
k+1(vi,vj)s − t
k(vi,vj)e
• First contact time (FT ): is defined as the waitingtime for a user vi to contact her first neighbor (ever).
3.2 Spatial analysisWe present here the metrics we used to perform the spatial
analysis of our traces:
• Node degree: is defined as the number of neighbors ofa user when the communication range is fixed to r;
• Network diameter: is computed as the longest short-est path of the largest connected component of thecommunication network formed by the users. We usedthe largest component since, for a given r, the networkwas sometimes disconnected;
• Clustering coefficient: is defined as in [16]: we com-pute it for every user and take the mean value to berepresentative of the whole communication network;
• Travel length: for every user vi we compute the dis-tance covered from its login to its logout coordinatesin SL;
• Effective Travel time: for every user vi we computethe total time spent while moving; hence, this metricdoes not include pause times;
• Travel time: for every user vi we compute the totalconnection time to the SL land we monitor with thecrawler;
• Zone occupation: we divided lands in several squaresub-cells of size L × L and computed the number ofusers in every sub-cell, with L = 20 meters.
4. RESULTSWe now discuss the results of our measurements for the
three selected target lands and study the influence of thecommunication range (rb or rw).
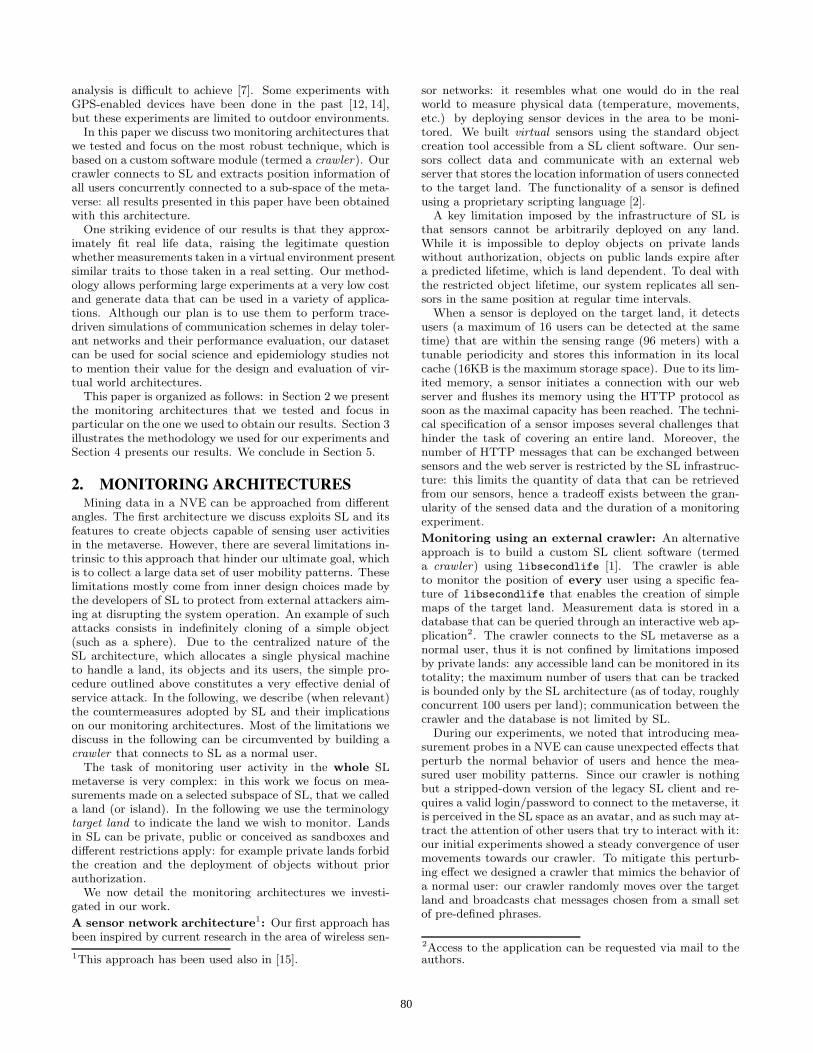
Temporal Analysis: Fig. 1 illustrates the distribution ofthe temporal metrics we used in this work for rb = 10 metersand rw = 80 meters.
A glance at the complementary CDF (CCDF) of the con-tact time CT , showed in Fig. 1a-1d, indicates that the me-dian contact time is roughly 30, 60 and 100 seconds respec-tively for Apfel Land, Isle of View and Dance Island whenr = rb, and about 70, 200 and 300 seconds for the same setof islands when r = rw. Fig. 1a-1d also indicate that trans-fer opportunities are proportional to r: larger transmissionranges imply larger transfer opportunities.
The CCDF of the inter contact time ICT is shown inFig. 1b-1e: the median ICT is around 400 seconds for thetwo open-space lands and between 700 and 800 seconds for
81
101
102
103
104
105
0.1
0.51
Time (s)
1−
F(x
)Contact Time CCDF, r=10m
ApfellandDanceIsle Of View
(a)
101
102
103
104
105
0.1
0.51
Time (s)
1−
F(x
)
Inter−Contact Time CCDF, r=10m
ApfellandDanceIsle Of View
(b)
101
102
103
104
0.1
0.51
Time (s)
1−
F(x
)
First Contact Time CCDF, r=10m
ApfellandDanceIsle Of View
(c)
101
102
103
104
105
0.1
0.51
Time (s)
1−
F(x
)
Contact Time CCDF, r=80m
ApfellandDanceIsle Of View
(d)
101
102
103
104
105
0.1
0.51
Time (s)
1−
F(x
)
Inter−Contact Time CCDF, r=80m
ApfellandDanceIsle Of View
(e)
101
102
103
104
0.1
0.51
Time (s)
1−
F(x
)
First Contact Time CCDF, r=80m
ApfellandDanceIsle Of View
(f)
Figure 1: Temporal Analysis: Complementary CDF of contact opportunity metrics for three target lands.
the Dance Island. Analyzing the same trace of user move-ment yields surprisingly similar results with different com-munication ranges. We believe this result is due to the factthat users are concentrated around points of interest (as dis-cussed below), but it would be interesting to compare suchfindings with real-world experiments.
Although the distribution of contact opportunities ap-pears to be similar for the two open-space lands, the CCDFof the first contact time FT , depicted in Fig. 1c-1f, illus-trates some differences between these lands: in Apfel Landusers have to wait for a long time before meeting their firstneighbor. The median FT is around 300 seconds for ApfelLand, while it is less than 20 seconds for the other two landswhen r = rb. The FT improves a lot when increasing r: themedian is around 30 seconds for Apfel Land and less than 5seconds for the other lands.
In this work, we used Maximum likelihood estimation(MLE) [8] for fitting our traces to some well-known math-ematical models of contact-time distributions. The threebaseline models we used are summarized in Table 1.
Table 1: Definition of the power-law distribution
and other reference statistical distributions we used
for the MLE. For each distribution we give the basic
functional form f(x) and the appropriate normaliza-
tion constant C.
name f(x) C
power-law x−α (α − 1)xα−1min
power-law with cutoff x−αe−λx λα−1
Γ(1−α,λxmin)
exponential e−λx λeλxmin
We applied MLE to analyze the distribution of contacttimes. The CCDF of the contact time CT depicted in Fig. 1a-
d can be best fit to an exponential distribution: when r = rb
we have that λ = {0.010, 0.003, 0.008} and when r = rw wehave that λ = {0.007, 0.002, 0.004} respectively for Apfel-Land, Dance Island and Isle Of View.
MLE applied to our empirical data on inter contact timesindicates that the best fit is the the power-law with cutoffdistribution. We observe in Fig. 1b-e that the CCDF of theinter contact time ICT has two phases: a first power-lawphase and an exponential cut-off phase. The values of thecoefficients of these distributions are: α = {0.34, 0.47, 0.42}and λ = {0.00049, 0.00041, 0.00046} respectively for Apfel-Land, Dance Island and Isle Of View, when r = rb andα = {0.46, 0.44, 0.59}, λ = {0.00045, 0.00037, 0.00041} whenr = rw. Note that in order to improve the clarity of the Fig-ures, in Fig. 1a-b-d-e we do not show the slope correspond-ing to fitting distributions with the coefficients we computedusing MLE.
These results are quite surprising: we obtained a statisti-cal distribution of contact opportunities that mimics whathas been obtained for experiments in the real world [7,12,14].It should be noted, however, that human activity roughlyspans the 12 hours interval, while even the most assiduoususer which we were able to track in our traces spent lessthan 4 consecutive hours on SL.
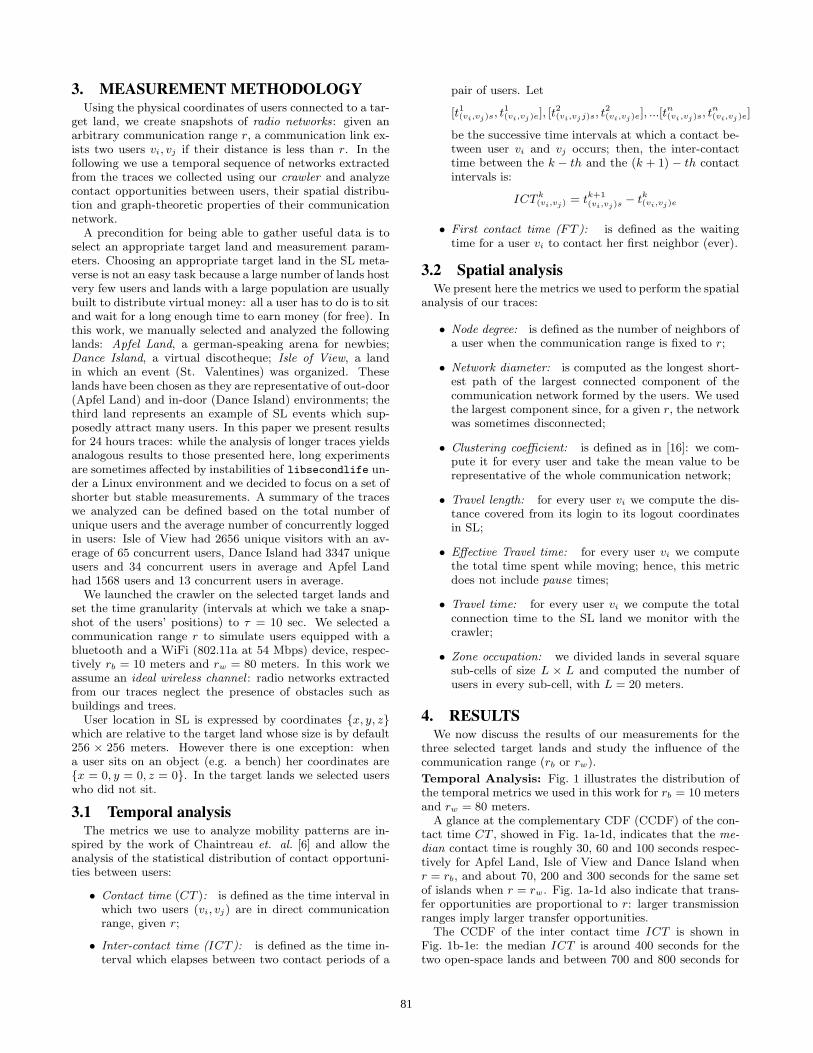
Radio networks: We now delve into a detailed analysisof the communication networks that emerge from user inter-action when we assume them to be equipped with a wirelesscommunication device covering a range r ∈ {rb, rw}. Fig. 2illustrates the aggregated (over the whole measurement pe-riod) CCDF of the node degree, the aggregated CDF of thenetwork diameter and clustering coefficient.
The node degree CCDF illustrates a diverse user behaviorin each target land: for Apfel Land we observe that 60%of users have no neighbors, for the Dance Island only 10%of users have no neighbors while in the Isle of View, all
82
0 10 20 30 40 500
0.1
0.2
0.4
0.5
0.6
0.8
0.9
1
Degree
1−
F(x
)
Node Degree CCDF, r=10m
ApfellandDanceIsle Of View
(a)
0 5 10 150
0.1
0.2
0.4
0.5
0.6
0.8
0.9
1
Diameter
F(x
)
Network Diameter CDF, r=10m
Apfelland
Dance
Isle Of View
(b)
0 0.2 0.4 0.6 0.8 10
0.1
0.2
0.4
0.5
0.6
0.8
0.9
1
Coefficient
F(x
)
Clustering Coefficient CDF, r=10m
Apfelland
Dance
Isle Of View
(c)
0 20 40 60 800
0.1
0.2
0.4
0.5
0.6
0.8
0.9
1
Degree
1−
F(x
)
Node Degree CCDF, r=80m
ApfellandDanceIsle Of View
(d)
0 1 2 3 4 50
0.1
0.2
0.4
0.5
0.6
0.8
0.9
1
DiameterF
(x)
Network Diameter CDF, r=80m
ApfellandDanceIsle Of View
(e)
0 0.2 0.4 0.6 0.8 10
0.1
0.2
0.4
0.5
0.6
0.8
0.9
1
Coefficient
F(x
)
Clustering Coefficient CDF, r=80m
ApfellandDanceIsle Of View
(f)
Figure 2: Radio networks: graph theoretic properties for three selected target lands.
0 5 10 15 20 250.8
0.85
0.9
0.95
1
Number of users per cell
F(x
)
Zone Occupation CDF, L=20m
ApfellandDanceIsle Of View
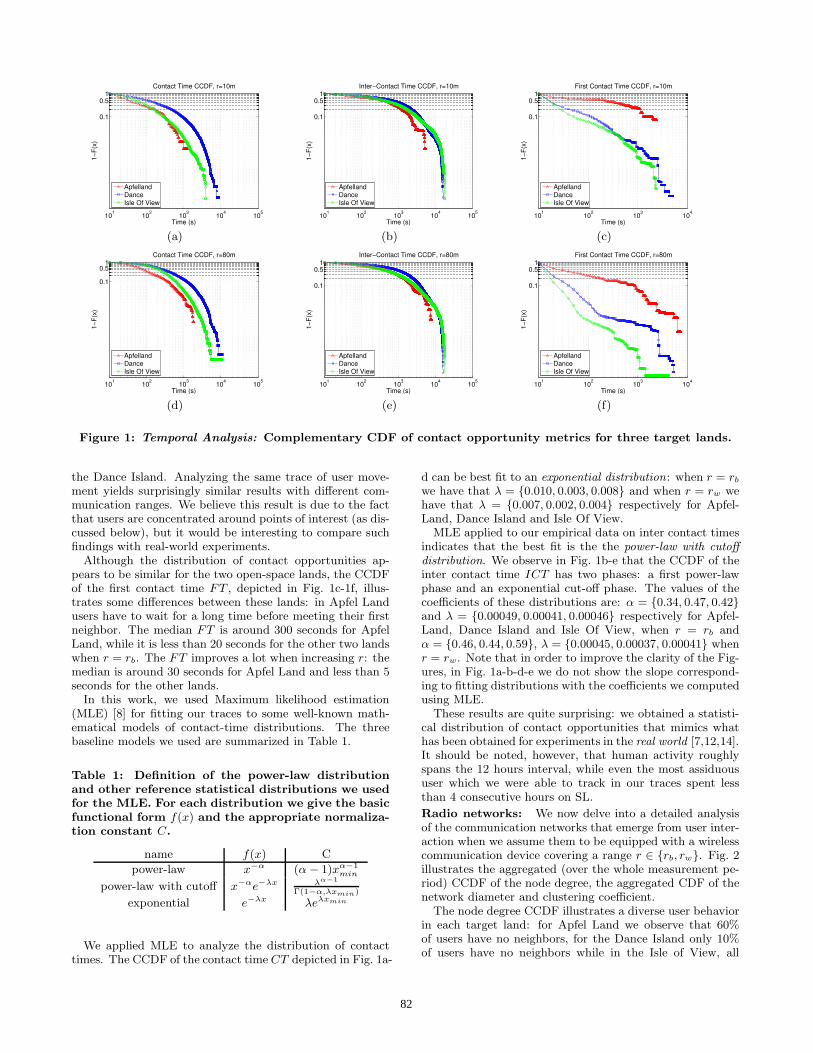
Figure 3: Spatial distribution of users.
users have at least one neighbor when r = rb. When thecommunication range is set to r = rw all users have at leastone neighbor in all lands. The maximum degree and thewhole distribution varies a lot between target lands: themain reason lies in the physical distribution of users on aland. In Apfel Land users are relatively sparse while in theDance Island, for example, most of the users spend mostof the time in a tiny portion of the land: this observationis corroborated3 by our study on the spatial distributionof users as shown in Fig. 3. Although the general trendfor all target lands we inspected is that a large fraction ofthe land has no users, some lands (e.g. Dance Island) arecharacterized by hot-spots with several tens of users.
The CDF of the network diameter illustrates the impactof different transmission ranges: it is clear that the diam-eter shrinks for r = rw. We note, however, that for ApfelLand there is an apparent contradiction: for r = rb themaximum diameter is smaller than for r = rw. This phe-nomenon is due to the fact we compute the diameter of thelargest connected component of the temporal graph formed
3There is an intuitive reason for this phenomenon: in a dis-cotheque users spend most of their time on the dance flooror by the bar, while in an open space users are generallylocated more sparsely.
by users: when the radio range is small (and users are scat-tered through the target land) we observe the emergence ofrelatively small connected components, whereas for largerranges the connected component is large (eventually it in-cludes all users), hence a larger diameter.
In Fig. 2 we also plot the CDF of the clustering coefficientfor the whole measurement period. Our results clearly pointto high median values of the clustering coefficient which in-dicate that the networks we observe are not Erdos-Renyirandom graphs4: these networks are highly clustered but,due to the small number of concurrent users that can login to a land and the results on the network diameter, wecannot claim at this time that the graphs that emerge fromuser interaction have small world characteristics.
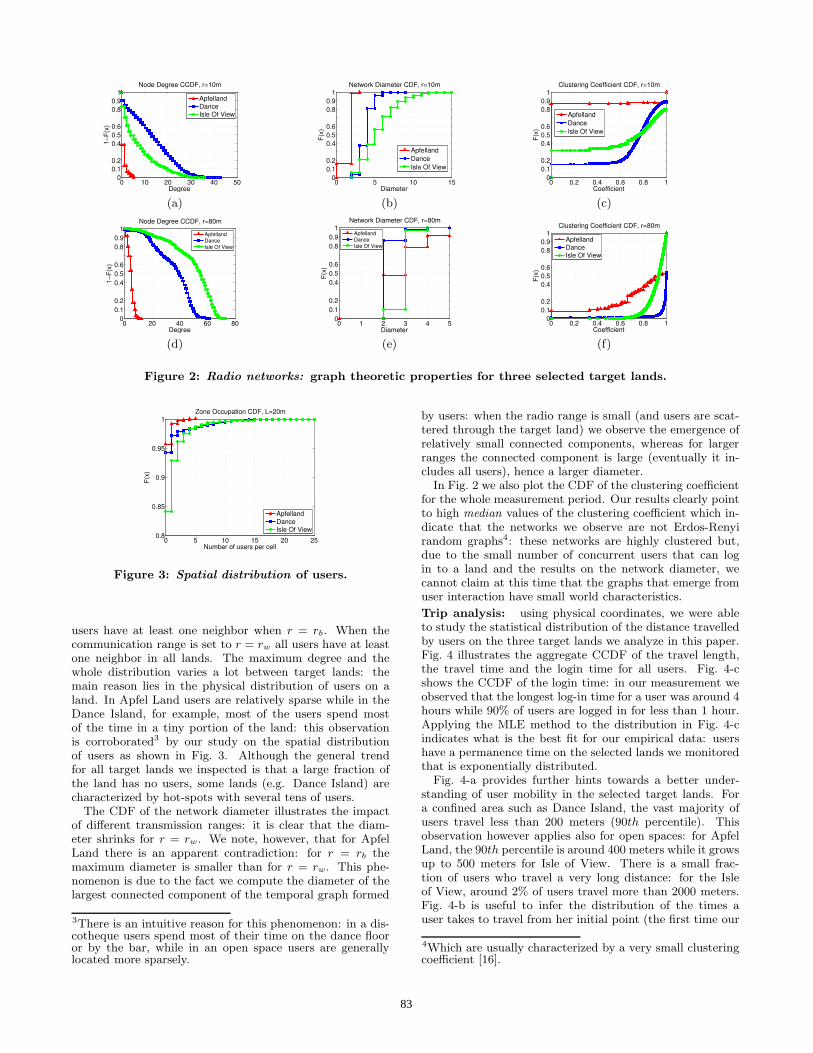
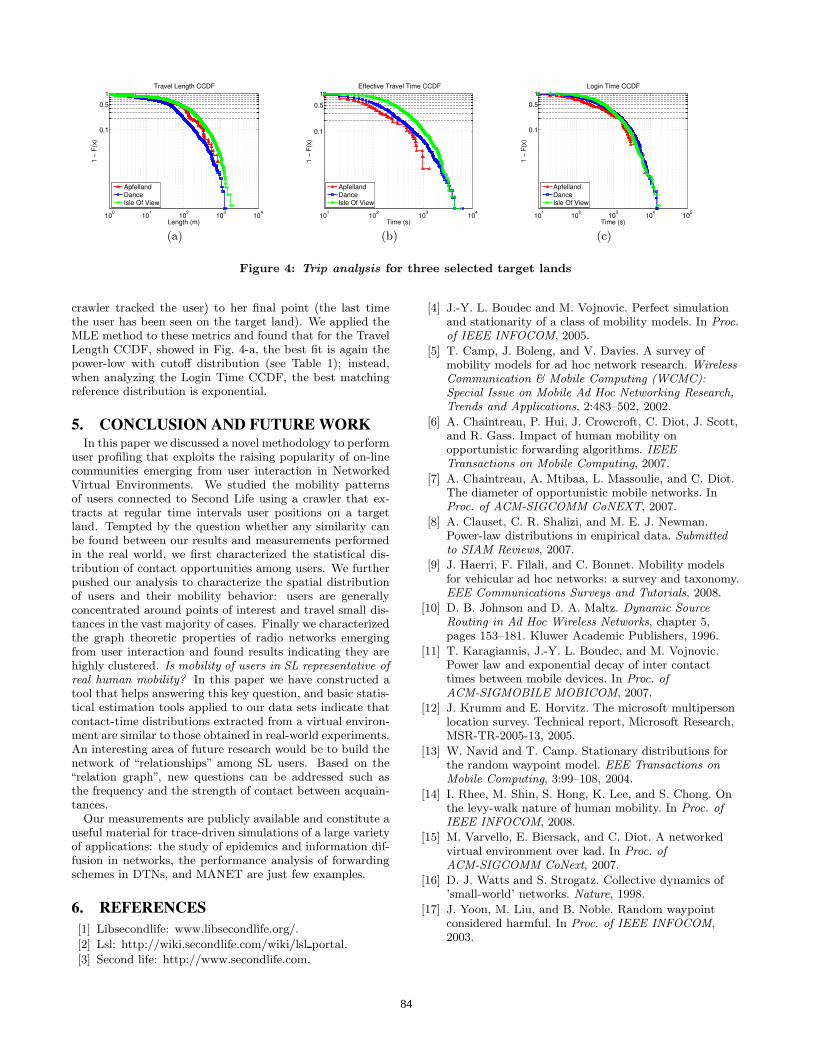
Trip analysis: using physical coordinates, we were ableto study the statistical distribution of the distance travelledby users on the three target lands we analyze in this paper.Fig. 4 illustrates the aggregate CCDF of the travel length,the travel time and the login time for all users. Fig. 4-cshows the CCDF of the login time: in our measurement weobserved that the longest log-in time for a user was around 4hours while 90% of users are logged in for less than 1 hour.Applying the MLE method to the distribution in Fig. 4-cindicates what is the best fit for our empirical data: usershave a permanence time on the selected lands we monitoredthat is exponentially distributed.
Fig. 4-a provides further hints towards a better under-standing of user mobility in the selected target lands. Fora confined area such as Dance Island, the vast majority ofusers travel less than 200 meters (90th percentile). Thisobservation however applies also for open spaces: for ApfelLand, the 90th percentile is around 400 meters while it growsup to 500 meters for Isle of View. There is a small frac-tion of users who travel a very long distance: for the Isleof View, around 2% of users travel more than 2000 meters.Fig. 4-b is useful to infer the distribution of the times auser takes to travel from her initial point (the first time our
4Which are usually characterized by a very small clusteringcoefficient [16].
83
100
101
102
103
104
0.1
0.5
1
Length (m)
1 −
F(x
)Travel Length CCDF
ApfellandDanceIsle Of View
(a)
101
102
103
104
0.1
0.5
1
Time (s)
1 −
F(x
)
Effective Travel Time CCDF
ApfellandDanceIsle Of View
(b)
101
102
103
104
105
0.1
0.5
1
Time (s)
1 −
F(x
)
Login Time CCDF
ApfellandDanceIsle Of View
(c)
Figure 4: Trip analysis for three selected target lands
crawler tracked the user) to her final point (the last timethe user has been seen on the target land). We applied theMLE method to these metrics and found that for the TravelLength CCDF, showed in Fig. 4-a, the best fit is again thepower-low with cutoff distribution (see Table 1); instead,when analyzing the Login Time CCDF, the best matchingreference distribution is exponential.
5. CONCLUSION AND FUTUREWORKIn this paper we discussed a novel methodology to perform
user profiling that exploits the raising popularity of on-linecommunities emerging from user interaction in NetworkedVirtual Environments. We studied the mobility patternsof users connected to Second Life using a crawler that ex-tracts at regular time intervals user positions on a targetland. Tempted by the question whether any similarity canbe found between our results and measurements performedin the real world, we first characterized the statistical dis-tribution of contact opportunities among users. We furtherpushed our analysis to characterize the spatial distributionof users and their mobility behavior: users are generallyconcentrated around points of interest and travel small dis-tances in the vast majority of cases. Finally we characterizedthe graph theoretic properties of radio networks emergingfrom user interaction and found results indicating they arehighly clustered. Is mobility of users in SL representative ofreal human mobility? In this paper we have constructed atool that helps answering this key question, and basic statis-tical estimation tools applied to our data sets indicate thatcontact-time distributions extracted from a virtual environ-ment are similar to those obtained in real-world experiments.An interesting area of future research would be to build thenetwork of “relationships” among SL users. Based on the“relation graph”, new questions can be addressed such asthe frequency and the strength of contact between acquain-tances.
Our measurements are publicly available and constitute auseful material for trace-driven simulations of a large varietyof applications: the study of epidemics and information dif-fusion in networks, the performance analysis of forwardingschemes in DTNs, and MANET are just few examples.
6. REFERENCES
[1] Libsecondlife: www.libsecondlife.org/.
[2] Lsl: http://wiki.secondlife.com/wiki/lsl portal.
[3] Second life: http://www.secondlife.com.
[4] J.-Y. L. Boudec and M. Vojnovic. Perfect simulationand stationarity of a class of mobility models. In Proc.of IEEE INFOCOM, 2005.
[5] T. Camp, J. Boleng, and V. Davies. A survey ofmobility models for ad hoc network research. WirelessCommunication & Mobile Computing (WCMC):Special Issue on Mobile Ad Hoc Networking Research,Trends and Applications, 2:483–502, 2002.
[6] A. Chaintreau, P. Hui, J. Crowcroft, C. Diot, J. Scott,and R. Gass. Impact of human mobility onopportunistic forwarding algorithms. IEEETransactions on Mobile Computing, 2007.
[7] A. Chaintreau, A. Mtibaa, L. Massoulie, and C. Diot.The diameter of opportunistic mobile networks. InProc. of ACM-SIGCOMM CoNEXT, 2007.
[8] A. Clauset, C. R. Shalizi, and M. E. J. Newman.Power-law distributions in empirical data. Submittedto SIAM Reviews, 2007.
[9] J. Haerri, F. Filali, and C. Bonnet. Mobility modelsfor vehicular ad hoc networks: a survey and taxonomy.EEE Communications Surveys and Tutorials, 2008.
[10] D. B. Johnson and D. A. Maltz. Dynamic SourceRouting in Ad Hoc Wireless Networks, chapter 5,pages 153–181. Kluwer Academic Publishers, 1996.
[11] T. Karagiannis, J.-Y. L. Boudec, and M. Vojnovic.Power law and exponential decay of inter contacttimes between mobile devices. In Proc. ofACM-SIGMOBILE MOBICOM, 2007.
[12] J. Krumm and E. Horvitz. The microsoft multipersonlocation survey. Technical report, Microsoft Research,MSR-TR-2005-13, 2005.
[13] W. Navid and T. Camp. Stationary distributions forthe random waypoint model. EEE Transactions onMobile Computing, 3:99–108, 2004.
[14] I. Rhee, M. Shin, S. Hong, K. Lee, and S. Chong. Onthe levy-walk nature of human mobility. In Proc. ofIEEE INFOCOM, 2008.
[15] M. Varvello, E. Biersack, and C. Diot. A networkedvirtual environment over kad. In Proc. ofACM-SIGCOMM CoNext, 2007.
[16] D. J. Watts and S. Strogatz. Collective dynamics of’small-world’ networks. Nature, 1998.
[17] J. Yoon, M. Liu, and B. Noble. Random waypointconsidered harmful. In Proc. of IEEE INFOCOM,2003.
84

![A Few Chirps About Twitter - SIGCOMMconferences.sigcomm.org/sigcomm/2008/workshops/wosn/...API functions provided by twitter [2]. We gathered detailed infor-mation on the users and](https://static.fdocuments.us/doc/165x107/5feb00e9a2964117516f41d8/a-few-chirps-about-twitter-api-functions-provided-by-twitter-2-we-gathered.jpg)