Characterizing the Query Behavior in Peer-to-Peer File Sharing
13
ABSTRACT This paper characterizes the query behavior of peers in a peer-to- peer (P2P) file sharing system. In contrast to previous work, which provides various aggregate workload statistics, we characterize peer behavior in a form that can be used for constructing representative synthetic workloads for evaluating new P2P system designs. In particular, the analysis exposes heterogeneous behavior that occurs on different days, in different geographical regions (i.e., Asia, Europe, and North America) or during different periods of the day. The workload measures include the fraction of connected sessions that are passive (i.e., issue no queries), the duration of such sessions, and for each active session, the number of queries issued, time until first query, query interarrival time, time after last query, and distribution of query popularity. Moreover, the key correlations in these workload measures are captured in the form of conditional distributions, such that the correlations can be accurately reproduced in a synthetic workload. The characterization is based on trace data gathered in the Gnutella P2P system over a period of 40 days. To characterize system-independent user behavior, we eliminate queries that are specific to the Gnutella system software, such as re-queries that are automatically issued by some client implementations to improve system responsiveness. Categories and Subject Descriptors C.4 [Performance of Systems]: Measurement Techniques. C.2.4 [Computer-Communication Networks]: Distributed Systems – distributed applications. General Terms Measurement, Performance. Keywords Peer-to-peer, overlay networks, workload characterization, synthetic workloads. 1. INTRODUCTION Peer-to-peer (P2P) systems constitute one of the most popular applications in the Internet. The list of applications that are built on Sun’s JXTA protocol suite for P2P communication [6] reveals that P2P technology is employed for instant messaging, web publishing, distributed data management, gaming, in addition to the traditional file sharing applications which were made popular by Napster [13] and Gnutella [8]. Although Napster is no longer in service due to legal issues, Gnutella systems are still deployed and widely used. In particular, the popular Morpheus file sharing system [21] adopted the Gnutella protocol. Gnutella, like all P2P file sharing systems, consists of two main building blocks: (1) a search algorithm for queries and (2) a file transfer protocol for downloading files matching a query. Efficient searching in P2P systems is an active area of research. Approaches include variants of Gnutella’s unstructured search algorithm such as the algorithm employed in KaZaA [18]), as well as structured search approaches based on distributed hash tables, e.g., CAN [14] and CHORD [19]. Unstructured systems do not provide an index of data locations, so a query must be sent to many peers. In contrast, structured systems improve search efficiency by indexing the data locations and routing a query along a path to the data location. Data replication has been proposed to improve unstructured searches [5]. Accurate characterization of peer query behavior is needed when evaluating design alternatives for future P2P systems. For example, Chawathe et al. [3] use simulations of client query behavior to evaluate a new overlay network architecture and a new biased random walk search protocol, and Ge et al. [7] use an analytic model of query behavior to compare alternative directory architectures and search protocols. Recent studies have provided important partial characterizations of peer behavior, including aggregate distributions of session durations, time between downloads, query and file popularity, requested file sizes, and measured bandwidth between the peer and the Internet at large [2, 9, 15, 16, 17, 20, 22]. Several of these studies consider the impact of time of day or another specific correlation between the measured parameters (e.g., distribution of session duration as a function of measured peer bandwidth). However, the previous workload measures have two significant drawbacks for constructing realistic synthetic workloads: (1) they are incomplete with respect to the key correlations among the workload measures, and (2) they include aggregate measures (e.g., mixture distributions) that obscure heterogeneous behavior across different classes of peers or across different periods of time. Examples of the latter include the aggregate distribution of query popularity for peers from different geographic regions or across different days. Alexander Klemm a Christoph Lindemann a Mary K. Vernon b Oliver P. Waldhorst a a University of Dortmund Department of Computer Science August-Schmidt-Strasse 12 44227 Dortmund, Germany http://mobicom.cs.uni-dortmund.de/ b University of Wisconsin - Madison Department of Computer Sciences 1210 West Dayton Street Madison, WI 53706, USA http://www.cs.wisc.edu/~vernon Characterizing the Query Behavior in Peer-to-Peer File Sharing Systems* Permission to make digital or hard copies of all or part of this work for personal or classroom use is granted without fee provided that copies are not made or distributed for profit or commercial advantage and that copies bear this notice and the full citation on the first page. To copy otherwise, or republish, to post on servers or to redistribute to lists, requires prior specific permission and/or a fee. IMC’04, October 25–27, 2004, Taormina, Silicy, Italy. Copyright 2004 ACM 1-58113-821-0/04/0011…$5.00. *The research in this paper was partially supported by the German Research Council (DFG) under Grant Li-645/13-1 and by the U.S. National Science Foundation under Grant ANI-0117810. 55
Transcript of Characterizing the Query Behavior in Peer-to-Peer File Sharing
ABSTRACT This paper characterizes the query behavior of peers in a peer-to-peer (P2P) file sharing system. In contrast to previous work, which provides various aggregate workload statistics, we characterize peer behavior in a form that can be used for constructing representative synthetic workloads for evaluating new P2P system designs. In particular, the analysis exposes heterogeneous behavior that occurs on different days, in different geographical regions (i.e., Asia, Europe, and North America) or during different periods of the day. The workload measures include the fraction of connected sessions that are passive (i.e., issue no queries), the duration of such sessions, and for each active session, the number of queries issued, time until first query, query interarrival time, time after last query, and distribution of query popularity. Moreover, the key correlations in these workload measures are captured in the form of conditional distributions, such that the correlations can be accurately reproduced in a synthetic workload. The characterization is based on trace data gathered in the Gnutella P2P system over a period of 40 days. To characterize system-independent user behavior, we eliminate queries that are specific to the Gnutella system software, such as re-queries that are automatically issued by some client implementations to improve system responsiveness.
Categories and Subject Descriptors C.4 [Performance of Systems]: Measurement Techniques. C.2.4 [Computer-Communication Networks]: Distributed Systems – distributed applications.
General Terms Measurement, Performance.
Keywords Peer-to-peer, overlay networks, workload characterization, synthetic workloads.
1. INTRODUCTION Peer-to-peer (P2P) systems constitute one of the most popular applications in the Internet. The list of applications that are built on Sun’s JXTA protocol suite for P2P communication [6] reveals that P2P technology is employed for instant messaging, web publishing, distributed data management, gaming, in addition to the traditional file sharing applications which were made popular by Napster [13] and Gnutella [8]. Although Napster is no longer in service due to legal issues, Gnutella systems are still deployed and widely used. In particular, the popular Morpheus file sharing system [21] adopted the Gnutella protocol.
Gnutella, like all P2P file sharing systems, consists of two main building blocks: (1) a search algorithm for queries and (2) a file transfer protocol for downloading files matching a query. Efficient searching in P2P systems is an active area of research. Approaches include variants of Gnutella’s unstructured search algorithm such as the algorithm employed in KaZaA [18]), as well as structured search approaches based on distributed hash tables, e.g., CAN [14] and CHORD [19]. Unstructured systems do not provide an index of data locations, so a query must be sent to many peers. In contrast, structured systems improve search efficiency by indexing the data locations and routing a query along a path to the data location. Data replication has been proposed to improve unstructured searches [5].
Accurate characterization of peer query behavior is needed when evaluating design alternatives for future P2P systems. For example, Chawathe et al. [3] use simulations of client query behavior to evaluate a new overlay network architecture and a new biased random walk search protocol, and Ge et al. [7] use an analytic model of query behavior to compare alternative directory architectures and search protocols. Recent studies have provided important partial characterizations of peer behavior, including aggregate distributions of session durations, time between downloads, query and file popularity, requested file sizes, and measured bandwidth between the peer and the Internet at large [2, 9, 15, 16, 17, 20, 22]. Several of these studies consider the impact of time of day or another specific correlation between the measured parameters (e.g., distribution of session duration as a function of measured peer bandwidth). However, the previous workload measures have two significant drawbacks for constructing realistic synthetic workloads: (1) they are incomplete with respect to the key correlations among the workload measures, and (2) they include aggregate measures (e.g., mixture distributions) that obscure heterogeneous behavior across different classes of peers or across different periods of time. Examples of the latter include the aggregate distribution of query popularity for peers from different geographic regions or across different days.
Alexander Klemma Christoph Lindemanna Mary K. Vernonb Oliver P. Waldhorsta
aUniversity of Dortmund Department of Computer Science
August-Schmidt-Strasse 12 44227 Dortmund, Germany
http://mobicom.cs.uni-dortmund.de/
bUniversity of Wisconsin - Madison Department of Computer Sciences
1210 West Dayton Street Madison, WI 53706, USA
http://www.cs.wisc.edu/~vernon
Characterizing the Query Behavior in Peer-to-Peer File Sharing Systems*
Permission to make digital or hard copies of all or part of this work for personal or classroom use is granted without fee provided that copies are not made or distributed for profit or commercial advantage and that copies bear this notice and the full citation on the first page. To copy otherwise, or republish, to post on servers or to redistribute to lists, requires prior specific permission and/or a fee. IMC’04, October 25–27, 2004, Taormina, Silicy, Italy. Copyright 2004 ACM 1-58113-821-0/04/0011…$5.00.
*The research in this paper was partially supported by the German Research Council (DFG) under Grant Li-645/13-1 and by the U.S. National Science Foundation under Grant ANI-0117810.
55

This paper provides a characterization of P2P query behavior that is based on passive measurement of a peer in the Gnutella P2P system over a period of 40 days. We make three principal contributions. First, to characterize system-independent peer behavior, we eliminate queries that are specific to the Gnutella system, such as the re-queries that are issued by some client implementations to improve system responsiveness. Second, the characterization exposes key correlations among the workload measures as well as heterogeneous peer behavior on different days, in different geographical regions, and over different periods of the day. Third, we provide a relatively complete set of measures and model distributions that can be used for constructing realistic synthetic workloads.
The workload measures include the fraction of connected sessions that are completely passive (i.e., issue no queries), the duration of such sessions, and for each active session, the number of queries issued, time until the first query, query interarrival time, time after last query, and query popularity. The heterogeneous measures are provided for each class of peer sessions in a distinct geographical region (i.e., Asia, Europe, or North America) or during a different period of the day. Moreover, other key correlations in the measures are captured using further conditional distributions that can easily be applied when generating a synthetic workload. An important result is that only a relatively small number of conditional distributions are needed. We observe that the number of queries per active session, passive session duration, and the set of 100 most popular queries are all strongly correlated with the geographic location of the peer. We also find a significant correlation between session duration and the number of queries issued during the session, but not between query interarrival time and number of queries issued.
The remainder of this paper is organized as follows. Section 2 summarizes related work in measurement and workload modeling of P2P file sharing systems. In Section 3, we describe the measurement methodology, including the data filtering rules to eliminate system-specific peer behavior. Section 4 provides the P2P workload measures in the form of the requisite conditional distributions. Conclusions are given in Section 5.
2. RELATED WORK Several recent papers report workload measures of P2P file sharing systems. For example, Sripanidkulchai [20] shows that the popularity of Gnutella queries follows a Zipf-like distribution, and that simulated caching of query results reduces the network traffic by up to a factor of 3.7.
Sariou, Gummadi, and Gribble [16] measured the Napster and Gnutella file sharing systems in order to characterize the peers in terms of network topology, measured bottleneck bandwidth, network latency as a function of bandwidth, session duration, number of shared files, size of shared files as a function of the number of shared files, and number of downloads as a function of peer bandwidth. They identified different classes of peers and propose that different tasks in a P2P system should be delegated to different peers depending on their capabilities. We observe similar distributions of session duration (i.e., a high fraction under 3 minutes), and a similar fraction of peers that are passive (i.e., 80%), but we omit characterization of parameters that depend on system design (e.g., overlay network topology), and more completely characterize the query behavior, including the impact of geographic
location and time of day on the number of queries and the correlation between session duration and number of queries.
Adar and Hubermann [1] also measured the Gnutella system and found a significant fraction of “free rider” sessions, which download files from other peers but don’t share any files. An analysis of locality in shared files and downloads is provided by Chu, Labonte, and Levine [4]. This paper does not characterize the number of files shared by a peer or the locality in the shared files. Instead this paper focuses on characterizing the query behavior of the peers.
In [9] Gummadi et al. collected and analyzed a 200-day trace of KaZaA traffic. They characterize active session length, size of downloads, and evolution of object popularity. Similar to their work, we propose a synthetic workload model, and we observe that the query popularity distribution aggregated over multiple days has a “flattened head”. In contrast to their work, we characterize a wider range of peers (distributed among three continents, rather than localized on a single campus). In addition, we characterize passive sessions, the per day query popularity distribution, and key correlations in the measured characteristics.
Bhaghwan et al. [2] characterize the fraction of time that hosts are available as well as the frequency of arrivals and departures, including time of day effects. Sen and Wang [17] also consider time of day effects in characterizing traffic volume, distribution of time between downloads, and active session durations, but not the correlation between session duration and number of downloads, nor the impact of geographic locality. The previous papers that characterize Gnutella client queries also do not mention separating system-independent peer behavior from the system-dependent re-queries to obtain better responsiveness.
First approaches to modeling the performance of entire P2P file sharing systems include [7] and [22]. Yang and Garcia-Molina [22] present an analytical model for hybrid P2P systems and evaluate several system designs in terms of the number of results and CPU and memory requirements. To validate their model, they used aggregated measures obtained from the server of a hybrid P2P system. Ge, Figueiredo, Jaswal, Kurose, and Towsley present an analytical model that can be adapted to different file sharing systems by appropriately choosing model parameters [7]. We characterize classes of peers, time between queries, and the query popularity distribution that could be used in their model. We also characterize passive peer behavior, and observe significant class dependent query popularity, and session duration, which could easily be added to their model.
3. TRACE MEASUREMENTS
3.1 Measurement Setup For the analysis of peer behavior in P2P file sharing systems, we set up a client node in the popular Gnutella overlay network [8].
Gnutella clients construct an overlay network (i.e., a network of application layer connections) that is used to route query messages and responses from one client to another. The Gnutella protocol specifies four message types. Messages of types PING and PONG are used to maintain overlay connectivity and obtain information about other peers. Messages of type QUERY contain a set of keywords in the title of files a user is searching for. Each QUERY message generated at a client is sent to each of its directly connected peers in the overlay network, which then forwards the
56

message to further peers. Peers with a high bandwidth Internet connection and high processing power run in ultrapeer mode. Less powerful peers (leaf nodes) connect to only a small set of ultrapeers. A QUERY message is forwarded to all ultrapeer nodes, but is only forwarded to the leaf nodes that have a high probability of responding. Forwarding a QUERY message more than once is prevented by storing the query’s global unique identifier (GUID) in a routing table, along with the identity of the directly connected peer that the query is initially received from. The maximum number of overlay hops that a QUERY message may transit is specified by a time-to-live (TTL) field, which is set when the message is generated. The field is decremented each time the message is forwarded, and the message is not forwarded if TTL is equal to zero. To determine how far a message has traveled through the network, a hops count field with an initial value of zero is incremented before forwarding. If a peer has one or more files that match the query string in a query message, it responds with the fourth message type, QUERYHIT. This response message is transferred to the inquiring peer on the reverse overlay path that the query message was routed to the responding peer, using the routing table that specifies the next hop in the reverse path for each GUID. According to the protocol specification, a GUID is deleted from the routing table after a specified time, typically after 10 minutes.
Since the Gnutella protocol specification is publicly available, there are a number of client implementations. To perform the measurements in the Gnutella network, we modify the open-source Gnutella client implementation called mutella [12], to obtain a trace of the data contained in the Gnutella messages from the peer nodes. We conduct only passive measurements; that is, we do not generate messages actively, in order to minimize the disturbance of the actual network traffic by the measurement.
To obtain a reasonable sampling of the network traffic in the traces, we specify that the measurement client will run in ultrapeer mode and maintain up to 200 connections to other peers simultaneously. This results in more than four million measured direct peer connections during the forty day measurement period, as shown in Table 1. The number of connections is determined by the number of unique IP addresses from which a connection has been received. Approximately 40% of the connections are from peers that are running in ultrapeer mode, and 60% are from leaf nodes. Thus, both types of nodes are well represented in the measured workload.
For convenience, the measurement node is located at the University of Dortmund; however, as will be shown in Section 3.4 below, the 200 directly connected peers are scattered around the globe with proportions of one-hop peers in North America, Europe, and Asia that are approximately the same as the corresponding proportions of the total peer population in each of the three continents. Since the construction algorithm of the Gnutella overlay network [8] does not contain any geographic bias in the peers that are directly
connected, we hypothesize that the placement of the measurement node does not impact the measured behavior of the peers. Section 3.4 provides quantitative measures that are consistent with this hypothesis.
3.2 Measuring Peer Characteristics An important characteristic to be measured is the geographic location of a peer. We determine this measure from the IP address for the peer using the GeoIP database [10].
Another key measure is the number of queries issued during a peer session. Unfortunately, a QUERY message does not include the IP address or any other tag that can be used to identify the node that generated the query. However, each QUERY message generated by a user of a Gnutella client that is directly connected to the measurement peer has a hop count equal to one, and the IP addresses of these directly connected peers are known from the TCP connections in the overlay. Since each each QUERY that is generated at a client (by the user) is sent to each directly connected peer, the measurement node will receive every QUERY message from a directly connected (or “one-hop”) peer. We can thus measure the number of QUERY messages that are generated during each connected peer session that has distance one hop.
A third important measure is the peer’s session duration. There are no Gnutella messages to indicate the start of a new client session. However, a connected session starts when the Gnutella handshake between the measurement peer and the one-hop peer is completed. Since the measurement client session never terminates, the termination of the TCP connection to a one-hop peer indicates the end of the one-hop peer’s session. We note that many Gnutella clients do not terminate an overlay connection by sending a BYE message according to the Gnutella specification. Instead, most clients simply stop sending messages over the connection. When the measurement peer detects that a connection is idle for 15 seconds, it sends a single PING message to the one-hop peer. If no response is received after another 15 seconds, the measurement peer will close the connection. Thus, we will overestimate the end of most connected session durations by approximately 30 seconds.
According to the Gnutella protocol, queries are assumed to be identical if they contain the same set of keywords. We use this definition of a query when measuring the number of distinct queries observed at the measurement node. We’ve also verified by inspection that the great majority of the top 100 queries are each for different files, rather than being variations of keywords for the same files.
3.3 Filtering Gnutella System Behavior When inspecting the trace files, we discovered several anomalies in the queries received from some one-hop neighbors. By recording the content of the User-Agent-Header exchanged during handshake at connection establishment, we determined that certain types of anomalies could be attributed to peers running a specific client implementation. Since our objective is to characterize the user workload rather than the behavior of the P2P system software, we discard the following types of query messages that are automatically issued by particular Gnutella client implementations to improve system responsiveness:
1. QUERY message with the SHA1 extension. The client software uses the SHA1 hash sum to identify a specific file that is already known. Thus, this query does not indicate the user’s
Table 1. Overall Trace Characteristics
Measure Value Trace period 3/15/04 – 4/23/04 Number of QUERY messages 34,425,154 Number of QUERYHIT messages 1,339,540 Number of PING messages 27,159,805 Number of PONG message 17,807,992 Number of direct connections 4,361,965 Query messages with hop count = 1 1,735,538
57
interest in a new file, but rather a search for additional sources to continue a file download.
2. QUERY message with a query string that has already been observed within a client session. Most Gnutella clients provide features for automatically re-sending a query in order to improve search results. These repeated queries indicate that the system is searching for further results, rather than user behavior.
3. QUERY message from a session that is connected for less than 64 seconds. Many clients (i.e., 29%) disconnect in less than 10 seconds and another significant fraction (32%) disconnect during the next 20-25 seconds. A total of about 70% of connections terminate in less than 64 seconds. Such frequently occurring quick disconnects are likely due to system software decisions to disconnect from the measurement peer (for unknown reason) rather than user behavior. Since other specific connection durations are not observed with unusual frequency, sessions longer than 64 seconds are assumed to end due to user session termination.
Filtering sessions with a length less than 64 seconds will eliminate anomalies in statistics for session duration and number of queries issued per session. In addition, the following query messages are sent by some peers soon after connecting to the measurement peer:
4. QUERY messages with interarrival time of less than 1 second, and
5. QUERY messages with identical interarrival times. We found some peers that issued query messages in regular intervals, e.g., 10 seconds.
Each of these queries indicates automated client behavior. They appear to be automated re-queries for queries that were issued by the user prior to connecting to the measurement peer. Although queries identified by rules 4 and 5 were generated automatically by the system software, the user query that was issued before the client connected to the measurement peer is important. Thus, we include these queries in the measures of the query popularity distribution and the number of queries per session, but not in the measure of query interarrival time since the observed arrival time was determined by the system software.
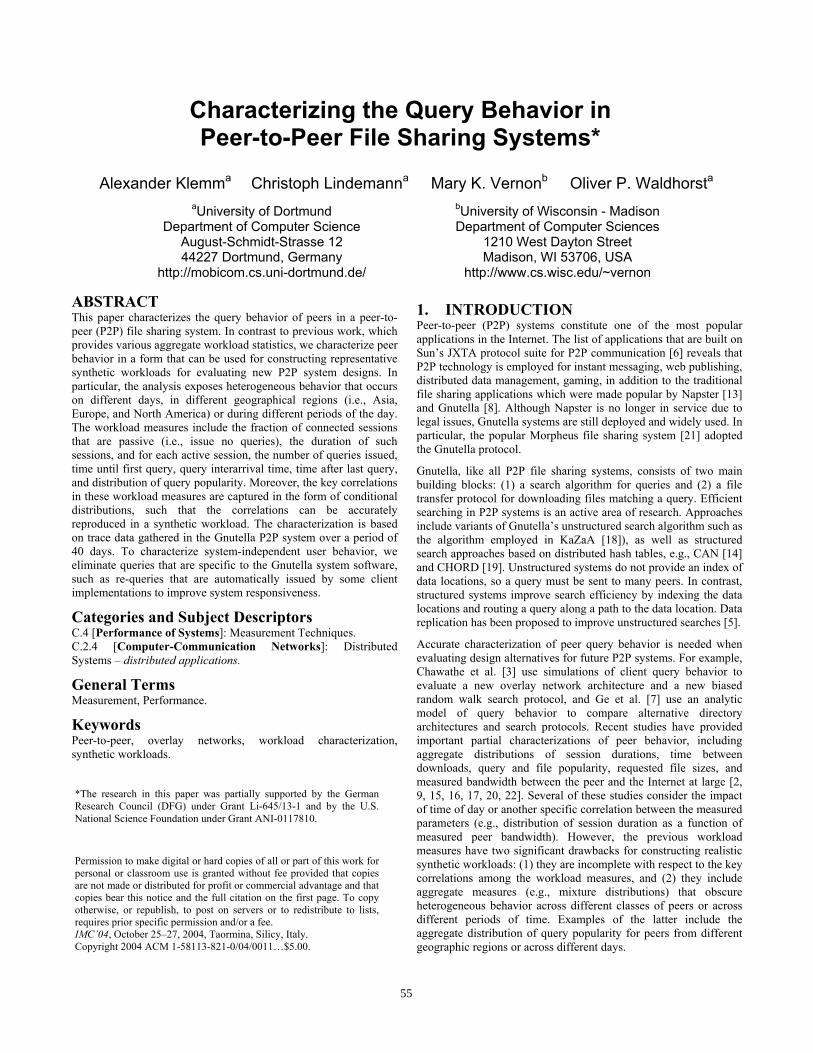
Table 2 shows the number of queries that are discarded when each of the first three rules is applied in sequence, and the number of queries that are not counted in the measure of query interarrival time due to rules four and five. We note that the number of queries discarded by each of the first three rules is substantial. For example, nearly half the queries are discarded by the second rule, which identifies queries that are repeated by the system to obtain further results, rather than queries that are part of the user workload. Considering the large fraction of automatically generated
queries, we conclude that it is essential to apply the filter rules in order to characterize the system-independent query behavior of users. Nevertheless, there are still a substantial number of queries and connected sessions that are analyzed to obtain the user workload characterization.
3.4 Properties of One-hop Peers Since we can only measure the query behavior of peers that are directly connected to the measurement node, we examine two measures that are consistent with the hypothesis that the large number of one-hop peer sessions are representative of all peer sessions in the system.
The first measure is the geographic distribution of the one-hop peers as compared to all peers. To measure the geographic distribution of all peers, we determine the distribution of the IP addresses in all PONG and QUERYHIT messages that are recorded at the measurement node. To determine the geographic distribution of the one-hop peers, we determine the distribution of the IP addresses for all connected sessions. Figure 1 provides the fraction of one-hop peers, and the fraction of all peers, in each of the three geographic regions where most peers are located (North America, Europe, and Asia) during each one-hour interval of a 24-hour day. The value for each one-hour bin is an average over the entire trace. We observe that the geographic distribution of one-hop peers is nearly the same as the geographic distribution of all peers, although there is a slightly higher fraction of one-hop peers in Asia and a slightly lower fraction in North America during the daytime hours at the measurement node. As we will show in Section 4, Asian peers tend to maintain shorter sessions than the peers in the other two continents, so the number of Asian peers that are more distant than one-hop from the measurement node may be somewhat underestimated. We thus conclude that the Gnutella client software connects to one-hop peers that are widely distributed and appear to be randomly selected with respect to geographical location.
In a second experiment, we observe the number of shared files as reported in PONG messages from all peers and in PONG messages from one-hop peers. Figure 2 plots the fraction of each class of peers that report each number of shared files from zero to one hundred. We observe that one-hop peers are again reasonably representative of the total peer population with respect to the number of shared files.
In the next section we characterize the behavior of the one-hop peers, noting that the measures presented in Figures 1 and 2 are consistent with the hypothesis that the one-hop peers are representative of the total peer population.
Table 2. Filtered Queries
Rule # Queries # Sessions Number of sessions and query messages from 1-hop neighbors 1,735,538 4,361,965 1 Ignore query messages with empty keywords and SHA1 extension 410,513 2 Ignore query messages with identical query string issued by the same peer within a session 841,656 3 Discard sessions with session length of less than 64 seconds 310,164 3,053,375 Final number of QUERY messages and sessions considered 173,195 1,308,590 4 Ignore query messages from a specific peer with query interarrival time of less then 1 seconds 77,058 5 Ignore subsequent query messages from a specific peer with identical interarrival times 14,715 Final number of QUERY messages considered in query interarrival time measure 81,432
58

4. PEER CHARACTERIZATION Each connected (one-hop) peer session can be classified as either active or passive. Active peers send at least one query in order to locate files to download. Passive peers are connected in the overlay network but perform no queries. These peers constitute an important component of a realistic workload because they don’t generate any query load and because they form part of the overlay network that forwards and respond to queries. Thus, our characterization includes both types of peers.
A key goal is to characterize all distributions needed for generating a synthetic workload that accurately captures the query behavior of individual peers. Key correlations among the workload characteristics need to be represented in the synthetic workload. We thus begin in Section 4.1 by characterizing the fraction of peers from each of the three continents where most peers reside, as a function of the time of day. Section 4.2 characterizes the total query load from each of the three continents as a function of the time of day, and identifies periods in the day when the load from each continent is highest. The session characteristics that need to be represented in a synthetic workload will then be conditioned on geographic location and/or on high-load periods of the day, for whichever characteristics are found to be heterogeneous in either of those domains.
To characterize connected peer sessions, we analyze the fraction of peers that are passive (Section 4.3), the distribution of session duration for passive peers (Section 4.4), the distributions of number of queries and session duration for active peers (Section 4.5), and the query popularity distribution (Section 4.6). The correlations among these session characteristics and the geographic location of the peer or the time of day are determined as each characteristic is analyzed. Significant correlations are captured in the form of conditional distributions, so that the correlations can easily be represented in the synthetic workload. Model distributions that fit the measured distributions for the important session characteristics are given in the Appendix, along with representative graphs that illustrate how closely the model distribution fit the measured distribution. The algorithm for generating a synthetic workload from the measured characteristics is summarized in Section 4.7.
4.1 Geographic Distribution As first measure of the workload characterization, we analyze the geographic distribution of peers conditioned on time of day at the measurement node. Curves for the average fraction of peers from each continent during each hour of the 24-hour day have been
presented in Figure 1. The fraction of peers from each continent on the “outlier days” (i.e., days with largest or smallest fraction from each region) only differ by about ±5% in absolute value from the averages shown in the figure. Furthermore, the plot of the number of connections to peers in any region for each 5-minute interval during a given hour on any given day (omitted to conserve space) also does not fluctuate by more than about ±5-10 peers over the hour. Thus, the fractions of peers from each region during each hour in Figure 1 are approximately representative of the relative mix of peers during each hour on any give day.
We observe from Figure 1 that the relative fraction of peers from each geographical region changes modestly as a function of the time of day. For example, the fraction of North American peers decreases from about 80% to about 60% during the hours of 10pm – 6am in North America, and then rises gradually back to 80% between 6am – 10pm. European and Asian peers constitute much lower fractions of the Gnutella peers. The largest fraction of European peers, close to 20%, is observed during noon – midnight in Dortmund. At about 6am, their fraction constitute only about 6%. Similarly, the highest fraction of Asian peers (about 13%) occurs during the afternoon and evening hours in Asia. During the early morning hours only about 4% of the peers are from Asia. Peers from other geographical regions or with unknown origin constitute approximately 5-10% of the peers. To create a synthetic workload, the interesting mixes of peers from North America, Europe, and Asia (respectively) are perhaps: 75, 15, 5 at 00:00, or 80, 5, 5 at 3:00, or 60, 20, 15 at 12:00. In the remainder of this paper we characterize the peers in the three continents where most peers reside.
0
0.2
0.4
0.6
0.8
24:0018:0012:0006:0000:00
Frac
tion
of P
eers
Time of Day at Measurement Peer
All Peers1-hop Peers
0
0.2
0.4
0.6
0.8
24:0018:0012:0006:0000:00
Frac
tion
of P
eers
Time of Day at Measurement Peer
All Peers1-hop Peers
0
0.2
0.4
0.6
0.8
24:0018:0012:0006:0000:00
Frac
tion
of P
eers
Time of Day at Measurement Peer
All Peers1-hop Peers
(a) North America (b) Europe (c) Asia
Figure 1. Representativeness of One-Hop Peers: Geographic Distribution
0.001
0.01
0.1
0 20 40 60 80 100Fr
actio
n of
Pee
rsNumber of Shared Files
All Peers1-hop Peers
Figure. 2. Representativeness of One-Hop Peers: Shared Files
59

4.2 Periods of Peak Load To analyze potential correlations between the various workload measures and the time of day, it is useful to identify periods of time that have high and low query activity for each geographical region. To do this, Figure 3 plots the number of queries received from the one-hop peers from each geographical region in bins of 30 minutes as a function of time of day. The average values of each bin are averaged over the entire measurement period. Except for the Asian peers, the average curves for each region show a similar correlation to time of day as Figure 1. In particular, we identify the following key periods from Figure 3: 03:00-04:00 (peak in North America, sink for Europe), 11:00-12:00 (sink for North America, peak for Europe), 13:00-14:00 (sink for North America, peak for Europe, peak for Asia), and 19:00-20:00 (joint peak for North America and Europe).
The minimum and maximum curves indicate a high variance for each bin. Plots of the number of queries during each hour during an “outlier day” – i.e., a day with the minimum or maximum total number of queries from the geographical region – (omitted to conserve space) shows that the number of queries is not consistently low or high during each 30-minute interval, but instead varies greatly from one interval to the next, due to statistical fluctuations in a relatively small sample size during each interval. That is, statistically, some peer sessions issue larger or smaller number of queries than the average, causing the total number of queries during the interval to differ significantly from the average.
4.3 Fraction of Passive Peers We plot the fraction of passive peers versus time of day in Figure 4. In this figure, we count the number of peer sessions that begin in a 1-hour interval that issue no queries (during the entire session) and calculate the ratio to all sessions that start in the same hour. The average for each 1-hour interval is computed over the entire
measurement period. We observe that the fraction is almost the same for each geographical region, with about 80% to 85% for North America, 75% to 80% for Europe, and 80% to 90% for Asia. Furthermore, the fraction of passive peers fluctuates only by about 5% over time of day. Comparing similar graphs with averages for each bin calculated over the first and the second half of the measurement period the fraction of passive peers does not change. Due to space limitations, we do not show these figures. We conclude from these results that the fraction of passive peers is approximately independent of time of day and of multiple-day periods.
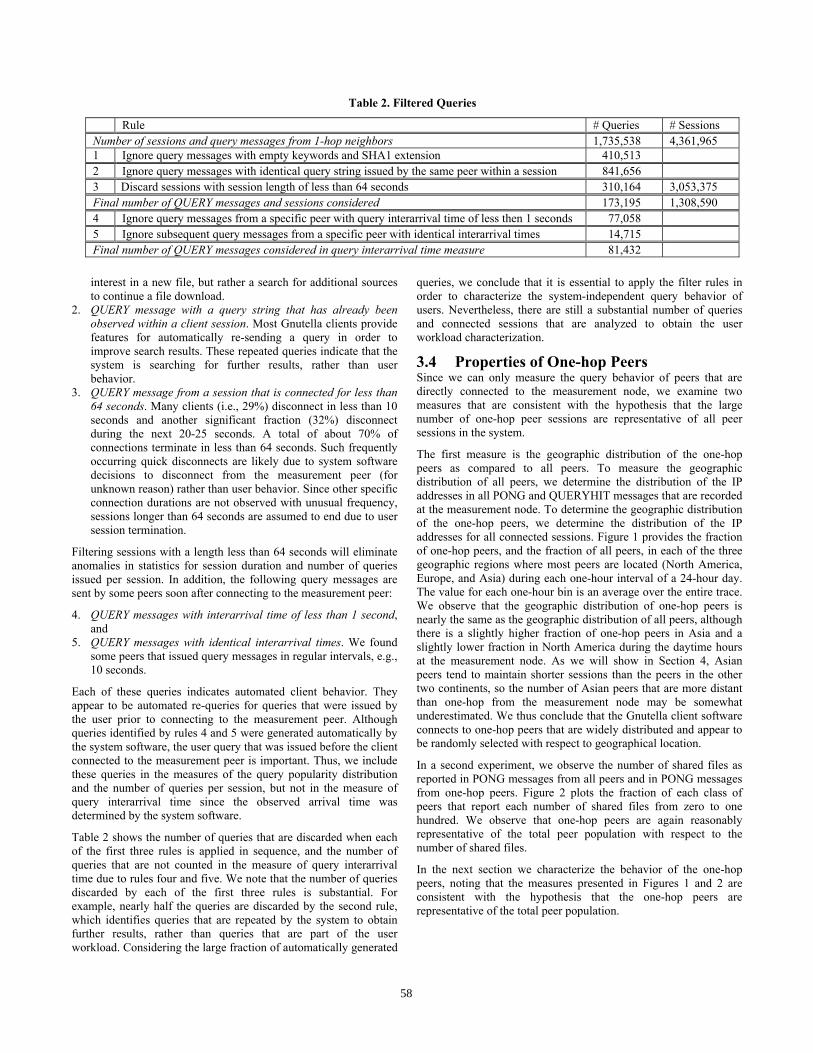
4.4 Connected Session Duration Passive Peers As a passive peer does not send queries, the connected session duration is given by the time during which the peer maintains at least one connection to another peer. To check the correlation between session duration and geographical region, Figure 5 (a) plots the complementary CDF (CCDF) of session duration broken down to the geographical region. We observe that session duration shows a significant correlation to geographical region. For instance, in Asia 85% of the sessions are shorter than 2 minutes, in North America and in Europe only 75% and 55% are shorter than 2 minutes, respectively. Sessions of an intermediate duration between 2 and 200 minutes constitute 12% in Asia, 20% in North America, and 35% in Europe. Longer sessions make up 3% in Asia, 6% in North America, and 10% in Europe. Note that session durations between 17 and 50 hours account for 1% of the sessions in each geographical region, indicating that a considerable fraction of the peers stays online for a very long time without generating queries. Considering the impact of multiple-day periods, we observed in an experiment not shown that the distribution of session duration is nearly identical in the first and the second half of the measurement period.
0
40
80
120
160
24:0018:0012:0006:0000:00
# Q
ueri
es
Time of Day at Measurement Peer
MaxAverage
Min
0
40
80
120
160
24:0018:0012:0006:0000:00
# Q
ueri
es
Time of Day at Measurement Peer
MaxAverage
Min
0
20
40
60
80
24:0018:0012:0006:0000:00
# Q
ueri
es
Time of Day at Measurement Peer
MaxAverage
Min
(a) North America (b) Europe (c) Asia
Figure. 3. Load Measured in Number of Queries vs. Time (30 minute bins)
0
0.2
0.4
0.6
0.8
1
24:0018:0012:0006:0000:00Frac
tion
of P
assi
ve P
eers
Time of Day at Measurement Peer
MaxAverage
Min
0
0.2
0.4
0.6
0.8
1
24:0018:0012:0006:0000:00Frac
tion
of P
assi
ve P
eers
Time of Day at Measurement Peer
MaxAverage
Min 0
0.2
0.4
0.6
0.8
1
24:0018:0012:0006:0000:00Frac
tion
of P
assi
ve P
eers
Time of Day at Measurement Peer
MaxAverage
Min
(a) North America (b) Europe (c) Asia
Figure 4. Fraction of Connected Peers that are Passive
60
To analyze correlations between session duration and time of day, we Figures 5 (b) and (c) plot the CCDF of session duration for sessions starting in each of the important periods. We observe that for European peers session duration shows a significant correlation to time of day. In particular, sessions started in the early morning are notably longer than sessions started in the afternoon or evening. For example, the fraction of sessions with duration below 90 minutes for sessions starting between 03:00 and 04:00 is 85%. However, this fraction is 93% for sessions starting between 13:00 and 14:00. A similar trend is observed for sessions started in the evening hours in North America; i.e., 11:00 to 12:00 at the measurement peer. We conclude from Figures 5 (b) and (c) that correlations between session duration and time of day are significant for generating synthetic workload.
The session duration for passive peers conditioned on geographical region and time of day can be well modeled by a bimodal distribution composed of two lognormal distributions. Table A.1 provides the parameters of the fitted distributional model for North American peers.
4.5 Active Peer Session Characteristics The connected session duration for active peers is a measure composed of the number of queries issued in a session, the time between the establishment of the connection and the sending of the first query, the time between the sending of two successive queries and the time after sending the last query until termination of the connection. Thus, in the following we characterize each of these measures separately.
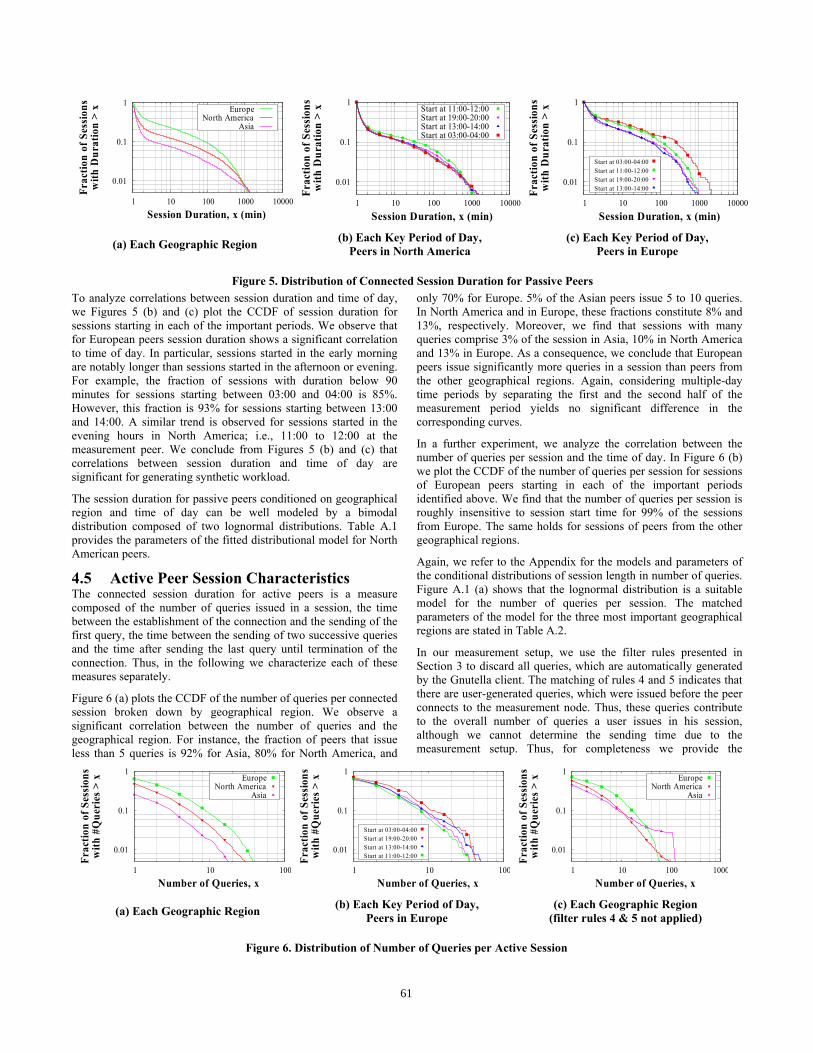
Figure 6 (a) plots the CCDF of the number of queries per connected session broken down by geographical region. We observe a significant correlation between the number of queries and the geographical region. For instance, the fraction of peers that issue less than 5 queries is 92% for Asia, 80% for North America, and
only 70% for Europe. 5% of the Asian peers issue 5 to 10 queries. In North America and in Europe, these fractions constitute 8% and 13%, respectively. Moreover, we find that sessions with many queries comprise 3% of the session in Asia, 10% in North America and 13% in Europe. As a consequence, we conclude that European peers issue significantly more queries in a session than peers from the other geographical regions. Again, considering multiple-day time periods by separating the first and the second half of the measurement period yields no significant difference in the corresponding curves.
In a further experiment, we analyze the correlation between the number of queries per session and the time of day. In Figure 6 (b) we plot the CCDF of the number of queries per session for sessions of European peers starting in each of the important periods identified above. We find that the number of queries per session is roughly insensitive to session start time for 99% of the sessions from Europe. The same holds for sessions of peers from the other geographical regions.
Again, we refer to the Appendix for the models and parameters of the conditional distributions of session length in number of queries. Figure A.1 (a) shows that the lognormal distribution is a suitable model for the number of queries per session. The matched parameters of the model for the three most important geographical regions are stated in Table A.2.
In our measurement setup, we use the filter rules presented in Section 3 to discard all queries, which are automatically generated by the Gnutella client. The matching of rules 4 and 5 indicates that there are user-generated queries, which were issued before the peer connects to the measurement node. Thus, these queries contribute to the overall number of queries a user issues in his session, although we cannot determine the sending time due to the measurement setup. Thus, for completeness we provide the
0.01
0.1
1
1 10 100 1000 10000
Frac
tion
of S
essi
ons
with
Dur
atio
n >
x
Session Duration, x (min)
EuropeNorth America
Asia
0.01
0.1
1
1 10 100 1000 10000
Frac
tion
of S
essi
ons
with
Dur
atio
n >
x
Session Duration, x (min)
Start at 11:00-12:00Start at 19:00-20:00Start at 13:00-14:00Start at 03:00-04:00
0.01
0.1
1
1 10 100 1000 10000
Frac
tion
of S
essi
ons
with
Dur
atio
n >
x
Session Duration, x (min)
Start at 03:00-04:00Start at 11:00-12:00Start at 19:00-20:00Start at 13:00-14:00
(a) Each Geographic Region (b) Each Key Period of Day, Peers in North America
(c) Each Key Period of Day, Peers in Europe
Figure 5. Distribution of Connected Session Duration for Passive Peers
0.01
0.1
1
1 10 100
Frac
tion
of S
essi
ons
with
#Q
ueri
es >
x
Number of Queries, x
EuropeNorth America
Asia
0.01
0.1
1
1 10 100
Frac
tion
of S
essi
ons
with
#Q
ueri
es >
x
Number of Queries, x
Start at 03:00-04:00Start at 19:00-20:00Start at 13:00-14:00Start at 11:00-12:00
0.01
0.1
1
1 10 100 1000
Frac
tion
of S
essi
ons
with
#Q
ueri
es >
x
Number of Queries, x
EuropeNorth America
Asia
(a) Each Geographic Region (b) Each Key Period of Day, Peers in Europe
(c) Each Geographic Region (filter rules 4 & 5 not applied)
Figure 6. Distribution of Number of Queries per Active Session
61

distribution of the number of queries per session for each geographical region in Figure 6 (c). We observe that the number of queries without applying filter rules 4 and 5 most significantly changes for Asian peers. For Asian peers there is a large fraction of about 4% of sessions with more than 100 queries. In future work we will further analyze if the queries in these sessions are truly user generated. The analysis in the remainder of this paper is based on the number of queries with filter rules 4 and 5 applied.
We plot in Figure 7 (a) the CCDF for the time until the first query after the connection establishment of a session broken down by geographical region. While the curves look very similar for North American and European peers, there is a significant difference for Asian peers. The first query within a session from Asian peers is issued within 10 seconds for 10% of the peers, whereas this fraction constitutes 20% for North America and Europe. The fraction of peers that issue a query within 30 seconds stays with 40% almost equal for all regions. Another 50% of the Asian peers issue the first query within 30 and 90 seconds. The same fraction of peers issues the first query within 30 and 1,000 seconds for Europe, indicating a significant correlation to geographical region. Furthermore, a fraction of 1% of the sessions started in North America and Europe issue the first query after 80,000 seconds, i.e., after more than 20 hours.
To analyze correlations between the time until first query and the number of queries issued in a session, Figure 7 (b) plots the CCDF for sessions with less than 3 queries, exactly 3 queries and more than 3 queries for North American peers. This figure shows that the conditional distributions are equal for 50% of the sessions with an early first query, while there is a significant difference for the 50% of the session with late first query. In particular, in 90% of the sessions with less than 3 queries the first query is issued before 200 seconds, in the sessions with exactly 3 queries before 1,000 seconds
and in sessions with more than 3 queries before 2,000 seconds. We conclude from Figure 7 (b) that for North America the time until first query is correlated with the session length in number of queries. In an experiment not shown, we found the same result for European peers.
Figure 7 (c) plots the CCDF of time until first query for the important daily time periods of European peers identified above. We find that in sessions started in the non-peak hours in a significant fraction of the sessions the first query is sent 10,000 seconds and more after session start. These fractions constitute 10% for Europe. The same trend can be observed for the other geographical regions. We conclude from Figure 7 (c) that there is a significant correlation between time of day and the time until first query. To capture this correlation, the workload model distinguishes between sessions starting in peak and in non-peak-hours.
The time until the first query conditioned on geographical region, time of day and number of queries per session can be modeled by a bimodal distribution composed of a Weibull distribution for the body and a lognormal distribution for the tail as shown in Figure A.1 (b) of the Appendix. The parameters for the conditional distributions for North American peers are presented in Table A.3.
We denote the time between issuing two subsequent queries as query interarrival time. Figure 8 (a) plots the CCDF of query interarrival time broken down by geographical region. This figure shows that queries generated by European peers have shorter interarrival times than the peers from the other two regions. For instance, the fraction of interarrival times below 100 seconds constitutes 90% for Europe, while it is 80% for Asia and 70% for North America. We conclude from Figure 8 (a) that query interarrival time shows a significant correlation to geographical
0.01
0.1
1
1 10 100 1000 10000 100000
Frac
tion
of S
essi
ons
with
Tim
e >
x
Time Until First Query, x (sec)
EuropeNorth America
Asia
0.01
0.1
1
1 10 100 1000 10000 100000
Frac
tion
of S
essi
ons
with
Tim
e >
x
Time Until First Query, x (sec)
> 3 Queries= 3 Queries< 3 Queries 0.01
0.1
1
1 10 100 1000 10000 100000
Frac
tion
of S
essi
ons
with
Tim
e >
x
Time Until First Query, x (sec)
Start at 03:00-04:00Start at 11:00-12:00Start at 13:00-14:00Start at 19:00-20:00
(a) Each Geographic Region (b) Conditioned on Session Length, Peers in North America
(c) Each Key Period, Peers in Europe
Figure 7. Distribution of Time Until First Query for Active Sessions
0.01
0.1
1
1 10 100 1000 10000Frac
tion
of Q
ueri
es w
ithIn
tera
rriv
al T
ime
> x
Interarrival Time, x (sec)
North AmericaAsia
Europe
0.01
0.1
1
1 10 100 1000 10000
Frac
tion
of Q
ueri
esw
ith T
ime
> x
Interarrival Time, x (sec)
= 2 Queries3-7 Queries> 7 Queries 0.01
0.1
1
1 10 100 1000 10000Frac
tion
of Q
ueri
es w
ithIn
tera
rriv
al T
ime
> x
Interarrival Time, x (sec)
Start at 03:00-04:00Start at 19:00-20:00Start at 13:00-14:00Start at 11:00-12:00
(a) Each Geographic Region (b) Conditioned on Session Length, Peers in Europe
(c) Each Key Period, Peers in Europe
Figure 8. Distribution of Time Between Queries for Active Sessions
62

region.
The analysis of the correlation between query interarrival time and number of queries per session reveals some interesting results. Whereas there is no significant correlation between these two measures for North American peers, sessions of European peers with many queries have smaller interarrival times than sessions with few queries as can be seen in Figure 8 (b). This indicates that there is a difference in the environment of North American and European peers like e.g. the prizing model of the Internet service providers. Due to this difference sessions of North American peers with many queries tend to connect for a longer period compared to similar sessions of European peers. We conclude that the query interarrival time has to be conditioned on the number of queries per session for European peers but not for North American peers.
To analyze the correlation to time of day, Figures 8 (c) plots the CCDF of query interarrival time of broken down to the important daily time periods for European peers. It show that queries issued in peak hours (all daily periods except 03:00-04:00) have longer interarrival times than queries issued in non-peak hours. For example, 94% of the queries issued in Europe between 3:00 and 4:00 have an interarrival time below 100 seconds, while this fraction is only 85% for sessions starting between 11:00 and 12:00. Results for the other geographical regions are identical. We conclude that query interarrival time shows a significant correlation to time of day.
As before, we provide a ready-to-use model for the conditional distributions of the query interarrival time in the Appendix. Figure A.1 (c) shows that a bimodal distribution composed of a lognormal body and a Pareto tail matches well to the measured query interarrival times. The parameters for the conditional distributions are summarized in Table A.4.
Figure 9 (a) plots the CCDF of the time after the last query broken down by geographical region. The figure shows that only a very small fraction of peers close the connection in less than 12 seconds after the last query. Furthermore, the distributions are very similar for North American and European peers, while Asian peers tend to close sessions much faster. For instance, the fraction of sessions with a time after last query of more than 1000 seconds is 20% for Europe and North America, while it is only 10% for Asia. We conclude that there is a significant correlation between time after last query and geographical region.
The correlation between time after last query and the number of queries per session is shown in Figure 9 (b). We observe the smallest and greatest values for the time after the last query for sessions with a single query, and with 8 and more queries,
respectively. Furthermore, the conditional distributions for 2 queries and 3 to 7 queries are identical for 99% of the sessions, similar to the curves for exactly 8 and more than 8 queries. Combining both distributions of these pairs, we observe a positive correlation between time after last query and number of queries per session for 90% of the sessions. We conclude from Figure 9 (b) that the distribution of time after last query must be conditioned on number of queries per session.
Analyzing the correlation to time of day for European peers in Figure 9 (c), we find that sessions sending the last query in the non-peak hours have a shorter time after last query than sessions sending the last query in peak hours. This trend is most noticeable in Europe, where the time after the last query for sessions sending the last query between 03:00 and 04:00 is below 10,000 seconds for more than 99% of the sessions, while it is below 91% of the sessions sending the last query at other times. For North American peers we observe the same trend. We conclude from Figure 9 (c) that time after last query is significantly correlated to time of day.
The time after the last query conditioned on geographical region, time of day and number of queries per session is well modeled by a lognormal distribution. As before the parameters for the conditional distributions are provided in Table A.5.
4.6 Query Popularity Distribution Since users’ interests will change over time, we expect that the set of queries that are popular will change within the measurement period. To confirm this assumption, we illustrate the drift in the most popular queries, i.e., the hot set drift [11]. For illustration, we determine the number of the top ten queries on day n that are found among the top N document on the subsequent day, for N=10, 20 and 100. Furthermore, we perform the same experiment for the queries with rank 11-20 and 21-100 on day n, respectively. Figure 10 plots the CCDF of the observed distributions for North American peers. The figure shows that for about 80% of the days the number of top 10 queries that is found in the top 100 on the subsequent day is not larger than 4, indicating a significant hot set drift. Even the top 100 queries change significantly from day to day, as Figure 10 (c) illustrates. We conclude from Figure 10 that the query popularity distribution cannot be calculated over the entire trace, since the hot set drift must be considered.
In addition to temporal influences, we conjecture that the query popularity distribution depends on the geographical location of peers. To confirm this conjecture, we determine the set of distinct queries issued by North American, European and Asian peers, subsequently, for periods of length N=1,2, and 4 days. Furthermore, we determine the pair-wise intersection between the query sets and
0.01
0.1
1
1 10 100 1000 10000 100000
Frac
tion
of S
essi
ons
with
Tim
e >
x
Time After Last Query, x (sec)
EuropeNorth America
Asia
0.01
0.1
1
1 10 100 1000 10000 100000
Frac
tion
of S
essi
ons
with
Tim
e >
x
Time After Last Query, x (sec)
8 Queries>8 Queries
2 Queries3-7 Queries
1 Query 0.01
0.1
1
1 10 100 1000 10000 100000
Frac
tion
of S
essi
ons
with
Tim
e >
x
Time After Last Query, x (sec)
Last Query at 11:00-12:00Last Query at 13:00-14:00Last Query at 19:00-20:00Last Query at 03:00-04:00
(a) Each Geographic Region (b) Conditioned on Session Length, Peers in North America
(c) Each Key Period, Peers in Europe
Figure 9. Distribution of Time After Last Query for Active Sessions
63
the intersection of all three sets. The cardinalities of the sets for typical periods are shown in Table 3. We note that the cardinality of the intersection between the query sets of North American and European peers is about 2.8% of the cardinality of the North American set and the European set for a single day. Even for a 4-day period, the cardinality of the intersection is not larger than 6%. The relative cardinality of the intersection of the query sets from all three continents is about 0.001% and 0.02% for all geographical regions and periods. We conclude from Table 3 that peers from different geographical regions issue different queries. Nevertheless, there is a small intersection that should be considered in an accurate workload model.
As a consequence of Figure 10 and Table 3, we employ the following methodology for calculation of representative query popularity distributions. To account for geographical correlations, we divide the queries for each day into seven sets, i.e., one set for queries that are issued only from a single geographical region, three sets for queries that are issued by peers from two geographical regions (one for each pair), and one set of queries that are issued by peers from all three regions. We rank the queries by their frequency for each day and each of the seven subsets. To consider the hot set drift, we calculate the average frequency for a query with rank i for all days. Note, that according to Figure 10 the query with rank i on day n in general is different from the query with rank i on day n+1. Thus, ranking queries separately for each day preserves the hot-set drift and we obtain an average distribution of query popularity for a single day.
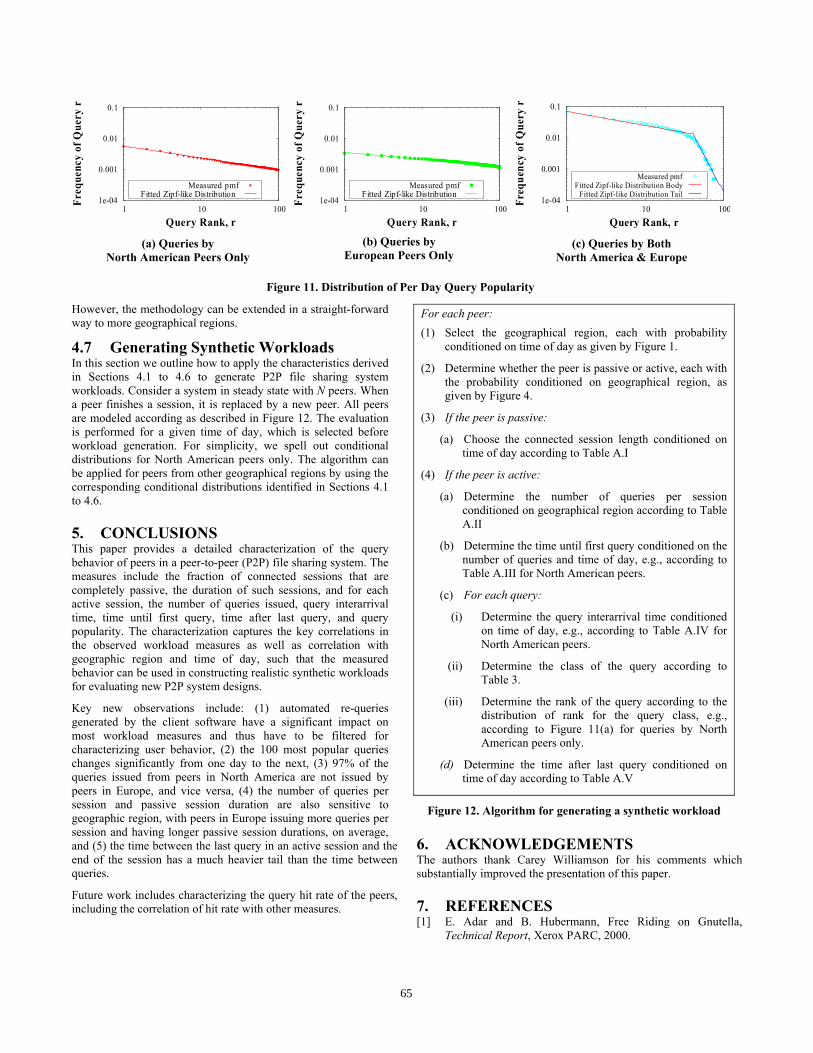
Figure 11 plots the pmf of the popularity distributions for the class of queries issued only by North American peers, the class issued only by European peers, and the class of queries issued by both North American and European peers. On a log-log scale, the curves are nearly linear, indicating that the query popularity per day
follows a Zipf-like distribution. Note that the skew in the Zipf-like distribution (i.e., the slope of the line) is somewhat different for each region; in fact, the fitted Zipf-like distribution has parameter αNA=0.386 for queries issued only in North America, and αE=0.223 for queries issued only in Europe. We also note that, similar to [9,20], when we computed the popularity distribution for the aggregate set of queries over multiple (e.g., 4 or 10) days from our measurement trace, we observe a flattened head in the distribution (not shown to conserve space), since there are multiple queries in the aggregate set that were accessed with similar frequency but on different days. Similarly, the popularity distribution for the queries that are issued by both North American and European peers (shown in Figure 11(c)) has a flattened head and is fit by two different Zipf-like distributions, one for queries ranked 1 to 45 with αI,body=0.453 and the other for queries ranked 46 to 100 with αI,tail=4.67. Furthermore, the values of these Zipf parameters are significantly smaller than those observed in related work [20], due to filtering of automated queries. This fact, again, provides evidence that the filtering of automated client behavior is essential for characterizing user behavior in a peer-to-peer file sharing system. As a consequence of the small Zipf parameters, caching of responses will be more effectively in systems that use aggressive automated re-query features than in systems that only issue queries on the users action.
For synthetic workload generation, the results shown in Table 3 and Figure 11 can be used as follows: For North American peers, a query is in the set of North American queries with a probability of 0.97, and with probability 0.03 in the intersection set. Thus, for each query the set is chosen with these probabilities. After that, the query is chosen by a Zipf like distribution with the parameter determined by Figure 11 for the according set. We use only two geographical regions, North America and Europe in the example.
0
0.2
0.4
0.6
0.8
0 1 2 3 4Frac
tion
of D
ays
with
> x
in
Top
N o
n D
ay n
+1
Number of Queries, x
N=100N=20N=10
0
0.2
0.4
0.6
0.8
0 1 2 3 4Frac
tion
of D
ays
with
> x
in
Top
N o
n D
ay n
+1
Number of Queries, x
N=100N=20N=10
0
0.2
0.4
0.6
0.8
0 1 2 3 4Frac
tion
of D
ays
with
> x
in
Top
N o
n D
ay n
+1
Number of Queries, x
N=100N=20N=10
(a) Top 10 on Day n (b) Rank 11-20 on Day n (c) Rank 21-100 on Day n
Figure 10. Drift in Query Popularity (North American Peers)
Table 3. Query Class Sizes
Measure 4-Day Period 2-Day Period 1-Day Period Number of Different Queries from North American Peers 6106 3588 1990 Number of Different Queries from European Peers 5382 3729 1934 Number of Different Queries from Asian Peers 776 299 153 Number of Queries in Intersection Set between North American an European Peers 323 114 56
Number of Queries in Intersection Set between North American and Asian Peers 41 15 5
Number of Queries in Intersection Set between European and Asian Peers 28 10 5 Number of Queries in Intersection Set between North American, European, and Asian Peers 17 4 2
64
However, the methodology can be extended in a straight-forward way to more geographical regions.
4.7 Generating Synthetic Workloads In this section we outline how to apply the characteristics derived in Sections 4.1 to 4.6 to generate P2P file sharing system workloads. Consider a system in steady state with N peers. When a peer finishes a session, it is replaced by a new peer. All peers are modeled according as described in Figure 12. The evaluation is performed for a given time of day, which is selected before workload generation. For simplicity, we spell out conditional distributions for North American peers only. The algorithm can be applied for peers from other geographical regions by using the corresponding conditional distributions identified in Sections 4.1 to 4.6.
5. CONCLUSIONS This paper provides a detailed characterization of the query behavior of peers in a peer-to-peer (P2P) file sharing system. The measures include the fraction of connected sessions that are completely passive, the duration of such sessions, and for each active session, the number of queries issued, query interarrival time, time until first query, time after last query, and query popularity. The characterization captures the key correlations in the observed workload measures as well as correlation with geographic region and time of day, such that the measured behavior can be used in constructing realistic synthetic workloads for evaluating new P2P system designs.
Key new observations include: (1) automated re-queries generated by the client software have a significant impact on most workload measures and thus have to be filtered for characterizing user behavior, (2) the 100 most popular queries changes significantly from one day to the next, (3) 97% of the queries issued from peers in North America are not issued by peers in Europe, and vice versa, (4) the number of queries per session and passive session duration are also sensitive to geographic region, with peers in Europe issuing more queries per session and having longer passive session durations, on average, and (5) the time between the last query in an active session and the end of the session has a much heavier tail than the time between queries.
Future work includes characterizing the query hit rate of the peers, including the correlation of hit rate with other measures.
6. ACKNOWLEDGEMENTS The authors thank Carey Williamson for his comments which substantially improved the presentation of this paper.
7. REFERENCES [1] E. Adar and B. Hubermann, Free Riding on Gnutella,
Technical Report, Xerox PARC, 2000.
1e-04
0.001
0.01
0.1
1 10 100
Freq
uenc
y of
Que
ry r
Query Rank, r
Measured pmfFitted Zipf-like Distribution
1e-04
0.001
0.01
0.1
1 10 100
Freq
uenc
y of
Que
ry r
Query Rank, r
Measured pmfFitted Zipf-like Distribution
1e-04
0.001
0.01
0.1
1 10 100
Freq
uenc
y of
Que
ry r
Query Rank, r
Measured pmfFitted Zipf-like Distribution Body
Fitted Zipf-like Distribution Tail
(a) Queries by North American Peers Only
(b) Queries by European Peers Only
(c) Queries by Both North America & Europe
Figure 11. Distribution of Per Day Query Popularity
For each peer: (1) Select the geographical region, each with probability
conditioned on time of day as given by Figure 1.
(2) Determine whether the peer is passive or active, each with the probability conditioned on geographical region, as given by Figure 4.
(3) If the peer is passive:
(a) Choose the connected session length conditioned on time of day according to Table A.I
(4) If the peer is active:
(a) Determine the number of queries per session conditioned on geographical region according to Table A.II
(b) Determine the time until first query conditioned on the number of queries and time of day, e.g., according to Table A.III for North American peers.
(c) For each query:
(i) Determine the query interarrival time conditioned on time of day, e.g., according to Table A.IV for North American peers.
(ii) Determine the class of the query according to Table 3.
(iii) Determine the rank of the query according to the distribution of rank for the query class, e.g., according to Figure 11(a) for queries by North American peers only.
(d) Determine the time after last query conditioned on time of day according to Table A.V
Figure 12. Algorithm for generating a synthetic workload
65

[2] R. Bhagwan, S. Savage, and G. Voelker, Understanding Availability, Proc. 2nd Int. Workshop on P2P Systems, Berkeley, CA, 2002.
[3] Y. Chawathe, S. Ratnasamy, L. Breslau, N. Lanham, and S. Shenker, Making Gnutella-like P2P Systems Scalable, Proc. ACM Conf. on Applications, Technologies, Architectures, and Protocols for Computer Communication (SIGCOMM ’03), Karlsruhe, Germany, 2003.
[4] J. Chu, K. Labonte, and B.Levine, Availability and Locality Measurements of Peer-to-Peer File Systems, Proc. SPIE ITCom: Scalability and Traffic Control in IP Networks, Boston. MA, 2002.
[5] E. Cohen and S. Schenker, Replication Strategies in Unstructured Peer-to-Peer Networks, Proc. ACM Conf. on Applications, Technologies, Architectures, and Protocols for Computer Communication (SIGCOMM ’02), Pittsburgh, PA, 2002.
[6] Collab.Net and Sun Microsystems, 2003. http://www.jxta.org.
[7] Z. Ge, D. R. Figueiredo, S. Jaiswal, J. Kurose, and D. Towsley, Modeling Peer-Peer File Sharing Systems, Proc. IEEE Conference on Computer Communications (INFOCOM ‘03), San Francisco, CA, 2003.
[8] Gnutella Developer Forum, Gnutella – A Protocol for a Revolution, 2003. http://rfc-gnutella.sourceforge.net.
[9] K. Gummadi, R. Dunn, S. Saroiu, S. Gribble, H. Levy, and J. Zahorjan, Measurement, Modeling, and Analysis of a Peer-to-Peer File-Sharing Workload, Proc. 19th ACM Symp. on Operating Systems Principles, Bolton Landing, NY, 2003.
[10] MaxMind, LLC, Geotargeting IP Address, http://www.maxmind.com.
[11] A. Mahanti, D. Eager, and C. Williamson, Temporal Locality and its Impact on Web Proxy Cache Performance, Performance Evaluation 42, 187-203, 2000.
[12] Mutella Hompage. http://mutella.sourceforge.net.
[13] Napster Homepage. http://www.napster.com.
[14] S. Ratnasamy, P. Francis, M. Handley, R. Karp, and S. Shenker, A Scalable Content-Addressable Network, Proc. ACM Conf. on Applications, Technologies, Architectures, and Protocols for Computer Communication (SIGCOMM ’01), San Diego, CA., 2001.
[15] S. Saroiu, K. P. Grummadi, R. J. Dunn, S. D. Gribble, and H. M. Levy, An Analysis of Internet Content Delivery Systems, Proc. 5th Symposium on Operating Systems Design and Implementation (OSDI ’02), Boston, MA, 2002.
[16] S. Saroiu, K. Gummadi, and S. Gribble, A Measurement Study of Peer-to-Peer File Sharing Systems, Proc. Multimedia Computing and Networking (MMCN ‘02), San Jose, CA, 2002.
[17] S. Sen and J. Wang, Analyzing P2P Traffic Across Large Networks, Proc. 2nd Internet Measurement Workshop (IMW ’02), Marseilles, France, 2002.
[18] Sharman Networks Ltd., http://www.kazaa.org.
[19] I. Stoica, R. Morris, D. Karger, F. Kaashoek, and H. Balakrishnan, Chord: A Scalable Peer-to-Peer Lookup Service for Internet Applications, Proc. ACM Conf. on Applications, Technologies, Architectures, and Protocols for Computer Communication (SIGCOMM ’01), San Diego, CA, 2001.
[20] K. Sripanidkulchai, The Popularity of Gnutella Queries and its Implications on Scalability, Featured on O'Reilly's www.openp2p.com website, February 2001.
[21] StreamCast Networks, http://www.morpheus.com.
[22] B. Yang and H. Garcia-Molina, Comparing Hybrid Peer-to-Peer Systems. Proc. 27th Int. Conf. on Very Large Data Bases (VLDB ’02), Rome, Italy, 2001.
APPENDIX
0.01
0.1
1
1 10
Frac
tion
of S
essi
ons
with
#Q
ueri
es >
x
Number of Queries, x
MeasuredFitted Lognormal
0.01
0.1
1
1 10 100 1000 10000 100000
Frac
tion
of S
essi
ons
with
Tim
e >
x
Time Until First Query, x (sec)
Measured TimeFitted Weibull Body
Fitted Lognormal Tail 0.01
0.1
1
1 10 100 1000 10000Frac
tion
of Q
ueri
es w
ithIn
tera
rriv
al T
ime
> x
Interarrival Time, x (sec)
MeasuredFitted Lognormal Body
Fitted Pareto Tail
(a) Number of Queries Per Active Session (b) Time Until First Query, < 3 Queries, Peak Period
(c) Time Between Queries, Peak Period
Figure A.1. Example Fitted Distributions for Workload Measures (North American Peers)
66

Table A.1. Connected Session Duration for Passive Peers
Period of the Day and Peer Location distribution function parameters Body: 1-2 minutes (75%) Lognormal σ = 2.502 µ = 2.108 Peak for North American peers Tail: > 2 minutes (25%) Lognormal σ = 2.749 µ = 6.397 Body: 1-2 minutes (55%) Lognormal σ = 2.383 µ = 2.201 Non-peak for North American peers Tail: > 2 minutes (45%) Lognormal σ = 2.848 µ = 6.817
Table A.2. Active Session Length (number of queries per session) Geographical region Fitted distribution Matched parameters North America Lognormal σ = 1.360 µ = -0.0673 Europe Lognormal σ = 1.306 µ = 0.520 Asia Lognormal σ = 1.618 µ = -1.029
Table A.3. Time Until First Query for North American Peers
Time of day period Number of queries per session Fitted
distribution Matched parameters
Body: 0-45 seconds Weibull α = 1.477 λ = 0.005252 < 3 queries Tail: > 45 seconds Lognormal σ = 2.905 µ = 5.091 Body: 0-45 seconds Weibull α = 1.261 λ = 0.01081 3 queries Tail: > 45 seconds Lognormal σ = 2.045 µ = 6.303 Body: 0-45 seconds Weibull α = 0.9821 λ = 0.02662
Peak period for North American peers
> 3 queries Tail: > 45 seconds Lognormal σ = 2.359 µ = 6.301 Body: 64-120 seconds Weibull α = 1.159 λ = 0.01779 < 3 queries Tail: > 120 seconds Lognormal σ = 3.384 µ = 5.144 Body: 64-120 seconds Weibull α = 1.207 λ = 0.01446 = 3 queries Tail: > 120 seconds Lognormal σ = 2.324 µ = 6.400 Body: 64-120 seconds Weibull α = 0.9351 λ = 0.03380
Non-peak period for North American peers
> 3 queries Tail: > 120 seconds Lognormal σ = 2.463 µ = 7.186
Table A.4. Query Interarrival Time of North American Peers Time of day period Fitted distribution Matched parameters
Body: ≤ 103 seconds Lognormal σ = 1.625 µ = 3.353 Peak for North American peers Tail: > 103 seconds Pareto α = 0.9041 β = 103 Body: ≤ 103 seconds Lognormal σ = 1.410 µ = 2.933 Non-peak for North American
peers Tail: > 103 seconds Pareto α = 1.143 β = 103
Table A.5. Time After Last Query of North American Peers
Time of day period Number of queries per session Fitted distribution Matched parameters
1 query Lognormal σ = 2.361 µ = 4.879 2-7 queries Lognormal σ = 2.259 µ = 5.686 Peak for North American peers > 7 queries Lognormal σ = 2.145 µ = 6.107 1 query Lognormal σ = 2.162 µ = 4.760 2-7 queries Lognormal σ = 2.156 µ = 5.672 Non-peak for North American peers > 7 queries Lognormal σ = 2.286 µ = 6.036
67


![Query Processing Over Peer-To-Peer Data Sharing Systems · ing a distributed data structure called Distributed Hash Table (DHT) [9, 10, 11] which supports a hash-table like interface](https://static.fdocuments.us/doc/165x107/5e7ab388f056171060776001/query-processing-over-peer-to-peer-data-sharing-systems-ing-a-distributed-data-structure.jpg)