CHARACTERIZING THE GENETIC VARIATION IN SEVEN SPECIES …
90
CHARACTERIZING THE GENETIC VARIATION IN SEVEN SPECIES OF DECIDUOUS NATIVE AZALEAS AND IDENTIFYING THE MECHANISM OF AZALEA LACEBUG RESISTANCE IN DECIDUOUS AZALEA by MATTHEW RANDOLPH CHAPPELL (Under the direction of Dr. Carol Robacker) ABSTRACT Despite the ecologic and economic importance of native deciduous azaleas (Rhododendron spp. section Pentanthera), our understanding of interspecific variation of North American deciduous azalea species is limited. Furthermore, little is known concerning intraspecific or interpopulation genetic variation. The present study addresses questions of genetic diversity through the use of amplified fragment length polymorphism (AFLP) analysis. Twenty-five populations of seven species of native azalea were analyzed using three primer pairs that amplified a total of 417 bands. Based on analysis of molecular variance (AMOVA) and estimates of Nei’s coefficients of gene diversity (H S , H T , and G ST ), the majority of variation in deciduous azalea occurs within populations. Both among species and among population variation was low, likely the effect of common ancestry as well as frequent introgression among members (and populations) of section Pentanthera. The majority of populations were grouped into species based on Nei’s unbiased genetic distances viewed as a UPGMA phenogram. The significance of these results is discussed in relation to breeding in section Pentanthera. In addition to the lack of information concerning genetic variation in North American native azaleas, little is known concerning the insect-plant interaction between the primary azalea pest in the United States,
Transcript of CHARACTERIZING THE GENETIC VARIATION IN SEVEN SPECIES …

CHARACTERIZING THE GENETIC VARIATION IN SEVEN SPECIES OF DECIDUOUS NATIVE AZALEAS AND IDENTIFYING THE MECHANISM OF AZALEA LACEBUG
RESISTANCE IN DECIDUOUS AZALEA
by
MATTHEW RANDOLPH CHAPPELL
(Under the direction of Dr. Carol Robacker)
ABSTRACT
Despite the ecologic and economic importance of native deciduous azaleas
(Rhododendron spp. section Pentanthera), our understanding of interspecific variation of North
American deciduous azalea species is limited. Furthermore, little is known concerning
intraspecific or interpopulation genetic variation. The present study addresses questions of
genetic diversity through the use of amplified fragment length polymorphism (AFLP) analysis.
Twenty-five populations of seven species of native azalea were analyzed using three primer pairs
that amplified a total of 417 bands. Based on analysis of molecular variance (AMOVA) and
estimates of Nei’s coefficients of gene diversity (HS, HT, and GST), the majority of variation in
deciduous azalea occurs within populations. Both among species and among population variation
was low, likely the effect of common ancestry as well as frequent introgression among members
(and populations) of section Pentanthera. The majority of populations were grouped into species
based on Nei’s unbiased genetic distances viewed as a UPGMA phenogram. The significance of
these results is discussed in relation to breeding in section Pentanthera. In addition to the lack of
information concerning genetic variation in North American native azaleas, little is known
concerning the insect-plant interaction between the primary azalea pest in the United States,

azalea lace bug (ALB) (Stephanitis pyrioides Scott), and deciduous azalea. Azaleas are
largely resistant to predation by insects, with the exception of ALB. Within deciduous azalea
(Rhododendron section Pentanthera) varying levels of resistance to ALB is observed with a
continuous distribution from susceptible to highly resistant. In this study, epicuticular leaf wax
from two ALB resistant [R. canescens Michaux and R. periclymenoides (Michaux) Shinners] and
two ALB susceptible (‘Buttercup’ and ‘My Mary’) deciduous azalea genotypes was extracted
and re-applied to fresh azalea foliage. Leaf wax extracted from ALB resistant genotypes and
applied to ALB susceptible genotypes conferred a high level of resistance to ALB feeding and
oviposition. Conversely, leaf wax extracted from ALB susceptible genotypes and applied to ALB
resistant genotypes conferred susceptibility to ALB resistant genotypes. The results indicate that
leaf wax serves as a primary mechanism of resistance of deciduous azalea to ALB.
INDEX WORDS: AFLP markers, Rhododendron spp., deciduous azalea, among population
diversity, within population diversity, AMOVA, phenogram, epicuticular wax, insect resistance,
chloroform wax extraction

CHARACTERIZING THE GENETIC VARIATION IN SEVEN SPECIES OF DECIDUOUS
NATIVE AZALEAS AND IDENTIFYING THE MECHANISM OF AZALEA LACEBUG
RESISTANCE IN DECIDUOUS AZALEA
by
MATTHEW RANDOLPH CHAPPELL
B.S., Virginia Tech, 1998 M.S., Virginia Tech, 2001
A Dissertation Submitted to the Graduate Faculty of The University of Georgia in Partial Fulfillment of the Requirements of the Degree
DOCTOR OF PHILOSOPHY
ATHENS, GA 2007

©2007 Matthew Randolph Chappell
All Rights Reserved

CHARACTERIZING THE GENETIC VARIATION IN SEVEN SPECIES OF DECIDUOUS
NATIVE AZALEAS AND IDENTIFYING THE MECHANISM OF AZALEA LACEBUG
RESISTANCE IN DECIDUOUS AZALEA
by
MATTHEW RANDOLPH CHAPPELL
Major Professor: Carol Robacker
Committee: Bodie Pennisi Kris Braman Paul Raymer Jerry Johnson
Electronic Version Approved: Maureen Grasso Dean of the Graduate School The University of Georgia May 2007

iv
DEDICATION
I would like to dedicate this work to two individuals.
The first is my grandfather and friend, George Randolph Chappell. I can not list the contributions
that he has made to my life, as I would surely run out of space! I only hope that I am able to
become half the man that he is.
Second is my mother, Mary Williams, who has given me guidance and support throughout my
many years as a student. I will never forget the times we spent at the Appomattox Regional
Library looking at books and deciding what direction I should take in my life’s work. It is
amazing to look back on where this journey started and how we have both grown over the years.
One thing has been constant though, you have always been there for me. I will never forget that
and am grateful to have such a wonderful mother and friend.

v
ACKNOWLEDGEMENTS
The Father, Son, and Holy Spirit for getting my attention and keeping me going even when I
didn’t necessarily want to lumber on.
My family who have pushed me since a young age to work hard and reach towards my goals
with determination and persistence. I wouldn’t have made it this far without each and every one
of you.
My beautiful wife, Sarah Lynn Parker-Chappell, who never fails to bring joy to my life and look
at the bright side of life. You have put up with many long evenings waiting for me to get home
and many less than exciting tales of research and work issues.
Carol Robacker, who has allowed me to disappear for long stretches without sending a search
party and has eliminated several words from my vocabulary that don’t belong in manuscripts.
Then there are all the little things that I don’t have space to list; the usual motherly contributions!
My advisory committee and especially Bodie Pennisi: you all have spent valuable time cleaning
up my manuscripts, CVs, powerpoints, etc. I also thank you for your valuable input in making
decent research projects into much more solid studies.

vi
Allen Byous and Sherrod Baden for keeping field and greenhouse plants alive and assisting in
counting bug poop and eggs! Nancy Mobley and Martha Coffey for keeping me on the payroll
(very important!) and handling paperwork for which I am wholly and utterly confused by.
Noelle Barkley, Zhenbang Chen, Rob Dean, Vic Capo-Chichi, and Tracie Jenkins for allowing
me to use each of your laboratories and teaching me everything I would ever want to know about
AFLP, from DNA extraction through data analysis. Without your help I would have been
completely lost!
Orville Lindstrom for allowing me to use your laboratory and for the insights into physiology
(and psychology for that matter!).
The NFL (noontime futbol league) gals and guys for allowing me to join the gang and relieve
stress. My backside would be larger and my stress level higher without you all!
There are many more persons, hundreds actually, who have contributed not only to this project
but also to keeping me sain throughout my time at UGA. You all know your contributions and I
thank you all.
Peace be with you all,
Matthew Randolph Chappell

vii
TABLE OF CONTENTS
Page
ACKNOWLEDGEMENTS……………………………………………………………………….v LIST OF TABLES…………………………………………………………………………...…...ix LIST OF FIGURES……………………………………………………………………………….x CHAPTER
1 INTRODUCTION AND LITERATURE REVIEW………………………...……1
PURPOSE OF STUDIES…………………………………………………2
AMPLIFIED FRAGMENT LENGTH POLYMORPHISM ANALYSIS
OF DECIDUOUS AZALEA……………………………………………...3
AZALEA LACE BUG (INSECT) - DECIDUOUS AZALEA (HOST)
INTERACTION………………………………………………………….11
LITERATURE CITED…………………………………………………..14
2 ASSESSING THE GENETIC DIVERSITY OF SEVEN DECIDUOUS AZALEA
SPECIES (RHODODENDRON SPP. SECTION PENTANTHERA) NATIVE TO THE EASTERN UNITED STATES ……………………………………………22
ABSTRACT……………………………………………………………..23 INTRODUCTION……………………………………………………….24 MATERIALS AND METHODS………………………………………..27 RESULTS AND DISCUSSION…………………………………………31 LITERATURE CITED…………………………………………………..42

viii
3 IDENTIFICATION OF THE MECHANISM OF AZALEA LACEBUG RESISTANCE IN DECIDUOUS AZALEA…………………………………….52
ABSTRACT……………………………………………………………..53 INTRODUCTION……………………………………………………….54 MATERIALS AND METHODS………………………………………..56 RESULTS AND DISCUSSION…………………………………………59 LITERATURE CITED…………………………………………………..66
4 CONCLUSIONS………………………………………………………………..74
LITERATURE CITED………………………………………………….77
ix
LIST OF TABLES
Page
Table 2-1. Locations of deciduous azalea populations collected, grouped by species………… 46
Table 2-2. List of adaptors and primers screened and used in this study to characterize the
amplification fragment length polymorphism (AFLP) band patterns in seven
Rhododendron spp……………………………………………………………………… 47
Table 2-3. Percentage of polymorphic loci, average genetic diversity within populations (HS),
average genetic diversity within species (HT), and proportion of species genetic diversity
attributed to among population variation (GST) for seven species of Rhododendron section
Pentanthera……………………………………………………………………………... 48
Table 2-4. Analysis of molecular variation (AMOVA) for seven Rhododendron spp. included in
this study………………………………………………………………………………... 49
Table 2-5. Nei's unbiased measures of genetic distance (Nei, 1978) below diagonal and
geographic distance (km) above diagonal………………………………………………. 50
Table 3-1. Numbers of surviving adult azalea lace bugs, frass spots, and eggs on azalea foliage
treated with epicuticular wax extract from resistant (R. periclymenoides, R. canescens) or
susceptible ('Buttercup', 'My Mary') azalea foliage…………………………………….. 69
Table 3-2. Degrees of freedom, mean difference, standard deviation, t-value, and probability of t
values for pairwise comparison of frass deposition and oviposition counts on treated
versus untreated sides of azalea foliage……………………………………………….... 71

x
LIST OF FIGURES
Page
Figure 2-1. The unrooted UPGMA phenogram of Nei’s unbiased genetic distance matrix (Nei,
1978) over all 25 populations surveyed……………………………………………….... 51
Figure 3-1. Deciduous azaleas showing azalea lace bug feeding damage and frass deposition.. 72
Figure 3-2. Scanning electron micrographs of azalea lace bug susceptible cultivar ‘Buttercup’
foliage treated with wax solution of R. periclymenoides (panel A and C) and control
micrographs of non-treated ‘Buttercup’ foliage (panel B and D)………………………. 73

1
CHAPTER 1
INTRODUCTION AND LITERATURE REVIEW

2
PURPOSE OF STUDIES
Deciduous azalea species (Division: Magnoliophyta; Class: Magnoliopsida; Subclass
Dilleniidae; Order: Ericales; Family: Ericaceae; Genus: Rhododendron; Section: Pentanthera) are
indigenous to the eastern United States from southeastern Canada to central Florida and to east
Texas. The deciduous azalea is an outstanding spring-summer blooming woody ornamental crop,
and along with the evergreen azaleas (Rhododendron series Azalea), is a staple plant in
southeastern U.S. landscapes (Gallee, 1987). For more than a century, researchers have been
addressing genetic diversity within North American native deciduous azaleas (Rhododendron
spp. section Pentanthera) through studies of chromosomes, morphology, introgression,
interspecific hybridization, flavanoids, isozymes, chloroplast and ribosomal DNA, and recently
molecular markers. However to date no study has utilized total genomic analysis to determine
the level of genetic diversity among deciduous azalea species. Furthermore, no study has
addressed among population genetic diversity or within population genetic diversity within a
single species of deciduous azalea. Additionally, the insect-plant interaction between Stephanitis
pyrioides Scott (azalea lace bug) and both deciduous and evergreen azalea has been examined
via screening of cultivars for resistance to insect damage and correlations of chemical
compounds of epicuticular wax with resistance in azalea genotypes. However, to date no study
has conclusively determined the mechanism of azalea lace bug resistance in azalea.
The overall goal of this dissertation is to address the two aforementioned topics that are
of vast importance to azalea breeders and conservationists. In the first project, amplified
fragment length polymorphism (AFLP) fingerprint analysis will be used to measure genetic
diversity among and within seven species of deciduous azalea indigenous to the eastern United
States. Physical observations among the various species and populations within a species have

3
revealed morphologic differences among species, among populations within a species, and
between plants of the same population. Though differences have been observed, the question
remains, how much genetic difference is there within the aforementioned groups? In the second
project, the assumption that epicuticular leaf wax mediates resistance to azalea lace bug will be
examined. Epicuticular leaf wax will be extracted from resistant and susceptible genotypes and
re-applied to fresh azalea foliage. Thereafter, azalea lace bugs will be introduced to the treated
azalea foliage and insect behavior documented via quantifying survivability, feeding, and
fecundity.
AMPLIFIED FRAGMENT LENGTH POLYMORPHISM ANALYSIS OF DECIDUOUS
AZALEA
Taxonomy of Rhododendron spp. sect. Pentanthera. Rhododendron spp. section Pentanthera
includes sixteen species of deciduous azalea: R. alabamense Rehder, R. arborescens (Pursh)
Torrey, R. atlanticum Ashe, R. austrinum (Small) Rehder, R. calendulaceum (Michaux) Torrey,
R. canadense (L.) Torrey, R. canescens (Michaux) Sweet, R. cumberlandense Braun, R.
eastmanii Kron & Creel, R. flammeum (Michaux) Sargent, R. luteum Sweet, R. occidentale
Torrey & Gray, R. periclymenoides (Michaux) Shinners, R. prinophyllum (Small) Millais, R.
prunifolium (Small) Millais and R. viscosum (L.) Torrey. All species with the exception of R.
luteum and R. occidentale are native to the eastern United States, primarily east of the
Mississippi River. R. occidentale is native to California and southwestern Oregon and R. luteum
is native to Poland, Turkey, Slovenia, and the southern states of the former Soviet Union.

4
Chromosome and breeding studies. Chromosome studies by Sax (1930) and Li (1957), in
conjunction with early studies on interspecific hybridization and geographic distributions, were
the initial push toward determining the relatedness of species within the genus Rhododendron.
Scharff (1911) first described the probable introduction and migration of deciduous azaleas to
North America from Asia, via the Bering Strait, in the early Tertiary to Pre-Pliocene periods. The
interesting and confounding issue is that over the 5+ million years since this period, little to no
change has occurred in chromosome number or chromosome morphology. Therefore, it is
assumed that members of Rhododendron spp. section Pentanthera are very stable. This
hypothesis was corroborated first by W.H. Judd who reported in 1915 successful interspecific
hybridization between the geographically isolated diploid species R. occidentale (California-
Oregon) and the tetraploid R. calendulaceum (North Carolina-Georgia) and later by Wilson and
Rehder (1921) who reported a successful cross between R. luteum (Eastern Europe) and R.
canadense (Eastern Canada-Northeast United States) in 1938.
Sax (1930) examined chromosome stability in the genus Rhododendron, specifically the
species R. roseum (now R. prinophyllum), R. viscosum, R. calendulaceum, and R. arborescens.
Results indicated that, based on chromosome morphology of species and interspecific hybrids,
these species were closely related. This was true even in the tetraploid species R. calendulaceum
which freely hybridized with diploid genotypes via unreduced gametes (pollen and egg). Li
(1957) assessed chromosome numbers and morphology in 15 species of Rhododendron spp.
series Azalea and determined that while enough variability exists in chromosome morphology to
differentiate between species, interspecific hybridization occurred freely. It was therefore
postulated that species identity was maintained not through interspecific incompatibility but
rather through geographic isolation and temporal patterns of flowering.

5
Early research conducted by Rehder (1921), Wherry (1943), Skinner (1961), and Galle
(1967) directly addressed questions concerning the relationship of various species and cultivars
found both in the U.S. and abroad. The majority of their research was conducted by assessment
of morphological features of known species or by observing interspecific hybridization in
cultivation and drawing conclusions of relatedness based upon morphological characteristics of
the progeny. The quandary in using interspecific hybridization and morphological characteristics
of progeny to determine taxonomic and/or genetic relationships lies in the fact that within
Rhododendron spp. Sect. Pentanthera, species have the ability to freely interbreed and
morphologic traits are often identical between species. This phenomenon is well documented,
especially in the eastern United States, where interspecific hybridization often occurs where two
species overlap in geographic distribution. The result is a hybrid swarm, with individuals that
may morphologically resemble one parent with the exception of one or a few minor traits (Kron
et al., 1993).
Bioassay and DNA studies in azalea. The first research directed at deducing relationships
among deciduous azalea species using laboratory methods was conducted by King (1977) who
analyzed flavanoid content of R. canescens, R. austrinum, R. speciosum (now R. flammeum), and
hybrids between the three species. The goals of the study were to characterize leaf flavanoids of
the three species and hybrids and to utilize flavanoid differences to differentiate between
naturally occurring populations. This study was successful in that the progeny of crosses among
these species had variable and distinguishable flavanoid contents, allowing for a distinction
among species and evidence into parentage of hybrids.
Kron et al. (1993) successfully employed the use of chloroplast DNA markers to
distinguish two species of deciduous azalea, R. canescens and R. flammeum, and also to measure

6
introgression in a hybrid swarm located at Stone Mountain, GA. The choice of species allowed
the researchers to use morphological markers to confirm results, as the two species are distinct in
traits such as flowering time, flower color, flower size, plant habit, pod size, and leaf
characteristics. The use of chloroplast DNA to differentiate between the two species was critical,
as it is not diluted by repeated backcrossing and hence is valuable in constructing a parental
lineage in highly backcrossed progeny. Results of this study verify the value of DNA studies to
distinguish between species of deciduous azaleas. In the hybrid population of R. canescens and
R. flammeum, hybridization and introgression were confirmed in more than 75% of the surveyed
individuals. While most of the individuals surveyed were morphologically indistinguishable
from R. flammeum, these same individuals contained chloroplast DNA patterns of R. canescens,
suggesting introgression of R. canescens into R. flammeum.
Randomly amplified polymorphic DNA, introduced in 1990 by Williams et al., was
quickly adapted as a valuable tool for analyzing genetic similarities and/or differences among
plants. RAPD analysis is useful in this regard as it has the power to identify polymorphisms, or
small changes in DNA composition. These polymorphisms can be used to identify genetic
distance between genes or to calculate the relatedness of two or more genotypes. Iqbal et al.
(1995) used RAPD analysis to discern genetic relatedness of thirteen deciduous Rhododendron
spp. and to test if RAPD analysis of Rhododendron spp. reflected their true genetic relationship.
Results indicated that RAPD analysis is a valuable tool for discerning genetic relatedness in
Rhododendron, as RAPD data plotted using cluster analysis grouped species and cultivars as
predicted based upon origin and known pedigree.
Scheiber et al. (2000), using an innovative procedure, sequenced the internal transcribed
spacer (ITS) region of sixteen deciduous azalea species in an effort to group species based upon

7
genetic similarity. The ITS region is unique in that it is transcribed yet untranslated, therefore
postulated to change freely via deletion or addition without altering gene products. Hence,
molecular evolution studies have embraced this genomic region as a means of both classifying
closely related species and tracking evolution of a species. The results of this study were
promising, as bootstrap analysis concurred with previous studies in grouping of species within
Rhododendron section Pentanthera. While this was a very successful study in ascertaining
genetic differences between species at the base level, little variation occurred in sequence,
ranging from 0.00 to 1.67%. Additionally, only a single region of the genome was observed.
Both of these factors point to the need for further examination of the entire genome to deduce
genetic differences, thereby increasing the likelihood of identifying significant genetic variation.
AFLP background and technique. Studies in reproductive biology, geographic distribution,
morphology, ontogeny, pedigree, breeding behavior, chromosome structure and behavior,
morphological markers, and protein markers have provided valuable information on relatedness
in azalea, yet none survey the total genomic DNA of a single individual or individuals within a
population or species. In this study, a procedure was needed that could deduce genomic
differences at the base level over the entire genome. Amplified fragment length polymorphism
(AFLP) DNA fingerprint analysis is currently a premier method of discerning genetic
relationships based upon genetic sequence and surveys total genomic DNA. AFLP has been used
to characterize genetic diversity within many genera of plants including Arabadopsis, Hordeum,
Calycophyllum, Camellia, Manihot, Gossipyum, Physalis, Helianthus, Zea, Pinus, Solanum,
Oryza, Salix, Glycine, and Triticum. The basic theory of AFLP is the amplification of restriction
digested DNA using Polymerase Chain Reaction (PCR) technology with directed primers (Vos et
al., 1995).

8
AFLP has several advantages compared to the molecular methods of restriction fragment
length polymorphism (RFLP), random amplified polymorphic DNA (RAPD), and microsatellites
(SSR). The main advantage is the large number of polymorphisms that are generated by the
AFLP method. For example, Barker et al. (1999) found 170 polymorphic bands with 20 RAPD
primers in Salix, yet using 4 AFLP primers found 645 polymorphic bands. This high level of
polymorphism detection is essential, especially within a population of deciduous azaleas, due to
high levels of genetic homogeneity between individuals (Scheiber et al., 2000). Nearly of equal
importance in this study is the ability to use AFLP to assess genetic diversity when no sequence
information is available, as is the case with the species included in this study.
Yet another advantage is the speed of this technique, due to the use of PCR in
amplification of DNA fragments and the high multiplex ratio, or number of different genetic loci
that may be simultaneously analyzed per experiment. The high multiplex implies that the entire
genome is being sampled for differences rather than a single segment, as is the case with RFLP
and SSR analysis. The final advantage of the AFLP technique is a high level of reproducibility.
RFLP and RAPD results are difficult to reproduce and this problem can lead to inconclusive
results. For example, Winfield et al. (1998), in an AFLP analysis of Black Poplar, found that
over five trials, banding patterns were 97.6% to 100% similar.
Inherent problems are associated with any technique, and AFLP is no different. High cost
can be limiting when working with a large number of samples (plants). Determination of
appropriate restriction enzyme and primers can also be difficult. The choice of restriction
enzyme and primer will directly affect the number of polymorphisms detected. In Hordeum spp.,
Ridout and Donini, (1999) determined that the restriction enzyme combination PstI/MseI yielded
better polymorphism detection than EcoRI/MseII. The same has held true for peanut, Abelia, and

9
wheat (Melanie Newman, personal comm..). Qi and Lindhout (1997) discovered that at the
species level, [adapter] + 2 primers amplify too many bands and [adapter]+4 primers amplify too
few bands. They found that while [adapter] + 3 primers is the best choice for polymorphism
detection, choice of adapters varies by genus or species. Since the plant genome is AT rich, the
use of AT poor primers may reduce polymorphism detection. To alleviate this problem, we have
sampled [adapter] + primer sets to find the best combinations. Several major corporations
(Applied Biosystems and Qiagen), in conjunction with public institutions, have published base
protocols that are in agreement. The majority of published protocols employ EcoRI/MseI and
primer +3, as this modus operandi has been effective in a majority of plant species studied.
The issue of dominance of AFLP has been debated, though researchers now concur that
AFLP markers are a dominant marker. Therefore, when scoring the bands produced in an AFLP
study, each band is scored as present or absent (1 or 0), with no intermediate. This raises the
question of how faint bands (thought to be heterozygotes) are scored. Castiglioni et al. (1999)
suggested that heterozygotes be identified based upon intensity of the bands or peaks on AFLP
gels. A heterozygote would have a band half as intense as a homozygote. Vos et al. (1995)
argued against this by stating that the AFLP technique is insensitive to template DNA
concentration, with similar band intensities seen using a range of DNA concentrations. Three
solutions for this problem have been proposed. The first is to increase sample size 2-10 fold
when using a dominant marker technique. The second solution is inherently a part of the AFLP
technique, as the problem of dominance can be overcome due to the high number of
polymorphisms detected (Castiglioni et al. 1999). The final solution is to employ fluorescent tags
and set a threshold value to use as a definition of presence or absence (ABI, 2004).

10
AFLP in Rhododendron. In Rhododendron, the first published AFLP study was conducted by
Reik et al. (1999) who analyzed a collection of 75 Belgian pot azaleas for genetic conformity.
Pedigree information was available for 34 cultivars, which allowed for AFLP results to be
checked for accuracy. Using three primer combinations, 648 fragments were scored ranging from
70 to 450 base pairs. Primer combinations were fluorescently labeled to increase multiplex ratio
and internal size standards were added to each gel lane to enable automated scoring of each
fragment arising from each primer combination. Eight additional data subsets were constructed
by setting differing marker selection thresholds, accomplished by adjusting the fluorescence
detection levels within the automated detection device. Pairwise plant genetic similarity was
attained for the nine data sets using the two most popular statistical models in use, the Simple
Matching coefficient (symmetrical, including double zeros) and Jaccard coefficient
(asymmetrical, excluding double zeros). These two methods were compared for accuracy and
checked against known pedigree information for reliability. The use of a Simple Matching
coefficient with little or no selection to signal intensity and excluding rare and abundant markers
garnished the best correlation with known pedigree information.
Riek et al. (2000) expanded on the aforementioned 1999 study in which AFLP was used
to ascertain genetic relatedness in azalea. In this study, plant material consisted of ten seedlings
from 33 natural or semi-wild populations as well as 75 accessions from a breeder’s collection (4
Hirado, 7 Krume, 55 Belgin pot azaleas, and 9 related Rhododendron species from the Tsutsusi
subgenus). The goal of the study was to assess the genetic conformity between the breeder’s pool
of azaleas and the native Chinese populations that are postulated as being the original source of
germplasm for current hybrids. Two approaches were used in answering this question: ordination
analysis that includes clustering and principal co-ordinate analysis, and analysis of molecular

11
variance (AMOVA). Each of these methods use pairwise similarity or distance matrix as input
data and were calculated on an individual plant basis using presence/absence of AFLP bands as
well as on a population basis by AFLP marker frequency. The calculation of similarity or
distance measures using ordination analysis allowed the researchers to directly measure the
genetic relatedness of each native population and the cultivated hybrids. The use of AMOVA
analysis allowed the researchers to simultaneously estimate the source of genetic variation within
and between pools of plants at different levels (individuals, subpopulations, populations, or
multiple populations), which added an extra dimension to the study and also served to
corroborate results from the ordination analysis. The use of these two analyses was successful in
determining genetic relatedness of genotypes and native populations and linking current hybrids
to likely ancestors.
AZALEA LACE BUG (INSECT) - DECIDUOUS AZALEA (HOST) INTERACTION
Azalea lace bug and effects on azalea. Since its introduction from Japan in 1915, azalea lace
bug (ALB) has become a significant pest on azalea throughout North America (Drake and
Ruhoff, 1965; Weiss 1916). ALB damage occurs from late spring until leaf drop, with up to four
generations occurring in a single growing season in the southern United States (Neal and
Douglass, 1988). Adult and nymphal ALB feed on the abaxial leaf surface by inserting stylets
into stomata (Ishihara and Kawai, 1981). Cell contents, principally chloroplasts, are removed
from the mesophyll layer. The resulting damage is visible as a tan speckling on foliage of
susceptible species and cultivars. Cast skins of nymphs and brown to black frass deposition
further discolor foliage (Braman and Pendley, 1992; Buntin et al., 1996; Ishihara and Kawai,
1981; Mead, 1967).

12
Azalea lace bug bioassays. Bioassays performed by Braman and Pendley (1992) found the
deciduous R. canescens and R. prunifolium (Small) Millais to be resistant whereas the evergreen
cultivar ‘Delaware Valley White’, a selection of R. indica var. alba, was susceptible. Further
work by Wang et al. (1998) evaluated four cultivars and eleven deciduous species selections and
found R. periclymenoides, R. canescens, and R. prunifolium to be highly resistant and R.
serrulatum (Small) Ahles and R. viscosum (L.) Torrey to be moderately resistant to ALB.
Moderately susceptible to very susceptible species included R. arborescens (Purch) Torrey, R.
austrinum (Small) Rehder, and R. oblongifolium (Small) Millais. Susceptible cultivars included
‘Buttercup’, a R. austrinum selection; ‘My Mary’, a complex hybrid of [(R. atlanticum (Ashe)
Rehd. x R. periclymenoides) x R. austrinum seletion]; and ‘Nacoochee’, a R. atlanticum x R.
periclymenoides hybrid.
Plant cuticle and epiculticular leaf wax. The principle functions of the plant cuticle are to
prevent excessive water loss and protect the leaf surface from insect and pathogen damage
(Hopkins, 1995). The epicuticular wax layer of the cuticle consists primarily of long-chain
aliphatic compounds derived from fatty acid chains. This wax layer is deposited on the leaf
surface as amorphous intracuticular wax embedded in cutin polymers, as well as wax
crystalloids. Epicuticular wax components include alkanes, primary and secondary alcohols,
ketones, and wax esters (Eigenbrode and Espelie, 1995; Knust and Samuels, 2003). Epicuticular
wax has been recognized as a deterrent to feeding and oviposition by herbivorous insects as well
as an attractant of beneficial (often predatory) insects (Eigenbrode and Espelie, 1995). Specific
examples of epiculticular wax-herbivore interactions have been identified and characterized in
Allium cepa L. (Molenaar, 1984), Brassica rapa L. (Bodnaryk, 1992; Srinivasachar and Malik,
1972), Eucalyptus globulus Labill (Brennan and Weinbaum, 2001), Glycine max L. (Baker et al.,

13
1985), Hordeum vulgare L. (Tsumuki et al., 1989), Sorghum bicolor (L.) Moench (Chapman et
al., 1983; Nwanze et al., 1992; Weibel and Starks, 1986), and Triticum aestivum L. (Lowe et al.,
1985).
Specific wax compounds linked to resistance/susceptibility. In azalea, through the use of gas
chromatography-mass spectrometry, specific lipid components of epicuticular wax have been
implicated in ALB resistance and susceptibility (Balsdon et al., 1995; Wang et al., 1999).
Research by Balsdon et al. (1995), analyzing lipid components of four susceptible evergreen
cultivars (‘Delaware Valley White’, ‘Hino Crimson’, ‘President Clay’, and ‘Higasa’) and the
resistant species R. canescens, identified three triterpenoid components that may have an effect
on ALB behavior; ursolic acid, β-amyrin and α-amyrin. However, data were not definitive as
purported deterrent/stimulant compounds were found in similar concentrations in both R.
canescens and the susceptible cultivars. Wang et al. (1999) identified lipid components
correlated with ALB resistance and susceptibility in two deciduous resistant genotypes, four
deciduous susceptible genotypes, and one evergreen susceptible azalea genotype. The lipid
component present in the largest proportion among resistant genotypes was n-Henrtriacontane
whereas in susceptible genotypes α- and β-amyrin were in greatest concentrations. When
comparing the two studies, it is of note that α- and β-amyrin are described as a stimulant to ALB
by Baldson et al. (1995) and conversely a deterrent by Wang et al. (1999). This discrepancy in
findings is puzzling and while these studies suggest an association of leaf-surface lipids with
ALB response, studies to quantify the actual effects of lipids on ALB behavior have not been
conducted. The research described in this paper investigates the quantitative effects of leaf-
surface lipids from susceptible and resistant foliage on ALB survival, feeding, and oviposition

14
and will address if epicuticular leaf wax is indeed a mechanism of ALB resistance/susceptibility
in azalea.
LITERATURE CITED
Ahman, I. 1990. Plant-surface characteristics and movements of two brassica-feeding aphids,
Lipaphis erysimi and Brevicoryne brassicae. Symp. Biol. Hung. 39:119-125.
Baker, D., M. Rangappa, and P.S. Benepal. 1985. Comparitave leaf morphology of soybean
genotypes resistant and susceptible to Mexican bean beetle defoliation. Soybean Genet.
Newsl. 15:114-115.
Balsdon, J.A., K.E. Espelie, and S.K. Braman. 1995. Epicuticular lipids from azalea
(Rhododendron spp.) and their potential role in host plant acceptance by azalea lace bug,
Stephanitis pyrioides (Heteroptera: Tingidae). Biochem. Syst. Ecol. 23:477-485.
Barker, J.H., M. Matthes, G.M. Arnold, K.J. Edwards, I. Ahman, S. Larson, and A. Karp. 1999.
Characterization of Genetic Diversity in Potential Biomass Willows (Salix spp.) by
RAPD and AFLP Analyses. Genome, 42: 173-183.
Beismann, H., J.H.A. Barker, A. Karp, and T. Speck. 1997. AFLP analysis sheds light on
distribution of two Salix species and their hybrid along a natural gradient. Mol. Ecology,
6: 989-993.
Bernays, E.A., R.F. Chapman, and S. Woodhead. 1983. Behavior of newly hatched larvae of
Chilo partellus (Swinhoe) (Lepidoptera: Pyralidae) associated with their establishment in
the host-plant sorghum. Bull. Entomol. Res. 73:75-83.

15
Bernays, E.A., S. Woodhead, and L. Haines. 1985. Climbing by newly hatched larvae of the
spotted stalk borer Chilo partellus to the top of sorghum plants. Entomol. Exp. Appl.
39:73-79.
Bodnaryk, R.P. 1992. Leaf epicuticular wax, an antixenotic factor in Brassicaceae that affects the
rate and pattern of feeding of flea beetles Phyllotreta cruciferae (Goeze). Can. J. Plant
Sci. 72:1295-1303.
Braman, S.K. and A.F. Pendley. 1992. Evidence for resistance of deciduous azaleas to azalea
lace bug. J. Environ. Hort. 10:40-43.
Brennan, E.B. and S.A. Weinbaum. 2001. Effect of epicuticular wax on adhesion of psyllids to
glaucous juvenile and glossy adult leaves of Eucalyptis globules Labillardiere. Austral. J.
Entomol. 40:270-277.
Buntin, G.D., S.K. Braman, D.A. Gilbertz, and D.V. Phillips. 1996. Chlorosis, photosynthesis,
and transpiration of azalea leaves after azalea lace bug (Heteroptera: Tingidae) feeding
injury. J. Econ. Entomol. 89: 990-995.
Castiglioni, P., P. Ajmone-Marsan, R. van Wijk and M. Motto. 1999. AFLP Markers in a
Molecular Linkage Map of Maize: Co-dominant Scoring and Linkage Group
Distribution. Theor. And Appl. Gene, 99: 425-431.
Chapman, R.F., S. Woodhead, and E.A. Bernays. 1983. Survival and dispersal of young larvae of
Chilo partellus (Swinhoe) (Lepidoptera: Pyralidae) in two cultivars of sorghum. Bull.
Entomol. Res. 73:65-74.
Davidian H.H., 1995, The Rhododendron Species. Volume IV. Azaleas. Timber Press, Portland,
Oregon.

16
Diaz, V., L.M. Muniz, and E. Ferrer. 2001. Random Amplified Polymorphic DNA and
Amplified Fragment Length Polymorphism Assessment of Genetic Variation in
Nicaraguan Populations of Pinus ocarpa. Mol. Ecology, 10: 2593-2603.
Drake, C.J. and F.A. Ruhoff. 1965. Lacebugs of the world: a catalog (Hemiptera: Tingidae). U.S.
Nat. Mus Bull. 213.
Eigenbrode, S.D. and K.E. Espelie. 1995. Effects of plant epicuticular lipids on insect
herbivores. Annu. Rev. Entomol. 40:171-194.
Escaravage, N., S. Questiau, A. Pornon, B. Doche, and P. Taberlet. 1998. Clonal Diversity in a
Rhododendron ferrugineum L. (Ericaceae) Population Inferred from AFLP Markers. Mol.
Ecology, 7: 975-982.
Excoffier, L., P.E. Smouse, and J.M. Quattro. 1992. Analysis of Molecular Variance Inferrred
from Metric Distances among DNA Haplotypes: Application to Human Mitochondrial
DNA Restriction Data. Genetics, 131: 479-491.
Galle, F.C. 1967. Native and Some Introduced Azaleas for Southern Gardens: Kinds and Culture.
Amer. Hort. Mag., 46: 13-23.
Gallee, F.C. 1987. Azaleas. Timber Press, Portland OR.
Harris, S.A. 1999. RAPDs in systematics-A useful methodology? In: Hollingsworth PM,
Bateman RM, Gornall RJ (eds.). Molecular Systematics, Plant and Evolution. Taylor and
Francis, London, pp. 221-228.
Hopkins, W.G. 1995. Introduction to Plant Physiology. John Wiley and Sons, Inc., New York,
NY.

17
Iqbal, M.J., D.W. Paden, and A.Lane-Rayburn. 1995. Assessment of Genetic Relationships
among Rhododendron Species, Varieties, and Hybrids by RAPD Analysis. Scientia Hort,
63: 215-223.
Ishihara, R. and S. Kawai. 1981. Feeding habits of the azalea lace bug, Stephanitis pyrioides
Scott (Hemiptera: Tingidae). Jpn. J. Appl. Entomol. Zool. 25:200-202.
Johnson, W.T. and H.H. Lyon. 1991. Insects that feed on trees and shrubs. Cornell Univ. Press,
Ithica, NY.
King, B.L. 1977. Flavonoid Analysis of Hybridization in Rhododendron Section Pentanthera
(Ericaceae). Sys. Botany, 2: 14-27.
Knust, L. and A.L. Samuels. 2003. Biosynthesis and secretion of plant cuticular wax. Progress in
Lipid Res. 42:51-80.
Kron, K.A. 1993. A Revision of Rhododendron Section Pentanthera. Edinburgh J. Bot., 50: 249-
364.
Kron, K.A., L.M. Gawen, and M.W. Chase. 1993. Evidence for Introgression in Azaleas
(Rhododendron; Ericaceae): Chloroplast DNA and Morphological Variation in a Hybrid
Swarm on Stone Mountain, Georgia. Am. J. Botany, 80: 1095-1099.
Kumar, L.S. 1999. DNA Markers in Plant Improvement: An Overview. Biotech Adv, 17: 143-
182.
Lee, M. 1995. DNA Markers and Plant Breeding Programs. Adv. In Agronomy, 55: 265-344.
Li, H. 1957. Chromosome Studies in the Azaleas of Eastern North America. Am. J. Botany, 44:
8-14.
Lowe, H.J.B., G.J.P. Murphy, and M.L. Parker. 1985. Non-glaucousness, a probable aphid-
resistance character of wheat. Ann. Appl. Biol. 106:555.560.

18
Maughan, P.J., M.A. Saghai Maroof, and G.R. Buss. 1996. Amplified Fragment Length
Polymorphism (AFLP) in Soybean: Species Diversity, Inheritance, and Near-isogenic
Line Analysis. Theoretical and Applied Genetics, 93: 392-401.
Mariette, S., D. Chagne, C. Lezier, P. Pastuszka, A. Raffin, C. Plomion, and A. Kremer. 2001.
Genetic Diversity Within and Among Pinus pinaster Populations: Comparison Between
AFLP and Microsatellite Markers. Heredity, 86: 469-479.
Mead, F.W. 1967. Stephanitis lace bugs of the United States (Hemiptera: Tingidae). Fla. Dep.
Agric. Div. Plant Ind. Entomol. Circ. 62.
Molenaar, N.D. 1984. Genetics, thrips (Thrips tabaci L.) resistance and epicuticular wax
characteristics of nonglossy and glossy onions (Allium cepa L.). Ph.D. dissertation. Univ.
Wisconsin, Madison. 112 pp.
Neal, J.W. Jr., and L.W. Douglass. 1988. Development, oviposition rate, longevity, and
voltinism of Stephanitis pyrioides (Heteroptera: Tingidae), an adventive predator of
azalea at three temperatures. Environ. Entomo. 17:827-831.
Nei, M. and W. Li. 1979. Mathematical Model for Studying Genetic Variation in Terms of
Restriction Endonucleases. Proceedings of the National Academy of Science, 76: 5269-
5273.
Nwanze, K.F., R.J. Pring, P.S. Sree, D.R. Butler, Y.V.R. Reddy, and P. Soman. 1992. Resistance
in sorghum to the shoot fly, Atherigona soccata: epicuticular wax and wetness of the
central whorl leaf of young seedlings. Ann. Appl. Biol. 120:373-382.
Qi, X. and P. Lindhout. 1997. Development of AFLP Markers in Barley. Mol. And Gen.
Genetics, 254: 330-336.

19
Rehder, A. 1921. The Azaleas of North America. In E.H. Wilson and A. Rehder, A Monograph
of Azaleas Rhododendron subgenus Anthodendron: pp 107-196, Theophrastus, RI.
Riberio, M.M., S. Mariette, G.G. Vendramin, A.E. Szmidt, C. Plomion, and A. Kremer. 2002.
Comparison of Genetic Diversity Estimates Within and Among Populations of Maritime
Pine Using Chloroplast Simple-Sequence Repeat and Amplified Fragment Length
Polymorphism Data. 2002. Mol. Ecology, 11: 869-877.
Ridout, C.J. and P. Donini. 1999. Use of AFLP in Cereals Research. Trends in Plant Sci., 4: 76-
79.
de Riek, J., J. Dendauw, M. Mertens, M. de Loose, J. Heursel, and E. van Bockstaele. 1999.
Validation of Criteria for the Selection of AFLP Markers to Assess the Genetic Variation
of a Breeder’s Collection of Evergreen Azaleas. Theor. Appl. Genetics, 99: 1155-1165.
de Riek, J., M. Mertens, J. Dendauw, E. Van Bockstaele, and M. de Loose. 2000. Azalea
(Rhododendron simsii hybrids) Germplasm From China Assessed by Means of
Flourescent AFLP. Acta. Hort, 521: 203-210.
Russell, J.R., J.C. Weber, A. Booth, W. Powell, C. Sotelo-Montes, and I.K. Dawson. 1999.
Genetic Variation of Calycophyllum spruceanum in the Peruvian Amazon Basin,
Revealed by Amplified Fragment Length Polymorphism (AFLP) analysis. Mol. Ecology,
8: 199-204.
Sax, K. 1930. Chromosome Stability in the Genus Rhododendron. Am. J. Botany, 17: 247-251.
Scharff, R.E. 1911. Distribution and Origin of Life in America: 497, London, Constable and Co.
Scheiber, S.M., R.L. Jarret, C.D. Robacker, and M. Newman. 2000. Genetic Relationships within
Rhododendron L. Section Pentanthera G. Don Based on Sequences of the Internal
Transcribed Spacer (ITS) Region. Scientia Horticulturae, 85: 123-135.
20
Schwager, B., H. Pitre, and L. Gourley. 1984. Field evaluation of sorghum characteristics for
resistance to fall armyworm. J. Ga. Entomol. Soc. 19:333-339.
Skinner, H.T. 1961. Classification of Native American Azaleas. Proc Int. Rhododendron Conf,
The Am. Rhododendron Soc., Portland, OR.
Sneath, P.H.A. and R.R. Sokal. 1973. Numerical Taxonomy. Freeman Press, San Francisco.
Srinivasachar, D. and R.S. Malik. 1972. An induced aphid-resistant, non-waxy mutant in turnip,
Brassica rapa. Curr. Sci. 41:820-821.
Travis, S.E., J. Maschinski, and P. Keim. 1996. An Analysis of Genetic Variation in Astragalus
cremnophylax var. cremnophylax, a Critically Endangered Plant, Using AFLP Markers.
Mol. Ecology, 5: 735-745.
Tsumuki, H., K. Kanehisa, and K. Kawada. 1989. Leaf surface wax as a possible resistance
factor of barley to cereal aphids. Appl. Entomol. Zool. 24:295-301.
Vos, P. R. Hogers, M. Bleeker, M. Reijans, T. van de Lee, M. Hornes, and A. Frijters, J. Pot, J.
Peleman, M. Kuiper, and M. Zabeau. 1995. AFLP: A New Technique for DNA
Fingerprinting. Nuc. Acid Res., 23: 4407-4414.
Wang, Y., C.D. Robacker, and S.K. Braman. 1998. Identification of resistance to azalea lace bug
among deciduous azalea taxa. J. Amer. Soc. Hort. Sci. 123:592-597.
Wang, Y., S.K. Braman, C.D. Robacker, and J.G. Latimer. 1999. Composition and variability of
epicuticular lipids of azaleas and their relationship to azalea lace bug resistance. J. Amer.
Soc. Hort. Sci. 124:239-244.
Weibel, D.E. and K.J. Starks. 1986. Greenbug nonpreference for blossomless sorghum. Crop Sci.
26:1151-1153.

21
Weiss, H.B. 1916. Foreign pests recently established in New Jersey. J. Econ. Entomol. 9:212-
216.
Wherry, E.T. 1943. The American Azaleas and Their Variations. Natl. Hort. Mag., 22: 158-166.
Williams, J.G.K., A.R. Kubelik, K.J. Levak, J.A. Rafalski, and S.V. Tingey. 1990. DNA
Polymorphism Amplified by Arbitrary Primers as Useful as Genetic Markers. Nucleic
Acid Res., 18: 6531-6535.
Winfield, M.O., G.M. Arnold, and F. Cooper. 1998. A Study of Genetic Diversity in Populus
nigra subsp. Beautifolia in the Upper Severn Area of the UK Using AFLP Markers.
Molecular Ecology, 7: 3-10.
Zhu, J., M.D. Gale, S. Quarrie, M.T. Jackson, and G.J. Bryan. 1998. AFLP Markers for the
Study of Rice Biodiversity. Theoretical and Applied Genetics, 96: 602-611.
22
CHAPTER 2
ASSESSING THE GENETIC DIVERSITY OF SEVEN DECIDUOUS AZALEA SPECIES
(RHODODENDRON SPP. SECTION PENTANTHERA) NATIVE TO THE EASTERN UNITED STATES 1
1 Chappell, M.R., C. Robacker, and T. Jenkins. Submitted to the Journal of The American Society of Horticultural Science, 04/07.

Index words: AFLP markers, Rhododendron spp., among population diversity, within population diversity, AMOVA, phenogram
ABSTRACT
Despite the ecologic and economic importance of native deciduous azaleas
(Rhododendron spp. section Pentanthera), our understanding of interspecific variation of
North American deciduous azalea species comes principally from morphologic studies.
Furthermore, little is known concerning intraspecific or interpopulation genetic variation.
With ever-increasing loss and fragmentation of native azalea habitat in the eastern United
States due to anthropogenic activity, it is imperative that an understanding of natural
genetic variation among and within species and populations is acquired. The present
study addresses questions of genetic diversity through the use of amplified fragment
length polymorphism (AFLP) analysis. Twenty-five populations of seven species of
native azalea were analyzed using three primer pairs that amplified a total of 417 bands.
Based on analysis of molecular variance (AMOVA) and estimates of Nei’s coefficients of
gene diversity (HS, HT, and GST), the majority of variation found in deciduous azalea
occurs within populations. Both among species and among population variation was low,
likely the effect of common ancestry as well as frequent introgression among members
(and populations) of section Pentanthera. The latter was evident in four populations of R.
prunifolium and R. canescens that were highly related to R. austrinum and R. viscosum,
respectively. Despite these outliers, the majority of populations were grouped into species
based on Nei’s unbiased genetic distances viewed as a UPGMA phenogram. The
significance of these results is discussed in relation to breeding in section Pentanthera.

24
INTRODUCTION
Deciduous azalea species (Division: Magnoliophyta; Class: Magnoliopsida;
Subclass Dilleniidae; Order: Ericales; Family: Ericaceae; Genus: Rhododendron; Section:
Pentanthera) are indigenous to the eastern United States from southeastern Canada
southwestward to east Texas and east to the Atlantic coast. The deciduous azalea is an
outstanding spring-summer blooming woody ornamental, and along with evergreen
azaleas, is a common plant in eastern U.S. landscapes (Gallee, 1987). The level of genetic
diversity among species has been addressed in a previous study, yet no research has
described the amount of genetic diversity among populations of a single species or within
individual populations. This research was conducted to answer these questions.
Scharff (1911) postulated that the introduction and migration of deciduous azaleas
to North America occurred from Asia, via the Bering Strait land bridge, in the early
Tertiary to Pre-Pliocene periods. Despite the 5-65 million years since, little change was
observed in chromosome number and morphology when members of sect. Pentanthera
were compared to possible Asian founder species Rhododendron schlippenbachii
Maximowicz from Korea, R. molle Blume from China and R. japonicum (Gray) Sur.
from Japan (Sax 1930; Li, 1957). Judd (1915) successfully produced interspecific hybrids
between the geographically isolated diploid R. occidentale (Oregon-California) and
tetraploid R. calendulaceum (Virginia-Georgia). Rehder (1921) successfully hybridized
R. luteum (Eastern Europe) and R. canadense (Eastern Canada-Northeast United States).
All Rhododendron spp. within sect. Pentanthera have subsequently been hybridized
(Wherry, 1943; Skinner, 1961; Galle, 1967). Coupled, the results of chromosome and
breeding studies indicate a high degree of chromosome stability within Rhododendron

25
spp. sect. Pentanthera. They also suggest species identity is maintained through
geographic isolation via habitat preference and temporal patterns of flowering rather than
interspecific crossing barriers.
Kron et al. (1993a) utilized chloroplast DNA markers to distinguish two species
of deciduous azalea, R. canescens and R. flammeum and also to measure introgression in
a hybrid swarm located at Stone Mountain, GA. Morphological markers were utilized to
confirm results and measure the level of introgression within the population. In the hybrid
population of R. canescens and R. flammeum, interspecific hybridization and
introgression were confirmed in more than 75% of the surveyed individuals. This study
verified the value of DNA-based studies to distinguish between species of deciduous
azaleas and indicated that introgression in native azaleas could hamper genome-based
studies of genetic diversity. Iqbal et al. (1995) proved the usefulness of whole-genome
analysis to distinguish germplasm within genus Rhododendron. They employed RAPD
analysis to detect genetic relatedness of both evergreen and deciduous species and
cultivars of Rhododendron and to test if RAPD analysis of Rhododendron spp. reflected
their true genetic relationships. Using cluster analysis, species and cultivars were grouped
as predicted based upon origin and known pedigree.
Scheiber et al. (2000) sequenced the entire internal transcribed spacer (ITS)
region, including ITS1, ITS2, and the 5.8S subunit, of sixteen members of Rhododendron
sect. Pentanthera in an effort to group species based upon genetic similarity. The ITS
region is unique in that it is transcribed yet untranslated, therefore postulated to change
freely via deletion or addition without altering gene products. This study was the first to
focus on members of sect. Pentanthera and results indicated extremely little variation in

26
ITS sequence, ranging from 0.00 to 1.67%. Studies among species within section
Pentanthera are needed that will sample total genomic variation and give high resolution
of genomic variability. Amplified fragment length polymorphism (AFLP) has this ability
as it produces a large number of polymorphisms when no prior sequence information is
known (Vos et al., 1995). For example, Barker et al. (1999) found 170 polymorphic
bands with 20 RAPD primers in Salix, yet using 4 AFLP primers found 645 polymorphic
bands. AFLP is also highly reproducible whereas RFLP and RAPD results are difficult to
reproduce. Winfield et al. (1998), in an AFLP analysis of Black Poplar, found that over
five trials at five varying laboratories, banding patterns were 97.6% to 100% similar.
A naturally occurring population of native deciduous azalea is determined to be
comprised of a single species if all individuals within that population resemble one
species in the vast majority of phenotypically measurable traits. Results presented by
Kron (1993a) suggest introgression could be a major obstacle in any genome-based
analysis of native azalea species. Introgression is the infiltration of genetic material from
one species into the germplasm of another through repeated backcrossing (Anderson,
1949) and can result in the selection of naturally occurring populations that resemble one
species but contain genetic material from another (or several other) species(s). This
phenomenon can confound results of genetic studies by creating a significant downward
bias in genetic diversity estimates among species and a significant upward bias in genetic
diversity within populations. Many native azalea populations contain obvious hybrid
individuals as well as individuals that resemble one to several species (Galle, 1987). A far
fewer number of populations contain only individuals that morphologically resemble
accepted taxonomic keys. Therefore, in this study, populations were selected after

27
rigorous examination of morphologic characters across each population, based upon the
accepted morphologic key presented by Kron (1993b). Thereafter, we utilized AFLP
analysis to ascertain the level of genetic diversity among and within naturally occurring
species and populations of seven species of deciduous azaleas.
MATERIALS AND METHODS
Plant Material and Collection. Seven species of deciduous Rhododendron spp. (sect.
Pentanthera) native to the eastern United States were included in this study. The species
included R. austrinum (Small) Rehder, R. calendulaceum (Michaux) Torrey, R.
canescens (Michaux) Sweet, R. flammeum (Michaux) Sargent, R. atlanticum Ashe, R.
prunifolium (Small) Millais, and R. viscosum (L.) Torrey. Three to six populations per
species (Table 1) were selected as viable collection sites based on three parameters:
isolation from other Rhododendron (sect. Pentanthera) species or hybrid swarms, size of
population with a minimum of 15 individuals in the population of interest, and
morphologic characteristics. An extensive morphologic key by Kron (1993b) was used to
identify populations of a single species with no hybrid individuals. Traits including leaf
shape and size, pubescence patterns, vein patterns, stem color, stipules, petiole length,
flower color, flowering time, seed pod pubescence and size, bud scale patterns and color,
and growth habit and habitat were examined at three intervals over a one year period
prior to collection. Leaf samples were collected from six individuals per population
approximately 7-14 days after leaf emergence yet prior to complete leaf expansion.
Selection of individual plants to sample was determined by constructing a grid pattern of

28
each population and thereafter collecting plants evenly distributed throughout the entire
population. Collected leaf tissues were individually stored at -70°C.
AFLP Procedure. The E.Z.N.A.® High Performance (HP) DNA extraction kit (Omega
Bio-Tek, Inc, Doraville, GA) and corresponding protocol was utilized in total genomic
DNA extraction from 100 mg of frozen leaf tissue. DNA was quantified using a
spectrofluorometer and 1.5% agarose gel with Low DNA Mass LadderTM (InvitrogenTM,
Carlsbad, CA) while simultaneously checking for quality (shearing). Subsequently,
genomic DNA was stored at -20°C in sterile deionized water. Restriction-digestion,
ligation, and pre-selective amplification (Table 2) of genomic DNA was carried out using
the Li-Cor, Inc. (Lincoln, NE) IRDyeTM AFLP Template Preperation Kit. All polymerase
chain reactions (PCR) were carried out in a Perkin-Elmer Model 9600 Thermal Cycler®
(Wellesley, MA ). Thirty primer pairs (Table 2) were screened on two individuals of each
species included in this study. Three primer pairs; E-ACA/M-CTG, E-ACT/M-CAC, and
E-AGG/M-CAT were selected based upon number of polymorphic bands visualized on a
gel and repeatability of band presence. Only EcoRI primers (100µM) with fluorescence at
700 nm (Li-Cor® Biosciences, Lincoln, NE) were selected as band intensity was
extremely low for all 800 nm primers.
Selective amplification was carried out on all individuals with each of the three
selected primer pairs. In a 1.5ml microcentrifuge tube (Fisher Scientific Company
L.L.C.), based on total sample number to be selectively amplified in a single reaction, the
following were combined: 2.15µl sterile deionized water, 2.0µl MgCl2 (Promega Corp.,
Madison, WI), 0.05µl GOTaq® DNA polymerase (Promega), 2µl 5x GOTaq buffer
(Promega), 0.8µl 100mM dNTP (Promega), 0.5µl MseI primer, and 0.5µl EcoRI primer.

29
In each well of a Fisherbrand 96 well PCR plate (Fisher Scientific Company L.L.C.), 8µl
of the aforementioned mix was combined with 4µl of template DNA from the
preselective amplification stage. PCR conditions for selective amplification were set
based on the Li-Cor AFLP protocol. Following completion of the selective amplification
PCR program, products were immediately denatured. Three microliters of Blue Stop
Solution® (Li-Cor® Biosciences) were added to each well and samples denatured at 94°C
for 4min. Samples were then cooled to 4°C by placing the PCR plate on ice and/or into
the refrigerator.
Gels were cast using Li-Cor 25cm glass plates with 0.25mm spacers. Twenty ml
of 6.5% KB Plus acrylamide gel solution was combined with 150µl APS (Fisher
Scientific Company L.L.C.) and 15µl Temed (Fisher Scientific Company L.L.C.). DNA
was loaded at a volume of 0.4µl per well. Each gel included all individuals from a single
species-primer pair combination. Each gel also included two standards to enable efficient
and reliable gel comparison in the scoring process. The first standard employed was a Li-
Cor IRDye® 50-700 size standard, placed on the outside two lanes of each gel. The
second standard was a panel of each species, with one individual of each species included
in all gels. Extraction and analysis was repeated in thirty-three percent of the individuals
to ensure repeatability of banding patterns.
Gels were run on a Li-Cor Model 4300S DNA Analysis System using the
SagaLite® software package (Li-Cor Biosciences Inc.) with laser focus adjusted on a run-
by-run basis to optimize performance. Run length was set to four hours with KBplus
standard electrophoresis conditions. Standard power and temperature settings were
utilized with the exception of voltage that was reduced to 1000 to allow for increased low

30
base pair band separation. Gel images produced by SagaLite® were graphically adjusted
within the program and exported to GelBuddy (Zerr and Henikoff, 2005) whereby gels
were graphically aligned using monomorphic banding patterns. Image files were then
exported to Adobe Photoshop® CS2 (Adobe Systems Inc., San Jose, CA) and all gel
images from a single primer pair merged into a single graphics file. Individual gel images
were aligned using three standards; the Li-Cor IRDye® 50-700 size standard, the panel
lanes that included one sample of each species, and monomorphic bands that were shared
by all species. The resulting single graphics file was utilized in the scoring of gels.
Data Analysis. Bands were manually scored in binary format as present (1) or absent (0)
and values recorded in Microsoft® Excel, including monomorphic bands. Data from the
three primer pair combinations required a three-fold increase in the quantity of columns
available in Microsoft® Excel. Therefore, GS-Calc 7.1 (JPS Development, Palmer Lake,
CO) was used to combine data sets from the three primer pairs into a single data set that
was manipulated as needed for individual data analysis programs.
PopGene v.3.2 was used to calculate Nei’s genetic diversity (Nei, 1987) and
percentage of polymorphic loci. Settings for analysis included a significance level of
p≤0.05, seven groups (one for each species), and 10,000 simulations. A matrix of Nei’s
unbiased genetic distances (Nei, 1978) was calculated by PopGene v.3.2 (Yeh and Boyle,
1997) using all markers, including monomorphs. Nei’s unbiased genetic distance is the
most accurate and reliable estimate of genetic diversity when population sizes are small
(Nei, 1978). An unrooted UPGMA phenogram based on Nei’s unbiased genetic distance
matrix over all populations (Nei, 1978) was produced using Treeview 1.6.6 (Page, 1996).

31
Analyses of molecular variance (AMOVA) was calculated among species using
Arlequin v.2.000 (Schneider et al., 2000) to determine the hierarchical partitioning of
genetic variability among all species, populations within a single species, and within each
population. Hickory v.1.0.4 (Holsinger and Lewis, 2002) was utilized to calculate
panmictic heterozygosity based on mean allele frequencies (HT), average panmictic
heterozygosity within each population (HS), and the Bayesian analog of Nei’s GST
(Holsinger, 1999). Data was analyzed among and within species using a 250,000 burn-in
and 500,000 randomizations.
RESULTS AND DISCUSSION
Level of polymorphism. Three AFLP primer combinations (Table 2) amplified a total of
417 scorable bands. The average repeatability of AFLP fragments across two replications
was 97.4% (data not shown). The primer pair MseI-CTG/ EcoRI-ACA amplified 142
bands; the primer pair MseI-CAC/ EcoRI-ACT amplified 134 bands; and the primer pair
MseI-CAT/ EcoRI-AGG amplified 141 bands. Unbiased genetic distance matrices were
calculated from each of the three primer pairs and compared by Mantle test in three
possible combinations. Results indicate that the information generated by each of the
primer pairs was consistent (r > 0.9, P < 0.01) across primer combinations. The
percentage of polymorphic loci across all species was 89.69% (Table 3). Within species,
polymorphic band percentages ranged from 86.81-91.85%. The high degree of
polymorphism is not due to a single species or population within a species, but rather
polymorphic loci are spread evenly across all species and individual populations.

32
Diversity among species. Based on AMOVA results, the proportion of variation
among species is only 14% (Table 4). Studies by Kurashige et al. (2001) and Scheiber et
al. (2000) present similar findings as to the low level of genetic diversity among members
of Rhododendron spp. sect. Pentanthera. In the latter study, the entire ITS region was
analyzed to determine genetic relatedness of members of Rhododendron spp. sect.
Pentanthera. The ITS region has been used to study interspecific genetic structure
because subtle genetic differences at the base level have been observed. Therefore, the
agreement of ITS data and AFLP data from this study indicate that members of
Rhododendron spp. sect. Pentanthera are highly related and possibly derived from a
common ancestor. Sax (1930) and Li (1957) noted considerable chromosome similarity
among possible Asian founder species and North American native azalea species. These
included R. molle from China and R. japonicum from Japan that are in sect. Pentanthera,
and Rhododendron schlippenbachii from Korea that is in sect. Sciadorhodion. Further
research, such as chloroplast DNA studies, is needed to conclusively determine the
ancestry of U.S. native deciduous azalea species. Alone, common ancestory is unlikely to
explain all of the present-day genetic similarity among species since the proposed
migration of sect. Pentanthera into North America 5-65 million years ago. The low
proportion of genetic variation among species is likely a result of common ancestry
coupled with an abnormally high level of naturally occurring interspecific hybridization
and introgression events such as that deduced by Kron (1993a). Breeders should be aware
of the effects of introgression when using plants collected in the wild as parents, such as
confounding genetic ratios and the possibility of unexpected phenotypic characters in
progeny of crosses.

33
Diversity among populations. The proportion of species genetic diversity attributed to
among population variation (HtHsGst −=1 ), whereas HS is the average genetic diversity
within populations and HT is the genetic diversity within species, is a critical indicator of
genetic diversity at the population level. The proportion of total genetic diversity that
occurs among populations over all species and loci (GST) was 0.29, and within each
species ranged from 0.09 in R. flammeum to 0.26 in R. prunifolium (Table 3). The
relatively low overall GST indicates a low to marginal proportion of diversity (29%) is
observed among populations as opposed to a high level of diversity observed within
populations (71%). Low GST values also indicate a high level of gene flow among
populations, which tends to homogenize a species’ genetic structure. This is expected as
members of Rhododendron spp. sect. Pentanthera are entomophilously pollinated
(Gallee, 1987; Hamrick and Godt, 1996). Insect pollination leads to populations with a
high level of genetic variation while individuals within the population share a similar
complement of alleles in similar frequencies (Falk et al., 2001; Hamrick and Godt, 1996).
AMOVA (Table 4) supports GST values and indicates a high level of variation is observed
within populations (83%) and low proportion of variation among populations (3%; P <
0.05). The relatively low GST value coupled with low proportion of variation among
populations from AMOVA further indicates that individuals within populations are likely
to be genetically distinct; however each population contains a very similar complement of
alleles in similar frequencies (Falk et al., 2001). Thus, from a breeding standpoint, the
low percentage of among population variation is important in the selection of parents.
Within each species, individuals obtained from geographically isolated populations will
not substantially increase allelic diversity in a breeding program.

34
Diversity within populations. AMOVA and GST values correspond to the proportion
(percentage) of genetic variation partitioned among species, among populations, and/or
within populations. HS and HT values, conversely, are a direct measure of diversity within
populations and within species, respectively (Falk et al., 2001). HS and HT values offer
insight into the actual level, rather than proportion, of genetic variation within
populations and within each species.
The average genetic diversity within populations (HS) was low to moderate for all
species, ranging from 0.29 in R. austrinum and R. viscosum to 0.35 in R. calendulaceum
(Table 3). A likely cause for lower average diversity in R. austrinum and R. viscosum is
population size. All R. austrinum and R. viscosum populations surveyed inhabited a
relatively small geographic area (< 0.7 km2). The reduced geographic size of the
populations allow for pollen to be easily transported among all individuals of the
population, effectively reducing within-population genetic diversity. This is unlike larger
populations where the migratory range of insects may only cover a portion of the entire
population and, therefore, facilitate higher within population diversity. In addition to
small population size, R. viscosum also has a flowering time 1-2 months later than any
other species with the exception of R. prunifolium. The offset reproductive cycle, in
comparison to other members of Rhododendron spp. sect. Pentanthera, reduced the
potential of introgression with adjacent species in past generations that could lead to
increased within-population diversity.
The species with the highest average genetic diversity within populations (HS), R.
calendulaceum (0.35; Table 3), is the only tetraploid member of Rhododendron spp. sect.
Pentanthera (n= 26, 2n= 52). Li (1957) concluded, based upon differing sizes of

35
chromosome complements, that R. calendulaceum is an allotetraploid, which may explain
the higher within-population diversity. R. flammeum also has comparatively high genetic
diversity within populations (0.34) and, interestingly, exhibits a high level of within-
population phenotypic variability. Of all members of Rhododendron spp. sect.
Pentanthera, R. canescens occupies the largest geographic range and inhabits the largest
variety of habitats. As the habitats and bloom cycle of R. flammeum overlap with R.
canescens, past introgression events, undetectable when assessing morphologic traits,
may explain the observed variability. Kron (1993b) documented this in a study involving
a natural population of R. canescens, R. flammeum, and hybrids of the two species. It was
discovered that despite phenotypic assignment of an individual to R. flammeum,
chloroplast DNA proved that the individual contained alleles from R. canescens. Because
anthesis of R. canescens typically precedes that of R. flammeum, pollen of R. canescens is
available to pollinate R. flammeum flowers after its flowers open yet prior to anthesis
(Kron, 1993b).
Within species diversity. Genetic diversity within species (HT) was low to moderate,
ranging from 0.34 in R. austrinum to 0.41 in R. prunifolium (Table 3). The relatively low
level of within species diversity of R. austrinum may be due to the small geographic
range of the species and hence short distance between population sites (Falk et al., 2001).
No two populations were greater than 34 km apart and populations from such a close
proximity are more likely to be highly related than distant populations. R. viscosum had
similar within species diversity (0.36) despite geographic distances between populations
of at least 237 km. Low species diversity in R. viscosum is most likely a direct result of
disjointed flowering time. In this study, collection of R. viscosum was also conducted

36
outside the geographic range of R. prunifolium to minimize the potential of
contamination via introgression between these two species with parallel annual bloom
cycles.
R. prunifolium exhibited the highest within species diversity (0.41) and this
diversity was exhibited not only in the pooled HT value but also in two random
subsamples of three populations (HT = 0.40, 0.41; data not shown), indicating the
diversity was not due to the greater number of populations sampled. Phenotypic and
habitat variation among populations explains the discrepancy between relatively low
within-population genetic diversity (HS = 0.30; Table 3) and relatively high within
species genetic diversity (0.41) and is supported by a modest correlation between Nei’s
unbiased genetic distance (Nei, 1978) with geographic distance (r = 0.432, p = 0.02). R.
prunifolium was the only species in the study to show a significant correlation (p ≤ 0.05)
of genetic distance and geographic distance (data not shown). Parapatric speciation may
explain this result, although a much broader sampling of populations will be required to
determine if this phenomenon is present. R. prunifolium and R. flammeum are the two
most phenotypically variable species included in this study. R. flammeum principally
inhabits hardwood forest ecosystems and displays increased phenotypic variation within
individual populations. Conversely, R. prunifolium inhabits a wide variety of ecological
niches with greater phenotypic diversity observed among populations, ranging from
upland hardwood forests at the northern species range to stream basins at the southern
range. Greater phenotypic variation observed among populations, coupled with diverse
habitat preference across the species range, suggests that some level of genetic
divergence is occurring along the north-south axis of R. prunifolium’s geographic range.

37
R. canescens also exhibited a relatively high level of within species variation
(0.40). The level of variation among populations of R. canescens was unexpected as
phenotypically the species is very stable. There are two possible explanations for these
results. Because of the broad geographic range of R. canescens, the largest of any
member of sect. Pentanthera, a small upward bias in within species diversity may be
expected as species with broad ranges generally exhibit higher HT values. The relatively
higher level of variation may also be the result of past interspecific hybridization
(introgression) events with a number of related species. The geographic ranges of four
separate species with similar annual flowering times overlap three of the collection sites
of R. canescens. The Meriwether Co., GA and Baldwin Co., GA populations are within
the range of R. flammeum; the Bullock Co., GA population is with the R. atlanticum
range; and the Lee Co., AL population is within the ranges of R. alabamense and R.
cumberlendense (Kron 1993b). The introgression of even a single individual in past
generations of these populations could be the cause of a slight upward bias in within
species diversity, despite the lack of phenotypic evidence, as introgression would have
introduced variable genetic material into each of the populations surveyed.
Effects of clonal structure on diversity estimates. HS and HT values of R. atlanticum
were intermediate to other species in this study. However, the GST value for R. atlanticum
is low at 0.10 (Table 3). R. atlanticum is the only species incorporated into this study that
forms dense clonal patches. In the populations surveyed for this study, multiple
genotypes formed interconnecting patches with minimal breaks. Because of dense cover,
it is likely that seedling germination and/or survival is low within the bounds of the
colonized area. This plant habit was possibly the result of a founder effect. Population
38
genesis likely occurred when one or several plants intermated and colonized the habitable
area surrounding the introduction site. Such phenomena, observed in the related species,
Rhododendron ferrugineum L. (Wolf et al., 2004), prevents the introduction of alleles
from other populations or species, leading to genetically diverse yet highly related
individuals that share a majority of alleles due to common ancestry.
Evidence of introgression based on genetic distance comparisons. As expected, Nei’s
unbiased genetic distances (Nei, 1978) among populations were lower within species
compared to among species (Table 5). Additionally, the phenogram derived from Nei’s
unbiased genetic distances (Figure 1) provided expected grouping of species into
individual branches based on the accepted morphological key generated by Kron (1993b).
Only four of the 25 populations surveyed in this study showed distinct signs of
introgression (Table 5; Figure 1). Genetic distances indices for R. prunifolium fall into
two distinct groups (Table 5). The three populations collected from the southern area of
the species range are highly related, with indices of 0.10-0.11. The three northern
populations are also highly related, with values of 0.07-0.09. A comparison of genetic
distances between populations of the northern and southern groups show less relatedness
among the two sets of populations (0.21-0.24). Remarkably, these values are similar to
those across species in this study. When genetic distances are visualized as a UPGMA
phenogram (Figure 1), the disassociation between northern and southern populations is
evident. Northern populations occupy an independent branch-point of the phenogram
while southern populations share a major branch with R. austrinum populations. This is
corroborated by genetic distance indices between southern R. prunifolium populations
and R. austrinum populations that range from 0.08-0.12 (Table 5). These genetic distance
39
values are extremely low for between species comparisons and closely resemble values
seen within a species. This was unexpected considering all populations were
phenotypically verified at several growth stages and the two species exhibit distinct
flowering periods, with R. austrinum flowering 2-3 months prior to R. prunifolium.
Despite present-day morphologic differences, major climate shifts possibly led to
an intermingling of the two species geographic range and/or annual flowering period.
Studies suggest the occurrence of such an event in woody cross pollinated species native
to the eastern United States. Two examples are Liquidambar styraciflua and
Liriodendron tulipifera that purportedly migrated south to the gulf coast at the period of
glacial maxima of the Pleistocene period (Hoey, 1990; Parks et al., 1994). In the case of
R. prunifolium, any migration southward of the species during this same geologic period
would intermingle at least the southern populations of R. prunifolium with existing R.
austrinum populations. Breeders should be aware of the genetic, morphologic, and habitat
differences between southern and northern populations when breeding with R.
prunifolium.
Within species genetic diversity of three populations of R. canescens was similar
to that of other species in this study (0.04-0.05; Table 5), with the exception of a single
population located in Bullock Co., GA (0.26-0.28). The phenogram of genetic distances
(Figure 1) groups this population in a major branch shared with R. viscosum and a minor
branch with only the Bullock Co., GA R. viscosum population. These two populations are
located 6 km apart, an acceptable distance based on our collection parameters and
considering differential bloom periods. Yet it appears that introgression has occurred at
some time between the two populations, possibly the result of severe drought or
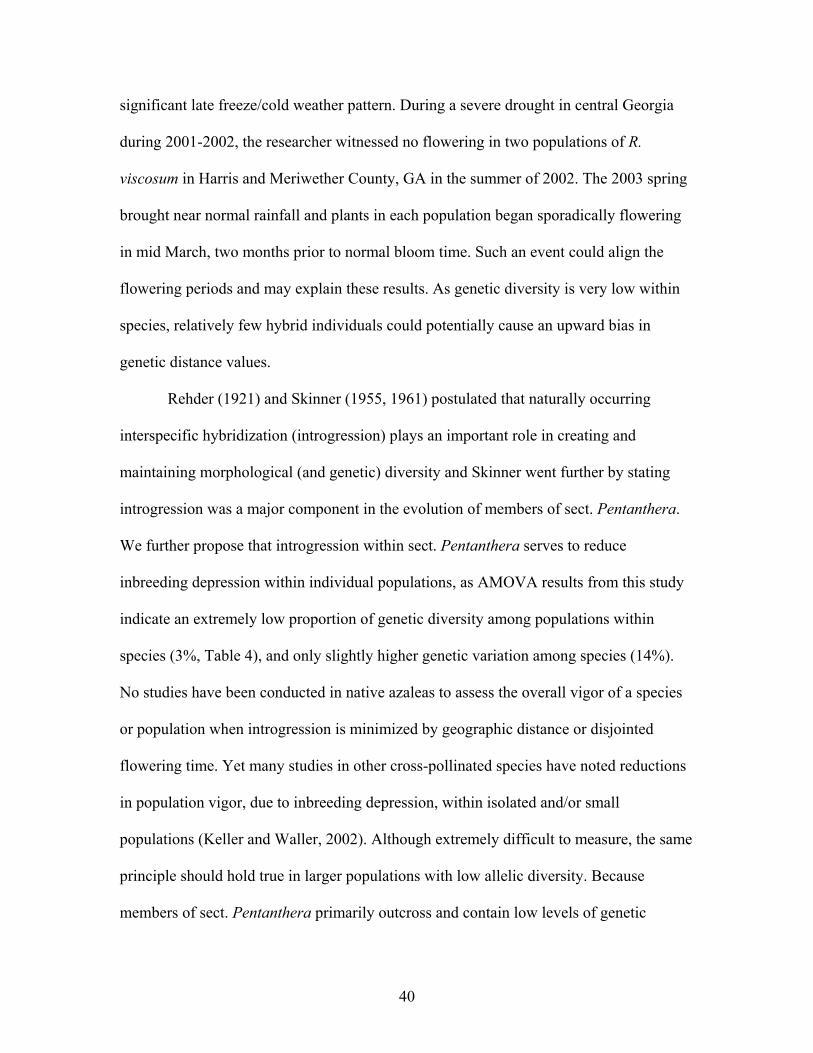
40
significant late freeze/cold weather pattern. During a severe drought in central Georgia
during 2001-2002, the researcher witnessed no flowering in two populations of R.
viscosum in Harris and Meriwether County, GA in the summer of 2002. The 2003 spring
brought near normal rainfall and plants in each population began sporadically flowering
in mid March, two months prior to normal bloom time. Such an event could align the
flowering periods and may explain these results. As genetic diversity is very low within
species, relatively few hybrid individuals could potentially cause an upward bias in
genetic distance values.
Rehder (1921) and Skinner (1955, 1961) postulated that naturally occurring
interspecific hybridization (introgression) plays an important role in creating and
maintaining morphological (and genetic) diversity and Skinner went further by stating
introgression was a major component in the evolution of members of sect. Pentanthera.
We further propose that introgression within sect. Pentanthera serves to reduce
inbreeding depression within individual populations, as AMOVA results from this study
indicate an extremely low proportion of genetic diversity among populations within
species (3%, Table 4), and only slightly higher genetic variation among species (14%).
No studies have been conducted in native azaleas to assess the overall vigor of a species
or population when introgression is minimized by geographic distance or disjointed
flowering time. Yet many studies in other cross-pollinated species have noted reductions
in population vigor, due to inbreeding depression, within isolated and/or small
populations (Keller and Waller, 2002). Although extremely difficult to measure, the same
principle should hold true in larger populations with low allelic diversity. Because
members of sect. Pentanthera primarily outcross and contain low levels of genetic

41
variation among populations of a single species, it is reasonable to assume that a
reduction in heterosis would occur in native azalea populations (or species) isolated for
multiple generations. Therefore introgression events would serve to increase heterosis
within the population, essentially ‘rescuing’ the population from the effects of inbreeding
depression, specifically the fixation of deleterious alleles that reduce fecundity and the
ability of a population to adapt to environmental stress and/or change.
AFLP markers exhibited a high level of efficiency in detecting genetic variation
within Rhododendron section Pentanthera. The results of this study indicate that
members of Rhododendron section Pentanthera are highly related, both among and
within species, despite occupying a vast geographic area. The proportion of variation
among species and among populations of each species is low, with the greatest proportion
of genetic variation residing within individual populations. When assessing the actual
(not proportional) variation of individual species, in addition to low among species and
among population diversity, within-population variation is also relatively low.
Three points have been illuminated by this study in relation to the breeding of
North American native azaleas. First, breeders should take precautions to ensure breeding
material, if deemed to be a pure species, has not been compromised via introgression.
Identification of populations consisting of one species without hybrid individuals, based
on phenotypic keys, was difficult in the field. In several instances, multiple observations
of phenotypic characters indicated a population consisted of a single species, yet genetic
data suggests introgression had occurred. Second, there is a low level of genetic diversity
observed among populations within species. While genetic diversity does exist among
populations, the relatively low level of diversity indicates that the importance of
42
collecting individuals from multiple geographically isolated populations to obtain allelic
diversity in parent stock is not critical. Third, results illuminate potential pitfalls in the
conservation of native azaleas in the eastern United States. The low levels of genetic
diversity, coupled with its entomophilous outcrossing nature, suggest that gene flow both
among populations and among species (introgression) is important in maintaining the
heterosis of populations and/or species. Fragmentation or isolation of populations due to
anthropogenic activity could have a significant and swift negative effect on the health,
vigor, and adaptability of individual populations and/or species. Studies should be
conducted to identify those species that may be at risk either due to small geographic
range (R. flammeum, R. prunifolium) or habitat preferences that collide with development
preferences (R. atlanticum, R. flammeum).
LITERATURE CITED
Anderson, E. 1949. Introgressive Hybridization. Wiley and Sons, New York.
Barker, J.H., M. Matthes, G.M. Arnold, K.J. Edwards, I. Ahman, S. Larson, and A. Karp.
1999. Characterization of genetic diversity in potential biomass willows (Salix
spp.) by RAPD and AFLP analyses. Genome, 42: 173-183.
Davidian, H.H. 1995. The Rhododendron Species: Volume IV. Timber Press, Portland,
Oregon.
Falk, D.A., E.E. Knapp, E.O. Guerrant. 2001. An introduction to restoration genetics.
Society for Ecological Restoration, Science & Policy Paper No. 1.
Galle, F.C. 1967. Native and some introduced azaleas for southern gardens: Kinds and
culture. Amer. Hort. Mag., 46: 13-23.

43
Galle, F.C. 1987. Azaleas. Portland, Oregon, Timber Press.
Hamrick, J. L. and M. J. W. Godt. 1996. Conservation genetics of endemic plant species:
281-304. In Avise, J. C. and J. L. Hamrick, Editors. Conservation Genetics.
Chapman and Hall, New York.
Hoey, M.T. 1990. Patterns of genetic divergence within the vicariad genus Liquidambar
L. (Hamamelidaceae). PhD. Dissertation, The University of North Carolina.
Chapel Hill, NC.
Holsinger, K. E. 1999. Analysis of genetic diversity in geographically structured
populations: a Bayesian perspective. Hereditas. 130:245-255.
Holsinger, K. E., P. O. Lewis, and D. K. Dey. 2002. A Bayesian approach to inferring
population structure from dominant markers. Molecular Ecology. 11:1157-1164
Hyatt, D. 2001. East coast native azaleas: Tips on Identification. 03 December 2006.
<http://www.tjhsst.edu/~dhyatt/ars/>.
Iqbal, M.J., D.W. Paden, and A.Lane-Rayburn. 1995. Assessment of genetic relationships
among Rhododendron species, varieties, and hybrids by RAPD analysis. Scientia
Hort, 63: 215-223.
Keller, L.F. and D.M. Waller. 2002. Inbreeding effects in wild populations. Trends in
Ecol. and Evolution, 17: 230-241.
Kron, K.A., L.M. Gawen, and M.W. Chase. 1993a. Evidence for introgression in azaleas
(Rhododendron; Ericaceae): Chloroplast DNA and morphological variation in a
hybrid swarm on Stone Mountain, Georgia. Am. J. Botany, 80: 1095-1099.
Kron, K.A. 1993b. A revision of Rhododendron section Pentanthera. Edinburgh J. Bot.,
50: 249-364.

44
Kurashige, Y., J.I. Etoh, T. Handa, K. Takayanagi, and T. Yukawa. 2001. Sectional
relationships in the genus Rhododendron (Ericaceae): Evidence from matK and
trnK intron sequences. Plant Syst. Evol. 228:1-14.
Li, H. 1957. Chromosome studies in the azaleas of eastern North America. Am. J.
Botany, 44: 8-14.
Nei, M. 1978. Estimation of average heterozygosity and genetic distance from a small
number of individuals. Genetics, 89: 583-590.
Nei, M. 1987. Molecular Evolutionary Genetics. Columbia University Press, New York.
Page, R. D. M. 1996. TREEVIEW: An application to display phylogenetic trees on
personal computers. Computer Applications in the Biosciences 12: 357-358.
Parks, C.R., J.F. Wendel, M.M. Sewell, Y-L Qiu. 1994. The significance of allozyme
variation and introgression in the Liriodendron tulipifera complex
(Magnoliaceae). Am. J. Botany, 81: 878-889.
Rehder, A. 1921. The Azaleas of North America. In E.H. Wilson and A. Rehder, A
Monograph of Azaleas Rhododendron subgenus Anthodendron: pp 107-196,
Theophrastus, RI.
Sax, K. 1930. Chromosome stability in the genus Rhododendron. Am. J. Botany, 17: 247-
251.
Scheiber, S.M., R.L. Jarret, C.D. Robacker, and M. Newman. 2000. Genetic relationships
within Rhododendron L. Section Pentanthera G. Don based on sequences of the
internal transcribed spacer (ITS) region. Scientia Horticulturae, 85: 123-135.
Scharff, R.E. 1911. Distribution and Origin of Life in America: 497, London, Constable
and Co.
45
Schneider, S.,Roessli, D., and Excoffier, L. (2000) Arlequin: A software for population
genetics data analysis. Ver 2.000. Genetics and Biometry Lab, Dept. of
Anthropology, University of Geneva.
Skinner, H.T. 1955. In search of native azaleas. Morris Arboretum Bulletin, 6: 1-10 &
15-22.
Skinner, H.T. 1961. Classification of native American azaleas. Proc Int. Rhododendron
Conf, The Am. Rhododendron Soc., Portland, OR.
Vos, P. R. Hogers, M. Bleeker, M. Reijans, T. van de Lee, M. Hornes, and A. Frijters, J.
Pot, J. Peleman, M. Kuiper, and M. Zabeau. 1995. AFLP: A new technique for
DNA fingerprinting. Nuc. Acid Res., 23: 4407-4414.
Wherry, E.T. 1943. The American azaleas and their variations. Natl. Hort. Mag., 22: 158-
166.
Winfield, M.O., G.M. Arnold, and F. Cooper. 1998. A study of genetic diversity in
Populus nigra subsp. Beautifolia in the upper severn area of the UK using AFLP
markers. Molecular Ecology, 7: 3-10.
Wolf, P.G., B. Doche, L. Gielly, and P. Taberlet. 2004. Genetic structure of
Rhododendron ferrugineum at a wide range of spacial scales. J. of Heredity, 95:
301-308.
Zerr, T. and S. Henikoff. 2005. Automated band mapping in electrophoretic gel images
using background information. Nucleic Acids Res., 33: 2806-2812.

46
Table 1. Locations of populations collected, grouped by species. Each population is numbered in succession and includes six individual plant samples also listed in consecutive order.
Population Number Species Location Sample Numbers1 Rhododendron austrinum Holmes Co., FL 1-62 R. austrinum Washington Co., FL 7-123 R. austrinum Vernon, FL 13-184 R. prunifolium Georgetown, GA 19-245 R. prunifolium Morris- Quitman Co., GA 25-306 R. prunifolium Randolph Co.,GA 31-367 R. prunifolium Randolph Co.,GA 37-428 R. prunifolium Harris Co., GA 43-489 R. prunifolium West Point, GA 49-5410 R. calendulaceum Amherst Co., VA 55-6011 R. calendulaceum Towns Co., GA 61-6612 R. calendulaceum Macon Co., NC 67-7213 R. viscosum Bullock Co., GA 73-7814 R. viscosum Essex Co., VA 79-8415 R. viscosum Meriwether Co., GA 85-9016 R. canescens Bullock Co., GA 91-9617 R. canescens Baldwin Co., GA 97-10218 R. canescens Lee Co., AL 103-10819 R. canescens Spalding Co., GA 109-11420 R. atlanticum Dinwiddie Co., VA 115-12021 R. atlanticum Carteret Co., NC 121-12622 R. atlanticum Florence Co., SC 127-13223 R. flammeum Milledgeville, GA 133-13824 R. flammeum Thomaston, GA 139-14425 R. flammeum Fulton Co., GA 145-150

47
Table 2. List of adaptors and primers screened and used in this study to characterize the amplification fragment length polymorphism (AFLP) band patterns in seven Rhododendron spp.
MseI site EcoRI siteAdaptors 5' TACTCAGGACTCAT 3' 5' CTCGTAGACTGCGTACC 3'
5' GACGATGAGTCCTGAG 3' 5' AATTGGTACGCAGTCTAC 3'
Pre-selectiveamplification 5' GATGAGTCCTGAGTAAC 3' 5' GACTGCGTACCAATTCA 3'primers
Selective Mse I-CTT Eco RI-ACT 700 z
amplification Mse I-CAC Eco RI-ACA-700primers Mse I-CTG Eco RI-AGG-700screened Mse I-CAT Eco RI-ACC-800
Mse I-CTA Eco RI-AGC-800Eco RI-AAC-800
Selective Mse I-CTG Eco RI-ACA-700 amplification Mse I-CAC Eco RI-ACT 700primers Mse I-CAT Eco RI-AGG-700sets y
z EcoRI primers were labeled with one of two Li-Cor fluorescent tags with peak
fluorescence at 700 or 800 nm. y Three primer sets selected from 30 screened primer pairs.
48
Table 3. Percentage of polymorphic loci, average genetic diversity within populations (HS), average genetic diversity within species (HT), and proportion of species genetic diversity attributed to among population variation (GST) for seven species of Rhododendron section Pentanthera.
Polymorphic Loci Percentage HS HT GST
OVERALL 89.69 0.3109 0.4372 0.289
R. atlanticum 87.53 0.3287 0.3661 0.1021R. austrinum 86.81 0.2931 0.3420 0.1431
R. calendulaceum 90.27 0.3479 0.3949 0.1190R. canescens 91.85 0.3107 0.4023 0.2278R. flammeum 89.69 0.3434 0.3789 0.0937
R. prunifolium 89.11 0.3011 0.4066 0.2594R. viscosum 88.25 0.2910 0.3572 0.1853

49
Table 4. Analysis of molecular variation (AMOVA) for seven Rhododendron spp. included in this study.
Source of d.f. Sum of Variance Variance Probabilityvariation squares components percentage P
Among species 6 2248.74 13.30 14.14 <0.05Among populations within species 18 1702.94 2.80 2.99 <0.05Within populations 125 9722.33 77.80 82.88Total 149 13674.01 93.85

50
Table 5. Nei's unbiased measures of genetic distance (Nei, 1978) below diagonal and geographic distance (km) above diagonal.
1 2 3 4 5 6 7 8 9 10 11 12 13 14 15 16 17 18 19 20 21 22 23 24 251 z **** 14 34 151 172 151 177 254 250 987 504 549 419 1143 309 415 375 227 335 1019 958 708 364 279 3622 0.061 **** 19 155 180 174 147 254 258 990 506 546 422 1146 312 420 380 232 336 1022 963 712 362 282 3643 0.076 0.077 **** 161 164 161 177 185 259 267 998 514 554 430 1153 320 388 240 328 1032 971 721 372 290 3724 0.083 0.099 0.083 **** 26 29 16 105 108 836 351 390 311 998 156 306 232 90 180 882 839 584 219 127 2095 0.110 0.089 0.097 0.108 **** 16 29 118 122 844 364 403 308 1003 166 306 237 106 190 887 515 584 222 135 2226 0.102 0.125 0.093 0.103 0.104 **** 19 98 109 818 338 378 279 972 138 283 213 98 209 857 811 551 192 109 1957 0.204 0.232 0.171 0.184 0.190 0.165 **** 98 108 813 333 375 282 974 140 285 208 98 164 853 810 555 193 109 2008 0.227 0.272 0.236 0.225 0.211 0.226 0.065 **** 27 742 248 287 280 913 68 287 158 47 90 800 776 522 156 52 1069 0.246 0.280 0.255 0.241 0.210 0.216 0.082 0.091 **** 760 253 295 311 932 90 314 182 26 109 818 802 547 182 77 114
10 0.219 0.246 0.186 0.226 0.242 0.183 0.159 0.187 0.195 **** 517 473 639 211 681 644 609 782 655 182 396 398 630 708 64611 0.220 0.221 0.188 0.224 0.212 0.179 0.146 0.208 0.173 0.035 **** 42 333 696 201 338 182 280 177 601 642 407 211 230 14212 0.210 0.220 0.181 0.215 0.234 0.192 0.156 0.190 0.182 0.033 0.057 **** 351 658 240 356 213 322 216 568 615 393 242 270 18413 0.206 0.332 0.197 0.231 0.196 0.216 0.197 0.228 0.235 0.168 0.187 0.192 **** 758 237 6 167 328 232 633 543 299 147 237 28714 0.206 0.209 0.175 0.205 0.216 0.189 0.210 0.242 0.230 0.175 0.177 0.196 0.064 **** 847 760 766 956 823 127 338 472 74 873 82315 0.206 0.222 0.178 0.201 0.215 0.231 0.201 0.181 0.190 0.146 0.178 0.182 0.150 0.127 **** 172 92 113 26 736 713 457 97 95 7216 0.219 0.267 0.207 0.226 0.230 0.222 0.194 0.218 0.206 0.216 0.221 0.213 0.105 0.130 0.112 **** 172 332 237 638 543 301 151 240 29117 0.157 0.167 0.147 0.184 0.157 0.175 0.171 0.214 0.184 0.155 0.130 0.136 0.220 0.196 0.229 0.284 **** 204 76 650 621 365 29 109 12118 0.167 0.201 0.165 0.163 0.166 0.138 0.142 0.203 0.168 0.151 0.132 0.143 0.188 0.201 0.233 0.255 0.048 **** 135 844 826 570 204 98 14019 0.188 0.200 0.160 0.187 0.156 0.161 0.142 0.214 0.180 0.159 0.144 0.151 0.213 0.212 0.250 0.260 0.046 0.044 **** 713 694 438 87 55 6120 0.173 0.191 0.201 0.196 0.171 0.167 0.177 0.199 0.198 0.148 0.145 0.171 0.174 0.171 0.183 0.202 0.142 0.152 0.143 **** 233 343 665 760 71321 0.206 0.213 0.205 0.235 0.163 0.180 0.157 0.173 0.163 0.147 0.154 0.157 0.184 0.187 0.169 0.222 0.139 0.165 0.152 0.041 **** 256 625 729 71822 0.188 0.226 0.216 0.222 0.186 0.171 0.148 0.160 0.163 0.141 0.139 0.135 0.167 0.187 0.167 0.210 0.161 0.149 0.146 0.040 0.043 **** 370 475 46723 0.173 0.156 0.130 0.164 0.144 0.168 0.147 0.151 0.142 0.137 0.147 0.137 0.195 0.168 0.168 0.185 0.133 0.134 0.158 0.139 0.134 0.148 **** 106 14024 0.213 0.193 0.153 0.163 0.147 0.175 0.150 0.191 0.151 0.135 0.125 0.113 0.186 0.176 0.173 0.198 0.130 0.137 0.159 0.137 0.122 0.130 0.030 **** 9825 0.184 0.170 0.142 0.151 0.141 0.149 0.145 0.161 0.151 0.165 0.164 0.152 0.198 0.185 0.169 0.198 0.144 0.137 0.166 0.139 0.114 0.139 0.034 0.043 ****
z Population numbers correspond to the following species; Rhododendron austrinum (1-3), R. prunifolium (4-9), R. calendulaceum
(10-12), R. viscosum (13-15), R. canescens (16-19), R. atlanticum (20-22), and R. flammeum (23-25).

51
Figure 1. The unrooted UPGMA phenogram of Nei’s unbiased genetic distance matrix (Nei, 1978) over all 25 populations surveyed. Populations are denoted in parenthesis to the right of species identification.

52
CHAPTER 3
IDENTIFICATION OF THE MECHANISM OF AZALEA LACEBUG RESISTANCE IN DECIDUOUS AZALEA 2
Chappell, M. and C. Robacker. 2006. Leaf Wax Extracts of Four Deciduous Azalea Geontypes Affect Azalea Lace Bug (Stephanitis pyrioides Scott) Survival Rates and Behavior. J. Amer. Soc. Hort. Sci. 131(2): 225-230. 2
Reprinted here with permission of the publisher.

53
Index words: Rhododendron spp., deciduous azalea, epicuticular wax, insect resistance, chloroform wax extraction
ABSTRACT
Azaleas (Ericales: Ericaceae: Rhododendron spp.) are a staple plant in many landscapes
of the U.S. and are largely resistant to predation by insects, with the exception of azalea lace bug
(ALB) (Heteroptera: Tingidae: Stephanitis pyrioides Scott). Within deciduous azalea
(Rhododendron: sect. Pentanthera: subseries Luteum) varying levels of resistance to ALB is
observed with a continuous distribution from susceptible to highly resistant. In this study,
epicuticular leaf wax from two ALB resistant [R. canescens Michaux and R. periclymenoides
(Michaux) Shinners] and two ALB susceptible (‘Buttercup’ and ‘My Mary’) deciduous azalea
genotypes was extracted and re-applied to fresh azalea foliage. Leaf wax extracted from ALB
resistant genotypes and applied to ALB susceptible genotypes conferred a high level of
resistance to both ALB feeding and oviposition in the treated ALB susceptible genotypes.
Conversely, leaf wax extracted from ALB susceptible genotypes and applied to ALB resistant
genotypes conferred susceptibility to the treated ALB resistant genotypes. However, the effect
was much less substantial than the effect of resistant wax extracts on susceptible genotypes and
confined to ALB oviposition. When applied to the same genotype from which the extract was
collected, leaf wax extract from ALB susceptible genotypes had no effect on susceptibility,
whereas resistant wax extract had a moderate effect on ALB oviposition rate. The results indicate
that leaf wax serves as a primary mechanism of resistance of deciduous azalea to ALB.

54
INTRODUCTION
Since its introduction from Japan in 1915, azalea lace bug (ALB) has become a
significant pest on azalea throughout North America (Drake and Ruhoff, 1965; Weiss 1916).
ALB damage occurs from late spring until leaf drop, as up to four generations can occur in a
single growing season (Neal and Douglass, 1988). Adult and nymphal ALB feed on the abaxial
leaf surface by inserting stylets into stomata (Ishihara and Kawai, 1981). Chloroplasts and other
cell contents are removed from the mesophyll layer, resulting in speckling on foliage of
susceptible species and cultivars. Additionally, cast skins of nymphs and brown to black frass
deposition on the leaf further discolor foliage (Braman and Pendley, 1992; Buntin et al., 1996;
Ishihara and Kawai, 1981; Mead, 1967).
Bioassays performed by Braman and Pendley (1992) revealed the deciduous R. canescens
and R. prunifolium (Small) Millais to be resistant whereas the evergreen cultivar ‘Delaware
Valley White’, a selection of R. indica var. alba, was susceptible. Further work by Wang et al.
(1998) evaluated four cultivars and eleven deciduous species selections and found R.
periclymenoides, R. canescens, and R. prunifolium to be highly resistant and R. serrulatum
(Small) Ahles and R. viscosum (L.) Torrey to show moderate resistance to ALB. Moderately
susceptible to very susceptible species included R. arborescens (Purch) Torrey, R. austrinum
(Small) Rehder, and R. oblongifolium (Small) Millais. Susceptible cultivars included ‘Buttercup’,
a R. austrinum selection; ‘My Mary’, a complex hybrid of (R. atlanticum (Ashe) Rehd. x R.
periclymenoides) x R. austrinum seletion; and ‘Nacoochee’, a R. atlanticum x R. periclymenoides
hybrid.
The principle function of the plant cuticle is to prevent excessive water loss (Hopkins,
1995). The epicuticular wax layer of the cuticle consists of long-chain aliphatic compounds
55
derived from fatty acid chains. This wax layer is deposited on the leaf surface as amorphous
intracuticular wax embedded in cutin polymers, as well as wax crystalloids. Epicuticular wax
components include alkanes, primary and secondary alcohols, ketones, and wax esters
(Eigenbrode and Espelie, 1995; Knust and Samuels, 2003). Epicuticular wax has been
recognized as a deterrent to feeding and oviposition by herbivorous insects as well as an
attractant of beneficial (often predatory) insects (Eigenbrode and Espelie, 1995). Specific
examples of epiculticular wax-herbivore interactions have been identified and characterized in
Allium cepa L. (Molenaar, 1984), Brassica rapa L. (Bodnaryk, 1992; Srinivasachar and Malik,
1972), Eucalyptus globulus Labill (Brennan and Weinbaum, 2001), Glycine max L. (Baker et al.,
1985), Hordeum vulgare L. (Tsumuki et al., 1989), Sorghum bicolor (L.) Moench (Chapman et
al., 1983; Nwanze et al., 1992; Weibel and Starks, 1986), and Triticum aestivum L. (Lowe et al.,
1985).
In azalea, through the use of gas chromatography-mass spectrometry, specific lipid
components of epicuticular wax have been implicated in ALB resistance and susceptibility
(Balsdon et al, 1995; Wang et al., 1999). Research by Balsdon et al. (1995), analyzing lipid
components of four susceptible evergreen cultivars and the resistant species R. canescens,
identified three triterpenoid components that may have an effect on ALB behavior. However,
data were not definitive as purported deterrent/ stimulant compounds were found in similar
concentrations in both R. canescens and the susceptible cultivars. Wang et al. (1999) identified
lipid components correlated with ALB resistance and susceptibility in two deciduous resistant
genotypes, four deciduous susceptible genotypes, and one evergreen susceptible azalea genotype.
The lipid component present in the largest proportion among resistant genotypes was n-
hentriacontane whereas in susceptible genotypes α- and β-amyrin were in greatest

56
concentrations. While these studies suggest an association of leaf-surface lipids with ALB
response, studies to quantify the actual effects of lipids on ALB behavior have not been
conducted. The research described in this paper investigates the quantitative effects of leaf-
surface lipids from susceptible and resistant foliage on ALB survival, feeding, and oviposition.
MATERIALS AND METHODS
Plant Materials. Genotypes included in this study were selected based upon previous bioassays
that screened azaleas for response to ALB (Braman and Pendley, 1992; Wang et al., 1998). The
azalea genotypes included in this study were the resistant R. periclymenoides and R. canescens
and the susceptible ‘Buttercup’ (R. austrinum selection) and ‘My Mary’ (Beasley hybrid). Due to
a lack of sufficient numbers of adult female ALB, the experiment was undertaken in two parts.
R. periclymenoides and ‘Buttercup’ were paired and tested 30 Aug. 2004 followed 1 week later
by R. canescens and ‘My Mary’. All plant material used in this research was obtained in Aug.
2004 from mature field-grown plants grown under mixed deciduous tree species. The field plots
were established in Nov. 1994 and maintained through drip irrigation and annual fertilization
with Osmocote Pro Controlled Release Fertilizer Plus Minors (19 N-2.2 P-7.47 K) (Scotts-Sierra
Horticultural Products Company, Marysville, Ohio). No pesticides were applied.
Laboratory bioassays. Bioassays were conducted by extracting epicuticular leaf wax from two
ALB resistant and two ALB susceptible deciduous azalea genotypes and re-applying to fresh
azalea foliage of each of the four genotypes in a diallel design. Following leaf wax extraction
and re-application, ALB were introduced to foliage in a closed and controlled environment and
ALB survival, frass deposition, and oviposition were measured. To extract leaf wax, 40 azalea
leaves per genotype were air-dried for 120 h, then immersed in 100 mL of chloroform for 15 s.

57
Chloroform was evaporated and the remaining epicuticular wax re-suspended in a 50 mL
ethanol: deionized water solution (2:1) under mild heating (32.2 °C) and stirring. Upon cooling
to room temperature (20 °C), the resulting solution was applied directly to the fresh foliage of a
4-5 cm cutting with two leaves. The leaf wax solution was applied by painting the solution on
one side of the midrib, on both abaxial and adaxial surfaces. By applying solution to only one
side of the midrib, the experiment served as a choice test, thereby allowing pairwise comparisons
to be made between treated and untreated leaf surfaces. After the treatment was applied to both
leaves of the cutting, the stem was inserted through a snap-on lid into a 32-mL plastic cup (4 cm
ht x 4 cm diam) of water. Four female adult ALB were placed into a second 32-mL cup that was
modified by replacing the bottom of the cup with organdy screen to allow ventilation. This cup
was inverted and placed over the cutting, and was sealed to the water cup with Parafilm M
(Fisher Scientific, Hampton, N.H.). Mature, female azalea lace bugs were collected the day of
the experiment from evergreen azaleas located in the Griffin, GA area.
Experimental design. Experimental design was a full diallel, including two controls: (i)
solution-only (ethanol: deionized water solution [2:1] heated and stirred, without wax extract)
and (ii) non-treated leaf. The study had four treatment groups (Table 1), each consisting of a
donor of epicuticular wax extract, recipient of epicuticular wax extract, solution-only control,
and non-treated control. Each treatment was applied to five cuttings, with two leaves per cutting;
hence five replications were employed with two sub-samples per replication. Experimental
conditions were controlled by placing all entries into a growth chamber at 24 ˚C and 12 h
daylength for 120 h.
Data Collection and Statistical Analysis. Data were collected 120 h after ALB were introduced
to azalea foliage. Numbers of live adults, frass spots (insect excrement), and eggs were recorded.

58
Frass and egg data were recorded separately for treated and non-treated sides of each leaf,
including solution-only and non-treated controls. Data were analyzed as a three-factor factorial
in SAS using Proc GLM (SAS Institute, Cary, N.C.); the three factors were replications; donor of
epicuticular leaf wax; and recipient of epicuticular wax. Mean values were compared using LSD
analysis based upon the recipient of each leaf wax extract, including controls of non-treated
foliage and solution-only treatment. Additionally, pairwise comparisons (dependent group t-test)
were performed between frass counts on treated and untreated sides of foliage as well as egg
counts on treated and untreated sides of foliage. Data subsets were constructed based on: (i)
susceptible genotypes used as leaf wax donor and resistant genotypes as leaf wax recipient, (ii)
resistant genotypes used as leaf wax donor and susceptible genotypes used as leaf wax recipient,
(iii) susceptible genotypes used as leaf wax donor and recipient (self), (iv) resistant genotypes
used as leaf wax donor and recipient (self), (v) solution-only control treatment on susceptible and
resistant genotypes, respectively.
Additional Studies to Exclude Treatment Effects. To investigate the possibility that residual
chloroform was contaminating the wax extract solution and thus affecting results, leaf wax
samples from R. periclymenoides, R. canescens, and ‘Buttercup’ were screened in a Tekmar
purge-and-trap (Gas Chromatography) unit (Teledyne Tekmar, Mason, Ohio, 45040) for
chloroform residue. Additionally, the application of wax solution to leaf surfaces may have
clogged open stomata with wax particles, preventing ALB feeding. To determine whether
stomata were obstructed, foliage of R. periclymenoides, R. canescens, and ‘Buttercup’ was
treated with leaf wax extract from each of the three genotypes and examined under a LEO 982
field emission scanning electron microscope (FE-SEM, LEO Electron Microsopy, Inc.,
Thornwood, N.Y.) with a Gatan Alto 2500 Cryostage and cryoprep chamber (Gatan UK,

59
Ferrymills 3, Osney Mead, Oxford, OX2 0ES, UK). Three leaf sections measuring 100 µm2- per
genotype, were photographed and all fully and partially open stomata scored as mechanically
obstructed by accumulation of wax debris or unobstructed, with simple ratios calculated as a
percentage of un-clogged stomata per 100 µm2.
RESULTS AND DISCUSSION
Azalea lace bug survival. Variances from the two tests, performed 1 week apart, were
homogeneous based on Bartlett’s test for homogeneity of variance at P > 0.05 (data not shown).
Hence, data from the two independent experiments were combined and analyzed as a single data
set. The first of three parameters assessed in this study, ALB survival, directly measures the
deterrent effects of epicuticular leaf wax. Results indicate that epicuticular leaf wax from ALB
resistant genotypes contains a strong deterrent, as ALB survival was dramatically reduced when
foliage of susceptible genotypes were treated with wax extract from resistant genotypes. When
‘Buttercup’ foliage was treated with R. periclymenoides wax extract, ALB survival was reduced
from the ‘Buttercup’ non-treated and solution-only means of 2.9 and 3.0, respectively, to 0.6
(Table 1). This mean of 0.6 is comparable to the ALB survival on R. periclymenoides foliage
treated with R. periclymenoides wax extract. Similarly, when ‘My Mary’ foliage was treated with
R. canescens wax extract, ALB survival was reduced from the ‘My Mary’ non-treated and
solution-only means of 3.0 and 2.9, respectively, to 1.0. This 1.0 ALB survival rate is
comparable to that of R. canescens foliage treated with R. canescens wax extract.
Results point to an inverse effect as well, as leaf wax extracts from susceptible genotypes
conferred susceptibility when applied to resistant genotypes. When ‘Buttercup’ wax extract was
applied to R. periclymenoides foliage, ALB survival was increased from the R. periclymenoides

60
non-treated and solution-only means of 1.0 and 1.4, respectively, to 3.2. This 3.2 value is
comparable to that of ‘Buttercup’ foliage treated with ‘Buttercup’ wax extract ( x =3.1).
Similarly, when ‘My Mary’ wax extract was applied to R. canescens foliage, ALB survival was
increased from the R. canescens non-treated and solution-only values of 0.8 and 0.9,
respectively, to 3.2. This 3.2 value is comparable to that of ‘My Mary’ foliage treated with ‘My
Mary’ wax extract ( x =2.9). Treatment of leaf surfaces with wax from the same genotype had no
statistically significant effect on the level of resistance or susceptibility compared to non-treated
or solution-only controls. R. periclymenoides foliage treated with R. periclymenoides wax
extract had a mean ALB survival of 0.6, with non-treated and solution-only means statistically
similar at 1.0 and 1.4, respectively. ‘Buttercup’ foliage treated with ‘Buttercup’ wax extract had
a mean ALB survival of 3.1, with non-treated and solution-only means statistically similar at 2.9
and 3.0, respectively. Both R. canescens and ‘My Mary’ treatment of leaf surfaces with wax
from the same genotypes followed this pattern.
Azalea lace bug frass deposition. The number of frass spots is a direct assessment of ALB
feeding. Frass deposition on foliage of susceptible genotypes treated with resistant wax extract
were significantly reduced compared to susceptible controls, due to both mortality of ALB in
these treatment combinations and a reduction in feeding of live ALB. Mean number of frass
spots from ‘Buttercup’ leaf surfaces treated with R. periclymenoides wax extract was reduced
from the solution-only mean of 66.5 to 5.9 (Table 1). Mean number of frass spots from ‘My
Mary’ leaf surfaces treated with R. canescens wax extract was reduced from the ‘My Mary’
solution-only mean of 56.3 to 16.6. Photos of feeding damage and frass deposition on ‘My Mary’
foliage treated with R. canescens wax extract is shown in Fig. 1. Conversely, when wax extracts
from susceptible genotypes were applied to resistant genotypes, treated leaf surfaces of resistant

61
genotypes exhibited a susceptible response to ALB. Mean number of frass spots on R.
periclymenoides leaf surfaces treated with ‘Buttercup’ wax extract was increased from the R.
periclymenoides solution-only mean of 19.2 to 46.6. Similarly, mean number of frass spots on R.
canescens leaf surfaces treated with ‘My Mary’ wax extract was increased from the R. canescens
solution-only mean of 8.8 to 44.6. This treatment effect is seen in the fig. 1 photograph of a R.
canescens leaf treated with ‘My Mary’ wax extract.
Treatment of leaf surfaces with wax extracted from the same genotype showed no
significant effect on the level of resistance. Mean number of frass spots on R. canescens leaf
surfaces treated with R. canescens wax extract was 11.8, comparable to that of the solution-only
mean 8.8. Similarly, mean number of frass spots on R. periclymenoides leaf surfaces treated with
R. periclymenoides wax extract was 2.9, comparable to that of the solution-only mean 19.2.
Conversely, treatment of ‘My Mary’ leaf surfaces with ‘My Mary’ wax extract showed a
significant effect on the level of susceptibility compared to the solution-only control.
Azalea lace bug oviposition. Egg deposition is an indirect measure of feeding, as eggs are
typically deposited only on foliage of susceptible genotypes capable of supporting nymphal
feeding and development. Oviposition rate on foliage of susceptible genotypes treated with
resistant wax extract were significantly reduced compared to susceptible controls, probably due
to significantly higher ALB mortality and a reduction in feeding of live ALB in these treatment
combinations. Mean number of eggs on ‘Buttercup’ leaf surfaces treated with R. periclymenoides
wax extract was reduced from the ‘Buttercup’ solution-only mean of 14.6 to 0.9 (Table 1).
Similarly, mean number of eggs on ‘My Mary’ leaf surfaces treated with R. canescens wax
extract was reduced from the ‘My Mary’ solution-only mean of 13.3 to 1.5. Conversely,
oviposition was significantly increased on resistant genotypes treated with susceptible wax

62
extracts. Mean number of eggs on R. periclymenoides leaf surfaces treated with ‘Buttercup’ wax
extract was increased from the R. periclymenoides solution-only mean of 2.0 to 8.5. Mean
number of eggs on R. canescens leaf surfaces treated with ‘My Mary’ wax extract was increased
from the solution-only mean of 0.1 to 5.2. Treatment of leaf surfaces with wax from the same
genotype neither positively nor negatively affected the resistance or susceptibility of genotypes
in this study. Mean number of eggs on R. canescens leaf surfaces treated with R. canescens wax
extract was 0.4, comparable to the solution-only mean of 0.1. Mean number of eggs on
‘Buttercup’ leaf surfaces treated with ‘Buttercup’ wax extract was 14.8, comparable to the
solution-only mean of 14.6.
Epicuticular leaf wax effects on untreated leaf surfaces. The effects of epicuticular leaf wax
extracts, in addition to significantly impacting ALB behavior on treated leaf surfaces, also
significantly impacted behavior on non-treated leaf surfaces. Resistant wax extract had a
significant impact on susceptible cultivars in both frass deposition and oviposition, again due to
significantly higher ALB mortality in treatment combinations including wax solution of resistant
genotypes. When R. periclymenoides wax extract was applied to ‘Buttercup’ leaf surfaces, mean
number of frass spots on non-treated leaf surfaces was reduced from the ‘Buttercup’ non-treated
and solution-only (control) means of 112.9 and 68.7, respectively, to 6.5 (Table 1). Mean number
of eggs on non-treated leaf surfaces was reduced from the ‘Buttercup’ non-treated and solution-
only means of 25.9 and 13.8, respectively, to 0.3. When R. canescens wax extract was applied to
‘My Mary’ leaf surfaces, mean number of frass spots on non-treated leaf surfaces was reduced
from the ‘My Mary’ non-treated and solution-only means of 119.3 and 56.6, respectively, to
13.1. Mean number of eggs on non-treated leaf surfaces was reduced from the ‘My Mary’ non-
treated and solution-only means of 29.4 and 12.7, respectively, to 0.3.

63
The same effect was noted when wax extract of susceptible genotypes was applied to
resistant genotypes. When ‘Buttercup’ wax extract was applied to R. periclymenoides leaf
surfaces, mean number of frass spots on non-treated leaf surfaces was increased from the non-
treated and solution-only means of 47.6 and 20.4, respectively, to 82.6. Mean number of eggs on
non-treated leaf surfaces was also increased from the R. periclymenoides non-treated and
solution-only means of 4.7 and 2.5, respectively, to 17.9. Similarly, when ‘My Mary’ wax
extract was applied to R. canescens leaf surfaces, mean number of frass spots on non-treated leaf
surfaces was increased from the R. canescens non-treated and solution-only means of 14.5 and
6.4, respectively, to 50.4. Mean number of eggs on non-treated leaf surfaces was also increased
from the non-treated and solution-only means of 0.3 and 0.1, respectively, to 12.6.
Treatment of leaf surfaces with wax from the same genotypes mirrored controls, with no
significant differences observed in frass or egg means with the exception of ‘My Mary’ frass
means. For example, when R. canescens wax extract was applied to R. canescens leaf surfaces,
mean number of frass spots on non-treated leaf surfaces was 13.2, comparable to both non-
treated and solution-only values of 14.5 and 6.4, respectively. Mean number of eggs on non-
treated leaf surfaces was 1.0, comparable to the non-treated and solution-only values of 0.3 and
0.1, respectively. When ‘My Mary’ wax was applied to ‘My Mary’ leaf surfaces, mean number
of frass spots on non-treated leaf surfaces was 93.3, statistically different from the non-treated
mean of 119.3, yet much greater than the R. canescens solution value of 13.1. Mean number of
eggs on non-treated leaf surfaces was 18.7, comparable to the solution-only mean of 12.7.
Pairwise comparisons. To better elucidate the overall effect of wax extracts from resistant and
susceptible genotypes on ALB behavior, on treated versus untreated sides of a leaf, a dependent
t-test (pairwise comparison) was performed on six data subsets (Table 2). Three data subsets

64
yielded significant differences between both frass and/or egg counts on treated versus non-
treated sides of foliage. The first subset, significant for both frass deposition and oviposition rate
contained resistant genotypes as donor of leaf wax with susceptible genotypes as recipients of
leaf wax. The second subset, significant only for oviposition rate, included all treatment groups
containing a resistant genotype as a recipient of leaf wax with resistant genotypes as donors of
leaf wax. The third subset, significant only for oviposition rate, included all treatment groups
containing a susceptible genotype as a wax donor with only resistant genotypes as recipients as
leaf wax extract. No significant differences in frass deposition or oviposition were observed on
treated versus non-treated sides of foliage within the following data subsets: (i) susceptible
genotypes as a recipient of leaf wax and susceptible genotypes as a donor of leaf wax, (ii)
solution-only control as a treatment. Overall, results of the pairwise comparisons indicate a
significant effect of leaf wax extracts from resistant genotypes on ALB feeding and oviposition,
and united with results from mean separation (LSD) analysis, it has been determined to be a
significant negative effect. Such a strong response of ALB to resistant wax extracts, as concluded
from both LSD and pairwise comparisons, is likely due to an epicuticular wax component that
serves as a strong deterrent to ALB.
Potential sources of experimental error. A comparison of solution-only and non-treated
foliage revealed a small yet measurable negative effect on feeding and oviposition of the
solution-only application, primarily on susceptible genotypes (Table 1). This solution-only effect
does not overshadow or under-represent the effect of wax extracts, and with the exception of the
measurement of frass on non-treated ‘My Mary’ foliage, is no greater than one standard
deviation from the mean of non-treated foliage.

65
No chloroform (or other trace chemicals listed in the chloroform chemical MSDS as
present in the chloroform stock solution) were detected in the three tested leaf wax samples of R.
periclymenoides, R. canescens, and ‘Buttercup’ (data not shown). Therefore, it was assumed that
the chloroform was evaporated prior to re-suspension of wax extracts and data was not
confounded due to chloroform contamination.
Examination of foliage of R. periclymenoides, R. canescens, and ‘Buttercup’, using a
scanning electron microscope revealed no obstructed stomata in any treatment combination (data
not shown). Furthermore, photomicrographs showed no disruption of epicuticular wax on leaf
surfaces treated with wax solution (Fig. 2). Apparently, leaf wax solution application provided
uniform coverage and minimal disruption of the natural leaf surface texture.
The results of this study demonstrate that leaf-surface lipids from resistant deciduous
azalea foliage confers a high level of resistance to ALB feeding and oviposition, as first proposed
by Balsdon et al. (1995) and Wang et al. (1999). Conversely, susceptible wax extracts conferred
moderate susceptibility when applied to resistant genotypes and hence may contain a stimulant to
ALB, although its effect is markedly less than that of resistant wax extract. While there have
been few studies in woody ornamental crops to determine the specific mechanism of insect
resistance, this study conclusively demonstrates that resistance to ALB in azalea follows a
pattern identified in many agronomically important crops (Bodnaryk, 1992; Brennan and
Weinbaum, 2001; Molenaar, 1984). This response is most likely due to a wax component that
serves as a strong deterrent to ALB. Both Balsdon et al. (1995) and Wang et al. (1999) linked
several specific chemical components, present in epicuticular wax of ALB resistant genotypes, to
this deterrent effect. Studies are under way to further their work and characterize whether
reduced ALB survival, frass deposition (feeding), and oviposition observed on resistant

66
genotypes is due to a specific lipid that serves as a strong deterrent within epicuticular wax and
whether increased ALB survival and oviposition in susceptible genotypes is due to a chemical
stimulant within epicuticular leaf wax. The future identification of specific epicuticular leaf wax
component(s) linked to ALB resistance and susceptibility has the potential to significantly
change both ALB resistance breeding and management strategies employed in ALB control.
LITERATURE CITED
Baker, D., M. Rangappa, and P.S. Benepal. 1985. Comparitave leaf morphology of soybean
genotypes resistant and susceptible to Mexican bean beetle defoliation. Soybean Genet.
Newsl. 15:114-115.
Balsdon, J.A., K.E. Espelie, and S.K. Braman. 1995. Epicuticular lipids from azalea
(Rhododendron spp.) and their potential role in host plant acceptance by azalea lace bug,
Stephanitis pyrioides (Heteroptera: Tingidae). Biochem. Syst. Ecol. 23:477-485.
Bodnaryk, R.P. 1992. Leaf epicuticular wax, an antixenotic factor in Brassicaceae that affects the
rate and pattern of feeding of flea beetles Phyllotreta cruciferae (Goeze). Can. J. Plant
Sci. 72:1295-1303.
Braman, S.K. and A.F. Pendley. 1992. Evidence for resistance of deciduous azaleas to azalea
lace bug. J. Environ. Hort. 10:40-43.
Brennan, E.B. and S.A. Weinbaum. 2001. Effect of epicuticular wax on adhesion of psyllids to
glaucous juvenile and glossy adult foliage of Eucalyptis globules Labillardiere. Austral. J.
Entomol. 40:270-277.

67
Buntin, G.D., S.K. Braman, D.A. Gilbertz, and D.V. Phillips. 1996. Chlorosis, photosynthesis,
and transpiration of azalea foliage after azalea lace bug (Heteroptera: Tingidae) feeding
injury. J. Econ. Entomol. 89: 990-995.
Chapman, R.F., S. Woodhead, and E.A. Bernays. 1983. Survival and dispersal of young larvae of
Chilo partellus (Swinhoe) (Lepidoptera: Pyralidae) in two cultivars of sorghum. Bull.
Entomol. Res. 73:65-74.
Drake, C.J. and F.A. Ruhoff. 1965. Lacebugs of the world: a catalog (Hemiptera: Tingidae). U.S.
Nat. Mus Bull. 213.
Eigenbrode, S.D. and K.E. Espelie. 1995. Effects of plant epicuticular lipids on insect
herbivores. Annu. Rev. Entomol. 40:171-194.
Hopkins, W.G. 1995. Introduction to Plant Physiology. John Wiley and Sons, Inc., New York,
NY.
Ishihara, R. and S. Kawai. 1981. Feeding habits of the azalea lace bug, Stephanitis pyrioides
Scott (Hemiptera: Tingidae). Jpn. J. Appl. Entomol. Zool. 25:200-202.
Johnson, W.T. and H.H. Lyon. 1991. Insects that feed on trees and shrubs. Cornell Univ. Press,
Ithica, NY.
Knust, L. and A.L. Samuels. 2003. Biosynthesis and secretion of plant cuticular wax. Progress in
Lipid Res. 42:51-80.
Lowe, H.J.B., G.J.P. Murphy, and M.L. Parker. 1985. Non-glaucousness, a probable aphid-
resistance character of wheat. Ann. Appl. Biol. 106:555.560.
Mead, F.W. 1967. Stephanitis lace bugs of the United States (Hemiptera: Tingidae). Fla. Dep.
Agric. Div. Plant Ind. Entomol. Circ. 62.

68
Molenaar, N.D. 1984. Genetics, thrips (Thrips tabaci L.) resistance and epicuticular wax
characteristics of nonglossy and glossy onions (Allium cepa L.). Ph.D. dissertation. Univ.
Wisconsin, Madison. 112 pp.
Neal, J.W. Jr., and L.W. Douglass. 1988. Development, oviposition rate, longevity, and
voltinism of Stephanitis pyrioides (Heteroptera: Tingidae), an adventive predator of
azalea at three temperatures. Environ. Entomo. 17:827-831.
Nwanze, K.F., R.J. Pring, P.S. Sree, D.R. Butler, Y.V.R. Reddy, and P. Soman. 1992. Resistance
in sorghum to the shoot fly, Atherigona soccata: epicuticular wax and wetness of the
central whorl leaf of young seedlings. Ann. Appl. Biol. 120:373-382.
Srinivasachar, D. and R.S. Malik. 1972. An induced aphid-resistant, non-waxy mutant in turnip,
Brassica rapa. Curr. Sci. 41:820-821.
Tsumuki, H., K. Kanehisa, and K. Kawada. 1989. Leaf surface wax as a possible resistance
factor of barley to cereal aphids. Appl. Entomol. Zool. 24:295-301.
Wang , Y., C.D. Robacker, and S.K. Braman. 1998. Identification of resistance to azalea lace
bug among deciduous azalea taxa. J. Amer. Soc. Hort. Sci. 123:592-597.
Wang, Y., S.K. Braman, C.D. Robacker, and J.G. Latimer. 1999. Composition and variability of
epicuticular lipids of azaleas and their relationship to azalea lace bug resistance. J. Amer.
Soc. Hort. Sci. 124:239-244.
Weibel, D.E. and K.J. Starks. 1986. Greenbug nonpreference for blossomless sorghum. Crop Sci.
26:1151-1153.
Weiss, H.B. 1916. Foreign pests recently established in New Jersey. J. Econ. Entomol. 9:212-
216.

69
Table 3-1. Numbers of surviving adult azalea lace bugs, frass spots, and eggs on azalea foliage treated with epicuticular wax extract from resistant (R. periclymenoides, R. canescens) or susceptible ('Buttercup', 'My Mary') azalea foliage. Numbers are means of ten replications and data are grouped based on the recipient of leaf wax. Mean separation is based upon least significant difference (LSD) at P<0.05. Means followed by the same letters for each parameter-leaf wax recipient combination are not statistically different.
'Buttercup' t 3.1 s a r 'Buttercup' 67.6 a Non-treated 112.9 a 'Buttercup' 14.8 a Non-treated 25.9 aWax Solution-only 3.0 a Solution-only 66.5 a 'Buttercup' 84.3 a Solution-only 14.6 a 'Buttercup' 17.2 abTrt. Non-treated 2.9 a R. periclymenoides 5.9 b Solution-only 68.7 a R. periclymenoides 0.9 b Solution-only 13.8 b
R. periclymenoides 0.6 b R. periclymenoides 6.5 b R. periclymenoides 0.3 cPr <F
Non-treated 3.0 a 'My Mary' 80.1 a Non-treated 119.3 a 'My Mary' 18.8 a Non-treated 29.4 aWax 'My Mary' 2.9 a Solution-only 56.3 b 'My Mary' 93.3 b Solution-only 13.3 b 'My Mary' 18.7 bTrt. Solution-only 2.9 a R. canescens 16.6 c Solution-only 56.6 c R. canescens 1.5 c Solution-only 12.7 b
R. canescens 1.0 b R. canescens 13.1 d R. canescens 0.3 cPr <F
'Buttercup' 3.2 a 'Buttercup' 46.6 a 'Buttercup' 82.6 a 'Buttercup' 8.5 a 'Buttercup' 17.9 aWax Solution-only 1.4 b Solution-only 19.2 b Non-treated 47.6 b Solution-only 2.0 b Non-treated 4.7 bTrt. Non-treated 1.0 b R. periclymenoides 2.9 b Solution-only 20.4 bc R. periclymenoides 0.1 b Solution-only 2.5 b
R. periclymenoides 0.6 b R. periclymenoides 8.1 c R. periclymenoides 1.3 bPr <F
'My Mary' 3.2 a 'My Mary' 44.6 a 'My Mary' 50.4 a 'My Mary' 5.2 a 'My Mary' 12.6 aWax R. canescens 1.0 b R. canescens 11.8 b Non-treated 14.5 b R. canescens 0.4 b R. canescens 1.0 bTrt. Solution-only 0.9 b Solution-only 8.8 b R. canescens 13.2 b Solution-only 0.1 b Non-treated 0.3 b
Non-treated 0.8 b Solution-only 6.4 b Solution-only 0.1 bPr <F
Eggs: treated surfaces w Eggs: non-treated surfaces v
'Buttercup' leaves (susceptible) u
<.0001 0.0054 0.0055 0.0027 0.0046
Surviving lace bugs z Frass: treated surfaces y Frass: non-treated surfaces x
R. periclymenoides leaves (resistant)
0.0015 0.0033 0.0038 0.0042 0.0002
0.0038 <.0001 <.0001 0.0004 <.0001
'My Mary' leaves (susceptible)
0.0053 0.0082 0.0011 0.008 0.0038
R. canescens leaves (resistant)
z Surviving adult female lacebugs at 120 hours. Each replication included 4 adult female lace bugs. y Frass on treated side of leaves at 120 hours. x Frass on non-treated side of leaves at 120 hours. w Eggs on treated side of leaves at 120 hours. v Eggs on non-treated side of leaves at 120 hours. u The recipient of treatments.

70
t The donor of leaf wax, solution-only only treatment, or non-treated. s All reported values are means over five replications. r Mean separation based on least significant difference (LSD) at α = 0.05. Means followed by the same letters are statistically similar.

71
Table 3-2. Degrees of freedom, mean difference, standard deviation, t-value, and probability of t values for pairwise comparison of frass deposition and oviposition counts on treated versus untreated sides of azalea foliage. Data for the resistant genotypes R. periclymenoides and R. canescens were combined, as were the data for the susceptible genotypes 'Buttercup' and 'My Mary'.
Donor Recipient D.F. Mean SD t -value Mean SD t -valueSusceptible Resistant 9 1.45 6.02 0.76 0.4658 ns 0.90 0.88 3.25 0.0100 **Resistant Susceptible 9 -20.90 21.96 -3.01 0.0143 ** -8.40 4.39 -6.05 0.0002 ***Susceptible Susceptible 9 -15.35 32.79 -1.48 0.1729 ns -0.65 3.22 -0.64 0.5385 nsResistant Resistant 9 -3.30 5.24 -1.99 0.0776 ns -0.90 0.84 -3.38 0.0082 **Solution (control) Susceptible 9 -1.25 11.51 -0.34 0.7392 ns 0.70 4.45 0.50 0.6312 nsSolution (control) Resistant 9 0.60 3.46 0.55 0.5970 ns -0.25 0.86 -0.92 0.3809 ns
Pr > | t | Pr > | t |Frass deposition Oviposition
* Pr < 0.05 ** Pr < 0.01 *** Pr < 0.001

72
Figure 3-1. Deciduous azaleas showing azalea lace bug feeding damage and frass deposition. ‘My Mary’ (susceptible) adaxial leaf surface treated with R. canescens (resistant) leaf wax solution on the left side of the midrib (left), ‘My Mary’ abaxial leaf surface treated with R. canescens leaf wax solution on the right side of the midrib (center), and R. canescens abaxial leaf surface treated with ‘My Mary’ wax extract on the left side of the midrib (right). Distance bar (top-left) represents 1.0 cm.

73
Figure 3-2. Scanning electron micrographs of azalea lace bug susceptible cultivar ‘Buttercup’ foliage treated with wax solution of R. periclymenoides (panel A and C) and control micrographs of non-treated ‘Buttercup’ foliage (panel B and D). Stomata (S) and wax crystalloids (WC) are highlighted. Distance bars represent 10 µm.

74
CHAPTER 4
CONCLUSIONS

75
Conventional thought regarding the level of diversity among and within members of
Rhododendron section Pentanthera, based on ample phenotypic (Rehder, 1921; Sax, 1930;
Wherry, 1943; Li, 1957; Skinner, 1961; Galle, 1967) and limited molecular analysis (Kron et al.,
1993; Scheiber et al., 2000), has revolved around the idea that native deciduous azalea species
are closely related. Despite the aforementioned work, our understanding of interspecific variation
of North American deciduous azalea species was quite limited. Furthermore, no genetic studies
had been conducted to ascertain the level of intraspecific or interpopulation genetic variation.
The present study addressed in detail the issue of genetic diversity among and within seven
individual species and twenty-five populations of North American deciduous azalea species
through the use of amplified fragment length polymorphism (AFLP) analysis. Utilizing three
primer pairs, 417 polymorphic bands were obtained that allowed for high resolution of genetic
differentiation among and within species and populations. Based on analysis of molecular
variance (AMOVA) and estimates of Nei’s coefficients of gene diversity (HS, HT, and GST), the
majority of variation in deciduous azalea occurs within populations. Both among species and
among population variation was low, likely the effect of common ancestry as well as frequent
introgression among members (and populations) of section Pentanthera. The majority of
populations were grouped into species based on Nei’s unbiased genetic distances viewed as a
UPGMA phenogram. However, there was evidence of introgression within members (and
populations) of section Pentanthera. Overall, three crucial ideas can be taken from this study in
relation to the breeding of North American native azaleas. First, breeders should take precautions
to ensure breeding material, if deemed to be a pure species, has not been compromised via
introgression. Identification of populations consisting of one species without hybrid individuals,
based on phenotypic keys, was difficult in the field. In several instances, multiple observations of

76
phenotypic characters indicated a population consisted of a single species, yet genetic data
suggests introgression had occurred. Second, there is a low level of genetic diversity observed
among populations within species. While genetic diversity does exist among populations, the
relatively low level of diversity indicates that the importance of collecting individuals from
multiple geographically isolated populations to obtain allelic diversity in parent stock is not
critical. Third, results illuminate potential pitfalls in the conservation of native azaleas in the
eastern United States. The low levels of genetic diversity, coupled with its entomophilous
crossing nature, suggest that gene flow both among populations and among species
(introgression) is important in maintaining the heterosis of populations and/or species.
Fragmentation or isolation of populations due to anthropogenic activity could have a significant
and swift negative effect on the health, vigor, and adaptability of individual populations and/or
species. Studies should be conducted to identify those species that may be at risk either due to
small geographic range (R. flammeum, R. prunifolium) or habitat preferences that collide with
anthropogenic activities such as housing development (R. atlanticum, R. flammeum).
The mechanism of resistance and susceptibility of Rhododendron section Pentanthera
species and cultivars to azalea lacebug (Stephanitis pyriodes Scott) was assumed by previous
researchers to be linked to components of epicuticular leaf wax. However, studies disagreed
upon specific wax compounds linked to resistance and/or susceptibility (Baldson et al., 1995;
Wang et al., 1999). Azaleas are largely resistant to predation by insects, with the exception of
ALB. Within deciduous azalea (Rhododendron section Pentanthera) varying levels of resistance
to ALB is observed with a continuous distribution from susceptible to highly resistant. In this
study, epicuticular leaf wax from two ALB resistant [R. canescens Michaux and R.
periclymenoides (Michaux) Shinners] and two ALB susceptible (‘Buttercup’ and ‘My Mary’)

77
deciduous azalea genotypes was extracted and re-applied to fresh azalea foliage. Leaf wax
extracted from ALB resistant genotypes and applied to ALB susceptible genotypes conferred a
high level of resistance to ALB feeding and oviposition. Conversely, leaf wax extracted from
ALB susceptible genotypes and applied to ALB resistant genotypes conferred susceptibility to
ALB resistant genotypes. The results indicate that leaf wax serves as a primary mechanism of
resistance of deciduous azalea to ALB.
LITERATURE CITED
Balsdon, J.A., K.E. Espelie, and S.K. Braman. 1995. Epicuticular lipids from azalea
(Rhododendron spp.) and their potential role in host plant acceptance by azalea lace bug,
Stephanitis pyrioides (Heteroptera: Tingidae). Biochem. Syst. Ecol. 23:477-485.
Galle, F.C. 1967. Native and Some Introduced Azaleas for Southern Gardens: Kinds and Culture.
Amer. Hort. Mag., 46: 13-23.
Kron, K.A., L.M. Gawen, and M.W. Chase. 1993. Evidence for Introgression in Azaleas
(Rhododendron; Ericaceae): Chloroplast DNA and Morphological Variation in a Hybrid
Swarm on Stone Mountain, Georgia. Am. J. Botany, 80: 1095-1099.
Li, H. 1957. Chromosome Studies in the Azaleas of Eastern North America. Am. J. Botany, 44:
8-14.
Rehder, A. 1921. The Azaleas of North America. In E.H. Wilson and A. Rehder, A Monograph
of Azaleas Rhododendron subgenus Anthodendron: pp 107-196, Theophrastus, RI.
Sax, K. 1930. Chromosome Stability in the Genus Rhododendron. Am. J. Botany, 17: 247-251.

78
Scheiber, S.M., R.L. Jarret, C.D. Robacker, and M. Newman. 2000. Genetic Relationships within
Rhododendron L. Section Pentanthera G. Don Based on Sequences of the Internal
Transcribed Spacer (ITS) Region. Scientia Horticulturae, 85: 123-135.
Skinner, H.T. 1961. Classification of Native American Azaleas. Proc Int. Rhododendron Conf,
The Am. Rhododendron Soc., Portland, OR.
Wang, Y., S.K. Braman, C.D. Robacker, and J.G. Latimer. 1999. Composition and variability of
epicuticular lipids of azaleas and their relationship to azalea lace bug resistance. J. Amer.
Soc. Hort. Sci. 124:239-244.
Wherry, E.T. 1943. The American Azaleas and Their Variations. Natl. Hort. Mag., 22: 158-166.