PROGRESS KINERJA SURVEILANS, MTBS DAN SPESIALISTIK PUSKESMAS.pptx
Upload
dangnguyetCategory
view
213download
0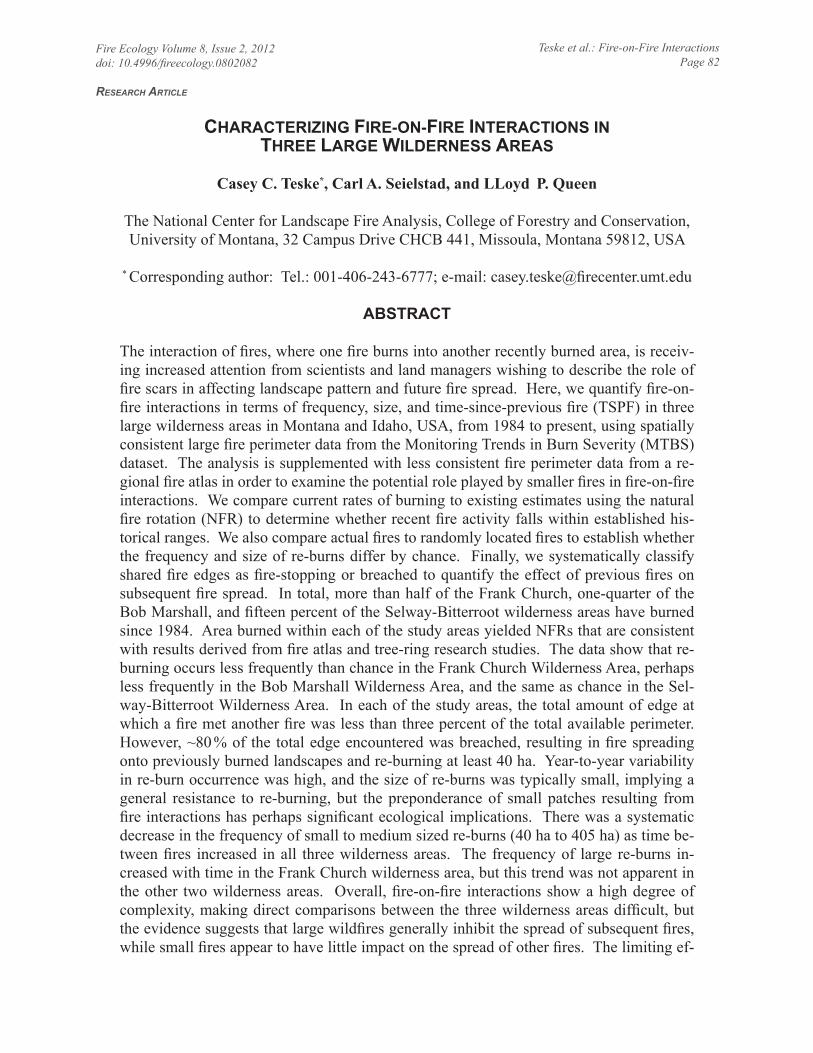
Fire Ecology Volume 8, Issue 2, 2012doi: 10.4996/fireecology.0802082
Teske et al.: Fire-on-Fire InteractionsPage 82
ReseaRch aRticle
CharaCterizing Fire-on-Fire interaCtions in three Large WiLderness areas
Casey C. Teske*, Carl A. Seielstad, and LLoyd P. Queen
The National Center for Landscape Fire Analysis, College of Forestry and Conservation, University of Montana, 32 Campus Drive CHCB 441, Missoula, Montana 59812, USA
* Corresponding author: Tel.: 001-406-243-6777; e-mail: [email protected]
aBstraCt
The interaction of fires, where one fire burns into another recently burned area, is receiv-ing increased attention from scientists and land managers wishing to describe the role of fire scars in affecting landscape pattern and future fire spread. Here, we quantify fire-on-fire interactions in terms of frequency, size, and time-since-previous fire (TSPF) in three large wilderness areas in Montana and Idaho, USA, from 1984 to present, using spatially consistent large fire perimeter data from the Monitoring Trends in Burn Severity (MTBS) dataset. The analysis is supplemented with less consistent fire perimeter data from a re-gional fire atlas in order to examine the potential role played by smaller fires in fire-on-fire interactions. We compare current rates of burning to existing estimates using the natural fire rotation (NFR) to determine whether recent fire activity falls within established his-torical ranges. We also compare actual fires to randomly located fires to establish whether the frequency and size of re-burns differ by chance. Finally, we systematically classify shared fire edges as fire-stopping or breached to quantify the effect of previous fires on subsequent fire spread. In total, more than half of the Frank Church, one-quarter of the Bob Marshall, and fifteen percent of the Selway-Bitterroot wilderness areas have burned since 1984. Area burned within each of the study areas yielded NFRs that are consistent with results derived from fire atlas and tree-ring research studies. The data show that re-burning occurs less frequently than chance in the Frank Church Wilderness Area, perhaps less frequently in the Bob Marshall Wilderness Area, and the same as chance in the Sel-way-Bitterroot Wilderness Area. In each of the study areas, the total amount of edge at which a fire met another fire was less than three percent of the total available perimeter. However, ~80 % of the total edge encountered was breached, resulting in fire spreading onto previously burned landscapes and re-burning at least 40 ha. Year-to-year variability in re-burn occurrence was high, and the size of re-burns was typically small, implying a general resistance to re-burning, but the preponderance of small patches resulting from fire interactions has perhaps significant ecological implications. There was a systematic decrease in the frequency of small to medium sized re-burns (40 ha to 405 ha) as time be-tween fires increased in all three wilderness areas. The frequency of large re-burns in-creased with time in the Frank Church wilderness area, but this trend was not apparent in the other two wilderness areas. Overall, fire-on-fire interactions show a high degree of complexity, making direct comparisons between the three wilderness areas difficult, but the evidence suggests that large wildfires generally inhibit the spread of subsequent fires, while small fires appear to have little impact on the spread of other fires. The limiting ef-

Fire Ecology Volume 8, Issue 2, 2012doi: 10.4996/fireecology.0802082
Teske et al.: Fire-on-Fire InteractionsPage 83
introdUCtion
Wildland fire is a key ecosystem process in landscapes across much of the western United States. Perturbations caused by this natural factor play important roles in the formation of the vegetation complex, creating multiple states of continually changing patches, pat-terns, and arrangements of vegetation that in-fluence the behavior and effects of future wild-fires (Sousa 1984, Sprugel 1991, Perry 1995, Weatherspoon and Skinner 1995, Morgan et al. 2001, Rollins et al. 2004, Finney et al. 2005, Moritz et al. 2005, Raymond and Peter-son 2005, Folke 2006, Groffman et al. 2006, Falk et al. 2007, Thompson et al. 2007, McK-enzie et al. 2011). Both topography (e.g., as-pect and elevation) and climate (e.g., drought) influence a location’s predominant vegetation and fuels, and daily weather patterns cause fluctuations in fuel moistures (Collins and Ste-phens 2007). Interactions among these factors influence fire behavior and its effects at a given location, and over time produce vegetation and fire characteristics that typify the geographic area or ecosystem. A fire regime describes the nature of fires occurring over an extended pe-riod of time (Brown 1995, Morgan et al. 2001) and can be defined in terms of the rotation, re-turn interval, severity, intensity, seasonality, shape, and size typical of fires in a specific geographic area or ecosystem (Pickett and White 1985, Agee 1993, Morgan et al. 2001, NWCG 2006, Sugihara et al. 2006, Kellogg et al. 2008). As such, fire regimes provide con-text for describing the historical role of fire in that location (Agee 1993, Rollins et al. 2004).
One aspect of fire regimes that is receiving increased attention is the interaction of multiple fires at their common boundaries. Fire-on-fire interactions, in which one fire burns across an-other recently burned area, may be the rule in forests frequently affected by fires (Halofsky et al. 2011), although this phenomenon has been assumed by some to be ecologically harmful (e.g., USDA 1988) in the past. That old fires interact with and influence the behavior and ef-fects of new fires at common boundaries is the model accepted by fire managers and fire ecol-ogists (USDA 1988, Agee 1993, Thompson et al. 2007, van Wagtendonk 2007, van Wagten-donk et al. 2012). There are several document-ed examples of fires re-burning portions of pre-vious fires (e.g., the Tillamook Burn area [Neiland 1958], the Silver and Biscuit fires [Thompson et al. 2007]). Still, few rigorous evaluations of the intersections of old wildfires and new wildfires exist (see Collins and Ste-phens 2007, Collins et al. 2009, Halofsky et al. 2011, van Wagtendonk et al. 2012), especially across large landscapes. Edges, patches, and the resultant patterns created by wildfires and other factors are considered ecologically im-portant, as many studies show (e.g., Turner et al. 1994, Finney et al. 2005, Haire and McGa-rigal 2010). However, many contemporary studies largely focus on the effects of fuels treatments, such as prescribed fire and thinning, on wildfire behavior and effects (Finney et al. 2005, Moghaddas and Craggs 2007, Ritchie et al. 2007, Stephens et al. 2009). Thus, system-atic analyses of the interactions of previous wildfires on subsequent wildfires are important to furthering knowledge of the short- and long-
fect of large fires on small fires is potentially significant based on the number of cases ob-served (n = 101).
Keywords: Bob Marshall Wilderness Area, fire atlas, fire-on-fire interaction, fire regime, Frank Church Wilderness Area, MTBS, natural fire rotation, Selway-Bitterroot Wilderness Area
Citation: Teske, C.C., C.A. Seielstad, and L.P. Queen. 2012. Characterizing fire-on-fire interac-tions in three large wilderness areas. Fire Ecology 8(2): 82-106. doi: 10.4996/fireecolo-gy.0802082

Fire Ecology Volume 8, Issue 2, 2012doi: 10.4996/fireecology.0802082
Teske et al.: Fire-on-Fire InteractionsPage 84
term ecological and management implications of wildfire occurrence, presuming that land-scapes burning multiple times in short periods confer different fire behavior and effects char-acteristics than once-burned landscapes.
This study quantifies and characterizes the occurrence of fire-on-fire interactions in three large wilderness areas located in Idaho and Montana, USA, using vector-format data de-rived from the remotely sensed Monitoring Trends in Burn Severity (MTBS) dataset (Ei-denshink et al. 2007). It focuses on whether wildfires propagate onto or are stopped by lo-cations previously burned, and whether this behavior differs in the recent past from what is expected due to chance, and whether it differs among study areas. Specifically, we analyze large fire perimeters (greater than 405 ha) from the Frank Church, Bob Marshall, and Selway-Bitterroot wilderness areas to address the fol-lowing questions:
1) What is the extent of burning and re-burning in the three wilderness areas?
2) Are contemporary rates of burning similar to historical rates?
3) Is re-burning occurring more frequent-ly than would be expected due to chance?
4) Do fires that occur earlier in the record affect propagation of subsequent fires?
5) What are the differences in fire-on-fire interactions among the three wilder-ness areas?
Observational studies such as this one can improve understanding of complex ecological processes relevant to large landscapes (Guthery 2008). The five questions above are addressed by contrasting the current rates of burning with contemporary estimates of historical burning, by comparing observed fires to fires randomly located on a neutral landscape, and by quanti-fying how often new fires breach existing fire edges. The three wilderness areas analyzed encompass an area of 49 000 km2 in the north-ern Rocky Mountains. We expected differenc-
es in fire-on-fire interaction characteristics among the three wilderness areas given ob-served variability in topographic orientation, vegetative composition, and climatic charac-teristics. The wilderness areas are relatively unaffected by human influences, although fire suppression continues to be practiced in them from time to time. Given long-standing prac-tices of allowing fire to burn for resource ben-efit, however, the wilderness areas provide some of the best available baselines for ob-serving what is natural. The availability of MTBS data, documented fire history studies, and variability in physiographic characteristics were additional considerations in site selec-tion. The MTBS data provide an unprecedent-ed ability to assess fire history systematically across large land areas, and few studies have focused on re-burn and edge-characteristics of fire interactions. A better understanding of fire-on-fire interactions is important to land managers and scientists alike.
Methods
Study Areas
The wilderness areas for this study are the Greater Bob Marshall Wilderness Area in Montana, the Selway-Bitterroot Wilderness Area in Idaho and Montana, and the Frank Church River of No Return Wilderness Area in Idaho (Figure 1). Wilderness boundaries were buffered by 3 km in order to contain the en-tirety of each large fire that occurred within and proximate to them. Due to buffering, the sizes of the study areas for this research are somewhat larger than the actual areas encom-passed by administrative boundaries. In this study, the Selway-Bitterroot study area is 876 000 ha, the Bob Marshall is 1 748 200 ha, and the Frank Church is 2 367 400 ha. These numbers include unburnable areas such as wa-ter and rock.
Each wilderness area is located in the northern Rocky Mountains, covers an exten-sive area, has a well-documented fire history,
Fire Ecology Volume 8, Issue 2, 2012doi: 10.4996/fireecology.0802082
Teske et al.: Fire-on-Fire InteractionsPage 85
and MTBS datasets are complete and available for each area. Additionally, each wilderness area has a management history of using fire to meet resource objectives and limited fire sup-pression during the study period. The Bob Marshall Wilderness Area has had a policy of using fire for resource benefit since 1981; the Selway-Bitterroot Wilderness Area since 1972; and the Frank Church Wilderness Area since 1988 (Fischer 1984, USDA 2004). Suppres-sion techniques have been allowed and used in each of the areas since the adoption of their re-spective management plans, but a systematic, spatially explicit dataset describing how indi-vidual fires were managed (i.e., full suppres-sion, point protection, or allowed to burn) does not exist. For this study, then, we do not at-
tempt to differentiate the relative effects of suppression from natural processes on the siz-es and shapes of fires in the study areas, and assume that suppression effects are minor and randomly distributed across the study areas. A caveat to this assumption is the possibility that suppression activities may have been concen-trated where fires threatened to cross adminis-trative boundaries, but this caveat was not test-ed due to lack of data.
The Bob Marshall Wilderness Area. The Greater Bob Marshall Wilderness Area is lo-cated in the northern Rocky Mountains of Montana, and consists of four administrative areas: Glacier National Park, the Bob Marshall Wilderness Area, the Great Bear Wilderness
Figure 1. The three wilderness study areas. Figures 1a, 1b, and 1c show the locations of large fires (grey) and re-burn areas (black) within the respective wilderness areas.

Fire Ecology Volume 8, Issue 2, 2012doi: 10.4996/fireecology.0802082
Teske et al.: Fire-on-Fire InteractionsPage 86
Area, and the Scapegoat Wilderness Area. It is the most northerly of the study areas, is aligned in a north-south direction, and has a precipita-tion gradient decreasing from west to east. El-evations range between 970 m and 3200 m. The climate on the west side of the predomi-nantly north-south oriented mountain ranges is characterized as a modified maritime climate, while the east side is continental; annual pre-cipitation ranges from 40 cm in the valleys to 350 cm at high elevations (Keane et al. 1994, Selkowitz et al. 2002). Climax species include subalpine fir (Abies lasiocarpa [Hook.] Nutt.), western redcedar (Thuja plicata Donn ex D. Don.), western hemlock (Tsuga heterophylla [Raff.] Sarg.), Douglas-fir (Pseudotsuga men-ziesii [Mirb.] Franco), and some remnant pon-derosa pine (Pinus ponderosa Lawson and C. Lawson)-bunchgrass prairie communities (Arno 1980, Keane et al. 1994, NPS 2010). Because of natural processes including wild-fire, seral community types such as western larch (Larix occidentalis Nutt.), lodgepole pine (Pinus contorta Douglas ex Loudon), and as-pen (Populus tremuloides Michx.), as well as
shrub fields, can be found across much of the Bob Marshall Wilderness Area (Arno 1980, NPS 2010). At higher elevations, especially in flat areas above treeline, alpine meadows and rocky barrens are common. Most wildfires oc-cur during the summer months, and September winds associated with the southward migration of the polar front occasionally cause sudden and dramatic increases in fire sizes (Keane et al. 1994, Arno 2000, Keane et al. 2006). In the subalpine forests, small fires are common, but large fires can and do occur when condi-tions align. Re-burning in this forest type does happen, although the occurrence of short-inter-val re-burns (i.e., less than 30 years between fires) is low (Baker 2009). Fire frequency is similar between the Bob Marshall and Selway-Bitterroot wilderness areas, but lower than the Frank Church Wilderness Area. Table 1 lists published fire regime information for each of the three study areas.
The Selway-Bitterroot Wilderness Area. Located in the northern Rocky Mountains of Idaho and Montana, the Selway-Bitterroot
Source Study area Fire rotation (yr) Fire regime descriptionArno, 1980 BM 40 to 150 Mixed severity—high to low frequencyBarrett et al. 1991 BM 25 to 75 Mixed severity—high frequency
BM 120 to 350 Stand replacing—low frequencyBrown et al. 1994 SB 54 to 197 Stand replacing—low frequency
SB 22 to 56 Low- to mixed-severity—high frequencyKipfmueller, 2003 SB 139 to 341 Stand replacing—low frequencyRollins et al. 2001 SB 194* Includes all fire regimesBarrett and Arno 1988 FC 4 to 41 Low severity—high frequency
FC 40 to 200 Stand replacing—low frequencyUSDA 2002 FC 15 to 84* Low severity—high frequency
FC 35 to 105* Mixed severity—high frequencyFC 75 to 100* Mixed severity—low frequencyFC 150 to 198* Stand replacing—low frequency
Table 1. Published fire history data for each of the three study areas: Bob Marshall (BM), Selway-Bitter-root (SB), and Frank Church (FC). Estimates of present-day fire rotations are indicated with an asterisk (*). Other estimates of fire rotation, derived from contemporary fire history studies, are considered historical rotations for the purposes of this paper.

Fire Ecology Volume 8, Issue 2, 2012doi: 10.4996/fireecology.0802082
Teske et al.: Fire-on-Fire InteractionsPage 87
Wilderness Area is the third largest wilderness area in the United States (Finklin 1983, Brown et al. 1994). The Selway-Bitterroot Wilder-ness Area is latitudinally positioned between the Frank Church and the Bob Marshall wil-derness areas. It is the smallest of the three study areas and has a round shape. The area has been the subject of many fire history stud-ies due to its pristine nature (e.g., Barrett and Arno 1988, Brown et al. 1994, Shiplett and Neuenschwander 1994, Kipfmueller and Swet-nam 2000, Rollins et al. 2001). The topogra-phy of the Selway-Bitterroot Wilderness Area is complex and supports a wide range of vege-tation, with vast areas of rolling, timbered ridges cut by a deep river canyon and punctu-ated with isolated clusters of taller peaks (Fin-klin 1983, Cooper et al. 1991, Kipfmueller and Swetnam 2000). Elevations range from 500 m at the lowest point along the Selway River to just over 2800 m at the highest peak. The cli-mate is characterized by an inland-maritime climate in the northwest that transitions into a continental climate to the southeast (Finklin 1983, Kipfmueller and Swetnam 2000). Pre-cipitation ranges from 63 cm along the south-ern wilderness boundary to 102 cm along the western portion of the Selway River, to over 178 cm in the Bitterroot Mountains (Finklin 1983). Subalpine species dominate the area overall, followed by Douglas-fir, and grand fir (Abies grandis [Douglas ex D. Don] Lindl.). Ponderosa pine dominates the lower elevation dry sites, and western redcedar-western hem-lock mixtures are found in wet sites. Middle elevations tend to be Douglas-fir and grand fir, but lodgepole pine and western larch are also common. Upper elevations are composed of Engelmann spruce (Picea englemannii Parry ex Engelm.) and subalpine fir, although white-bark pine (Pinus albicaulis Douglas) and sub-alpine larch (Larix lyallii Parl.) can be found on the most extreme (e.g., harsh and exposed) sites (Brown et al. 1994, Kipfmueller and Swetnam 2000). The uppermost elevations are often sparsely vegetated bedrock and talus slopes, especially along the Bitterroot crest.
Generally, the Selway-Bitterroot Wilderness Area’s fire regime is classified as a mixed se-verity regime. The fire season typically begins in mid-June and lasts through late September, with most of the area generally burning later in the summer (Finklin 1983, Brown et al. 1994, Kipfmueller and Swetnam 2000). Lower ele-vation fires span the range from frequent, non-lethal understory burning to long fire intervals between patchy and stand-replacing fires. Up-per elevations are characterized by long inter-vals between large stand-replacing fires. As noted previously, fire frequency in the Selway-Bitterroot Wilderness Area is on par with what occurs in the Bob Marshall Wilderness Area, but lower than the Frank Church Wilderness Area.
The Frank Church Wilderness Area. Des-ignated as a wilderness area in 1980, the Frank Church River of No Return Wilderness Area is the second largest designated wilderness area in the contiguous states, and is only narrowly separated from the Selway-Bitterroot Wilder-ness Area by the 180 m wide Magruder Corri-dor. It is the most southerly of the three study areas, is generally drier and more topographi-cally dissected by river breaks than the other study areas, and is hallmarked by strong envi-ronmental gradients connecting dry, low-ele-vation grasslands to subalpine forests. Deep, narrow canyons and ridges run in all directions with some peaks surpassing 3050 m in eleva-tion (Finklin, 1988). Average annual precipi-tation ranges from 38 cm to 43 cm in canyon bottoms to 130 cm to 150 cm or more in the western mountains, with snow contributing most of the precipitation in elevations above 1500 m (Finklin 1988). Vegetation species in-clude ponderosa pine and grass at lower eleva-tions, spruce and fir at the highest elevations, and Douglas-fir and lodgepole pine covering a majority of the rest of the area (Barrett and Arno 1988, Finklin 1988). Lightning and thunderstorms are generally active from May through September, with peak activity during June through August, and with a higher occur-

Fire Ecology Volume 8, Issue 2, 2012doi: 10.4996/fireecology.0802082
Teske et al.: Fire-on-Fire InteractionsPage 88
rence in the mountainous northeastern part of the study area. Lightning-caused fires are common in the Frank Church Wilderness Area (Finklin 1988), particularly in the river breaks where dry conditions and fine fuels are often conducive to burning. Overall, the fire regime can be classified as a mixed severity regime because the effects of fires differ by forest type (Arno 1980). Compared with the other study areas, the Frank Church Wilderness Area ex-periences more high frequency and low sever-ity fire. Even in the long-return-interval re-gimes of the Frank Church Wilderness Area, fire frequency is considerably higher than in the other two study areas.
Datasets
The primary source of data for this study is vector data from the Monitoring Trends in Burn Severity (MTBS) project. The MTBS dataset is a recently developed national dataset available from the USDA Forest Service’s Re-mote Sensing Applications Center (Eidenshink et al. 2007). The dataset is comprised of re-motely sensed data products for large wildfires (greater than 405 ha in the West) created from LANDSAT 5 TM and LANDSAT 7 ETM+ im-agery. The data products in this census of large fires (405 ha and larger) are derived from re-motely sensed imagery with consistent meth-odologies and include burned area delineations (vector layers) and fire severity images (ras-ters) at 30 m spatial resolution. The burned ar-eas for individual large fires are comprehen-sive for the three wilderness areas. The MTBS burned area delineations are hereafter referred to as fire perimeters.
The MTBS dataset provides unique oppor-tunities to study fire-on-fire interactions by fa-cilitating a systematic and objective analysis of the effects of all large wildfires occurring since 1984. An objective, verifiable, and replicable assessment of wildfire interactions is made pos-sible using the MTBS dataset in combination with the three wilderness areas, which act to
filter confounding variables such as different land management objectives, fire suppression techniques, and differences in fire mapping techniques for non-forested locations.
Notably, fires less than 405 ha are not in-cluded in the MTBS dataset, which has the po-tential to censor re-burn and fire size distribu-tions. To address this concern, the MTBS analysis was supplemented with data from a regional fire atlas compiled by Gibson (2005), which was further updated with fire perimeters through 2007 obtained by data-mining region-al fire records. This atlas includes fires of all sizes, and was used to examine whether small fires interacted with large fires (and vice ver-sa). Because the perimeters of small fires are not derived systematically and are known to contain errors (Morgan et al. 2001, Lentile et al. 2006), the fire atlas was used only to exam-ine the spatial coincidence of small fires with larger ones, in order to assess the likelihood that small fires have influenced the sizes and shapes of other fires. The results from this analysis are presented in a separate section from the MTBS-based analysis.
MTBS fire perimeters are derived by dis-criminating the outermost extent of burned ar-eas using a conventional change detection met-ric, the delta-NBR (dNBR; Key and Benson 2004). From MTBS perimeters, we locate shared perimeters and intersections of multiple fires using a geographic information system (GIS). Intersections are defined as areas in which two fires overlap (i.e., a re-burned area) and are greater than 40 ha. Fire perimeters that touch, as well as intersections less than 40 ha or less than 60 m wide, are defined as shared perimeter, or shared edge between fires. Shared perimeters are considered to be the edge where a previous fire constrains the ex-tent of a subsequent fire (e.g., extent-con-strained [Collins et al. 2009]). The ‘greater than 40 ha’ and the ‘60 m wide’ conditions were selected based on similar fire studies (e. g., see Collins et al. 2009), existing standard fire size classification thresholds used by poli-

Fire Ecology Volume 8, Issue 2, 2012doi: 10.4996/fireecology.0802082
Teske et al.: Fire-on-Fire InteractionsPage 89
cy makers and in fire reporting (NWCG 2006), and map resolution.
Re-burned areas were classified by size thresholds based on standard fire size classes used by fire management and policy makers (NWCG 2006). Using standard fire size class-es for reporting units facilitates easy compre-hension of results by fire managers already ac-customed to these units. Three size classes were used: 40 ha to 121 ha (NWCG Class D), 121 ha to 405 ha (NWCG Class E), and >405 ha (NWCG classes F and G, combined). Time-since-previous-fire (TSPF) was calculated by subtracting the year of the first fire from the year of the subsequent fire in order to assess relationships between TSPF and re-burn sizes.
Natural Fire Rotations
The Natural Fire Rotation (NFR) is a fire regime characteristic that describes the amount of time needed to burn a specified proportion of a study area (Agee 1993, Baker 2009). This value is expressed in years, and is often used when describing the rate of burning in a given location. The NFR may be derived for large areas that contain different fire regimes (Agee 1993). Area-based measures, such as the NFR, are necessary to reconstruct the fire regime (Baker 2009) for a given location. The NFR for a landscape should equal the mean fire in-terval (Baker 2009), and because it is not ex-plicit in a spatial sense, NFR includes areas that burned more than once in the period of in-terest. The ecological meaning of NFR for large, diverse areas such as the wilderness ar-eas used in this study is admittedly limited, but the metric provides utility for assessing wheth-er the amount of recent fire is consistent with historical estimates.
In this study, we calculated the contempo-rary NFR for the time period 1984 to 2007 for each of the study areas (as a whole) using the following equation:
NFR = T (1) P
where T is the time period of interest (e.g., 1984 to 2007) and P is the proportion of the study area burned. Additionally, for each study area, we calculated the NFR for large fire years (i.e., how long it would take to burn the entire study area if only the area burned in large fire years is considered), for re-burns (i.e., how long it would take to burn the entire study area more than one time), and for once-burned sce-narios (i.e., how long would it take to burn the entire study area if locations only burned once). We compared these results to the pro-portion of the study area that burned, and to documented fire regime characteristics derived by other means (e.g., tree ring reconstructions and fire atlases) to determine if the NFRs de-rived from large wildfires in the recent past are complementary. Insights from this comparison will aid in understanding if present day large wildfires differ from wildfires in these areas historically (e.g., as derived from studies that span pre-European to modern suppression pe-riods) in terms of total area burned through time.
Random vs. Observed Fire Interactions
To determine whether the observed fire in-tersections were occurring more frequently than what would be expected due to chance, we performed a series of randomized fire oc-currences using a GIS. To create the random occurrence of fires, randomly located centroid points were generated within each wilderness area, and the actual fire perimeters from that wilderness area were re-centered on those ran-dom points. We maintained a constant burned area for each scenario as well as the same number, size, direction, and shape of fires. Non-burnable areas (e.g., barren, rock, wet meadows, water, etc.) accounted for less than 1 % of the total size of each study area and were not considered a factor when randomly assigning centroid locations. The process was repeated 50 times for each study area to ran-domize many possible outcomes of fire occur-rence and intersection on a neutral landscape.
Fire Ecology Volume 8, Issue 2, 2012doi: 10.4996/fireecology.0802082
Teske et al.: Fire-on-Fire InteractionsPage 90
This enabled a comparison of observed to ex-pected fire occurrence within each study area.
We then used the GIS to locate and analyze fire intersections and fire edges. Intersections and edges between fires occurring during the same year were ignored because it was impos-sible to differentiate a final perimeter of the fires by date. The average area of the intersec-tions for each of the 50 simulations in each wilderness area was calculated and compared to the actual area of fire intersections using box-and-whisker plots, the Mann-Whitney U test, and an independent sample Kolmogorov-Smirnov test.
It is worth noting that changing the num-ber, size, orientation, or shape of fires during the random simulations may provide different results given the strong directional trends in the data. Retaining the characteristic direction of fires is logical because that is how fires move in these landscapes, irrespective of the controls (e.g., fuels, weather, and topography). An alternative model allowing these traits to change could simulate fire characteristics not typical on these landscapes and result in per-pendicular intersections not seen in nature.
Fire Edge Interactions
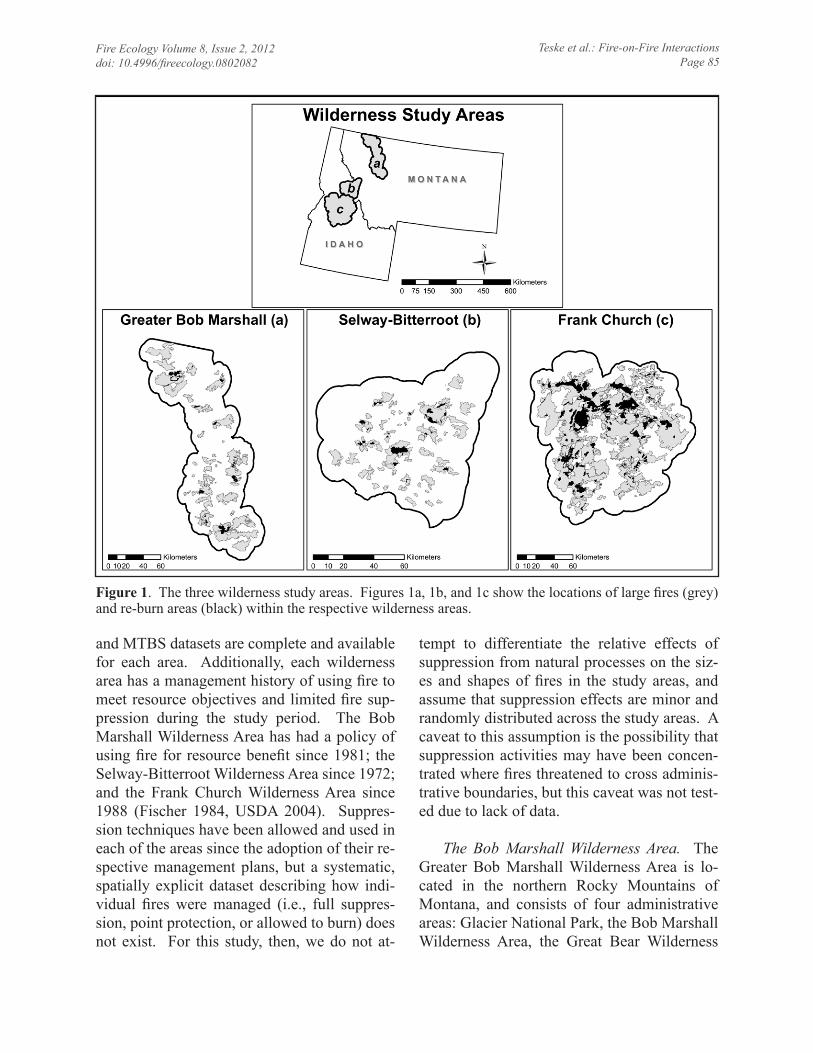
To determine the influences of previously burned fire edges on subsequent fire spread, we analyzed fire perimeters using a GIS and the Geospatial Modeling Environment (Beyer 2010). We quantified four different edge attri-butes for interacting fires: Total Available Edge, Edge Encountered, Length Shared, and Length Breached by fire. For each study area, the total annual fire perimeter was compiled, and the interior boundaries of overlapping ar-eas were removed. The effect was to create annual outer perimeter boundaries of previous-ly burned areas, which essentially served as the edge that was available for a future fire to encounter (i.e., the Total Available Edge). The earliest annual fire perimeters marked the start-ing condition for each area. Subsequent avail-
able perimeters were updated on an annual ba-sis in the GIS. For example, the starting year (e.g., 1985) and the next year with a fire (e.g., 1988) were updated, such that the new perim-eter became the cumulative outer extent of the two inputs (Figure 2).
The locations and amounts of Total Avail-able Edge that were encountered by subse-quent fires were thus identified, resulting in polylines depicting the total Edge Encountered on an annual basis. These common boundar-ies were analyzed to determine how much of the previous fire edges were shared by subse-quent fires (e.g., stopped the fire; Length Shared) versus how much was breached by subsequent fires (e.g., led to re-burns; Length Breached), regardless of the actual age of the perimeter. Finally, those areas in which the Edge Encountered polylines were overlapped by fire intersections (i.e., re-burned areas) were identified. These locations were attributed as Length Breached; locations at which the Edge Encountered polylines did not overlap with fire intersections represented Length Shared. Al-though the cumulative outer extent could span many years, with different segments of the pe-rimeter being different ages, the different ages of the outer extent were not considered. The purpose of this exercise was to identify the lo-cations of edges and re-burns and to quantify the Total Available Edge, the total Length En-countered, the total amount of previously cre-ated perimeter that stopped new fires, and the total amount of edge that was breached. Total length of Edge Encountered, Edge Shared, and Edge Breached were summarized for each study area by year and over the entire period.
resULts
Extent of Burning and Re-burning by Large Fires
In the 24 year record, the Frank Church Wilderness Area experienced at least one large fire (greater than 405 ha) in 23 of those years,

Fire Ecology Volume 8, Issue 2, 2012doi: 10.4996/fireecology.0802082
Teske et al.: Fire-on-Fire InteractionsPage 91
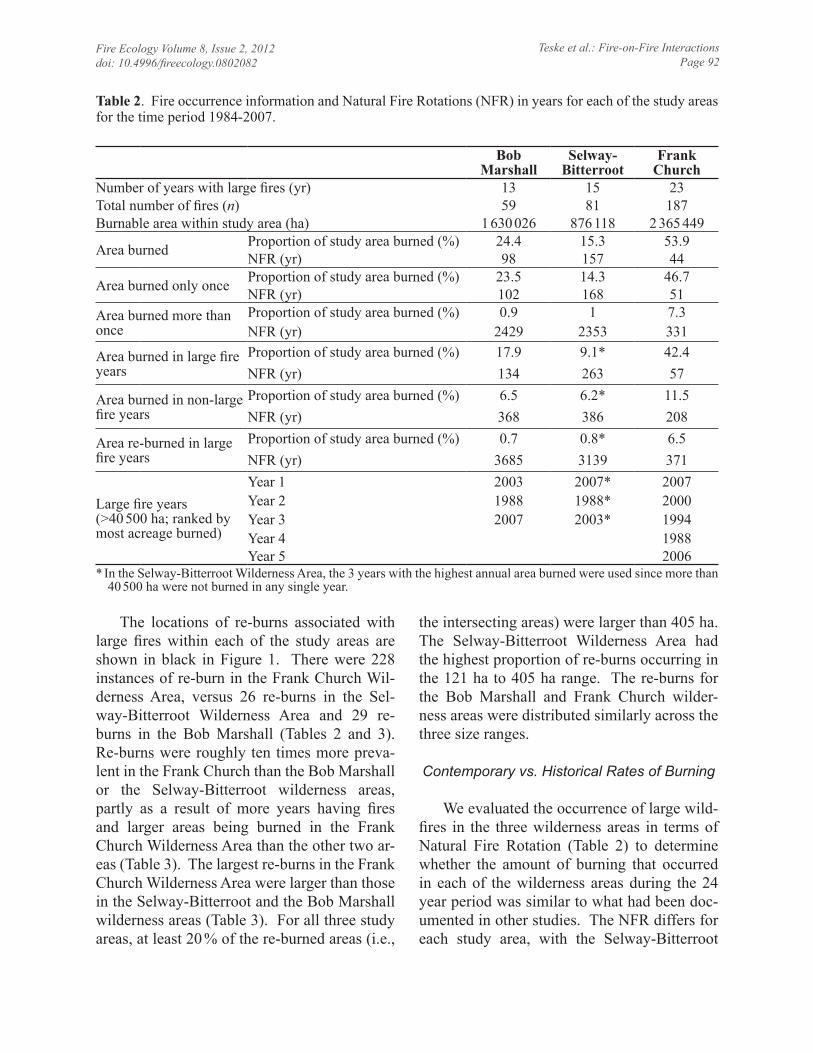
and also had the highest number of large wild-fires (n = 187; Table 2). The Bob Marshall Wilderness Area had the lowest number of years with large wildfires (n = 13), as well as the fewest large fires (n = 59). In total, more than half of the Frank Church, one quarter of the Bob Marshall, and fifteen percent of the Selway-Bitterroot wilderness areas burned and re-burned. Despite the large areas burned, only a small fraction of each wilderness area burned more than once (i.e., 0.9 %, 1.0 %, and 7.3 % in the Bob Marshall, Selway-Bitterroot, and Frank Church wilderness areas, respec-tively; Table 2c). In the Bob Marshall Wilder-ness Area, for every 100 ha that burned, 4 ha
re-burned for the 24 year period. The rate of re-burning was 7 ha per 100 ha in the Selway-Bitterroot Wilderness Area and 13 ha per 100 ha in the Frank Church Wilderness Area for the 24 year period. Most fire occurred in a few large fire years, defined in this study as the years when more than 40 500 ha burned annu-ally (i.e., 100 times the minimum fire size in the dataset). The largest fire years for each study area were different, and the Selway-Bit-terroot Wilderness Area did not have any large fire years by the definition given above. The last time 40 500 ha burned in a single year in the Selway-Bitterroot Wilderness Area was in 1934 (Gibson 2005).
Figure 2. Fire edge and boundary development using ArcGIS. The polygons (representing fires) from consecutive years were combined (grey column on left), then the overlaps that occurred were identified and the edge that was encountered during the most recent fire year was determined (second column, white). Finally, the interior lines were eliminated (third column, grey). This final mesh of outer fire perimeters became the Total Available Edge for fires in the next fire year. The process was repeated through the end of the fire years. Final products included Total Available Edge, Edge Encountered, Length Shared, and Length Breached by fire.
Fire Ecology Volume 8, Issue 2, 2012doi: 10.4996/fireecology.0802082
Teske et al.: Fire-on-Fire InteractionsPage 92
The locations of re-burns associated with large fires within each of the study areas are shown in black in Figure 1. There were 228 instances of re-burn in the Frank Church Wil-derness Area, versus 26 re-burns in the Sel-way-Bitterroot Wilderness Area and 29 re-burns in the Bob Marshall (Tables 2 and 3). Re-burns were roughly ten times more preva-lent in the Frank Church than the Bob Marshall or the Selway-Bitterroot wilderness areas, partly as a result of more years having fires and larger areas being burned in the Frank Church Wilderness Area than the other two ar-eas (Table 3). The largest re-burns in the Frank Church Wilderness Area were larger than those in the Selway-Bitterroot and the Bob Marshall wilderness areas (Table 3). For all three study areas, at least 20 % of the re-burned areas (i.e.,
the intersecting areas) were larger than 405 ha. The Selway-Bitterroot Wilderness Area had the highest proportion of re-burns occurring in the 121 ha to 405 ha range. The re-burns for the Bob Marshall and Frank Church wilder-ness areas were distributed similarly across the three size ranges.
Contemporary vs. Historical Rates of Burning
We evaluated the occurrence of large wild-fires in the three wilderness areas in terms of Natural Fire Rotation (Table 2) to determine whether the amount of burning that occurred in each of the wilderness areas during the 24 year period was similar to what had been doc-umented in other studies. The NFR differs for each study area, with the Selway-Bitterroot
Bob
MarshallSelway-
BitterrootFrank
ChurchNumber of years with large fires (yr) 13 15 23Total number of fires (n) 59 81 187Burnable area within study area (ha) 1 630 026 876 118 2 365 449
Area burned Proportion of study area burned (%) 24.4 15.3 53.9NFR (yr) 98 157 44
Area burned only once Proportion of study area burned (%) 23.5 14.3 46.7NFR (yr) 102 168 51
Area burned more than once
Proportion of study area burned (%) 0.9 1 7.3NFR (yr) 2429 2353 331
Area burned in large fire years
Proportion of study area burned (%) 17.9 9.1* 42.4NFR (yr) 134 263 57
Area burned in non-large fire years
Proportion of study area burned (%) 6.5 6.2* 11.5NFR (yr) 368 386 208
Area re-burned in large fire years
Proportion of study area burned (%) 0.7 0.8* 6.5NFR (yr) 3685 3139 371
Large fire years (>40 500 ha; ranked by most acreage burned)
Year 1 2003 2007* 2007Year 2 1988 1988* 2000Year 3 2007 2003* 1994Year 4 1988Year 5 2006
Table 2. Fire occurrence information and Natural Fire Rotations (NFR) in years for each of the study areas for the time period 1984-2007.
* In the Selway-Bitterroot Wilderness Area, the 3 years with the highest annual area burned were used since more than 40 500 ha were not burned in any single year.

Fire Ecology Volume 8, Issue 2, 2012doi: 10.4996/fireecology.0802082
Teske et al.: Fire-on-Fire InteractionsPage 93
Wilderness Area having the longest overall NFR (157 yr) and the Frank Church Wilder-ness Area having the shortest NFR (44 yr). The Selway-Bitterroot Wilderness Area’s NFR was nearly three and a half times longer than the NFR for the Frank Church Wilderness Area, despite sharing administrative boundar-ies. When the NFR was calculated using only the areas that burned once, each wilderness ar-ea’s NFR remained nearly the same as its over-all NFR because such a small fraction of each of the landscapes burned multiple times. In all instances, when only the large fire years were used to calculate the NFR, the resultant NFRs were slightly longer. However, if large fire years were removed, the NFRs became much longer. While this may seem an obvious re-
sult, the numbers illustrate the importance of large fire years in maintaining the fire regimes of the study areas, and given that contempo-rary NFRs derived from the MTBS perimeter data for the 24 year period of record were within the ranges published for the different fire regimes (Table 1) in each of the study ar-eas, it is reasonable conclude that recent area burned was not atypical of historical area burned.
Frequency and Size of Re-burns
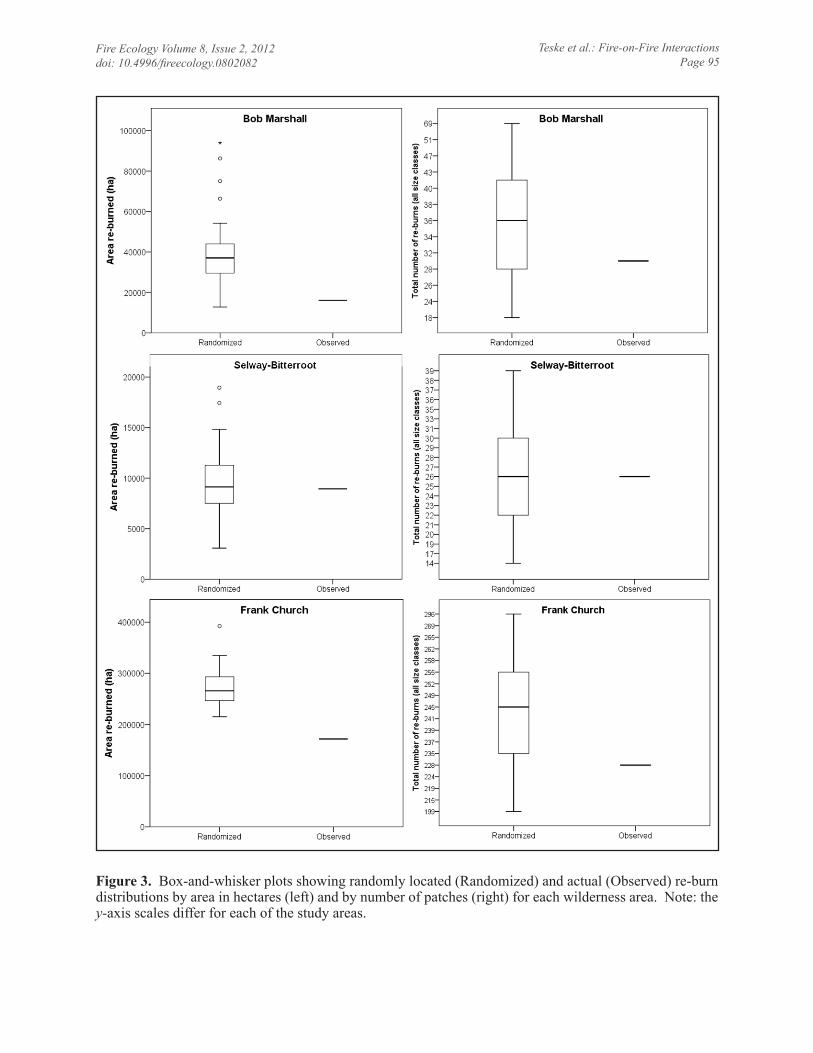
Comparison of random fire occurrences with observed occurrences showed that the to-tal area of re-burn observed for the Selway-Bitterroot Wilderness Area was nearly identi-
Re-burn size class (ha)40 to 121 121 to 405 >405 Total
Bob
Mar
shal
l Observed
Frequency 11 6 12 29Proportion of total occurrence (%) 38 % 21 % 41 % 100 %Total area re-burned (ha) 698 1 593 13 853 16 144Average size of re-burn (ha) 63 266 1 154 557
Random
Average frequency 8 10 18 36Proportion of total occurrence (%) 22 % 28 % 18 % 100 %Average total area re-burned (ha) 606 2 413 36 078 39 098Average size of re-burn (ha) 73 237 2 025 1 075
Selw
ay-B
itter
root
Observed
Frequency 13 8 5 26Proportion of total occurrence (%) 50 % 31 % 19 % 100 %Total area re-burned (ha) 925 2 070 5 942 8 937Average size of re-burn (ha) 71 259 1 188 344
Random
Average frequency 8 11 7 26Proportion of total occurrence (%) 31 % 42 % 27 % 100 %Average total area re-burned (ha) 572 2 702 6 317 9 591Average size of re-burn (ha) 73 240 880 366
Fran
k C
hurc
h Observed
Frequency 85 63 80 228Proportion of total occurrence (%) 37 % 28 % 35 % 100 %Total area re-burned (ha) 6 040 15 535 150 099 171 674Average size of re-burn (ha) 71 247 1 876 753
Random
Average frequency 54 72 118 244Proportion of total occurrence (%) 22 % 30 % 48 % 100 %Average total area re-burned (ha) 3 968 17 775 251 656 273 399Average size of re-burn (ha) 74 247 2 134 1 122
Table 3. Characteristics of observed and randomly located re-burns by size class for each study area. Size class thresholds reflect the common fire size classes as recognized by the NWCG (2006). The numbers for the random values reflect the average of the 50 simulations.

Fire Ecology Volume 8, Issue 2, 2012doi: 10.4996/fireecology.0802082
Teske et al.: Fire-on-Fire InteractionsPage 94
cal to the range of values exhibited by the sim-ulated random fires occurring across that land-scape (Figure 3, Table 3). The area of re-burn observed in the Frank Church Wilderness Area was lower than would be expected if fires were randomly occurring on the landscape, and the amount of re-burn observed in the Bob Mar-shall Wilderness Area also occurred at the low end of the randomly located amount of re-burn. In addition, the numbers of re-burn patches were fewer than expected by chance in the Bob Marshall and Frank Church wilder-ness areas but identical to chance in the Sel-way-Bitterroot Wilderness Area (Figure 3, Ta-ble 3). In all of the wilderness areas, the num-ber of small re-burn patches (40 ha to 121 ha) was greater than was predicted, while the num-ber of medium (121 ha to 405 ha) and large patches (>405 ha) was less. Differences were within one standard deviation of the random-ized means.
If one considers the distributions of re-burned patch sizes, only in the Frank Church Wilderness Area was there a statistically sig-nificant difference between the observed ver-sus the random (Table 4; Mann-Whitney U = 1 118 051; n = 12 412; P < 0.001). For both the Bob Marshall and the Selway-Bitterroot wilderness areas, there was not a significant difference at P < 0.05 between the observed and the random re-burn patch size distributions (Bob Marshall Wilderness Area, U = 20 948; n = 1847, P = 0.057; Selway-Bitterroot Wilder-ness Area, U = 13 628, n = 1337, P = 0.080). Kolmogorov-Smirnov independent samples test results also indicated that there were sig-nificant differences between observed and ran-dom re-burn patch size distributions in the Frank Church Wilderness Area but not in the other study areas (Table 4). In short, re-burn appears to have occurred less frequently than chance in the Frank Church Wilderness Area, perhaps less frequently in the Bob Marshall Wilderness Area, and the same as chance in the Selway-Bitterroot Wilderness Area.
Fire Propagation in Recently Burned Landscapes
In each of the three study areas, the total amount of edge at which a fire met another fire was less than 3 % of the total available perim-eter (i.e., Bob Marshall Wilderness Area [1.4 %], Selway-Bitterroot Wilderness Area [1.4 %], Frank Church Wilderness Area [2.9 %]; Table 5). However, in each study area, nearly 80 % of the total edge encountered was breached, resulting in fire spreading into the previously burned landscape (based on cri-teria identified in methods; Table 5). Year-to-year variability in re-burn occurrence was high. For example, the Frank Church Wilder-ness Area had three years during which all of the edges encountered were burned over (1987, 1988, and 2001). In the two largest fire years (2007 and 2000), fires encountered the most edge, breaching 80 % of that edge. In the Bob Marshall Wilderness Area, 82 % of the edge encountered in the largest fire year (2003) led to re-burn. Only 2001 had a higher percentage of edge leading to re-burned areas (96 %), largely as a result of one of the largest fires in the study area re-burning across and around three smaller fires. In the Selway-Bitterroot Wilderness Area, 2007 was the largest fire year, as well as the year in which the most edge was encountered and the most edge was breached.
Although it is common for a new fire to breach an edge and re-burn, large fires that oc-cur completely within previously burned areas are rare. Only one instance was observed in the Bob Marshall Wilderness Area, and two in-stances in the Frank Church Wilderness Area (of which only one was during a large fire year). There were also three instances in the Frank Church Wilderness Area in which more than 95 % of a subsequent fire occurred within a previously burned area, although the data did not indicate whether these fires started outside of the previous fire and spread into it, or whether they started within the previous fire
Fire Ecology Volume 8, Issue 2, 2012doi: 10.4996/fireecology.0802082
Teske et al.: Fire-on-Fire InteractionsPage 95
Figure 3. Box-and-whisker plots showing randomly located (Randomized) and actual (Observed) re-burn distributions by area in hectares (left) and by number of patches (right) for each wilderness area. Note: the y-axis scales differ for each of the study areas.

Fire Ecology Volume 8, Issue 2, 2012doi: 10.4996/fireecology.0802082
Teske et al.: Fire-on-Fire InteractionsPage 96
and spread out of it. None of these re-burns occurred in the same year as the first fire, and the TSPF ranged between 2 years and 13 years.
Time-Since-Previous-Fire and Re-burn Occurrence
Time-since-previous-fire is the difference, expressed in years, between the year of an ini-tial fire and the year of a subsequent fire. There is a general decrease in the frequency of small and medium re-burns as TSPF increases in all three wilderness areas (Figure 4). Large re-burns generally occurred six or more years after
the initial fires burned, although there is no ap-parent trend for either the Selway-Bitterroot or the Bob Marshall wilderness areas for this size-range of re-burns as TSPF increases. Data for the Frank Church Wilderness Area, however, indicated that as TSPF increased, the frequency of large re-burns increased, while both small and medium re-burn frequency decreased.
The Role of Small Fires in Burning and Re-burning
Although large fires generally contribute the majority of area burned (Calkin et al. 2005), most fires are small. Of the study areas,
Bob Marshall Selway-Bitterroot Frank ChurchNumber of re-burn cases (n) 1 847 1 337 12 412Mean re-burn patch size (ha) 1 067.2 365.4 1 115.2Median re-burn patch size (ha) 388.4 224.9 382.4Maximum re-burn patch size (ha) 20 259 5 091 50 602Standard deviation 1 805.6 453.0 2 437.6Mann-Whitney U 20 948 13 628 1 118 051Significance (P) 0.057 0.080 0.000Kolmogorov-Smirnov significance (P) 0.270 0.082 0.000
Table 4. The results of comparisons between observed and randomized re-burn patch size distributions for each of the three study areas. The distributions of all observed and randomized re-burn patches greater than 40 ha in size were tested using the Mann-Whitney U test statistic and the Kolmogorov-Smirnov Inde-pendent Samples Test (both using α = 0.05). Only the Frank Church Wilderness Area showed a difference between the observed and randomized re-burn patch size distributions (indicated by bolded significance values).
Bob Marshall Selway-Bitterroot Frank ChurchTotal Available Edge (km) 21 248 12 716 66 104Total Edge Encountered (km)Proportion of Available Edge (%)
3061.4
1741.4
1 9162.9
Total Length Shared (km)Proportion of Total Edge Encountered (%)
6320.6
3218.4
32316.9
Total Length Breached (km)Proportion of Total Edge Encountered (%)
24279.1
14281.6
1 59483.2
Table 5. Edge characteristics of fire-on-fire interactions for each study area. Nearly 80 % of the previ-ously created fire edges encountered by a subsequent fire were breached, leading to a re-burn of greater than 40 ha.

Fire Ecology Volume 8, Issue 2, 2012doi: 10.4996/fireecology.0802082
Teske et al.: Fire-on-Fire InteractionsPage 97
the Frank Church Wilderness Area had the lowest proportion of small fires (55 % of fire occurrences were less than 405 ha), and these fires accounted for 2 % of total area burned. In the Selway-Bitterroot Wilderness Area, 71 % of all fires were small, accounting for 12 % of total area burned, while small fires accounted for 75 % of fire occurrences and 2 % of total area burned in the Bob Marshall Wilderness Area.
Small fires were dispersed widely in each of the study areas, with a total of 580 small fires recorded in the fire atlas between the three areas (n = 149 in the Bob Marshall Wilderness Area, n = 185 in the Selway-Bitterroot Wilder-ness Area, and n = 246 in the Frank Church Wilderness Area). Thirty percent of small fires in both the Bob Marshall and the Selway-Bit-terroot wilderness areas interacted with other fires in the period of record, and 66 % of small fires in the Frank Church Wilderness Area in-teracted with other fires. There were few cases of fire-on-fire interactions involving only small fires (n = 18 out of 435 interactions; Table 6), with the caveat that fires occurring within the same year were not considered because differ-entiation of burning dates was not possible. Across study areas, the majority of interactions involving small fires occurred when large fires burned into or around small fires (n = 316); re-burns (>40 ha) of this type occurred 116 times for a total of 16 008 ha. There were 101 in-stances of small fires burning into large fires, of which 19 resulted in re-burn of at least 40 ha, totaling 2593 ha. It is worth noting that most of the fire-on-fire interactions involving small fires did not result in re-burn because most of the small fires were below the size threshold established for re-burn in this study (i.e., less than 40 ha).
Although it is difficult to assess the cumu-lative impacts of small fires on the re-burn phenomenon, given quality concerns with fire atlas perimeter data, we observed 101 instanc-es in which small fires may have been con-strained by large fires ,and another 316 in-
Figure 4: Frequency of re-burn patch size occur-rence by time-since-previous-fire for each wilder-ness area. Note that the frequency for the Frank Church Wilderness Area is different than for the other two study areas.

Fire Ecology Volume 8, Issue 2, 2012doi: 10.4996/fireecology.0802082
Teske et al.: Fire-on-Fire InteractionsPage 98
stances in which large fires burned around or through small fires. With the addition of small fires, the total area re-burned in the study areas increased by 0 %, 0.3 %, and 0.6 % in the Bob Marshall, Selway-Bitterroot, and Frank Church wilderness areas, respectively. In the Selway-Bitterroot Wilderness Area, the rate of re-burn-ing increased from 7 ha per 100 ha burned to 8 ha per 100 ha burned; the rate remained un-changed in the other two wilderness areas.
disCUssion
Our research provides a systematic assess-ment of fire-on-fire interactions in three large wilderness areas of the northern Rocky Moun-tains. As such, it represents a perspective for exploring one aspect of fire regime character-istics by describing the interactions of older fires with subsequent fires using consistent data, criteria, and definitions. We explicitly quantify edge effects, the relationships of edg-es with re-burns, and re-burn characteristics. The results show a high degree of complexity in the fire-on-fire interactions of large wild-fires.
The analysis of MTBS perimeters showed that in the majority of cases, when a fire met an edge created by a previous fire, it led to a small re-burn (40 ha to 121 ha). This occurred more often during large fire years than other
years, supporting the notion that climate con-ditions leading up to and during large fire years probably contribute strongly to the ability of a fire to spread on recently burned landscapes (Heyerdahl et al. 2008; Morgan et al. 2008). The fact that most of the re-burned areas are small suggests that the effects of a previous fire (e.g., modification of the fuel bed and post-fire succession) keep the spread of subsequent fires in check much of the time, irrespective of climatic influences. In each of the study areas, most of the small re-burns occurred within the first ten years following an initial fire, which is similar to findings in the Sierra Nevada region reported by Collins et al. (2009), but it is diffi-cult to infer too much from this result given the short period of record. There are a number of re-burned patches that would be considered large fires by fire management standards (NWCG 2006), although instances of large re-burns are not common within the first five years following an initial fire. From these re-sults, we infer that the conditions that allow large wildfires to burn onto previously burned areas are more favorable in large fire years; that the ability of an old fire to limit the spread of a new fire is not the same all the time; that fires do not often spread widely on previously burned landscapes; and that there is a wide spectrum of possible outcomes for fire-on-fire interactions.
Bob Marshall Selway-Bitterroot Frank ChurchTotal small fires (n) 149 185 246Total small fires with interactions (n) 47 55 162
Inte
ract
ion
type Small fire with small fire (n) 7 2 9
Small fire into large fire (n) 13 23 65
Large fire into small fire (n) 43 (68 %) 52 (68 %) 221 (75 %)
Total number interactions 63 77 295
Table 6: Fire-on-fire interactions involving small fires, derived from fire atlas data. Small fire with small fire interactions happen when small fires interact with each other; small fire into large fire interactions happen when a large fire burns prior to the small fire encountering it; large fire into small fire interactions occur when a small fire occurs prior to the large fire. The proportion of the total number of interactions is shown in parentheses. Note: individual small fires may be involved in more than one interaction.

Fire Ecology Volume 8, Issue 2, 2012doi: 10.4996/fireecology.0802082
Teske et al.: Fire-on-Fire InteractionsPage 99
Additional analyses of fire atlas data showed that small fires are burned across or around by large fires in almost every case, and small fires that burned into large fires remained small (by definition). The latter finding could indicate that large fires act as barriers to fire spread, resulting in small fires, and that the conditions under which large wildfires burn supersede any effect that small fires may have on stopping them. Both possibilities have im-plications from a fuel treatment standpoint be-cause they would imply that effective treat-ments would have to be very large. From an ecological perspective, these results cumula-tively suggest that fire propagation on previ-ously burned landscapes is a consequence of the complex interactions of the environmental conditions at the time of the incident, which is consistent with other research (Collins et al. 2009, Dillon et al. 2011).
In addition to suggesting that large fires generally constrain the extent of subsequent fires, the occurrence of mostly small re-burns results in many small openings and gaps in both the understory and overstory that likely contribute to landscape evolution in a number of ways. Post-fire patches—including those that burn more than once—add diversity to the landscape, provide additional mechanisms for successional pathways to exist, and promote differential tree recruitment and plant estab-lishment. Re-burns create patches in the vege-tation mosaic by breaking up larger vegetation patches, thereby promoting structural diversity on the landscape with perhaps disproportion-ately large ecological impacts.
The few large re-burns likely play a differ-ent ecological role than small re-burns in spite of the fact that there are more of the latter. The juxtaposition of large re-burned areas with un-burned, once-burned, and small re-burned ar-eas may impact species diversity and ecosys-tem resilience (Buma and Wessman 2011, Dil-lon et al. 2011). Species diversity (both plant and animal) could be enhanced if there are a variety of vegetation types and age classes, as
well as variations in patch size, shape, and dis-tribution across the landscape. Potential eco-logical impacts of large re-burns likely differ based on the homogeneity and arrangement of burned areas on the landscape. This includes such things as the types and amount of vegeta-tion that return following fires, and changes in site productivity for some time into the future. Areas that burn multiple times may serve to maintain a single species (which may be an undesirable species); for example, persistent grasslands or shrublands may be maintained on previously forested areas. Changes in land-scape structure and function as a result of in-vasive species include altered fire cycles (Buma and Wessman 2011) and changes in site productivity (Harrod 2001). However, if large re-burned areas are set back successionally and regenerate with the native vegetation types that existed in those locations previously, then the result might be increased age class and struc-tural diversity on the landscape, which may in-fluence future fire spread and behavior.
Although many of the largest fire years in this study have occurred since 2000, the occur-rence and size of fires in recent years are not unprecedented. We did not specifically test for trends in area burned, but our research shows that the total area burned, regardless of indi-vidual fire sizes, is within historical ranges published by others. Dillon et al. (2011) also showed no evidence of an increase in annual area burned for the northern Rockies. Large fires have occurred on these landscapes in the past, and are an inherent part of the ecology of these areas. In the early part of the 1900s, a number of large fires, during a few active fire years, were responsible for burning and re-burning much of the three wilderness areas (Rollins et al. 2001, Gibson 2005, Baker 2009), and remnant fire scars can still be seen on much of the landscape.
The fact that the size of re-burn patches and the amount of re-burn in the Frank Church Wilderness Area was significantly smaller than expected based on random simulations pro-

Fire Ecology Volume 8, Issue 2, 2012doi: 10.4996/fireecology.0802082
Teske et al.: Fire-on-Fire InteractionsPage 100
vides additional support to the idea that older fires constrain the spread of newer fires by act-ing as barriers, or perhaps suggests that the size and shape of the study area and its fires predisposes the landscape to produce less re-burn than expected by chance. Certainly the abundance of small (40 ha to 121 ha) re-burn patches (versus randomized) can be explained by the propensity of shared edges to intertwine in nature in ways that cannot be duplicated in random redistributions of large fire polygons. Conversely, the results for the Selway-Bitter-root Wilderness Area show that fires are gener-ally smaller, and that the observed numbers and sizes of re-burn patches are nearly identi-cal to what would be expected if fires were randomly distributed across the landscape. Local fire managers attribute the recent legacy of smaller fires to a relatively long history of fire use (G. Weldon, US Forest Service, per-sonal communication), yet our data show that fires have interacted infrequently in the Sel-way-Bitterroot Wilderness Area in comparison with the other two wilderness areas. If previ-ous fire is indeed constraining subsequent fire in the Selway-Bitterroot Wilderness Area, we would expect to see fewer, smaller re-burns and less re-burned area than modeled, as was observed in the Frank Church Wilderness Area. An alternative explanation might be that the fires that are currently occurring in the Selway-Bitterroot Wilderness Area are constrained by older fire scars that are outside of the time pe-riod of this study and whose influence cannot be determined. This landscape may still be re-covering from the fires in the early- to mid-1900s, when much of the area burned and re-burned, and the current fuels may not be pre-disposed to large fires. In any case, the fire in-teractions in the Selway-Bitterroot Wilderness Area are unexpectedly different in many ways from the Frank Church and Bob Marshall wil-derness areas, and deserve further exploration.
The factors that govern whether fires re-burn on previously burned landscapes are complex, and controlled by interactions of to-
pography, weather, and fuels. Given wildfire’s propensity to stop on topographic breaks such as ridgelines and drainages in the heavily dis-sected study areas, one would expect fire-on-fire interactions to occur most often in these places, especially in terms of shared edges. This assumption has not been tested for the study areas, although a qualitative assessment of fire perimeters in the Bob Marshall Wilder-ness Area showed that about 30 % of shared fire edges could be explained by the presence of ridges, drainage bottoms, trails, roads, and water bodies (D. Yost, National Center for Landscape Fire Analysis, unpublished data). The relative impacts of fuel discontinuities and weather are unknown, but our data sug-gest that fire readily burns onto previously burned landscapes nearly 80 % of the time, al-though rarely covering large areas. The latter result, combined with the fact that observed areas of re-burn are lower than what are pro-duced by random simulation in only one of the three study areas, suggests that fuels associat-ed with previous burns often have a dampen-ing effect on propagation of subsequent fires across much of the landscape. Additionally, the largest and most frequent incursions of fire-on-fire occur in large fire years, suggest-ing that climate and weather can override fu-els in the re-burn phenomenon.
As a result of the interactions of wildfires with each other, landscapes with assorted pat-terns of juxtaposed and interspersed vegetation species, age classes, and structures exist in each of the wilderness areas. These compo-nents must lead to variability in fire behavior and fire effects in the future as the landscape ages. Because the interactions of landscape patterns and process are continuous through time, the net effect is a dynamic, perhaps self-regulating landscape, whose components are created and influenced by fire, and have an ef-fect on future fires (Falk et al. 2007, McKenzie et al. 2011). Thus, part of the role of large wildfires in these wilderness areas—including the episodes of multiple large wildfires and the

Fire Ecology Volume 8, Issue 2, 2012doi: 10.4996/fireecology.0802082
Teske et al.: Fire-on-Fire InteractionsPage 101
interludes with few large wildfires—is to cre-ate and maintain an assortment of patches and edges across the landscape that preserve eco-logical diversity and function.
Confounding Factors and Additional Considerations
There are a number of considerations that may offer insight into our results. First, MTBS perimeter data alone may not be sufficient for fully enumerating fire-on-fire interactions. The inclusive dates of the MTBS dataset span only a portion of the fire rotation and thus provide a short period of record and an incomplete pic-ture of fire-on-fire interactions, especially for areas that typically have long fire rotations. Second, the MTBS project only maps large wildfires (i.e., greater than 405 ha). In spite of the fact that a few large fires contribute the majority of the total area burned, perhaps smaller fires (those less than 405 ha) or older ones are inordinately important in governing fire-on-fire interactions. The use of additional data sources such as historical fire atlases, which span longer time periods and include more small fires, may help to explain and cor-roborate the findings of this research, although the analyses of the Gibson (2005) fire atlas in this study did not suggest that small fires are influential in terms of stopping fires or in terms of area burned and re-burned (at least for the same 24 year time period). Third, this research only used vector-based data, but raster data characterizing fire severity, topography or veg-etation type, amount, and arrangements could offer insights into these results (e.g., see van Wagtendonk et al. 2012).
Additionally, MTBS data may not perform efficiently in some land cover types (e.g., grasslands) because of how the products are derived for individual fires. The actual amount of burned area may appear reduced when MTBS data are created for fires that burn in vegetation that greens up quickly following fire, such as grasses, because the MTBS prod-ucts for individual fires in predominantly for-
ested regions are derived using the Extended Assessment method (i.e., using imagery one-year post-fire) as opposed to the Initial Assess-ment method (i.e., using imagery immediately post-fire). For example, the MTBS perimeter for the 1988 Canyon Creek Fire in the Bob Marshall Wilderness Area is nearly 10 000 ha smaller in size than the fire perimeter that was mapped on the ground during the fire; the dif-ference in area is nearly all on the eastern side of the fire, which is predominantly grass. If this instance is common, then while it may be possible that old fires constrain fire spread in some areas, perhaps fire is actually burning and re-burning onto previously burned areas more frequently than is being captured by cur-rent MTBS methods. In such cases, calculated NFRs may be shorter—a real possibility in places like the Salmon River breaks in the Frank Church Wilderness Area, where the low-er reaches are predominantly grasslands.
Finally, although the MTBS project does provide a standardized, replicable method for analyzing fires, its data do not provide charac-terization of the management actions taken on any portion of the fires, and thus it is not pos-sible to filter the effects of suppression using the MTBS dataset alone. For this research, it was assumed that the effects of suppression actions on fire sizes were small and randomly distributed.
Additional characterization of fire-on-fire interactions would benefit from examination of factors such as the terrain, fuels, climate, biophysical settings, fire effects, management actions taken, and seasonality. The MTBS data also contains several additional raster data sets that characterize fire severity and land-scape change, which may provide explanatory power in further explorations of fire-on-fire in-teractions. Finally, consistent observations and documentation about fire-on-fire interac-tions by field-based fire observers during an active wildfire could enhance these results, and provide useful information to researchers and managers alike.
Fire Ecology Volume 8, Issue 2, 2012doi: 10.4996/fireecology.0802082
Teske et al.: Fire-on-Fire InteractionsPage 102
aCKnoWLedgMents
The authors would like to thank the MTBS staff at the USDA Forest Service Remote Sensing Applications Center for their assistance in providing feedback and answering questions related to this project. Additionally, we thank the National Center for Landscape Fire Analysis for the mon-etary and logistical support provided for this research. We are also grateful to the two anonymous reviewers whose suggestions helped improve the final version of this paper.
LiteratUre Cited
Agee, J.K. 1993. Fire ecology of Pacific Northwest forests. Island Press, Washington, D.C., USA.
Arno, S. 1980. Forest fire history in the northern Rockies. Journal of Forestry 78: 460-465.Arno, S. 2000. Fire regimes in western forest ecosystems. Pages 97-120 in: J.K. Brown and J.
Kapler-Smith, editors. Wildland fire in ecosystems: effects of fire on flora. USDA Forest Service General Technical Report RMRS-GTR-42-vol2. Rocky Mountain Research Station, Fort Collins, Colorado, USA.
Baker, W.L. 2009. Fire ecology in Rocky Mountain landscapes. Island Press, Washington, D.C., USA.
Barrett, S.W., and S. Arno. 1988. Increment-borer methods for determining fire history in conif-erous forests. Forest Service General Technical Report INT-GTR-244. Intermountain Re-search Station, Ogden, Utah, USA.
Barrett, S.W., S.F. Arno, and C.H. Key. 1991. Fire regimes of western larch-lodgepole pine for-ests in Glacier National Park, Montana. Canadian Journal of Forest Research 21: 1711-1720. doi: 10.1139/x91-237
Beyer, H.L. 2010. Geospatial modeling environment. Version 0.5.1 Beta. <http://www.spatiale-cology.com/gme>. Accessed 1 April 2010.
Brown, J.K. 1995. Fire regimes and their relevance to ecosystem management. Pages 171-178 in: Proceedings of the Society of American Foresters Annual Meeting. Society of American Foresters. Bethesda, Maryland, USA.
Brown, J.K., S.F. Arno, S.W. Barrett, and J.P. Menakis. 1994. Comparing the prescribed natural fire program with pre-settlement fires in the Selway-Bitterroot Wilderness. International Jour-nal of Wildland Fire 4: 157-169. doi: 10.1071/WF9940157
Buma, B., and C.A. Wessman. 2011. Disturbance interactions can impact resilience mechanisms of forests. Ecosphere 2(5): art64. doi: 10.1890/ES11-00038.1
Calkin, D.E., K.M. Gebert, J.G. Jones, and R.P Neilson. 2005. Forest Service large fire area burned and suppression expenditure trends, 1970-2002. Journal of Forestry 103: 179-183.
Collins, B.M., J.D. Miller, A.E. Thode, M. Kelly, J. van Wagtendonk, and S.L. Stephens. 2009. Interactions among wildland fires in a long-established Sierra Nevada natural fire area. Eco-systems 12: 114-128. doi: 10.1007/s10021-008-9211-7
Collins, B.M., and S.L. Stephens. 2007. Fire scarring patterns in Sierra Nevada wilderness ar-eas burned by multiple wildland fire use fires. Fire Ecology 3(2): 53-67. doi: 10.4996/fireecology.0301053
Cooper, S.V., K.E. Neiman, and D.W. Roberts. 1991. Forest habitat types of northern Idaho: a second approximation. Forest Service General Technical Report INT-GTR-236, Intermoun-tain Research Station, Ogden, Utah, USA.
Fire Ecology Volume 8, Issue 2, 2012doi: 10.4996/fireecology.0802082
Teske et al.: Fire-on-Fire InteractionsPage 103
Dillon, G.K., Z.A. Holden, P. Morgan, M.A. Crimmins, E.K. Heyerdahl, and C.H. Luce. 2011. Both topography and climate affected forest and woodland burn severity in two regions of the western US, 1984 to 2006. Ecosphere 2(12): art130.
Eidenshink, J., B. Schwind, K. Brewer, Z.-L. Zhu, B. Quayle, and S. Howard. 2007. A project for monitoring trends in burn severity. Fire Ecology 3(1): 3-21. doi: 10.4996/fireecology.0301003
Falk, D.A., C. Miller, D. McKenzie, and A.E. Black. 2007. Cross-scale analysis of fire regimes. Ecosystems 10: 809-823. doi: 10.1007/s10021-007-9070-7
Finklin, A.I. 1983. Weather and climate of the Selway-Bitterroot Wilderness. University of Ida-ho Press, Moscow, Idaho, USA.
Finklin, A.I. 1988. Climate of the Frank Church-River of No Return Wilderness, central Idaho. Forest Service General Technical Report INT-GTR-240, Intermountain Research Station, Og-den, Utah, USA.
Finney, M.A., C.W. McHugh, and I.C. Grenfell. 2005. Stand- and landscape-level effects of pre-scribed burning on two Arizona wildfires. Canadian Journal of Forest Resources 35: 1714-1722. doi: 10.1139/x05-090
Fischer, W.C. 1984. Wilderness fire management planning guide. Forest Service General Tech-nical Report INT-171, Intermountain Forest and Range Experiment Station. Ogden, Utah, USA.
Folke, C. 2006. Resilience: the emergence of a perspective for social-ecological systems analy-ses. Global Environmental Change 16: 253-267. doi: 10.1016/j.gloenvcha.2006.04.002
Gibson, C.E. 2005. Fire history polygons database for the northern Rockies 1889-2003. <http://www.fs.fed.us/r1/gis/thematic_data/fire_history_nrocky_1889_2003.htm>. Accessed: 28 February 2011.
Groffman, P.M., J.S. Baron, T. Blett, A.J. Gold, I.G.L.H. Gunderson, B.M. Levinson, M.A. Palm-er, H.W. Paerl, G.D. Peterson, N.L. Poff, D.W. Rejeski, J.F. Reynolds, M.G. Turner, K.C. Weathers, and J. Wiens. 2006. Ecological thresholds: the key to successful environmental management or an important concept with no practical application? Ecosystems 9: 1-13. doi: 10.1007/s10021-003-0142-z
Guthery, F.S. 2008. A primer on natural science. Texas A&M University Press, College Station, Texas, USA.
Haire, S.L., and K. McGarigal. 2010. Effects of landscape patters of fire severity on regenerat-ing ponderosa pine forests (Pinus ponderosa) in New Mexico and Arizona, USA. Landscape Ecology 25: 1055-1069. doi: 10.1007/s10980-010-9480-3
Halofsky, J.E., D.C. Donato, D.E. Hibbs, J.L. Campbell, M. Donaghy-Cannon, J.B. Fontaine, J.R. Thompson, R.G. Anthony, B.T. Bormann, L.J. Kayes, B.E. Law, D.L. Peterson, and T.A. Spies. 2011. Mixed-severity fire regimes: lessons and hypotheses from the Klamath-Siskiyou ecoregion. Ecosphere 2(4): art40. doi: 10.1890/ES10-00184.1
Harrod, R.J. 2001. The effect of invasive and noxious plants on land management in eastern Or-egon and Washington. Northwest Science 75: 85-90.
Heyerdahl, E.K., P. Morgan, and J.P. Riser, II. 2008. Multi-season climate synchronized histori-cal fires in dry forests (1650-1900), northern Rockies, USA. Ecology 89: 705-716. doi: 10.1890/06-2047.1
Keane, R.E., S. Arno, and L.J. Dickinson. 2006. The complexity of managing fire-dependent ecosystems in wilderness: relict ponderosa pine in the Bob Marshall Wilderness. Ecological Restoration 24: 71-78. doi: 10.3368/er.24.2.71

Fire Ecology Volume 8, Issue 2, 2012doi: 10.4996/fireecology.0802082
Teske et al.: Fire-on-Fire InteractionsPage 104
Keane, R.E., P. Morgan, and J.P. Menakis. 1994. Landscape assessment of the decline of white-bark pine (Pinus albicaulis) in the Bob Marshall Wilderness Complex, Montana, USA. Northwest Science 68: 213-229.
Kellogg, L.K., D. McKenzie, D.L. Peterson, and A.E. Hessl. 2008. Spatial models for inferring topographic controls on historical low-severity fire in the eastern Cascade Range of Washing-ton, USA. Landscape Ecology 23: 227-240. doi: 10.1007/s10980-007-9188-1
Key, C.H., and N.C. Benson. 2004. Landscape assessment (LA) sampling and analysis methods. Pages LA1-LA55 in: D.C. Lutes, R.E. Keane, J.F. Caratti, C.H. Key, N.C. Benson, S. Suther-land, and L.J. Gangi, editors. FIREMON: Fire effects monitoring and inventory system. For-est Service General Technical Report RMRS-GTR-164CD, Rocky Mountain Research Sta-tion, Fort Collins, Colorado, USA.
Kipfmueller, K.F., and T.W. Swetnam. 2000. Fire-climate interactions in the Selway-Bitterroot Wilderness Area. Pages 270-275 in: D.N. Cole, S.F. McCool, W.T. Borrie, and J. O’Laughlin, compilers. Wilderness science in a time of change conference. Volume 5: wilderness ecosys-tems, threats, and management. Forest Service Proceedings RMRS-P-15-VOL-5. Rocky Mountain Research Station, Fort Collins, Colorado, USA.
Kipfmueller, K.F. 2003. Fire-climate-vegetation interactions in subalpine forests of the Selway-Bitterroot Wilderness Area, Idaho and Montana, USA. Dissertation, University of Arizona, Tucson, USA.
Lentile, L.B., Z.A. Holden, A.M.S. Smith, M.J. Falkowski, A.T. Hudak, P. Morgan, S.A. Lewis, P.E. Gessler, and N.C. Benson. 2006. Remote sensing techniques to assess active fire charac-teristics and post-fire effects. International Journal of Wildland Fire 15: 319-345. doi: 10.1071/WF05097
McKenzie, D., C. Miller, and D.A. Falk. 2011. Chapter 1: Toward a theory of landscape fire. Pages 3-23 in: D. McKenzie, C. Miller, and D.A. Falk, editors. The landscape ecology of fire: ecological studies—analysis and synthesis. Springer, Dordrecht, The Netherlands.
Moghaddas, J.J., and L. Craggs. 2007. A fuel treatment reduces fire severity and increases sup-pression efficiency in a mixed conifer forest. International Journal of Wildland Fire 16: 673-678. doi: 10.1071/WF06066
Morgan. P., C.C. Hardy, T.W. Swetnam, M.G. Rollins, and D.G. Long. 2001. Mapping fire re-gimes across time and space: understanding coarse and fine-scale fire patterns. International Journal of Wildland Fire 10: 329-342. doi: 10.1071/WF01032
Morgan, P., E.K. Heyerdahl, and C.E. Gibson. 2008. Multi-season climate synchronized forest fires throughout the 20th century, northern Rockies, USA. Ecology 89: 717-728. doi: 10.1890/06-2049.1
Moritz, M.A., M.E. Morais, L.A. Summerell, J.M. Carlson, and J. Doyle. 2005. Wildfires, com-plexity, and highly optimized tolerance. Proceedings of the National Academy of Sciences 102: 17912-17917. doi: 10.1073/pnas.0508985102
Neiland, B. 1958. Forest and adjacent burn in the Tillamook Burn area of northwestern Oregon. Ecology 39: 660-671. doi: 10.2307/1931606
NPS [National Park Service]. 2010. Biodiversity: the Crown of the Continent Ecosystem. <http://www.nps.gov/archive/glac/resources/bio1.htm>. Accessed 31 March 2010.
NWCG [National Wildfire Coordinating Group]. 2006. Glossary of wildland fire terminology: PMS-205. <http://www.nwcg.gov/pms/pubs/glossary/pms205.pdf>. Accessed 31 March 2010.
Perry, D.A. 1995. Self-organizing systems across scales. Trends in Ecological Evolution 10: 241-244. doi: 10.1016/S0169-5347(00)89074-6

Fire Ecology Volume 8, Issue 2, 2012doi: 10.4996/fireecology.0802082
Teske et al.: Fire-on-Fire InteractionsPage 105
Pickett, S.T.A., and P.S. White. 1985. The ecology of natural disturbance and patch dynamics. Academic Press, Orlando, Florida, USA.
Raymond, C.L., and D.L. Peterson. 2005. Fuel treatments alter the effects of wildfire in a mixed-evergreen forest, Oregon, USA. Canadian Journal of Forest Resources 35: 2981-2995. doi: 10.1139/x05-206
Ritchie, M.W., C.N. Skinner, and T. Hamilton. 2007. Probability of tree survival after wildfire in an interior pine forest of northern California: effects of thinning and prescribed fire. Forest Ecology and Management 247: 200-208. doi: 10.1016/j.foreco.2007.04.044
Rollins, M.G., R.E. Keane, and R. Parsons. 2004. Mapping fuels and fire regimes using remote sensing, ecosystem simulation, and gradient modeling. Ecological Applications 14: 75-95. doi: 10.1890/02-5145
Rollins, M.G., T.W. Swetnam, and P. Morgan. 2001. Evaluating a century of fire patterns in two Rocky Mountain wilderness areas using digital fire atlases. Canadian Journal of Forest Re-search 31: 2107-2123. doi: 10.1139/x01-141
Selkowitz, D.J., D. Fagre, and B.A. Reardon. 2002. Interannual variations in snowpack in the Crown of the Continent Ecosystem. Hydrological Processes 16: 3651-3665. doi: 10.1002/hyp.1234
Shiplett, B., and L.F. Neuenschwander. 1994. Fire ecology of the cedar-hemlock zone in Idaho. Pages 41-52 in: D.M. Baumgartner, J.E. Lotan, and J.R. Tonn, editors. Interior cedar-hem-lock-white pine forests: ecology and management symposium proceedings. Washington State University Cooperative Extension, 2-4 March 1993, Spokane, Washington, USA.
Sousa, W.P. 1984. The role of disturbance in natural communities. Annual Review of Ecologi-cal Systems 15: 353-391. doi: 10.1146/annurev.es.15.110184.002033
Sprugel, D.G. 1991. Disturbance, equilibrium, and environmental variability: what is “natural” in a changing environment? Biological Conservation 58: 1-18. doi: 10.1016/0006-3207(91)90041-7
Stephens, S.L., J.J. Moghaddas, C. Edminster, C.E. Fiedler, S. Haase, M.G. Harrington, J.E. Keeley, E.E. Knapp, J.D. McIver, K. Metlen, C.N. Skinner, and A. Youngblood. 2009. Fire treatment effects on vegetation structure, fuels, and potential fire severity in western US for-ests. Ecological Applications 19: 305-320. doi: 10.1890/07-1755.1
Sugihara, N.G., J.W. van Wagtendonk, and J. Fites-Kaufman. 2006. Fire as an ecological pro-cess. Pages 58-64 in: N.G. Sugihara, J.W. van Wagtendonk, J. Fites-Kaufman, K.E. Shaffer, and A.E. Thode. Fire in California’s ecosystems. University of California Press, Berkeley, USA.
Thompson, J.R., T.A. Spies, and L.M. Ganio. 2007. Reburn severity in managed and unmanaged vegetation in a large wildfire. Proceedings of the National Academy of Sciences 104: 10743-10748. doi: 10.1073/pnas.0700229104
Turner, M.G., W.W. Hargrove, R.H. Gardner, and W.H. Romme. 1994. Effects of fire on land-scape heterogeneity in Yellowstone National Park, Wyoming. Journal of Vegetation Science 5: 731. doi: 10.2307/3235886
USDA [United States Department of Agriculture]. 1988. Silver Fire recovery project, Siskiyou National Forest: final environmental impact statement. Forest Service, Siskiyou National Forest, Grants, Oregon, USA.
USDA [United States Department of Agriculture]. 2002. Frank Church-River of No Return Wil-derness Wildland fire use management guidelines. Forest Service, Salmon-Challis National Forest, Salmon, Idaho, USA.

Fire Ecology Volume 8, Issue 2, 2012doi: 10.4996/fireecology.0802082
Teske et al.: Fire-on-Fire InteractionsPage 106
USDA [United States Department of Agriculture]. 2004. Bob Marshall, Great Bear, and Scape-goat wildernesses recreation management direction. <http://www.wilderness.net/> Accessed: 30 March 2012.
van Wagtendonk, J.W. 2007. The history and evolution of wildland fire use. Fire Ecology 3(2): 3-17. doi: 10.4996/fireecology.0302003
van Wagtendonk, J.W., K.A. van Wagtendonk, and A.E. Thode. 2012. Factors associated with the severity of interacting fires in Yosemite National Park, California, USA. Fire Ecology 8(1): 11-31. doi: 10.4996/fireecology.0801011
Weatherspoon, C.P., and C.N. Skinner. 1995. An assessment of factors associated with damage to tree crowns from the 1987 wildfires in northern California. Forest Science 41: 430-451.