CHARACTERIZING AND MAPPING POTENTIAL … 203: Characterizing and Mapping Potential Jaguar Habitat in...
32
CHARACTERIZING AND MAPPING POTENTIAL JAGUAR HABITAT IN ARIZONA James R. Hatten 1 , Senior GIS Analyst Annalaura Averill-Murray 2 , Regional Nongame Biologist William E. Van Pelt 1 , Nongame Mammals Program Manager 1 Wildlife Management Division 2 Region V, Field Operations Division Arizona Game and Fish Department in cooperation with the Jaguar Conservation Team Habitat Subcommittee Technical Report 203 Nongame and Endangered Wildlife Program Program Chief: Terry B. Johnson Arizona Game and Fish Department 2221 West Greenway Road Phoenix, Arizona 85023-4399 January 2003
Transcript of CHARACTERIZING AND MAPPING POTENTIAL … 203: Characterizing and Mapping Potential Jaguar Habitat in...

CHARACTERIZING AND MAPPING POTENTIAL JAGUAR HABITAT IN ARIZONA
James R. Hatten1, Senior GIS Analyst Annalaura Averill-Murray2, Regional Nongame Biologist
William E. Van Pelt1, Nongame Mammals Program Manager
1Wildlife Management Division 2Region V, Field Operations Division Arizona Game and Fish Department
in cooperation with the
Jaguar Conservation Team Habitat Subcommittee
Technical Report 203
Nongame and Endangered Wildlife Program Program Chief: Terry B. Johnson
Arizona Game and Fish Department 2221 West Greenway Road
Phoenix, Arizona 85023-4399
January 2003

CIVIL RIGHTS AND DIVERSITY COMPLIANCE
The Arizona Game and Fish Commission receives federal financial assistance in Sport Fish and Wildlife Restoration. Under Title VI of the 1964 Civil Rights Act, Section 504 of the Rehabilitation Act of 1973, Title II of the American with Disabilities Act of 1990, the Age Discrimination Act of 1975, Title IX of the Education Amendments of 1972, the U.S. Department of the Interior prohibits discrimination on the basis of race, color, religion, national origin, age, sex, or disability. If you believe you have been discriminated against in any program, activity, or facility as described above, or if you desire further information please write to:
Arizona Game and Fish Department Office of the Deputy Director, DOHQ
2221 West Greenway Road Phoenix, Arizona 85023-4399
and
The Office for Diversity and Civil Rights
U.S. Fish and Wildlife Service 4040 North Fairfax Drive, Room 300
Arlington, Virginia 22203
AMERICANS WITH DISABILITIES ACT COMPLIANCE
The Arizona Game and Fish Department complies with all provisions of the American with Disabilities Act. This document is available in alternative format by contacting the Arizona Game and Fish Department, Office of the Deputy Director at the address above or by calling (602) 789-3290 or TTY 1-800-367-8939.

RECOMMENDED CITATION Hatten, J.R1., A. Averill-Murray, and W.E. Van Pelt. 2002. Characterizing and mapping potential jaguar habitat in Arizona. Nongame and Endangered Wildlife Program Technical Report 203. Arizona Game and Fish Department, Phoenix, Arizona. Current address: 1 USGS, 5501 A Cook-Underwood Road, Cook, WA 98501. ACKNOWLEDGMENTS We thank the members of the Jaguar Conservation Team’s Habitat Subcommittee and the participants in the Conservation Team's Working Group for thoughtful comments, and for their persistent, enthusiastic participation in this new approach to conserving jaguars. We also thank the members of the Jaguar Scientific Advisory Group for volunteering their time and expertise to help develop the habitat criteria for this model.
PROJECT FUNDING Funding for AGFD participation in this project was provided by: voluntary contributions to Arizona's Nongame Wildlife Checkoff; the Arizona Game and Fish Department's Heritage Fund (Lottery Dollars Working for Wildlife); and Project W-95-M, under the Federal Aid in Wildlife Restoration Act (Pittman-Robertson Act). In addition, many volunteers have actively participated in the Jaguar Conservation Team and Working Group and have contributed significantly to this effort in terms of donated time and money.

i
TABLE OF CONTENTS INTRODUCTION ................................................................................................................................ 1 METHODS ........................................................................................................................................ 2
Approach.................................................................................................................................... 2 Historical Database .................................................................................................................... 4 GIS Analysis .............................................................................................................................. 4
RESULTS AND DISCUSSION............................................................................................................. 14 Jaguar Occurrence and Distribution Patterns........................................................................... 14 GIS Overlays............................................................................................................................ 14 Habitat Suitability Mapping..................................................................................................... 19 Defining Potential Jaguar Habitat and Conservation Zones in Arizona .................................. 22
Recommendations……………………………………………………………………...……..25 LITERATURE CITED……………………………………………………………………………….26 APPENDIX 1. THE 57 SIGHTING RECORDS USED IN OUR ANALYSIS.................................................. 28
LIST OF FIGURES
Figure 1. The 57 sighting records used in our GIS analysis....................................................................6
Figure 2. Jaguar sightings of the 20th century divided into quartiles ......................................................7
Figure 3. The proximity of jaguar sightings in Arizona divided into 32.2-km (20-mi) increments ......8
Figure 4. Elevation of Arizona divided into 609-m (2,000-foot) zones..................................................9
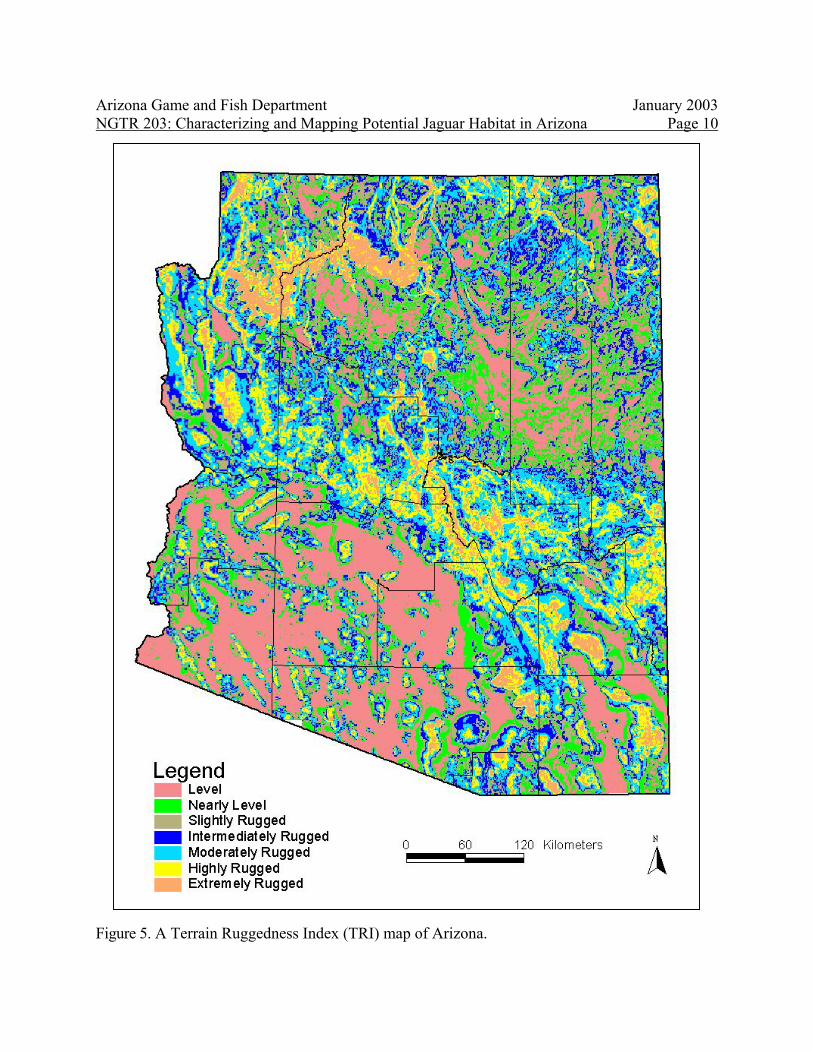
Figure 5. A Terrain Ruggedness Index (TRI) map of Arizona.............................................................10
Figure 6. Proximity to perennial or intermittent waters ........................................................................11
Figure 7. Proximity to springs in Arizona..............................................................................................12
Figure 8. Areas removed (masked) from the GIS analysis ...................................................................13
Figure 9. Frequency of jaguar sightings in biomes (A) and vegetation series (B) ...............................15
Figure 10. Frequency of jaguar sightings within the 609-m (2,000 ft) elevation zones (A) and within five of the seven Terrain Ruggedness Index classes (B)) .............................................17
Figure 11. Frequency of jaguar sightings near perennial or intermittent rivers and creeks (A) or springs (B)..................................................................................................................................18
Figure 12. Potentially suitable biomes identified by JAGHAB............................................................20
Figure 13. Potentially suitable habitatS for jaguars in Arizona.............................................................21
Figure 14. The most suitable conservation area for jaguars is in southeast Arizona (Zone 1).…24

CHARACTERIZING AND MAPPING POTENTIAL JAGUAR HABITAT IN ARIZONA
James R. Hatten, Annalaura Averill-Murray, and William E. Van Pelt
INTRODUCTION The southwestern United States and Sonora, Mexico are the extreme northern limits of the jaguar’s (Panthera onca) range (Sanderson and others 2002), which primarily extends from central Mexico south through Central and South America to northern Argentina (Swank and Teer 1989). Pleistocene fossil records clearly establish the jaguar as part of the North American fauna: early jaguars have been found as far north as the states of Washington, Nebraska, and Maryland (Seymour 1989). Recently, the jaguar ranged only as far north as Arizona, New Mexico, and Texas. Over the last century, the jaguar’s range has been reduced to approximately 46% of its historic (pre-1900) range (Sanderson and others 2002) due to hunting pressure and habitat loss (Swank and Teer 1989). The greatest loss of occupied range has occurred in the southern United States, northern Mexico, northern Brazil, and southern Argentina (Sanderson and others 2002). Since 1900, jaguars have been documented occasionally in the southwestern United States, but the number of sightings per decade has declined over the last 100 years (Brown 1983) with only 4 verified sightings between 1970 and 2000 (Brown and Lopez Gonzalez 2001). Historically, jaguars may have been a resident species in Arizona (Brown 1983; Hoffmeister 1986) as indicated by more frequent sightings, including several females and one with cubs (Brown and Lopez Gonzales 2001). Recent U.S. jaguar sightings (post 1963) have been of males, suggesting possible dispersal of individuals originating in northern Mexico (Rabinowitz 1999): males are more prone than females to wander (Brown and Lopez Gonzales 2001) and have been known to roam hundreds of kilometers in search of new territory (Seymour 1989). In 1996, 2 different jaguars were photographed in the mountains of southeastern Arizona (Glenn 1996; Childs 1998), which raised conservation concerns for the species at both a local and national level. These recent sightings prompted the federal government to finalize the endangered species listing process for jaguars pursuant to the Endangered Species Act (Federal Register 1997) in 1997. Parallel to the federal effort, representatives of state and federal agencies and local governments with land-management responsibilities in southeastern Arizona and southwestern New Mexico signed a Memorandum of Agreement (MOA) to implement a Conservation Agreement for the jaguar (Johnson and Van Pelt 1997). Signatories of the MOA worked together to establish a Jaguar Conservation Team (JAGCT), Jaguar Working Group (JAGWG), Jaguar Scientific Advisory Group (JAGSAG), and various subcommittees to accomplish tasks outlined in the agreement and to determine how to best manage for jaguars in Arizona and New Mexico. The JAGCT/JAGWG consists of representatives of state and federal land and wildlife management agencies, as well as non-profit organizations and private citizens with an interest in jaguars or jaguar management in the southwestern United States.

Arizona Game and Fish Department January 2003 NGTR 203: Characterizing and Mapping Potential Jaguar Habitat in Arizona Page 2
The lack of information on jaguar ecology, habitat use, and sporadic movement patterns makes it difficult to manage for the species, especially at the northern extent of its range. One of the main objectives of the Conservation Agreement is to identify potential jaguar habitat in Arizona and New Mexico to help focus conservation efforts and identify opportunities for jaguar habitat management (Objective 5, Task 1 and 4, Jaguar Conservation Agreement). Toward this end, several members of the JAGCT/JAGWG formed a Habitat Subcommittee (JAGHAB) in June 1998. The subcommittee’s primary task was to develop habitat suitability criteria for the jaguar that is applicable to Arizona, New Mexico, and northern Mexico, and produce maps delineating potential jaguar habitat in Arizona and New Mexico. The Arizona Game and Fish Department (AGFD), by majority vote of the JAGHAB subcommittee, has taken the lead in this effort for Arizona. The New Mexico Department of Game and Fish is also developing a jaguar habitat suitability map and the information from both states will eventually be merged. Arizona is a natural starting point for mapping potential jaguar habitat in the United States because the greatest number of jaguar reports north of the border during the 20th century has come from Arizona (Rabinowitz 1999). The objectives of our analysis were twofold: (1) characterize potential jaguar habitat in Arizona from historic sighting records, and (2) create a statewide habitat suitability map. Habitat variables thought important to jaguar were derived from an extensive literature review. Jaguars have been noted for their adaptability to a variety of environmental conditions (Rabinowitz and Nottingham 1986; Seymour 1989). Habitat studies in the core part of their range indicate a close association with water, dense cover (Schaller and Crawshaw 1980; Quigley and Crawshaw 1992), and sufficient prey (Seymour 1989; Swank and Teer 1989) and an avoidance of highly disturbed areas (Quigley and Crawshaw 1992). Jaguars have been found from sea level to 3800 m (Tewes and Schmidly 1987), but rarely over 1000 m (Seymour 1989). They have also been found in a wide variety of vegetation communities from tropical rainforest and flooded grassland mosaics to Madrean evergreen woodland, semi-desert grasslands, and wooded canyons of the Sonoran Desert (Rabinowitz 1999; Brown and Lopez Gonzales 2001).
METHODS APPROACH Large positional error in the jaguar data required a landscape-scale analysis of macro-habitat features since they are less sensitive to positional error than microhabitat features. We characterized potential jaguar habitat by overlaying historic jaguar sightings and landscape/habitat features believed important by JAGHAB and JAGSAG. Potentially important habitat features included vegetation biomes (ecosystems) and series (communities), elevation and terrain ruggedness, proximity to perennial/intermittent water sources (streams, rivers, lakes, and springs), and human density. We used a GIS to create, manage, and analyze the data, characterize broad-scale habitat features where jaguars were observed, and map potentially suitable habitat.
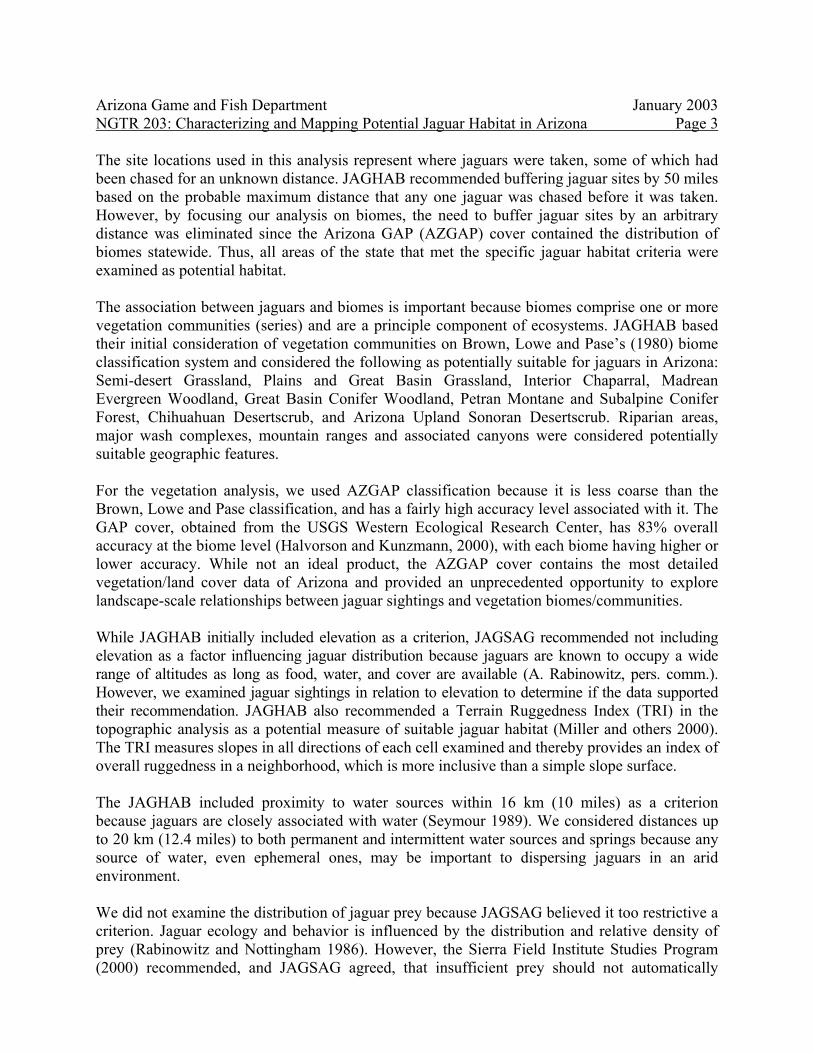
Arizona Game and Fish Department January 2003 NGTR 203: Characterizing and Mapping Potential Jaguar Habitat in Arizona Page 3
The site locations used in this analysis represent where jaguars were taken, some of which had been chased for an unknown distance. JAGHAB recommended buffering jaguar sites by 50 miles based on the probable maximum distance that any one jaguar was chased before it was taken. However, by focusing our analysis on biomes, the need to buffer jaguar sites by an arbitrary distance was eliminated since the Arizona GAP (AZGAP) cover contained the distribution of biomes statewide. Thus, all areas of the state that met the specific jaguar habitat criteria were examined as potential habitat. The association between jaguars and biomes is important because biomes comprise one or more vegetation communities (series) and are a principle component of ecosystems. JAGHAB based their initial consideration of vegetation communities on Brown, Lowe and Pase’s (1980) biome classification system and considered the following as potentially suitable for jaguars in Arizona: Semi-desert Grassland, Plains and Great Basin Grassland, Interior Chaparral, Madrean Evergreen Woodland, Great Basin Conifer Woodland, Petran Montane and Subalpine Conifer Forest, Chihuahuan Desertscrub, and Arizona Upland Sonoran Desertscrub. Riparian areas, major wash complexes, mountain ranges and associated canyons were considered potentially suitable geographic features. For the vegetation analysis, we used AZGAP classification because it is less coarse than the Brown, Lowe and Pase classification, and has a fairly high accuracy level associated with it. The GAP cover, obtained from the USGS Western Ecological Research Center, has 83% overall accuracy at the biome level (Halvorson and Kunzmann, 2000), with each biome having higher or lower accuracy. While not an ideal product, the AZGAP cover contains the most detailed vegetation/land cover data of Arizona and provided an unprecedented opportunity to explore landscape-scale relationships between jaguar sightings and vegetation biomes/communities. While JAGHAB initially included elevation as a criterion, JAGSAG recommended not including elevation as a factor influencing jaguar distribution because jaguars are known to occupy a wide range of altitudes as long as food, water, and cover are available (A. Rabinowitz, pers. comm.). However, we examined jaguar sightings in relation to elevation to determine if the data supported their recommendation. JAGHAB also recommended a Terrain Ruggedness Index (TRI) in the topographic analysis as a potential measure of suitable jaguar habitat (Miller and others 2000). The TRI measures slopes in all directions of each cell examined and thereby provides an index of overall ruggedness in a neighborhood, which is more inclusive than a simple slope surface. The JAGHAB included proximity to water sources within 16 km (10 miles) as a criterion because jaguars are closely associated with water (Seymour 1989). We considered distances up to 20 km (12.4 miles) to both permanent and intermittent water sources and springs because any source of water, even ephemeral ones, may be important to dispersing jaguars in an arid environment. We did not examine the distribution of jaguar prey because JAGSAG believed it too restrictive a criterion. Jaguar ecology and behavior is influenced by the distribution and relative density of prey (Rabinowitz and Nottingham 1986). However, the Sierra Field Institute Studies Program (2000) recommended, and JAGSAG agreed, that insufficient prey should not automatically

Arizona Game and Fish Department January 2003 NGTR 203: Characterizing and Mapping Potential Jaguar Habitat in Arizona Page 4
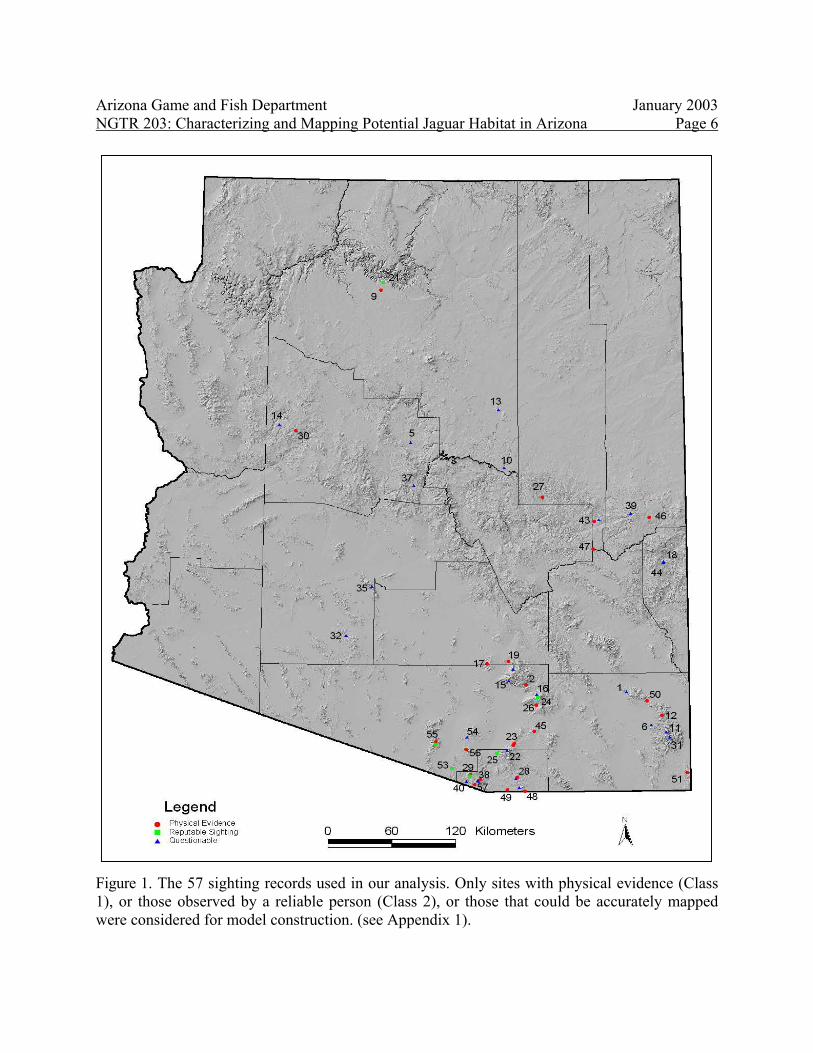
eliminate an area as potential jaguar habitat. If an area is otherwise suitable for jaguars, wildlife agencies can manage wild game populations to increase in numbers. Additionally, jaguars are opportunistic feeders with more than 85 prey species reported in their diet (Seymour 1989), including other mammals, reptiles, and birds. Primary prey items are diurnal, terrestrial mammals with a body mass greater than one kilogram (Seymour 1989). In the southwestern United States, potential prey species would include collared peccary (Tayassu tajacu), white-tailed deer (Odocoileus virginianus), mule deer (Odocoileus hemionus), coatimundi (Nasua nasua), skunk (Mephitis spp., Spilogale gracilis), raccoon (Procyon lotor), jack rabbit (Lepus spp.) and domestic livestock such as cattle (Bos taurus), goats (Capra hircus), sheep (Ovis aries), and horses (Equus caballus). Jaguars are secretive animals and tend to avoid highly disturbed areas (Quigley and Crawshaw 1992). Therefore, JAGHAB recommended excluding areas of high human density and highly man-modified landscapes, such as row crops, as jaguar habitat. We did not specifically examine the relationship between jaguars and human-density patterns because census data are summarized in blocks, not specific enough for our purposes. Furthermore, Arizona’s human population kept changing during the previous century, making it difficult to associate population density with jaguar occurrence. However, we did mask or exclude from our analysis areas within city boundaries, higher density rural areas visible on satellite imagery, and agricultural areas. HISTORICAL DATABASE AND MAPPING Defining potential jaguar habitat required an analysis of existing occurrence records since there is no longer a resident jaguar population in Arizona. Therefore, we examined 57 records where jaguars were supposedly sighted or killed (Appendix 1). The quality and reliability of the sightings records varied greatly, with some dating back 100 years. To create a useful database for analysis, records were sorted into 3 classes based upon their reliability (Fig. 1; Appendix 1): (1) physical evidence (Class 1), (2) firsthand account from a reliable source (Class 2), or (3) secondhand, questionable accounts (Class 3). Records were also rated according to their site (location) description as poor (Class 3), fair (Class 2), or good (Class 1), since even some reliable sightings could not be accurately mapped. Two factors that complicated our analysis and mapping efforts were: 1) vagueness in site descriptions, and 2) most occurrence records reported the locations where jaguars were taken, and not necessarily the area being used by the jaguar. To improve our mapping effort, jaguar sites were plotted with a GIS that displayed digital topographic maps, satellite imagery, hydrography, and shaded relief maps to visualize terrain. To reduce positional error and create the most specific habitat suitability model, we used only the most reliable and spatially accurate records (25). The 32 leftover occurrences were not suitable for accuracy assessment, but we did overlay them and examine their proximity to potentially suitable habitat. GIS ANALYSIS We examined the temporal component of jaguar occurrences throughout the 20th century by dividing the sightings into 4 groups based upon which quartile they were observed (Fig. 2). We

Arizona Game and Fish Department January 2003 NGTR 203: Characterizing and Mapping Potential Jaguar Habitat in Arizona Page 5
examined the spatial component of jaguar occurrences by creating a proximity grid based upon each occurrence’s nearest neighbor (Fig. 3). While the proximity/density of jaguar sites was not a criterion specified by the JAGHAB, hotspots might provide insight into future jaguar occurrences and potential conservation areas. All sighting records were included in the proximity analysis since the information was not used in model development. To examine the relationship between jaguars and elevation, we overlaid sightings records and Digital Elevation Model (DEM) data. The DEMs were created by the United States Geological Survey (USGS) and provided the average elevation for each 30-m (900-m2) cell. Elevation of Arizona was divided into 609-m (2000-ft) elevation zones to identify patterns in jaguar distribution (Fig. 4). To examine the relationship between jaguars and landscape roughness, we calculated a Terrain Ruggedness Index (Riley and others 1999) for the whole state of Arizona (Fig. 5). The Terrain Ruggedness Index (TRI) was calculated in a 3-step process: 1) 1986 30-m resolution DEMs were mosaiced together, 2) DEM data were aggregated (clustered and averaged) into 1-km2 cells, and 3) the sum difference in elevation between each cell and its surrounding neighbor cells was calculated. The TRI data were divided into 7 classes according to their relative roughness: level, nearly level, slightly rugged, intermediately rugged, moderately rugged, highly rugged, and extremely rugged. Jaguar data were overlaid with TRI data and examined. To characterize vegetation biomes and series (communities) occupied by jaguars, we overlaid sighting records and AZGAP data. To calculate the distance between jaguar sites and water, we created 2 grids containing the distances of each grid cell to perennial/intermittent waters (Fig. 6) or springs (Fig. 7). Distance to water represents Euclidean distance (i.e. “as the crow flies”), which is usually shorter than the ground distance. The AGFD produced the perennial and intermittent stream covers as part of the statewide riparian inventory (Valencia and others 1993), while the springs cover came from the Arizona State Land Department. Perennial streams contain water year-round while intermittent streams run seasonally. Besides water availability, perennial and intermittent rivers/streams are usually associated with well-defined channels that frequently contain riparian vegetation, a cooler microclimate, and higher prey abundance. Creating the most specific habitat suitability map required masking human-populated areas and agricultural fields (Fig. 8), then selecting all areas that met the suitability criteria identified from the GIS analysis. We used the State Land Department’s Cities cover and AGFD’s Agricultural cover to mask urban, agricultural, and populated rural areas. The Cities cover, updated by the State Land Department, contained the outlines of all Arizona cities. The AGFD created the Agricultural cover in 1993 as part of the AGFD riparian study and it contained the boundaries of all agricultural and human-populated areas large enough to show up on satellite imagery.
Arizona Game and Fish Department January 2003 NGTR 203: Characterizing and Mapping Potential Jaguar Habitat in Arizona Page 6
Figure 1. The 57 sighting records used in our analysis. Only sites with physical evidence (Class 1), or those observed by a reliable person (Class 2), or those that could be accurately mapped were considered for model construction. (see Appendix 1).

Arizona Game and Fish Department January 2003 NGTR 203: Characterizing and Mapping Potential Jaguar Habitat in Arizona Page 7
Figure 2. Jaguar sightings of the 20th century divided into quartiles (the last quartile contained a 2001 sighting).
0
10
20
30
1900 - 1925 1926 - 1950 1951 - 1975 1976 - 2002

Arizona Game and Fish Department January 2003 NGTR 203: Characterizing and Mapping Potential Jaguar Habitat in Arizona Page 8
Figure 3. The proximity of jaguar sightings in Arizona divided into 32.2-km (20-mi) increments.

Arizona Game and Fish Department January 2003 NGTR 203: Characterizing and Mapping Potential Jaguar Habitat in Arizona Page 9
Figure 4. Elevation of Arizona divided into 609-m (2000-foot) zones.
Arizona Game and Fish Department January 2003 NGTR 203: Characterizing and Mapping Potential Jaguar Habitat in Arizona Page 10
Figure 5. A Terrain Ruggedness Index (TRI) map of Arizona.

Arizona Game and Fish Department January 2003 NGTR 203: Characterizing and Mapping Potential Jaguar Habitat in Arizona Page 11
Figure 6. Proximity to perennial or intermittent waters (not including springs).

Arizona Game and Fish Department January 2003 NGTR 203: Characterizing and Mapping Potential Jaguar Habitat in Arizona Page 12
Figure 7. Proximity to springs in Arizona.

Arizona Game and Fish Department January 2003 NGTR 203: Characterizing and Mapping Potential Jaguar Habitat in Arizona Page 13
Figure 8. Areas removed (masked) from the GIS analysis.

Arizona Game and Fish Department January 2003 NGTR 203: Characterizing and Mapping Potential Jaguar Habitat in Arizona Page 14
RESULTS AND DISCUSSION JAGUAR OCCURRENCE AND DISTRIBUTION PATTERNS There were almost twice as many sightings of jaguars during the first quarter of the 20th century as any other quarter (Fig. 2), with sites ranging from the South Rim of the Grand Canyon to the Mexican border. This contrasted with the limited distribution of sightings during the last quarter, with no sightings further north than the Dos Cabezas Mountains. Indeed, if latitude were a measure of the occupied range in Arizona, each quarter represented a 15% - 25% loss in jaguar’s range, shrinking progressively towards the Mexican border. The last 2 quarters observed a similar number of jaguars, which might indicate a stable source population in Mexico. However, the scarcity of data prevents any definitive statements and further research into jaguar populations south of the border is strongly recommended by JAGHAB. The distribution pattern of jaguars was clumped in southeast Arizona and scattered in central and northwest Arizona (Fig. 3). The hotspot surrounding Tucson contained 55% (31) of all jaguar sightings (57), including one as recent as 2001, and is comprised of the following mountain ranges and associated grasslands: Santa Catalinas, Rincons, Santa Ritas, Baboquivaris, Tortolitas, Patagonias, Bartolos, Empire and Atascosa Mountains. A secondary hotspot near Douglas - comprised of the Chiricahua, Peloncillo and Dos Cabezas Mountains - contained 12% (7) of the historic sightings, with 2 sighted since 1986 (#50 and #51). Twenty-eight percent (16) of jaguar sightings were dispersed along the Mogollon Rim from New Mexico to the Grand Canyon and south to the Prescott area. The 2 northwestern sites (#9 and #21) were more dispersed and isolated than the other sites; perhaps they can be considered outliers, but insufficient data made it difficult to characterize their status. The sighting of the female jaguar near Big Lake (#46) suggests she could have entered the state from New Mexico via the Gila Wilderness or San Francisco River valley, or she was a resident. The 4 jaguars sighted near the South Rim of the Grand Canyon and Prescott (#14 and #30) might well have been resident jaguars or they were very good travelers, crossing the Sonoran Desert (little to no water) or Mogollon Rim for hundreds of miles. The elevation bands depicted in Fig. 4 portray possible travel corridors for jaguars in Arizona. A more complete picture will emerge when New Mexico and Mexico are included in a topographic analysis. GIS OVERLAYS One hundred percent (25) of the Class 1 and 2 sighting records (Appendix 1) were observed in 4 biomes (Fig. 9A); 56% (14) were observed in Scrub Grasslands of southeast Arizona, 20% (5) in Madrean Evergreen Forest, 12% (3) in Rocky Mountain Montane Conifer Forest, and 12% (3) in Great Basin Conifer Woodland. At the vegetation community level (Fig. 9B), jaguars were observed 4.7 times more often in Mixed Grass-Scrub as any other community.

Arizona Game and Fish Department January 2003 NGTR 203: Characterizing and Mapping Potential Jaguar Habitat in Arizona Page 15
Figure 9. Frequency of jaguar sightings in biomes (A) and vegetation series (B).
0
4
8
12
16
Great BasinConifer
Woodland
MadreanEvergreen
Forest
Rocky MountainMontane
Conifer Forest
ScrubGrassland
Biome
Jagu
ar F
requ
ency A
0
4
8
12
16
Pinyon--Juniper
Encinal Oak--Pine Pine Douglas-Fir--MixedConifer
MixedGrass--Scrub
Vegetation Series
Jagu
ar F
requ
ency B

Arizona Game and Fish Department January 2003 NGTR 203: Characterizing and Mapping Potential Jaguar Habitat in Arizona Page 16
Sixty percent of jaguars (15) were observed between 1220 m (4000 ft) and 1829 m (6000 ft) (Fig. 10A), largely in the Scrub Grassland biome of southeast Arizona. The remaining jaguar sightings were between 1036 m (3400 ft) and 2743 m (9000 ft). As expected, the topographic distribution pattern of jaguars reflected the close association between elevation and vegetation communities in Arizona. The JAGSAG recommended dropping elevation as a criterion for determining suitable jaguar habitat because the species occupies a wide continuum of environmental conditions across its range, from sea level to over 3810 m (12,500 ft.; Tewes and Schmidley 1987; Seymour 1989). The jaguar occurrences in Arizona loosely support JAGSAG’s recommendation, but the Scrub-Grassland biome found between 1220- and 1829 m clearly stood out for jaguar occurrences. The apparent preference of jaguars for grasslands may actually reflect travel corridors from the Sierra Madres of Mexico into southeast Arizona rather than a preferred habitat type, or perhaps jaguars were just more visible in open grassland habitats. More investigation needs to occur before we can identify actual preferences of jaguars by elevation or vegetation communities. While elevation may not limit the distribution of jaguars in Arizona, distance to water surely does and may provide an explanation to the wandering pattern of jaguars searching for suitable habitat. Sixty-four percent (16) of jaguars occurred within 5 km (3.1 mi) of perennial/intermittent creeks or rivers (Fig. 11A), 76% (19) within 10 km (6.2 mi), and 84% (21) within 20 km (12.4 miles). Furthermore, 80% (20) of jaguars occurred within 2.5 km (1.6 mi) of a spring, and 96% (24) within 5 km (Fig. 11B). The close proximity of jaguars to springs was not surprising after viewing the density of springs in Arizona (Fig. 7). When springs and rivers/creeks were combined, 100% of the 25 Class 1 and 2 sighting records were within 10 km of a water source, which is much closer than anticipated by JAGHAB when establishing this criterion. While these proximities represented Euclidean distances (“as the crow flies”), and in mountainous terrain it could be considerably further, the relatively close proximity of jaguars to water potentially explains much about their distribution pattern in Arizona. River valleys might provide travel corridors for jaguars, along with higher prey densities, cooler air, and denser vegetation than surrounding habitats. Indeed, if jaguars can smell water from afar, they would never be that far from a water source providing they did not stray into the middle of the Sonoran or Mojave Deserts. Ninety-two percent (23) of jaguar sightings occurred in intermediately rugged to extremely rugged terrain (Fig. 10B). However, the association of jaguars and terrain ruggedness might merely reflect the biomes typically found in mountainous habitats of Arizona. Sorting out the combined and independent influences of landscape and habitat variables on jaguar occurrence must occur within a multivariate-modeling environment, but our data were insufficient for this approach. Perhaps jaguar research in Mexico can sort out the combined and independent influences of predictor variables; until then we can only guess.

Arizona Game and Fish Department January 2003 NGTR 203: Characterizing and Mapping Potential Jaguar Habitat in Arizona Page 17
Figure 10. Frequency of jaguar sightings within the 609-m (2000 ft) elevation zones (A) and within 5 of the 7 Terrain Ruggedness Index classes (B).
0
4
8
12
16
2,000 - 4,000 ft 4,001 - 6,000 ft 6,001 - 8,000 ft 8,001 - 10,000 ft
Elevation Zone
Jagu
ar F
requ
ency
A
0
2
4
6
8
10
Nearly Level IntermediatelyRugged
ModeratelyRugged
Highly Rugged ExtremelyRugged
Terrain Ruggedness Index
Jagu
ar F
requ
ency
B

Arizona Game and Fish Department January 2003 NGTR 203: Characterizing and Mapping Potential Jaguar Habitat in Arizona Page 18
Figure 11. Frequency of jaguar sightings near perennial/intermittent rivers and creeks (A) or springs (B).
0
4
8
12
16
20
< 5 km 5.1 - 10 km 10.1 - 20 km >20 km
Distance to Perennial/Intermittent Waters
Jagu
ar F
requ
ency
A
0
5
10
15
20
25
< 2.5 km 2.6 - 5 km > 5 km
Distance to Spring
Jagu
ar F
requ
ency
B

Arizona Game and Fish Department January 2003 NGTR 203: Characterizing and Mapping Potential Jaguar Habitat in Arizona Page 19
HABITAT SUITABILITY MAPPING Four biomes (Fig. 12) contained 100% (25) of Class 1 and 2 jaguar sites and encompassed 37% of the state (108,222 km2). By including the other parameters identified by JAGHAB and JAGSAG, proximity to water as derived from our data analysis (areas within 10 km of perennial/intermittent creeks and rivers and 5 km of springs), and where the Terrain Ruggedness Index was at least intermediately rugged or higher, potentially suitable habitat encompassed 21% of the state (Model A, Fig. 13). The distribution of Class 1 and 2 sites overlaid the potentially suitable area very closely, with 92% (23) within the envelope and the remainder <3.5 km from potential habitat. Of the 32 less reliable sites (Class 3), 62% (20) were within the envelope. When all sites were combined (57), 75% (43) were within the potentially suitable envelope. Unfortunately, the positional accuracy of the Class 3 sites was so poor that they could not be used to assess the accuracy of the model, but most misclassified sites were <5 km from potentially suitable habitat. Due to the experimental and unproven significance of the TRI variable, which might exclude biologically important areas, we reran the model without the TRI filter, which broadened the potentially suitable envelope to 28.9% of the state (Model B, Fig. 13). Omitting the TRI filter reduced the patchiness of Model A and resulted in the identification of potential corridors between areas identified in Model A. Furthermore, 96% (24) of Class 1 and 2 sites were inside the potentially suitable envelope, followed by 69% (22) of Class 3 sites, and 81% (46) of all sites. We reran the model a third time (Model C, Fig. 13) to include the Madrean Montane Conifer Forest biome, plus 4 riparian biomes found throughout Arizona. These additional biomes did not contain Class 1 or 2 Jaguar sightings and only marginally increased the size of the potentially suitable envelope (29.6% of state), but were identified by JAGHAB as potentially important habitat for jaguars. Model C did not improve classification of Class 1 and 2 sites (compared with Model B), but did improve classification of Class 3 sites to 78%, and overall accuracy (all sites) to 86% (49).

Arizona Game and Fish Department January 2003 NGTR 203: Characterizing and Mapping Potential Jaguar Habitat in Arizona Page 20
Figure 12. Potentially suitable biomes identified by JAGHAB, but only 4 contained Class 1 or 2 sightings (Great Basin Conifer Woodland, Madrean Evergreen Forest, Rocky Mountain Montane Conifer Forest, and Scrub Grassland). The riparian vegetation containes 4 biomes.

Arizona Game and Fish Department January 2003 NGTR 203: Characterizing and Mapping Potential Jaguar Habitat in Arizona Page 21
Figure 13. Potentially suitable habitats for jaguars in Arizona were identified by 3 separate model runs, and used different habitat criteria for each model. Model A was the most restrictive, with a TRI filter and only 4 biomes. Model B was identical to Model A, but without the TRI filter. Model C was similar to Model B, but included all potential biomes (Fig. 12). All 3 models excluded areas that were further than 10 km from water.

Arizona Game and Fish Department January 2003 NGTR 203: Characterizing and Mapping Potential Jaguar Habitat in Arizona Page 22
DEFINING POTENTIAL JAGUAR HABITAT AND CONSERVATION ZONES IN ARIZONA Information on jaguar ecology and behavior, especially at the northern edge of the species’ range, is very limited. This is the first spatial analysis of potential jaguar habitat in the southwestern United States. During the 20th century, more than 60 jaguars were reportedly taken in Arizona and New Mexico. Brown and Lopez Gonzales (2001) summarized, mapped, and characterized these records by biotic community based on Brown (1994). However, many of the jaguar sightings were not considered appropriate for our model construction because 1) there was no physical evidence (skins, photos) and the reliability of the source was unknown or questionable and/or 2) the locality descriptions were too vague for plotting. By focusing on the most reliable and accurate records (Class 1 and 2), we were able to obtain better information on the association between jaguars and selected environmental/habitat variables. The majority of Class 1 and 2 jaguar sightings in Arizona were in scrub grasslands between 1220 and 1829 m (4000 – 6000 ft) elevation, in intermediately to extremely rugged terrain, and within 10 km of a water source. Unfortunately, human activities within the last century have impacted all 3 of these seemingly important habitat components for jaguar. Scrub grasslands of southeastern Arizona have become increasingly dominated by desertscrub vegetation due to extensive fire suppression and cattle grazing. Human activities have also caused many watercourses to dry up or become intermittent (Rabinowitz 1999), and sky-island habitats have been heavily modified by logging and recreational activities. Perhaps the most ominous of all, increasing human habitation along the border may restrict jaguar movements between Mexico and Arizona. We are uncertain of the relationship between terrain ruggedness and jaguar occurrence, but they appear to be correlated. This observation is supported by Ortega-Huerta and Medley (1999), who found jaguars were more common on moderate to steep slopes in the Sierra de Tamaulipas, Mexico. It is not surprising that jaguar sightings in Arizona were primarily located in moderate to extremely rugged country. These areas are probably the least impacted by humans and have the greatest potential to remain that way. As the human population in Arizona’s valleys continues to grow, one would expect that jaguars would avoid these areas and stick to the more mountainous, rugged country. However, less rugged areas may serve as corridors between habitat patches in neighboring mountain ranges provided that other habitat components (cover, water, prey) are available and the landscape has not been severely altered or degraded by human activities. The amount of area identified as potentially suitable jaguar habitat in Arizona ranged from 21 to approximately 30 percent of the state. All 3 models had a high classification rate for Class 1 and 2 jaguar sites (92-96%). Of the 3 models run, Model A is the most restrictive and resulted in a more patchy arrangement of potential habitat across the landscape. By omitting the TRI filter (Models B and C), approximately 8% more of the state was classified as potential habitat and the habitat patches became more connected, particularly in the southeastern part of the state. Model C, which included all potential biomes, added very little to the model and only improved the classification rate of Class 3 sites. The lack of potentially suitable jaguar habitat in riparian areas can largely be attributed to agricultural and urban development and the concurrent loss of 90% of

Arizona Game and Fish Department January 2003 NGTR 203: Characterizing and Mapping Potential Jaguar Habitat in Arizona Page 23
Arizona’s historic cottonwood (Populus fremontii) and willow (Salix spp.) gallery forest (Krueper 1993). The lack of suitable habitat in other habitat classifications can be attributed mostly to proximity to water. The best-suited area for jaguar conservation is located in southeastern Arizona (Fig. 14) in Santa Cruz, Pima, Cochise and Graham Counties (Zone 1). This area resembles an inverted V with the southern end separated by a swath of agricultural and developed land, or land that is >5 km from a spring or >10 km from perennial/intermittent waters. When the TRI filter is not applied, habitat corridors form to the south and north of the Cochise/Graham County boundary. Based upon the jaguar distribution patterns in southeast Arizona, we suspect there are habitat corridors in Mexico that connect southeast Arizona to the northern-most established jaguar population in the Sierra Madres. These habitat relationships will become clearer when a biogeographic analysis similar to the one described in this paper is completed for Sonora, Mexico. Another large patch of potentially suitable jaguar habitat extends northwestward from the Mogollon/Gila Mountains of New Mexico across the Mogollon Rim to the Williams-Flagstaff area. If the TRI filter is not considered, this area just barely connects with another smaller patch that extends south to the Prescott area. Although these patches contain approximately one-quarter of the historic jaguar observations, no jaguars have been recorded from this area since 1964. This northern area is disconnected from the 2 habitat patches to the south by a broad band of unsuitable habitat approximately 17-km (10.5-mi) wide that encompasses the Gila River Valley near the city of Safford. This area has been highly modified by agricultural and rural development, likely creating an effective barrier to jaguar movement along a north-south gradient. Although Model C identifies the riparian area along this stretch of the Gila River as potential habitat, it is an isolated stringer that does not connect to any potential habitat patch. In the current landscape, it appears unlikely for jaguars to occur farther north than west-central Graham County, in the approximate vicinity of Aravaipa. Jaguars may have historically entered the Mogollon Rim country from New Mexico via the Gila Wilderness or San Francisco River Valley. Preliminary analyses of potentially suitable jaguar habitat in New Mexico indicate that these latter areas are widely separated from potentially suitable jaguar habitat in extreme southwestern New Mexico and, therefore, from potential corridors to Sonora, Mexico (Menke and Hayes 2002). Jaguars were historically present in Arizona in greater numbers and potentially occurred here as a thinly scattered resident population (Brown and Lopez Gonzalez 2001). It is generally accepted that an established jaguar population was extirpated from the United States by the 1960s (Swank and Teer 1989) and the recent sightings of male jaguars in the southwestern U.S. are dispersing animals from populations in Sonora, Mexico. Jaguar habitat in Mexico is becoming smaller and more fragmented due to expanding human populations (Friederici 1998, Rabinowitz 1999). Sonoran jaguars may need to occasionally and temporarily disperse north until territory opens up in the breeding population. While Rabinowitz (1999) considered the southwestern United States marginal habitat for jaguars in terms of cover, water, and prey availability, any habitat in the U.S. may potentially be significant for Sonoran jaguar populations, emphasizing the importance

Arizona Game and Fish Department January 2003 NGTR 203: Characterizing and Mapping Potential Jaguar Habitat in Arizona Page 24
Figure 14. The most suitable conservation area for jaguars is in southeast Arizona (Zone 1).

Arizona Game and Fish Department January 2003 NGTR 203: Characterizing and Mapping Potential Jaguar Habitat in Arizona Page 25
of protecting and creating travel corridors between the U.S. and Mexico (Miller and others 2000). Jaguars range across many nations and habitat types, making international cooperation a necessity for jaguar conservation (Sanderson and others 2002). While the most important large expanse of occupied jaguar habitat is centered in the Amazon Basin, Sanderson and others (2002) stressed the importance of protecting jaguar populations in all the significantly different ecological settings in which they occur. This includes populations at the fringe of the species’ range in the Sierra Madres of Mexico. Indeed, these fringe areas (including the southwestern U.S.) could become important to the conservation of the species if present rates of tropical forest conversion continue, threatening jaguar survival in the heart of the range (Miller and others 2000). Jaguar distribution patterns over the last 50 years suggest that southeast Arizona (Zone 1; Fig. 14) is the most likely area for future jaguar occurrence in the U.S. and is therefore a hotspot for conservation. RECOMMENDATIONS The jaguar habitat suitability map (Fig. 13) presents a coarse outline of potential jaguar habitat in Arizona. In truth, the map depicts primarily land-cover requirements but little in the way of habitat needs and should be viewed with caution until more specific habitat-use data becomes available. We need to examine the habitat usage of jaguars in northern Sonora to refine and ground-truth the habitat suitability map. Additionally, JAGSAG stressed the importance of identifying and maintaining a travel corridor between the jaguar population in Sonora, Mexico and Arizona. Without the corridor, there is little hope of jaguars visiting or occupying Arizona. We also need to examine connectivity with New Mexico because the jaguar distribution pattern along the Mogollon Rim suggests some might have entered from the southeast via the San Francisco River Valley or Gila Wilderness. The AGFD will continue to investigate travel corridors and habitat needs of the jaguar and refine the habitat suitability model and map.

Arizona Game and Fish Department January 2003 NGTR 203: Characterizing and Mapping Potential Jaguar Habitat in Arizona Page 26
LITERATURE CITED Brown, D.E. 1983. On the status of the jaguar in the Southwest. Southwestern Naturalist 28:459-
460. Brown, D.E., ed. 1994. Biotic communities: Southwestern United States and Northwestern
Mexico. University of Utah Press, Salt Lake City, Utah. Brown, D.E., C.H. Lowe, and C.P. Pase. 1980. A digitized systematic classification for
ecosystems with an illustrated summary of the natural vegetation of North America. USDA Forest Service, General Technical Report. RM-73. Rocky Mountain Forest and Range Experiment Station, Fort Collins, Colorado.
Brown, D.E. and C.A. Lopez Gonzalez. 2001. Borderland Jaguars. University of Utah Press, Salt
Lake City, UT. Childs, J.L. 1998. Tracking the felids of the borderlands. Printing Corner Press, El Paso, TX. Federal Register. 1997. Final rule to extend endangered status for the jaguar in the United States.
Federal Register 62:39147-57. Friederici, P. 1998. Return of the jaguar. National Wildlife 36: 48-51. Glenn, W. 1996. Eyes of fire: encounter with a borderlands jaguar. Printing Corner Press, El
Paso, TX. Halvorson, W.L. and M.R. Kunzmann. 2000. Assessment, correction, and augmentation of the
Arizona GAP vegetation data: Final report for the Arizona collection agreement No. HAB-96-0017. USGS, Western Ecological Research Center, Sonoran Desert Field Station, 125 Biological Sciences East, University of Arizona, Tucson.
Hoffmeister, D.F. 1986. Mammals of Arizona. University of Aizona Press, Tucson and Arizona
Game and Fish Department, Phoenix. Johnson, T.B. and W.E. Van Pelt. 1997. Conservation assessment and strategy for the jaguar in
Arizona and New Mexico. Nongame and Endangered Wildlife Program Technical Report 105. Arizona Game and Fish Department, Phoenix, Arizona.
Krueper, D.J. 1993. Effects of land use practices on western riparian ecosystems. pp. 321-330 in
D.M. Finch and P.W. Stangel, eds. Status and management of neotropical migratory birds. U.S. For. Serv. Gen Tech. Rep. RM-229.
Menke, K.W. and C.L. Hayes. 2002. Evaluation of the relative suitability of potential jaguar
habitat in New Mexico. New Mexico Department of Game and Fish Technical Report, in prep.

Arizona Game and Fish Department January 2003 NGTR 203: Characterizing and Mapping Potential Jaguar Habitat in Arizona Page 27
Miller, B., A.R. Rabinowitz, and C.A. Lopez Gonzalez. 2000. Memorandum to jaguar scientific advisory group 11/14/00.
Ortega-Huerta, M.A. and K.E. Medley. 1999. Landscape analysis of jaguar (Panthera onca)
habitat using sighting records in the Sierra de Tamaulipas, Mexico. Environmental Conservation 26:257-269.
Quigley, H.B. and P.G. Crawshaw. 1992. A conservation plan for the jaguar Panthera onca in
the Pantanal region of Brazil. Biological Conservation 61:149-157. Rabinowitz, A.R. 1999. The present status of Jaguars (Panthera onca) in the southwestern
United States. The Southwestern Naturalist 44:96-100. Rabinowitz, A.R. and B.G. Nottingham, Jr. 1986. Ecology and behaviour of the jaguar in Belize,
Central America. J. of Zoological Society of London 210:149-159. Riley, S.J., S.D. DeGloria and R. Elliot. 1999. A terrain ruggedness index that quantifies
topographic heterogeneity. Intermountain Journal of Sciences 5:23-27. Sanderson, E.W., K.H. Redford, C.B. Chetkiewicz, R.A. Medellin, A.R. Rabinowitz, J.G.
Robinson, and A.B. Taber. 2002. Planning to save a species: the jaguar as a model. Conservation Biology 16:58-72.
Shaller, G.B. and Crawshaw, P.G. 1980. Movement patterns of jaguar. Biotropica 12:161-168. Sierra Institute Field Studies Program. 2000. Jaguar habitat in southern Arizona and New
Mexico: a report to the Habitat Committee of the Jaguar Conservation Team. University of California Extension, Santa Cruz. Unpublished report.
Seymour, K.L. 1989. Mammalian Species, Panthera Onca. The American Society of
Mammalogists 340:1-9. Swank, W.G. and J.G. Teer. 1989. Status of the jaguar. Oryx 23:14-21. Tewes, M.E. and Schmidley, D.J. 1987. The Neotropical felids: jaguar, ocelot, margay, and
jaguarundi. Pp. 697-712 in Wild furbearer management and conservation in North America. Ontario Ministry of Resources. Ottawa, ON.
Valencia, R.A., J.A. Wennerlund, R.A. Winstead, S. Woods, L. Riley, E. Swanson, and S. Olson.
1993. Arizona riparian inventory and mapping project. Arizona Game and Fish Department, Phoenix, Arizona.

Arizona Game and Fish Department January 2003 NGTR 203: Characterizing and Mapping Potential Jaguar Habitat in Arizona Page 28
APPENDIX 1. THE 57 SIGHTING RECORDS USED IN OUR ANALYSIS. CODEa YEARb CLc LCd LOCATION SEX
1 1901 3 3 Dos Cabezas Mts ?
2* 1902 1 2 Redington Pass m
3 1902 3 2 Catalina Mts ?
4 1903 3 3 Atascosa Mts ?
5 1904 3 2 Verde River ?
6 1906 3 3 Chiricahua Mts f
7 1907 3 3 Patagonia Mts ?
8 1907 3 2 Mogollon Mts ?
9* 1907 1 1 South Rim G.C. m
10 1910 3 2 Chevlon Canyon f
11 1910 3 2 Chiricahua Mts f
12* 1912 1 2 Chiricahua Mts ?
13 1912 3 2 Sunset Mtn ?
14 1912 3 2 Bozarth Mesa ?
15 1912 3 3 Catalina Mts ?
16 1912 3 3 Rincon Mts ?
17 1913 1 3 Tortolita Mts ?
18 1913 3 2 Red Mtn m
19* 1916 1 2 Catalina Mts m
20* 1917 1 1 Santa Rita Mtns m
21 1918 3 2 South Rim G.C. ?
22 1918 3 2 Santa Rita Mts ?
23* 1919 1 1 Santa Rita Mts f
24 1920 2 3 Rincon Mts ?
25 1920 2 3 Santa Rita Mts ?
26* 1922 1 2 Rincon Valley ?
27* 1924 1 2 Rim ?
28 1926 1 3 Patagonia Mts? ?
29 1926 1 3 Atascosa Mts m
30* 1926 1 2 Santa Maria Mts m
CODEa YEARb CLc LCd LOCATION SEX
32 1929 3 3 Sand Tank Mts ?
31 1930 3 3 Chiricahua Mts ?
33* 1932 2 1 South Rim G.C. f
34* 1933 2 2 Atascosa Mts m
35 1933 3 3 Sierra Estrella ?
36 1934 3 3 Patagonia Mts ?
37 1939 3 2 Bloody Basin ?
38* 1939 1 2 Atascosa Mts m
39 1940 3 3 White Mts ?
40 1947 3 3 Atascosa Mts ?
41 1948 3 3 Patagonia Mts m
42* 1949 1 2 Cerro Colorado f
43* 1957 1 2 White River ?
44 1957 3 2 Red Mountain m
45* 1961 1 1 Empire Mts m
46* 1963 1 2 White Mts f
47 1964 1 3 Black River m
48* 1965 1 2 Patagonia Mts m
49* 1971 1 2 Santa Cruz Rive m
50* 1986 1 1 Dos Cabezas m
53* 1988 2 1 San Luis Mts ?
54 1988 3 1 Sierrita Mts ?
55* 1993 2 1 Baboquivari Mts ?
51* 1996 1 1 Peloncillo Mts m
52* 1996 1 1 Baboquivari Mts ?
56* 1997 2 2 Cerro Colorado ?
57* 2002 1 1 Pajarito Mts ?
*used in model development asite location on Figures 1 and 2 bthe year jaguar was observed
c1 = physical evidence; 2 = reliable witness; 3 = less reliable d1 = good location description; 2 = fair; and 3 = poor