CHARACTERIZING AN EFFECTIVE HOSPITAL ...helmjweb/publications/C2 (WinterSim...CHARACTERIZING AN...
12
Proceedings of the 2010 Winter Simulation Conference B. Johansson, S. Jain, J. Montoya-Torres, J. Hugan, and E. Y¨ ucesan, eds. CHARACTERIZING AN EFFECTIVE HOSPITAL ADMISSIONS SCHEDULING AND CONTROL MANAGEMENT SYSTEM: A GENETIC ALGORITHM APPROACH Jonathan E. Helm Marcial Lapp Brendan D. See Department of Industrial & Operations Engineering University of Michigan 1205 Beal Avenue, Ann Arbor, MI 48109, USA ABSTRACT Proper management of hospital inpatient admissions involves a large number of decisions that have complex and uncertain consequences for hospital resource utilization and patient flow. Further, inpatient admissions has a significant impact on the hospital’s profitability, access, and quality of care. Making effective decisions to drive high quality, efficient hospital behavior is difficult, if not impossible, without the aid of sophisticated decision support. Hancock and Walter (1983) developed such a management system with documented implementation success, but for each hospital the system parameters are “optimized” manually. We present a framework for valuing instances of this management system via simulation and optimizing the system parameters using a genetic algorithm based search. This approach reduces the manual overhead in designing a hospital management system and enables the creation of Pareto efficiency curves to better inform management of the trade-offs between critical hospital metrics when designing a new control system. 1 INTRODUCTION Inpatient admissions and bed management is a core value engine of the hospital. Effective management of hospital admissions is critical to the overall cost, quality of care, and patient access. Due to the inherent complexity of the network of resources that encompass hospital care delivery and the dynamic and stochastic nature of patient trajectories within the hospital, effective systems management is difficult without the aid of predictive stochastic models. In the absence of such systems to manage bed and care resources, hospital bed occupancy levels become statistically “out of control,” as in the census plot from a partner hospital shown in Figure 1. 0 50 100 150 200 250 300 350 80 90 100 110 120 130 140 150 160 Day of Year (2008) Census Figure 1: Plot of partner hospital census over the course of one year. This census variability causes emergency department congestion, elective surgical and medical cancelations, radiology backlogs, strains on nurse and ancillary staff, and intensive care unit (ICU) overcrowding. System-wide congestion caused by high census variability results in compromised quality of care, emergency patient diversions and blockages for lack of beds, increased patient length 2387 978-1-4244-9864-2/10/$26.00 ©2010 IEEE
Transcript of CHARACTERIZING AN EFFECTIVE HOSPITAL ...helmjweb/publications/C2 (WinterSim...CHARACTERIZING AN...

Proceedings of the 2010 Winter Simulation ConferenceB. Johansson, S. Jain, J. Montoya-Torres, J. Hugan, and E. Yucesan, eds.
CHARACTERIZING AN EFFECTIVE HOSPITAL ADMISSIONS SCHEDULING ANDCONTROL MANAGEMENT SYSTEM: A GENETIC ALGORITHM APPROACH
Jonathan E. HelmMarcial Lapp
Brendan D. See
Department of Industrial & Operations EngineeringUniversity of Michigan
1205 Beal Avenue, Ann Arbor, MI 48109, USA
ABSTRACT
Proper management of hospital inpatient admissions involves a large number of decisions that havecomplex and uncertain consequences for hospital resource utilization and patient flow. Further,inpatient admissions has a significant impact on the hospital’s profitability, access, and quality ofcare. Making effective decisions to drive high quality, efficient hospital behavior is difficult, if notimpossible, without the aid of sophisticated decision support. Hancock and Walter (1983) developedsuch a management system with documented implementation success, but for each hospital thesystem parameters are “optimized” manually. We present a framework for valuing instances of thismanagement system via simulation and optimizing the system parameters using a genetic algorithmbased search. This approach reduces the manual overhead in designing a hospital management systemand enables the creation of Pareto efficiency curves to better inform management of the trade-offsbetween critical hospital metrics when designing a new control system.
1 INTRODUCTION
Inpatient admissions and bed management is a core value engine of the hospital. Effective managementof hospital admissions is critical to the overall cost, quality of care, and patient access. Due to theinherent complexity of the network of resources that encompass hospital care delivery and the dynamicand stochastic nature of patient trajectories within the hospital, effective systems management is difficultwithout the aid of predictive stochastic models. In the absence of such systems to manage bed andcare resources, hospital bed occupancy levels become statistically “out of control,” as in the censusplot from a partner hospital shown in Figure 1.
0 50 100 150 200 250 300 35080
90
100
110
120
130
140
150
160
Day of Year (2008)
Cen
sus
Figure 1: Plot of partner hospital census over the course of one year.
This census variability causes emergency department congestion, elective surgical and medicalcancelations, radiology backlogs, strains on nurse and ancillary staff, and intensive care unit (ICU)overcrowding. System-wide congestion caused by high census variability results in compromisedquality of care, emergency patient diversions and blockages for lack of beds, increased patient length
2387978-1-4244-9864-2/10/$26.00 ©2010 IEEE

Helm, Lapp, and See
of stay (LOS), and significant excess costs (Keehan, Sisko, and Truffer 2007), (Sprivulis et al. 2006),(Harrison, Shafer, and Mackay 2005), and (Proudlove, Gordon, and Boaden 2003).
While a significant amount of research focuses on operating room scheduling or emergencydepartment management, relatively little research examines how the decision to schedule and/oradmit a patient affects the downstream hospital resources required to care for that patient over theentire course of their hospitalization. Ignoring the effect of an elective admission on the entire hospitalsystem can contribute significantly to the unstable hospital workloads seen in Figure 1, which leadsto the host of problems described above.
Previous research has established effective admission and bed management systems using a varietyof modeling techniques. Gallivan and Utley (2005) proposed an integer programming framework forstabilizing hospital workloads. This framework, however, was developed for specialized “elective-only” hospitals in the UK and considers only a single downstream ward or unit for the patients toenter after surgery. This is not the case in most hospitals, in which multiple types of wards servemany different kinds of patients. In addition, there is interaction between wards when patients aretransferred due to their dynamically changing condition. In fact, Gupta (2007) states one of the mainchallenges of modeling surgical admissions is to consider multiple downstream resources over time. Ina similar vein, Isken, Ward, and Littig (2010) developed an optimization model for obstetrics, wherethe decisions include scheduling of c-sections and inductions. Obstetrics generally function somewhatindependently of the rest of the hospital, however, and thus constitute a more homogeneous resource.Chow et al. (2008) developed an optimization to reduce congestion in surgical wards, but considers alinear path in which a patient enters a ward and then is discharged with no interaction between wards.
In other research, simulation has been used effectively to account for the complexities of anintegrated network of care resources that must serve patients whose needs change dynamically overtime. Harper (2002) and Pitt (1997) developed discrete-event simulation frameworks for modelingpatient flow and its effect on hospital resources. However, these models are quite general and do notdirectly constitute decision support for operational management of inpatient admissions.
The Admission Scheduling and Control System developed by (Hancock and Walter 1979) and(Hancock and Walter 1983) and analyzed by (Lowery 1996) is extended in this paper. This systemmodels the hospital as a complex queueing network which encompasses stochastic patient trajec-tories and the network of resources required to serve patients’ dynamically changing needs. Thecontrols on the system are (i) the elective admission schedule, (ii) the census level at which to cancelelective patients, and (iii) the census level at which to call in extra patients off a “callin queue”.Hancock and Walter (1983) claim documented savings between $43,000 and $750,000 per year aswell as large reductions in surgical cancelations and emergency turnaways based on prior imple-mentations. While this approach to inpatient admissions is effective from a practical standpoint andincludes critical features of hospital systems that are omitted in other optimization-based models, itappears that the determination of scheduling parameters is done manually. In this paper, we attempt todevelop an optimization framework for automatically generating effective system parameters for suchan admission system. To our knowledge, this is the first attempt to add an optimization component tothis fully specified control problem of managing admissions to a hospital system, where the systemis specified by a network of care resources and complete stochastic patient trajectories through thenetwork.
2 METHODS
We model a partner hospital as a proof of concept for our proposed framework for generating an effectiveadmission scheduling and control system. Using this hospital as a case study, we demonstrate that ouroptimization framework improves upon the existing scheduling and control system. In addition, wedemonstrate our framework’s usefulness in generating Pareto efficiency curves to guide administratordecision-making.
2.1 Input Modeling
Our simulation uses input data from a mid-size community hospital. To model this hospital, a fullyear’s worth of data is used with identifying patient information removed and replaced by admissionnumbers. Given that our system is modeling a hospital based on its daily (midnight) census, we onlyconsider patients that stayed in the hospital for at least one night. In 2008, 14,827 patients stayed atleast one night. Out of these overnight patients, 7,016 were emergency patients while the remaining7,811 were scheduled patients.
2388
Helm, Lapp, and See
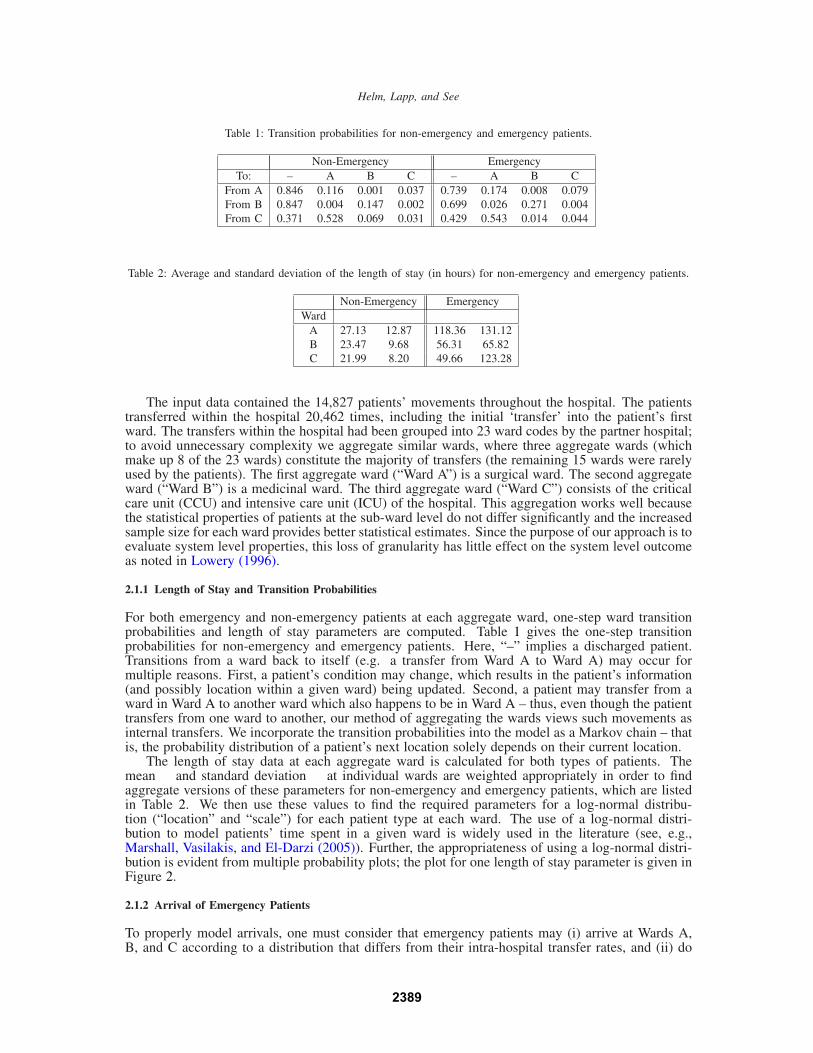
Table 1: Transition probabilities for non-emergency and emergency patients.
Non-Emergency EmergencyTo: – A B C – A B C
From A 0.846 0.116 0.001 0.037 0.739 0.174 0.008 0.079From B 0.847 0.004 0.147 0.002 0.699 0.026 0.271 0.004From C 0.371 0.528 0.069 0.031 0.429 0.543 0.014 0.044
Table 2: Average and standard deviation of the length of stay (in hours) for non-emergency and emergency patients.
Non-Emergency EmergencyWard µ σ µ σ
A 27.13 12.87 118.36 131.12B 23.47 9.68 56.31 65.82C 21.99 8.20 49.66 123.28
The input data contained the 14,827 patients’ movements throughout the hospital. The patientstransferred within the hospital 20,462 times, including the initial ‘transfer’ into the patient’s firstward. The transfers within the hospital had been grouped into 23 ward codes by the partner hospital;to avoid unnecessary complexity we aggregate similar wards, where three aggregate wards (whichmake up 8 of the 23 wards) constitute the majority of transfers (the remaining 15 wards were rarelyused by the patients). The first aggregate ward (“Ward A”) is a surgical ward. The second aggregateward (“Ward B”) is a medicinal ward. The third aggregate ward (“Ward C”) consists of the criticalcare unit (CCU) and intensive care unit (ICU) of the hospital. This aggregation works well becausethe statistical properties of patients at the sub-ward level do not differ significantly and the increasedsample size for each ward provides better statistical estimates. Since the purpose of our approach is toevaluate system level properties, this loss of granularity has little effect on the system level outcomeas noted in Lowery (1996).
2.1.1 Length of Stay and Transition Probabilities
For both emergency and non-emergency patients at each aggregate ward, one-step ward transitionprobabilities and length of stay parameters are computed. Table 1 gives the one-step transitionprobabilities for non-emergency and emergency patients. Here, “–” implies a discharged patient.Transitions from a ward back to itself (e.g. a transfer from Ward A to Ward A) may occur formultiple reasons. First, a patient’s condition may change, which results in the patient’s information(and possibly location within a given ward) being updated. Second, a patient may transfer from award in Ward A to another ward which also happens to be in Ward A – thus, even though the patienttransfers from one ward to another, our method of aggregating the wards views such movements asinternal transfers. We incorporate the transition probabilities into the model as a Markov chain – thatis, the probability distribution of a patient’s next location solely depends on their current location.
The length of stay data at each aggregate ward is calculated for both types of patients. Themean µ and standard deviation σ at individual wards are weighted appropriately in order to findaggregate versions of these parameters for non-emergency and emergency patients, which are listedin Table 2. We then use these values to find the required parameters for a log-normal distribu-tion (“location” and “scale”) for each patient type at each ward. The use of a log-normal distri-bution to model patients’ time spent in a given ward is widely used in the literature (see, e.g.,Marshall, Vasilakis, and El-Darzi (2005)). Further, the appropriateness of using a log-normal distri-bution is evident from multiple probability plots; the plot for one length of stay parameter is given inFigure 2.
2.1.2 Arrival of Emergency Patients
To properly model arrivals, one must consider that emergency patients may (i) arrive at Wards A,B, and C according to a distribution that differs from their intra-hospital transfer rates, and (ii) do
2389

Helm, Lapp, and See
10−1
100
101
102
103
104
0.0001
0.001
0.01
0.1
0.25
0.75
0.9
0.99
0.999
0.9999
Length of Stay
Qua
ntile
Correlation Coefficient: 0.994
Figure 2: Log-normal probability plot of length of stay parameter.
Table 3: Average number of arrivals, separated by ward and time of day.
Non-Emergency EmergencyWard: A B C A B C
AM PM AM PM AM PM AM PM AM PM AM PMM 8.44 1.38 2.04 1.94 0.35 0.13 1.94 3.17 2.19 2.48 1.15 1.63Tu 8.45 1.45 6.15 2.19 0.25 0.11 2.03 2.81 1.89 2.53 1.02 1.60W 7.85 1.32 5.15 1.75 0.25 0.09 1.96 2.87 1.43 2.00 0.92 1.60Th 9.42 1.18 4.04 1.62 0.17 0.06 1.98 2.50 1.67 2.77 1.23 1.27F 7.12 0.73 3.19 2.02 0.25 0.08 1.94 3.48 1.67 2.63 1.00 1.44Sa 0.17 0.12 1.00 0.94 0.02 0.10 1.81 3.48 1.67 2.63 1.00 1.44Su 1.13 4.87 0.87 1.38 0.12 0.08 1.58 2.17 1.65 2.23 1.12 1.40
not arrive uniformly throughout the week. Consequently, we compute these values as follows. First,we group emergency patients based on the first aggregate ward they visit (i.e. Ward A, B, or C).Many patients arrive first to a central triage, and then transfer within the hospital to one of the 23wards. For each patient, we follow their transfers until they first enter one of the wards aggregatedinto Ward A, B, or C. For each of the three wards, we determine how many emergency patients areadmitted between midnight and 2 p.m. (which we refer to as “AM”) and 2 p.m and 11:59 p.m. (“PM”)on each day of the year. The grouping of emergency patients into AM and PM arrivals is neededto accurately model the system: AM arrivals generally arrive before scheduling decisions are madeand thus can be accounted for in those decisions, while PM arrivals enter the hospital after mostscheduled patients have been admitted for the day. Further, it is well-known that emergency patientsdo not arrive uniformly over the course of the day, which leads to increased queueing. The emergencypatients in our study generally followed the daily arrival pattern found by previous studies – refer toDraeger (1992) and (See et al. 2009) for empirical distributions.
After determining how many emergency patients arrive at each ward in the AM and PM timeblocks for each day of the year, we find the mean and standard deviation of patients arriving at eachward in the AM and PM blocks by day of week. These values are summarized in Table 3. The arrivalpattern of non-emergency patients is also of interest in order to evaluate the current system. As onewould generally expect, emergency patients do not arrive uniformly over the course of the week, inaddition to the heterogeneity over the course of a day. Subsequently, we use the mean number ofarrivals (grouped by ward, day of week, and AM/PM) in order to model emergency arrivals using aPoisson distribution.
These calculations – the one-step transition probabilities and length of stay for both emergencyand non-emergency patients at Wards A, B, and C, as well as the patients’ arrival locations, groupedby day of week and time of day – all serve as inputs to our simulation, which we describe in the nextsubsection.
2.2 Model Description
Our basic simulation model is similar to that described in the works of Hancock and Walter (1979),Hancock and Walter (1983), and Lowery (1996), which can be referred to for a more detailed de-
2390

Helm, Lapp, and See
scription. As a brief overview, we aggregate our partner hospital’s wards into 3 primary wards: WardA (Surgery), Ward B (Medicine), and Ward C (Critical Care). For each patient type, a flow path isdeveloped based on historical transfer probabilities between wards, as mentioned in §2.1.1. Figure 3represents the flow paths of different patients in our system. In this system, patients arrive accordingto their type – Poisson arrivals for emergencies, controlled arrivals for scheduled patients – receivethe first segment of treatment and then are either discharged or transferred to another ward for asubsequent treatment segment.
Figure 3: Map of patient flow trajectories.
One complicating feature of hospitals is that many resources within the network are flexible. Forexample, a surgery patient who exits surgery to find no surgery bed available can occupy a bed in themedicine ward. This is a critical feature of hospital systems that makes it difficult to properly modelthe hospital system using an optimization framework. In the simulation, alternate routing rules forwhen a ward is full are encoded in the model based on hospital practice.
Since we intend to use this simulation model for optimization of management system parameterswhere the simulation will be run thousands of times, one requirement is that a given run of thesimulation should complete quickly. Keeping this in mind, the construction of the simulation differsfrom many discrete-event simulations. Instead of simulating each individual patient arriving to thehospital, we instead simulate and manage groups of patients at once. To do so, we break each dayinto sequential subcomponents based on the order and timing of the system-level decisions that mustbe made. Anything that happens in between decision epochs is modeled as a single event. Forexample, we break the emergencies into AM and PM emergencies. AM emergencies are patients thatare able to reach a bed before scheduled and callin patients can fill those beds (i.e. before 2 p.m.).PM emergencies arrive after the cancel and callin decisions have been made and are thus subject toblockage from the patients admitted that day. We model the arrivals of each group as a single event.This approach highlights the fact that we are modeling system level outcomes and are only concernedwith whether or not a patient eventually reaches a bed or is turned away from the hospital in a givenday, ignoring the logistics of how that patient reaches the bed.
2.3 Model Control Parameters
We use the same control parameters defined in Hancock and Walter (1983) and Lowery (1996), as ourgoal is to show that optimization methods can be applied to determine these control parameters ratherthan designing the scheduling and control system manually. The three parameter types we considerare (i) the elective admission schedule by day of week, (ii) the cancelation level by day of week – thenumber of empty beds to leave open for evening emergencies, and (iii) the callin level by day of week– the number of empty beds below which we call patients in from the callin queue. Examples of thesystem controls are shown in Table 4, where each ward that has scheduled patients receives its ownset of controls. Setting these 42 control parameters will specify the admission scheduling and controlsystem for this hospital, which could then be implemented as in Hancock and Walter (1983). Thegoal of this research is to find the controls that will allow the hospital to operate at high efficiency,which means operating at high utilization with limits on the number of cancelations and emergencypatient blockages.
The first row of parameters in Table 4 tells the system how many elective patients to admit to eachward by day of week (“schedule”). For example, on Monday 10 patients should be scheduled for
2391

Helm, Lapp, and See
Table 4: Sample choices of the decision variables for Ward A and Ward B.
Ward A (Surgery) Ward B (Medicine)Su M Tu W Th F Sa Su M Tu W Th F Sa
Schedule 6 10 8 7 9 9 2 5 9 8 8 9 7 2Cancel 3 4 4 5 3 2 1 3 5 6 5 4 3 1Callin 14 12 9 9 9 9 16 15 11 10 10 8 9 14
Ward A and 9 elective patients should be scheduled to enter Ward B. Likewise, the “cancel” decisionvariable means that if fewer than 4 empty beds remain on a given Monday in Ward A, surgicalscheduled patients that would use those beds should be canceled. Finally, the “callin” parametermeans that if on a given Wednesday there are only 7 beds full in Ward B after all scheduled patientshave been admitted, then the hospital should call in 3 extra patients off the callin queue until 10 bedsare filled. This schedule is repeated in the same manner every week, as a repeatable weekly scheduleis a prerequisite for the scheduling and control system described in Hancock and Walter (1983), andLowery (1996).
2.4 Model Validation & Verification
In order to verify and validate the accuracy of our simulation model, we use strategies suggestedby Sargent (2005). The verification of the simulation model is done through a series of white-boxand black-box testing schemes. In addition to verifying the correct operation of each of the modulesillustrated in Figure (3), we also generate patient transition output for each ward for every turn of thesimulation clock. That is, using a manual process, we are able to verify that the correct number ofpatients are flowing through the system on a daily basis, ensuring that our simulation is performingcorrectly.
We validate our model of the system by comparing it against actual “real-world” hospital operations:given a year’s worth of hospital admissions data, we are able to extract the scheduling policy that wasused by the hospital and subsequently implement this policy in our model. Comparing the key featuresof the system (average daily census by day of week, volume of emergency and scheduled patients,and so forth) we find that our simulation closely mimics the actual hospital operations, validating thatit indeed functions correctly and produces the correct output.
2.5 Evaluating a Scheduling and Control System
To determine a control parameter set that specifies an effective scheduling and control system weneed a mechanism for comparing different systems. To do so, we develop an objective functionthat embodies the goal of achieving high utilization with limits on the number of cancelations andemergency blockages. The following definitions enable us to formalize an objective function forcomparing hospital admission scheduling and control systems.
Xt(Θ) Random variable denoting the number of cancelations on day t ∈ T = {Su,M,T,W,R,F,Sa}for a given control parameter set Θ
Yt(Θ) Random variable for emergency patient blockages on day t given controls ΘZt(Θ) Random variable for the number of empty beds at midnight on day t given controls Θc Cancelation costb Blockage cost for emergency patientsh Cost of an empty bed
Samples from Xt , Yt , and Zt are taken daily from the simulation output. While it is possible tofurther differentiate costs by patient type we do not do so for several reasons. First, the costs areestimates and such differentiation can further complicate the system’s functioning. In addition, thissystem is a high level management system, so it does not tell the hospital which patients to cancel,only how many to cancel, so the type of patient canceled is subject to doctor and administratordecision-making and cannot be determined within the simulation. Using the following linear costfunction we can determine the value, V (Θ), of a given set of control parameters, Θ, that define a
2392

Helm, Lapp, and See
scheduling and control system:
V (Θ) = ∑t∈T
[
cXt(Θ)+bYt(Θ)+hZt(Θ)]
.
Note that because we consider scheduling and control parameters that repeat weekly, we areconsidering a seven day cyclostationary system – if the simulation is run for T days, it generates T/7observations (though certainly not independent) of Xt , Yt , and Zt for each day of the week. Fromthese observations, an estimator for E[V (Θ)] can be obtained. It is this estimator, V (Θ), that is usedto compare systems using a genetic algorithm.
While the cost parameters of the objective function cannot be precisely quantified, these parameterscan be imputed from hospital management goals. For example, a management goal of “no more than 3cancelations a month and 2 emergency blockages per month” can be approximately translated into costparameters that achieve this goal – though this translation is not necessarily unique. By accumulatingthe objective function over simulation iterations it is possible to estimate a particular scheduling andcontrol system’s expected value and thereby possible to compare different scheduling and controlsystems. This comparison is used in our genetic algorithm to rank members of the population.
2.6 Genetic Algorithm
A genetic algorithm (Davis and Mitchell 1991) is an optimization technique often applied to difficultoptimization problems, especially when the state-space of possible solutions is incredibly large andthe objective function is non-linear. In our particular problem, the objective is actually the result ofa complicated simulation, making optimization approaches rather difficult.
In this particular problem, the input to the genetic algorithm consists of a seven-day hospitalscheduling and control policy. In addition, each of the two major wards of the hospital has its ownscheduling and control parameters. Thus to characterize the management system for this hospital,our algorithm must determine 42 decision variables that specify the management rules for scheduledpatients, callin patients, and cancelations.
To more effectively implement the genetic algorithm, we encode each of the septuplets for eachof the wards into a binary bit string. The size of the bit string is determined by the maximum capacityof each ward. For example, the maximum capacity of Ward A is 97 overnight beds, so each Ward Aparameter is encoded using a 7-bit binary number.
2.6.1 Implementation
As taken from the general literature, the steps for implementing a typical genetic algorithm are asfollows:
1. Generate a population of possible solutions to the problem.2. Determine the objective function value for each member in the population.3. Pick two population members, generally ones with highly-ranked objective function values,
and combine them to create an offspring (“cross-over”).4. Randomly change genes in the offspring (“mutation”).5. Introduce the offspring into the population and repeat the process.
Using a genetic algorithm to determine the optimal scheduling policy followed the implementationseen in Figure 4.
While a genetic algorithm is by no means guaranteed to provide an optimal solution, it doesoffer a systematic way to find a better objective function value through an iterative process. For ourapplication, the genetic algorithm needs to be augmented to respect general hospital restrictions. Forexample, in many hospital systems it is generally the case that patients are not scheduled to arrive atthe end of the week because of reduced resource levels on the weekends (Bell and Redelmeier 2001).To respect this constraint, we add to the genetic algorithm restrictions on mutations such that offspringscheduling policies are rejected if they admit too many patients on the weekend. In the case of ourpartner hospital, we restrict scheduled patients according to the constraints in Table 5. We presentthe results of the genetic algorithm runs in §3.
2393

Helm, Lapp, and See
Figure 4: Implementation of the genetic algorithm.
Table 5: Patient scheduling constraints due to reduced weekend resource levels.
Saturday SundayWard A 0 ≤ 6Ward B ≤ 2 ≤ 2
3 RESULTS
To test our optimization framework, we develop a simulation model using the C++ programminglanguage that reflects the partner hospital described in §2 using the historical data. This simulationmodel serves as the basis for our genetic algorithm optimization. In this section we first describe thekind of output that was generated and how it was used. Next, we present a comparison of the currentsystem with the system generated from the genetic algorithm solution for a specific cost parameterset. Then we solve the same system under varying parameter sets to generate Pareto efficiency curvesthat can help guide hospital administrator decision-making rather than forcing the administrator to“choose” a set of costs upon which to optimize. These trade-off curves can be particularly useful forhospital management decision support and at the same time would be quite difficult (if not impossible)to generate manually. This justifies the use of optimization methodologies to solve for effective systemparameter sets.
Each hospital simulation is run for 700 days and includes a 34 day warm-up period. This length oftime reflects roughly a two-year time frame during which the hospital fluctuations have stabilized. Asingle replication with 700 days of simulation reduces the error of the objective function to 0.33 at a97.5% confidence level for a typical objective function whose value ranges between $800 and $1,200.Likewise, at a 97.5% confidence level, the error level for the individual objectives (cancelation, turnaway, and empty bed costs) is 0.17, 0.35, and 0.04, respectively. These error values indicate that a700-day horizon is sufficient to attain the steady state of the hospital system.
It should be noted that each run of the simulation, including 734 days of operation, completed in 8seconds on an Intel Core 2 (Duo) E8500 processor running at 3.06Ghz. In addition, the simulation andgenetic algorithm execute sequentially and thus do not take advantage of multiple cores/processors.Given the 8 second run-time of a complete simulation, a genetic algorithm run of 3000 iterationscompletes in just under 7 hours of run-time. It was deemed sufficient to run the algorithm for 3000iterations at the time of the experiments due to the available machine time and overall processingtime required. Further motivation for increased run-time and efficiency are addressed in §4.
3.1 Model Output
3.1.1 Case Study System Comparison
The original hospital suffered from a significant number of cancelations and emergency blockages eachmonth. The goal in implementing an improved inpatient scheduling and control system is to stabilize
2394

Helm, Lapp, and See
the hospital occupancy and enable the hospital to function at the same utilization or better with fewercancelations and blockages. In particular, the goal is to reduce average cancelations and blockageseach to fewer than 2 per month. To achieve this goal, different objective function cost parameter setswere tested. Eventually, the parameter set P = {h = 1.5,c = 34,b = 45}, was found to achieve thestated goal. The results of the genetic algorithm under the cost parameters P are presented in this section.
1 2 3 4 5 6 70
0.05
0.1
0.15
0.2
0.25
0.3
0.35
0.4
0.45
Day of Week
Avg
. Can
cela
tion
and
Blo
ckag
es
Current System
Constrained Optimization Mgmt. Canceled Blocked Avg.System per mo. per mo. Util.Current 7.6 8.1 80%GA Solution 1.5 1.9 80%
Figure 5: Current system vs. genetic algorithm solution (h = 1.5, c = 34, b = 45).
Figure 5 presents a comparison of the simulation results of the current system versus the optimizedsystem. While the cancelations and blockages in the current system spike in the middle of the week(a common occurrence in most hospitals due to uneven scheduling practices), this peak is greatlyreduced in the optimized system due to a smoothing of the census across the week. The currentsystem also experiences over 15 cancelations and blockages each month on average, compared withfewer than four per month on average in the optimized system. This is accomplished while stillmaintaining 80% average utilization (occupancy), which demonstrates the importance of using amanagement system – improved control systems enable a hospital to significantly improve one setof metrics without negatively impacting a competing metric. In §3.1.2 we will demonstrate how ouroptimization framework can be used to press the boundaries of competing metrics by generating aPareto efficiency curve.
3.1.2 Scheduling and Control Pareto Curves
When working with hospitals to design an effective management system it is important to providethe decision makers with as much relevant information as possible. Optimizing to a single objectivefunction as done in §3.1.1 can be informative, but it forces hospital management to identify variouscosts that cannot be precisely defined. Another approach would be to obtain quantifiable performancegoals from the hospital – such as the goal of fewer than two cancelations and two emergency blockagesper month with 80% occupancy level or better – and search for a parameter set that achieves these goals.Unfortunately, this process again becomes quite manual and the goals may not even be possible. Theapproach defined in this section mitigates these difficulties while providing the most information anddecision-making flexibility to hospital management by generating Pareto efficiency curves betweenkey system metrics.
By generating Pareto efficiency curves, hospital management can decide what level of service theyare willing to accept to achieve a given level of utilization (occupancy) – see Figure 6(a). Creating thiscurve avoids the difficulties and inaccuracies of estimating specific cost parameters. It also avoids theneed to manually search for cost parameters that reflect quantifiable hospital goals by presenting thehospital with possible options and their trade-offs, and allowing management to choose the preferredlevel for their hospital. Finally, it avoids the situation where management may request an infeasiblegoal – any point that lies outside the curve is infeasible and need not be considered.
Figure 6 represents the two key trade-offs that are considered in the scheduling and control systemanalyzed in this paper. A sample of parameter iterates for generating each curve is shown in Table 6.Figure 6(a) represents the trade-off between high utilization (average daily census/occupancy) andcongestion (cancelations and blockages). This curve was created by fixing the empty bed cost anditerating over congestion values, where congestion = cancelations + blockages. For each parameterset, the genetic algorithm is used to determine effective scheduling and control system parameters.Notice that the current system lies well within the Pareto efficiency curve, and thus can improve bothutilization and congestion simultaneously. This is typically the case in most hospitals that are runwithout a sophisticated management system.
2395

Helm, Lapp, and See
0 1 2 3 4 5110
120
130
140
150
160
Average Cancelations and Blockages per Day
Ave
rage
Dai
ly C
ensu
s
Current System
(a) Plot of utilization vs. congestion for GA solutions
0 0.05 0.1 0.15 0.2 0.25 0.3 0.350
0.02
0.04
0.06
0.08
0.1
0.12
Average Cancelations per Day
Ave
rage
Em
erge
ncy
Blo
ckag
es p
er D
ay
(b) Plot of cancelations vs. blockages at 80% occupancy
Figure 6: Pareto efficiency curves based on GA solutions – obtained by varying cost parameters.
Table 6: Sample of parameter sets used to generate Pareto efficiency curves
Congestion vs. Utilization Cancelation vs. Blockage (∼ 80% Util.)Cost Run 1 Run 2 Run 3 Run 4 . . . Run 1 Run 2 Run 3 Run 4 . . .
Empty Bed (h) 1 1 1 1 . . . 1.4 1.6875 1.875 2.0625 . . .Cancelation (c) 0.5 5 10 15 . . . 30 30 30 30 . . .Turnaway (b) 0.5 5 10 15 . . . 30 37.5 45 52.5 . . .
Figure 6(b) represents the trade-off between cancelations and emergency patient blockages at autilization of around 80%, and is generated by maintaining a fixed ratio of congestion cost to utilizationcost and varying the ratio of cancelation cost versus the emergency blockage cost. By maintaining alarger safety stock of empty beds through a higher cancelation level, one can reduce the amount ofemergency patient blockage. For hospital management to understand the trade-offs and identify theappropriate “safety stock” of empty beds for their hospital, the trade-off curve between cancelationsand blockages can be generated for a given level of utilization. In this case, the current system lies sofar inside the Pareto curve that it cannot be shown on the graph, signifying an opportunity to improveboth cancelations and blockages simultaneously.
By generating these trade-off curves sequentially it is possible to more precisely define the kind ofhospital management would like to run. First, one can generate the Pareto curve between utilizationand congestion. Once a utilization and congestion level is chosen, it is possible to generate the secondefficiency curve between cancelations and blockages at approximately the chosen level of utilizationto determine the desired safety stock of empty beds. The average utilization outcome is approximatebecause one does not choose the utilization level; however one can fix the cost ratios that generatedthe chosen utilization in the first step to achieve a level close to the desired utilization.
4 DISCUSSION
In this paper, we present a framework that can successfully be used to generate improved schedulingand control policies for hospital systems. Due to the inherent complexity in the overall hospitaladmissions and scheduling process, simulation is used to determine the effects of such schedulingpolicies. In combination with a genetic algorithm, we are able to illustrate significant improvementsin terms of reduced cancelations and blockages while maintaining high bed utilization for a partnerhospital. It should be noted that our simulation models the steady state behavior of a hospital under“normal” operation. In reality, the hospital will deviate from this steady state over the course of theyear, however these deviations often occur around holidays and thus are predictable. A completemanagement system should include a plan for transitioning into and out of holiday periods. This canbe done with modifications to our steady state simulation and represents an important area for futurework. Additionally, underlying changes in the hospital system dynamics can be tracked via controlchart and major changes can be addressed by resimulating to identify the new control parameters.
This optimization framework also facilitates the generation of Pareto efficiency curves as a means ofpresenting the trade-offs between critical metrics to hospital management. Each point on the efficiencycurve represents a different instance of the management system, so hospital administrators can choosethe points on the efficiency curves that meet their management objectives. This data point can then be
2396

Helm, Lapp, and See
translated directly into control system parameters. This represents a significant improvement in thesystem design process, allowing hospital management more flexibility to make the right decision fortheir hospital. This is made possible because the genetic algorithm is able to automate the generationof efficient management systems, eliminating the need to “optimize” manually.
While genetic algorithms are useful in finding good solutions, they are not guaranteed to returnthe optimal solution. Due to recent advances in simulation-based optimization approaches, findingthe optimal solution even for very large state-space problems has become manageable. One possibleextension of our work is to replace the genetic algorithm with an approach such as simulation-basedapproximate dynamic programming (Si, Barto, Powell, and Wunsch 2004). This strategy has thepotential to produce a better solution in less time and could be compared with the genetic algorithmapproach presented here.
ACKNOWLEDGMENTS
The authors gratefully appreciate the assistance of the hospital that provided us with the input data.The first author acknowledges the support of the NSF GRFP. The third author gratefully acknowledgesthe support of NSF-IGERT Grant No. 0654014.
REFERENCES
Bell, C., and D. Redelmeier. 2001. Mortality among patients admitted to hospitals on weekends ascompared with weekdays. New England Journal of Medicine 345 (9): 663–668.
Chow, V., D. Atkins, W. Huang, M. Puterman, and N. Salehirad. 2008. Reducing surgical wardcongestion at the vancouver island health authority through improved surgical scheduling. Technicalreport, Centre for Operations Excellence - The University of British Columbia.
Davis, L. D., and M. Mitchell. 1991. Handbook of genetic algorithms. Van Nostrand Reinhold.Draeger, M. 1992. An emergency department simulation model used to evaluate alternative nurse
staffing and patient population scenarios. In Proc. of the 1992 Winter Simulation Conference, ed.J. Swain, D. Goldsman, R. Crain, and J. Wilson, 1592–1600. Piscataway, New Jersey: Instituteof Electrical and Electronics Engineers, Inc.
Gallivan, S., and M. Utley. 2005. Modelling admissions booking of elective in-patients into a treatmentcentre. IMA Journal of Management Mathematics 16 (3): 305–315.
Gupta, D. 2007. Surgical suites operations management. Production and Operations Management 16(6): 689–700.
Hancock, W., and P. Walter. 1979. The use of computer simulation to develop hospital systems.SIGSIM Simulation Digest 10 (4): 28–32.
Hancock, W., and P. Walter. 1983. The ASCS: Inpatient Admission Scheduling and Control System.Technical report, Ann Arbor, MI: AUPHA Press.
Harper, P. 2002. A framework for operational modelling of hospital resources. Health Care ManagementScience 5 (3): 165–173.
Harrison, G., A. Shafer, and M. Mackay. 2005. Modelling variability in hospital bed occupancy.Health Care Management Science 8 (4): 325–334.
Isken, M., T. Ward, and S. Littig. 2010. An open source project for obstetrical procedure schedulingand occupancy analysis. Under Review.
Keehan, S., A. Sisko, and C. Truffer. 2007. Expenses for hospital inpatient stays: 2004. Technicalreport, Agency for Healthcare Research and Quality. Statistical Brief.
Lowery, J. 1996. Design of hospital admissions scheduling system using simulation. In Proceedingsof the 1996 Winter Simulation Conference, ed. J. Charnes, D. Morrice, D. Brunner, and J. Swain,1199–1204. Piscataway, New Jersey: Institute of Electrical and Electronics Engineers, Inc.
Marshall, A., C. Vasilakis, and E. El-Darzi. 2005. Length of stay-based patient flow models: recentdevelopments and future directions. Health Care Management Science 8 (3): 213–220.
Pitt, M. 1997. A generalised simulation system to support strategic resource planning in healthcare.In Proceedings of the 1997 Winter Simulation Conference, ed. S. Andradottir, K. Healy, D. With-ers, and B. Nelson, 1155–1162. Piscataway, New Jersey: Institute of Electrical and ElectronicsEngineers, Inc.
Proudlove, N., K. Gordon, and R. Boaden. 2003. Can good bed management solve the overcrowdingin accident and emergency departments? British Medical Journal 20 (2): 149.
2397

Helm, Lapp, and See
Sargent, R. G. 2005. Verification and validation of simulation models. In Proceedings of the 2005Winter Simulation Conference, ed. M. Kuhl, N. Steiger, F. Armstrong, and J. Joines, 130–143.Piscataway, New Jersey: Institute of Electrical and Electronics Engineers, Inc.
See, B., S.-P. Liu, Y.-W. Lu, and Q. Pang. 2009. Staffing a pandemic urgent care facility during anoutbreak of pandemic influenza. In Proc. of the 2009 Winter Simulation Conference, ed. M. Rossetti,R. Hill, B. Johansson, A. Dunkin, and R. Ingalls, 1996–2007. Piscataway, New Jersey: Instituteof Electrical and Electronics Engineers, Inc.
Si, J., A. Barto, W. Powell, and D. Wunsch. 2004. Handbook of learning and approximate dynamicprogramming. Wiley-IEEE Press.
Sprivulis, P., J. Da Silva, I. Jacobs, A. Frazer, and G. Jelinek. 2006. The association between hos-pital overcrowding and mortality among patients admitted via Western Australian emergencydepartments. Medical Journal of Australia 184:208–212.
AUTHOR BIOGRAPHIES
JONATHAN E. HELM is a Ph.D. candidate at the University of Michigan - Ann Arbor in the Indus-trial and Operations Engineering Department. His research interests lie in patient flow modeling andstochastic optimization as applied to health care delivery processes. He holds a Bachelors degree inMathematics and Computer Science from Cornell University, a Masters in Operations Research alsofrom Cornell and a Masters in Industrial and Operations Engineering from University of Michigan.His email is <[email protected]>.
MARCIAL LAPP is a graduate student in the Industrial and Operations Engineering Department atthe University of Michigan. His research interests lie in modeling and solving large-scale optimiza-tion problems in the transportation & logistics and health-care industries. He holds a Masters and aBachelors degree in Computer Science, as well as a Masters of Science Engineering in Industrial andOperations Engineering from the University of Michigan. His email is <[email protected]>.
BRENDAN D. SEE is a Ph.D. student at the University of Michigan - Ann Arbor in the Industrialand Operations Engineering Department. He earned a B.S. in Applied Physics and a B.A. in PoliticalScience from the State University of New York (SUNY) at Geneseo and a M.S.E. in Industrialand Operations Engineering from the University of Michigan. His primary research interests lie inprocurement, supply chain management, and health care operations management. He can be reachedat <[email protected]>.
2398