Characterization ofCharacterization of Ultralarge Polymers ... · ss (g/mol) 1000.0 1.0x10⁴ 1.0x10⁵...
20
Characterization of Ultralarge Polymers by Gel Characterization of Ultralarge Polymers by Gel Permeation Chromatography: Challenges and Limitations David M. Meunier and Yongfu Li Dow Chemical Company Core Research and Development Analytical Sciences
Transcript of Characterization ofCharacterization of Ultralarge Polymers ... · ss (g/mol) 1000.0 1.0x10⁴ 1.0x10⁵...

Characterization of Ultralarge Polymers by GelCharacterization of Ultralarge Polymers by Gel Permeation Chromatography: Challenges and Limitations
David M. Meunier and Yongfu LiDow Chemical CompanyCore Research and DevelopmentAnalytical Sciences
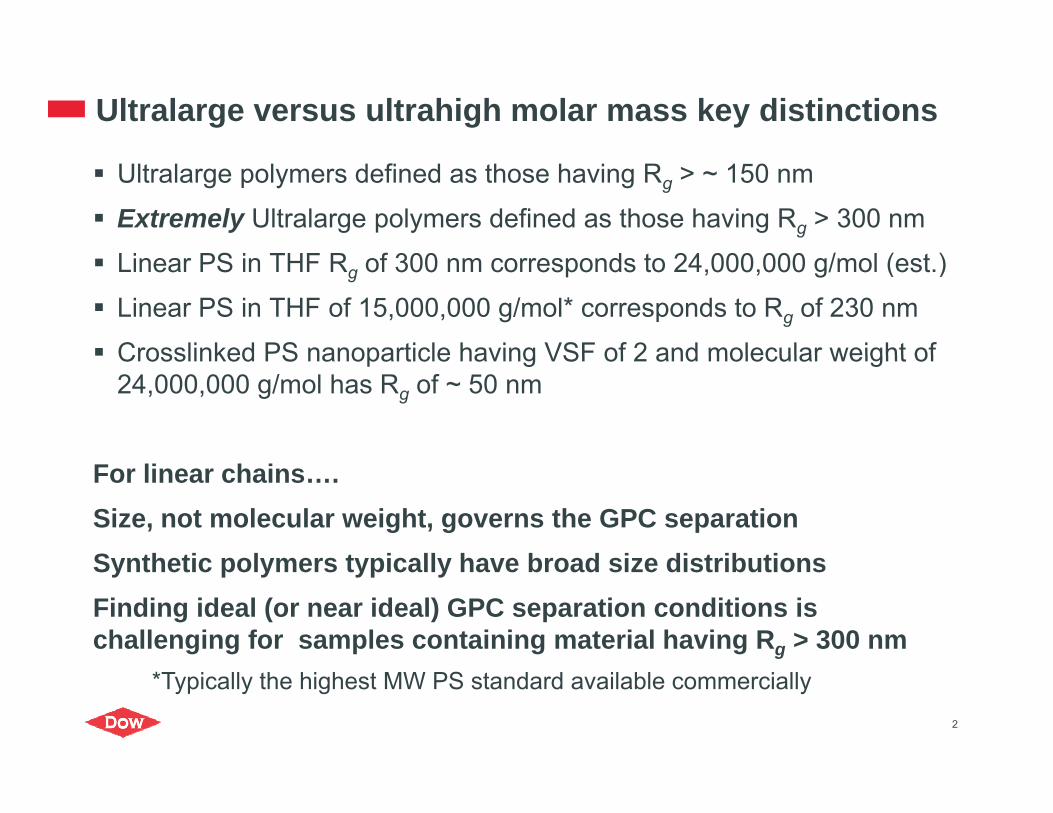
Ultralarge versus ultrahigh molar mass key distinctions
Ultralarge polymers defined as those having Rg > ~ 150 nm
Extremely Ultralarge polymers defined as those having Rg > 300 nm
S f 300 2 000 000 / ( ) Linear PS in THF Rg of 300 nm corresponds to 24,000,000 g/mol (est.)
Linear PS in THF of 15,000,000 g/mol* corresponds to Rg of 230 nm
Crosslinked PS nanoparticle having VSF of 2 and molecular weight of Crosslinked PS nanoparticle having VSF of 2 and molecular weight of 24,000,000 g/mol has Rg of ~ 50 nm
For linear chains….Size, not molecular weight, governs the GPC separationSynthetic polymers typically have broad size distributionsSynthetic polymers typically have broad size distributionsFinding ideal (or near ideal) GPC separation conditions is challenging for samples containing material having Rg > 300 nm
2
*Typically the highest MW PS standard available commercially
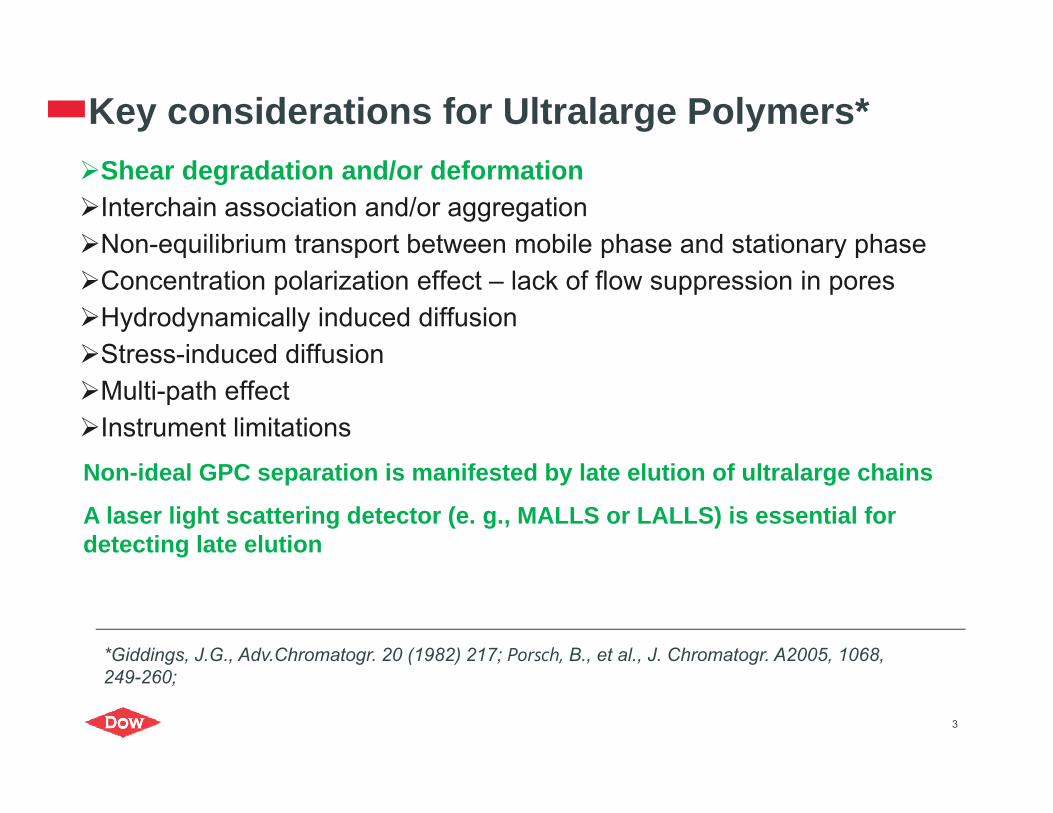
Key considerations for Ultralarge Polymers*Shear degradation and/or deformationInterchain association and/or aggregationNon-equilibrium transport between mobile phase and stationary phaseo equ b u t a spo t bet ee ob e p ase a d stat o a y p aseConcentration polarization effect – lack of flow suppression in poresHydrodynamically induced diffusionStress-induced diffusionStress-induced diffusionMulti-path effectInstrument limitationsNon-ideal GPC separation is manifested by late elution of ultralarge chains
A laser light scattering detector (e. g., MALLS or LALLS) is essential for detecting late elution
*Giddings, J.G., Adv.Chromatogr. 20 (1982) 217; Porsch, B., et al., J. Chromatogr. A2005, 1068,
3
g , , g ( ) ; , , , g , ,249-260;

Evaluation of GPC conditions with LS and narrow stds
Compare log M versus elution volume from light scattering (continuous points) to log M
l ti l fversus elution volume for narrow standards (discrete data points)Ideal or near ideal GPC elution
log M vs. elution volume plots arelog M vs. elution volume plots are superimposable
Ultralarge polymer sampleLate elution is clearly evident
4
Experimental
Sample preparation• Solutions were prepared in mobile phase solvent (0.05 wt% NaN3), and were
filtered through a 0.45-μm nylon syringe filter prior to injection. Sample concentration was about 0 25C* to ensure that polymer chain entanglementsconcentration was about 0.25C to ensure that polymer chain entanglements were minimized.
Instruments• Waters 2690 set at the optimum flow rate (0.2 – 1.0 ml/minute)p ( )• Wyatt DAWN DSP MALLS + Wyatt Optilab rEX DRI detectors both operating
at a wavelength of 632.8 nm at room temperature, or a Viscotek (Malvern) TDA 301 with LALLS and DRI detection.
Column set• 2 Tosoh TSK-Gel GMPW. 7.5 mm i.d. x 300 mm, 17 µm particles at 25 °C
.
5

Defining a “standard” when none exist (1 of 2)MW
(kg/mol)Rg/nm
MC 15 47.5 20.3
MC 400 146 36 5Blue traceRed traceMC 400 146 36.5
MC 4000 277 52.3
Red traceGreen trace
Retention Volume/ml
6
Log MW versus elution volume plots are completely superimposable
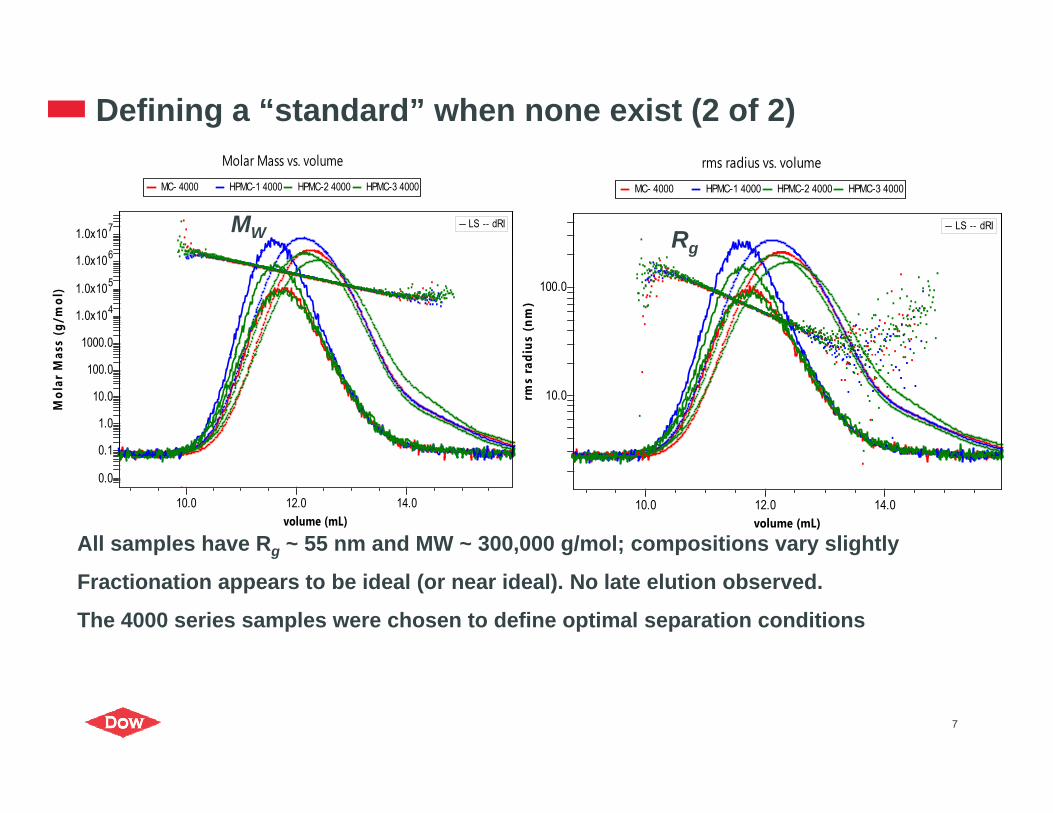
Defining a “standard” when none exist (2 of 2)rms radius vs. volume
MC- 4000 HPMC-1 4000 HPMC-2 4000 HPMC-3 4000
LS dRI
Molar Mass vs. volume
MC- 4000 HPMC-1 4000 HPMC-2 4000 HPMC-3 4000
6
71.0x10LS dRIMW Rg
dius
(nm
)
100.0
ass
(g/m
ol)
1000.0
41.0x10
51.0x10
61.0x10g
rms
rad
10.0
Mol
ar M
a
0.1
1.0
10.0
100.0
All samples have Rg ~ 55 nm and MW ~ 300,000 g/mol; compositions vary slightlyvolume (mL)
10.0 12.0 14.0volume (mL)
10.0 12.0 14.0
0.0
Fractionation appears to be ideal (or near ideal). No late elution observed.
The 4000 series samples were chosen to define optimal separation conditions
7
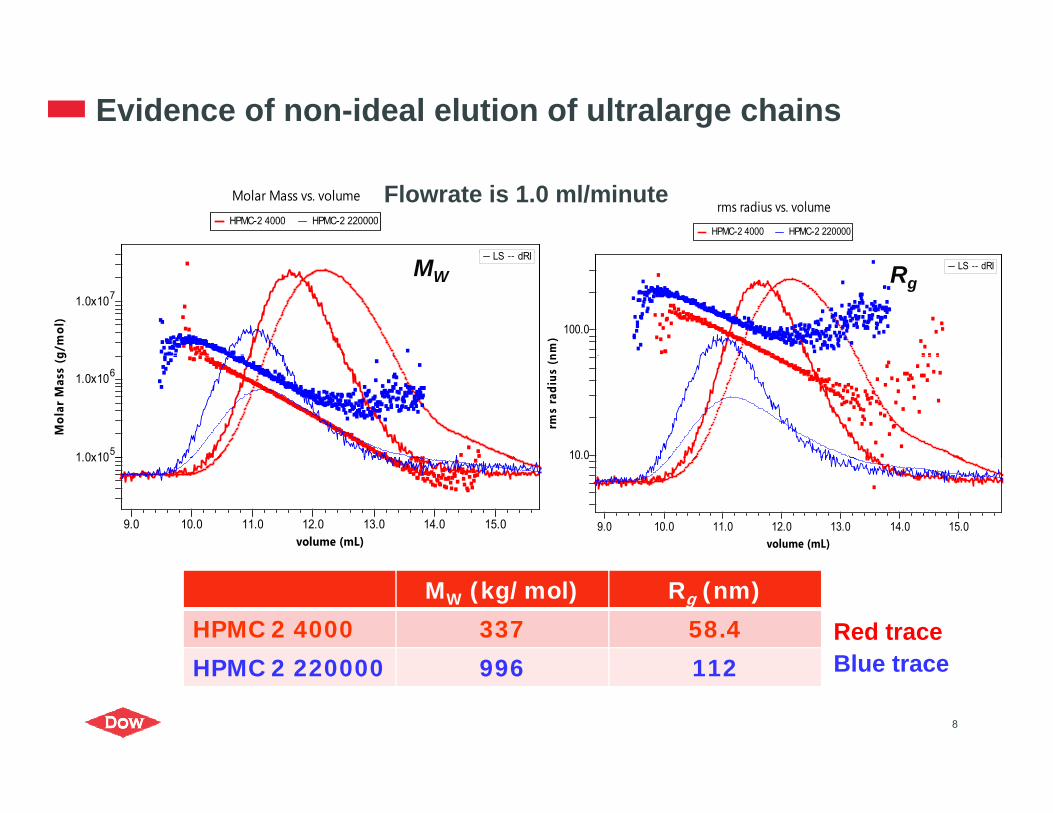
Evidence of non-ideal elution of ultralarge chains
Molar Mass vs. volume
HPMC-2 4000 HPMC-2 220000
LS dRI
rms radius vs. volume
HPMC-2 4000 HPMC-2 220000
Flowrate is 1.0 ml/minute
g/m
ol)
71.0x10
LS dRIMW
nm)
100.0
LS dRIRg
Mol
ar M
ass
(g
51 0x10
61.0x10
rms
radi
us (
n
10.0
volume (mL)9.0 10.0 11.0 12.0 13.0 14.0 15.0
1.0x10
volume (mL)9.0 10.0 11.0 12.0 13.0 14.0 15.0
10.0
MW (kg/mol) Rg (nm)
HPMC 2 4000 337 58.4
HPMC 2 220000 996 112Red traceBlue trace
8
HPMC 2 220000 996 112 Blue trace

Flow rate dependence of “standard” elution profilesMolar Mass vs. volume
MC- 4000 MC 4000 FR 0.5 MC 4000 FR0.2
91 0x10 LS dRI
mol
)
51 0 10
61.0x10
71.0x10
81.0x10
1.0x10
1.0 ml/min0.5 ml/min
Mol
ar M
ass
(g/m
100.0
1000.0
41.0x10
51.0x10 0.5 ml/min0.2 ml/min
M
0.0
0.1
1.0
10.0
volume (mL)9.0 10.0 11.0 12.0 13.0 14.0
log M versus elution profiles are superimposable at all flow ratesBaseline shifts S/N variation flow rate accuracy produce slight differences
9
Baseline shifts, S/N variation, flow rate accuracy produce slight differences in the chromatograms
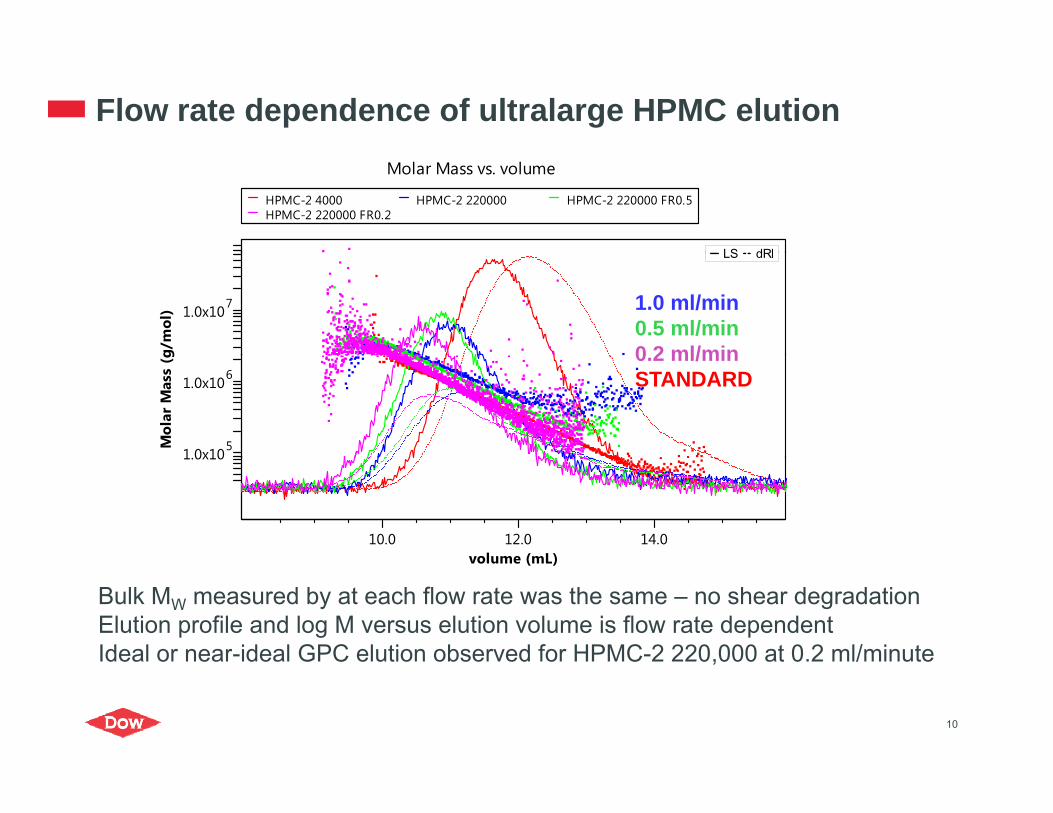
Flow rate dependence of ultralarge HPMC elutionMolar Mass vs. volume
HPMC-2 4000 HPMC-2 220000 HPMC-2 220000 FR0.5HPMC-2 220000 FR0.2
LS dRI
g/m
ol) 71.0x10
LS dRI
1.0 ml/min0.5 ml/min0 2 ml/min
Mol
ar M
ass
(g
51.0x10
61.0x10
0.2 ml/minSTANDARD
volume (mL)10.0 12.0 14.0
1.0x10
volume (mL)
Bulk MW measured by at each flow rate was the same – no shear degradationElution profile and log M versus elution volume is flow rate dependentIdeal or near-ideal GPC elution observed for HPMC-2 220,000 at 0.2 ml/minute
10
,
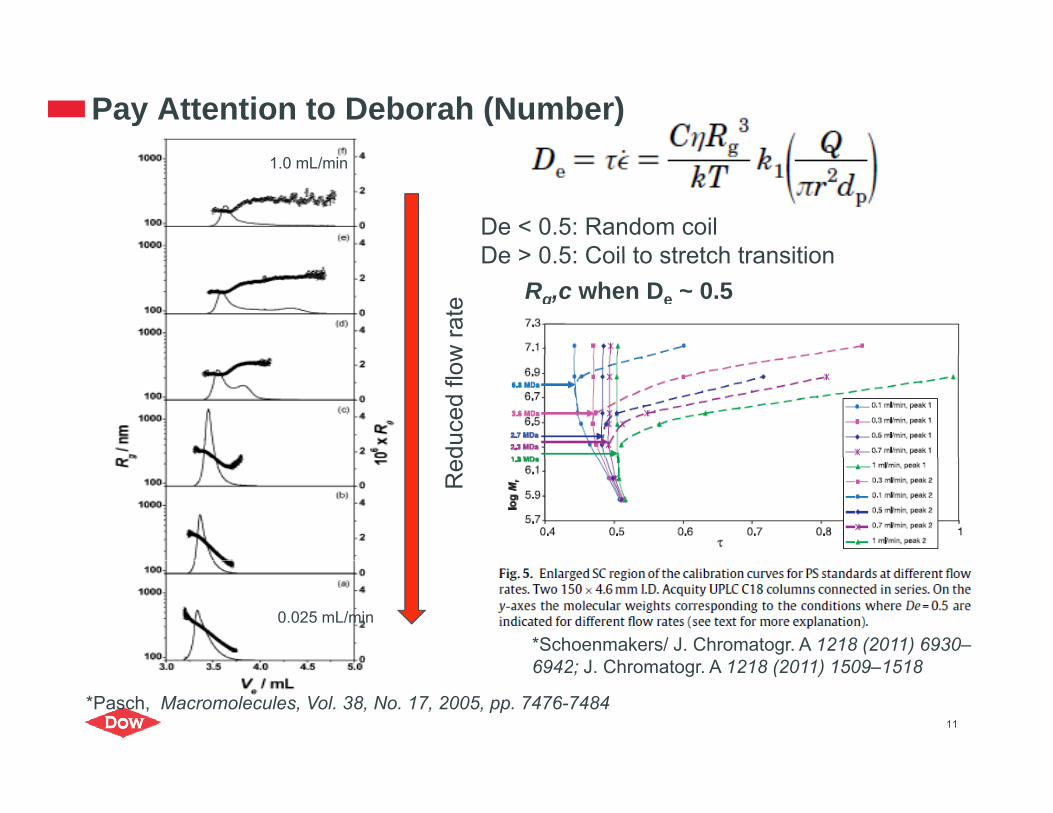
Pay Attention to Deborah (Number)1.0 mL/min
De < 0.5: Random coilDe > 0 5: Coil to stretch transition
w ra
te
Rg,c when De ~ 0.5De > 0.5: Coil to stretch transition
duce
d flo
wR
e
0.025 mL/min
*Schoenmakers/ J. Chromatogr. A 1218 (2011) 6930–6942 J Ch t A 1218 (2011) 1509 1518
*Pasch, Macromolecules, Vol. 38, No. 17, 2005, pp. 7476-748411
6942; J. Chromatogr. A 1218 (2011) 1509–1518

Pay Attention to Deborah (Number) and critical Rg
Rg,c is the radius of gyration where De = 0.5
Flow rate (mL/min) Rg,c (nm)
g gy ein GPC conditions used for cellulose ethers
( ) g, ( )
1.0 169
0.5 2130.5 213
0.2 290
12
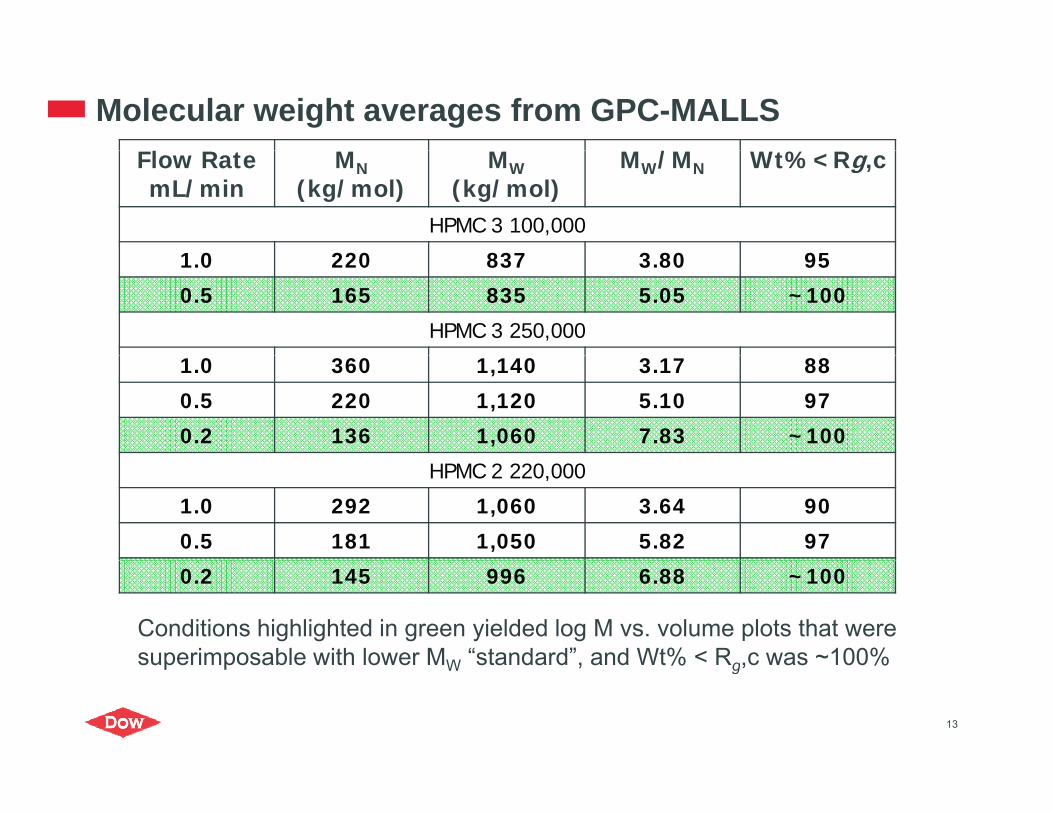
Molecular weight averages from GPC-MALLSl / %Flow RatemL/min
MN(kg/mol)
MW(kg/mol)
MW/MN Wt%<Rg,c
HPMC 3 100,000
1 0 220 837 3 80 951.0 220 837 3.80 95
0.5 165 835 5.05 ~100
HPMC 3 250,000
1.0 360 1,140 3.17 88
0.5 220 1,120 5.10 97
0.2 136 1,060 7.83 ~100
HPMC 2 220,000
1.0 292 1,060 3.64 90
0.5 181 1,050 5.82 97
0.2 145 996 6.88 ~100
Conditions highlighted in green yielded log M vs. volume plots that were superimposable with lower MW “standard”, and Wt% < Rg,c was ~100%
13
superimposable with lower MW standard , and Wt% Rg,c was 100%
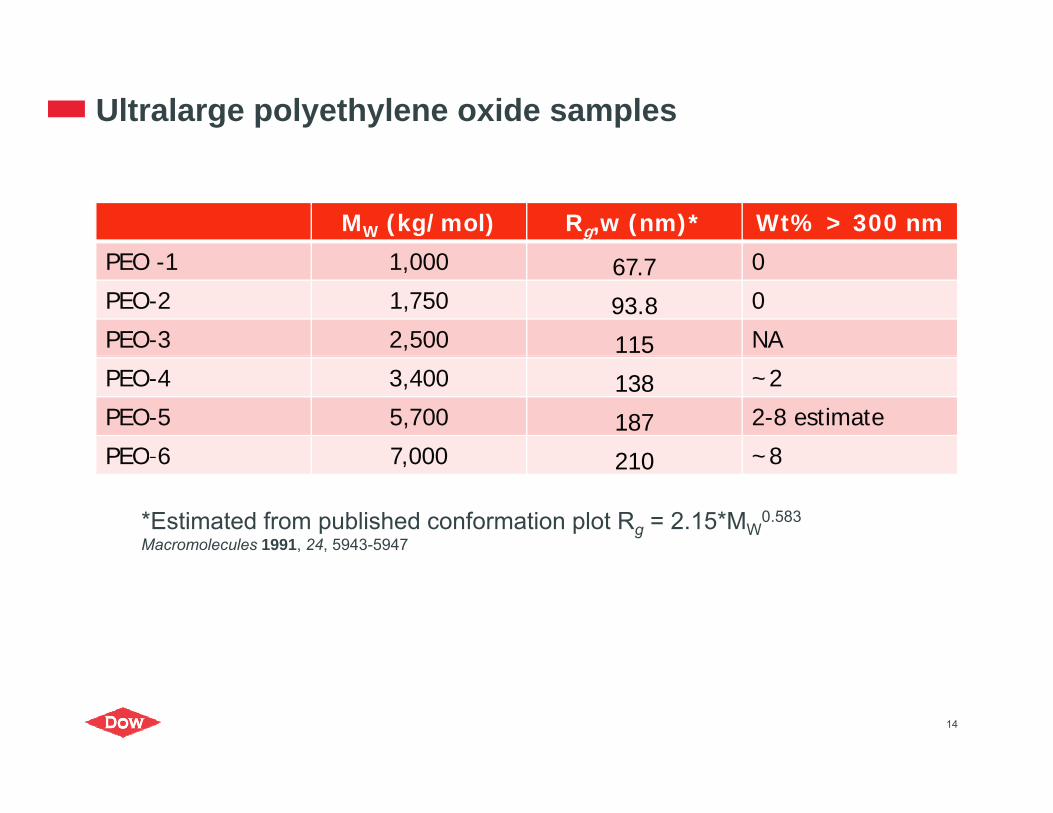
Ultralarge polyethylene oxide samples
MW (kg/mol) Rg,w (nm)* Wt% > 300 nm
PEO 1 1 000 0PEO -1 1,000 67.7 0
PEO-2 1,750 93.8 0
PEO-3 2,500 115 NA
PEO-4 3,400 138 ~2
PEO-5 5,700 187 2-8 estimate
PEO-6 7 000 210 ~8PEO 6 7,000 210 ~8
*Estimated from published conformation plot Rg = 2.15*MW0.583
Macromolecules 1991, 24, 5943-5947
14
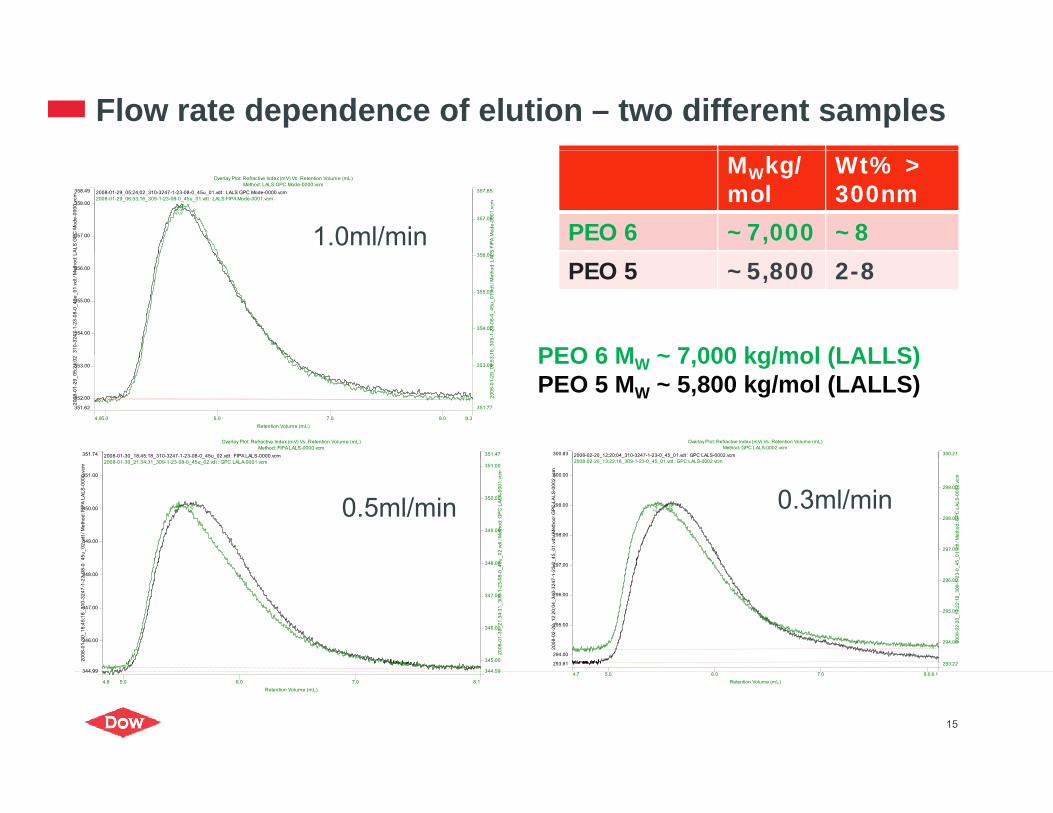
Flow rate dependence of elution – two different samples
358.49
357.00
358.00
ALS
GPC
Mod
e-00
00.v
cm
357.85
357.00
S FI
PA M
ode-
0001
.vcm
Overlay Plot: Refractive Index (mV) Vs. Retention Volume (mL)Method: LALS GPC Mode-0000.vcm
5.6
5 5
.69
2008-01-29_05;24;02_310-3247-1-23-08-0_45u_01.vdt : LALS GPC Mode-0000.vcm 2008-01-29_06;53;16_309-1-23-08-0_45u_01.vdt : LALS FIPA Mode-0001.vcm
1.0ml/min
MWkg/mol
Wt% > 300nm
PEO 6 ~7,000 ~8
354.00
355.00
356.00
_310
-324
7-1-
23-0
8-0_
45u_
01.v
dt /
Met
hod:
L
354.00
355.00
356.00
;16_
309-
1-23
-08-
0_45
u_01
.vdt
/ M
etho
d: L
AL
PEO 6 M ~ 7 000 kg/mol (LALLS)
PEO 5 ~5,800 2-8
300.83 300.21
Overlay Plot: Refractive Index (mV) Vs. Retention Volume (mL)Method: GPC LALS-0002.vcm
2008-02-20_12;20;04_310-3247-1-23-0_45_01.vdt : GPC LALS-0002.vcm351.74 351.47
Overlay Plot: Refractive Index (mV) Vs. Retention Volume (mL)Method: FIPA LALS-0000.vcm
2008-01-30 18;45;18 310-3247-1-23-08-0 45u 02.vdt : FIPA LALS-0000.vcm
351.62
352.00
353.00
2008
-01-
29_0
5;24
;02_
351.77
353.00
2008
-01-
29_0
6;53
;
4.9 8.3Retention Volume (mL)
5.0 6.0 7.0 8.0
PEO 6 MW ~ 7,000 kg/mol (LALLS)PEO 5 MW ~ 5,800 kg/mol (LALLS)
298.00
299.00
300.00
_45_
01.v
dt /
Met
hod:
GPC
LAL
S-0
002.
vcm
297.00
298.00
299.00
5_01
.vdt
/ M
etho
d: G
PC
LAL
S-00
02.v
cm
5.6
0
5.4
6
2008-02-20_13;22;18_309-1-23-0_45_01.vdt : GPC LALS-0002.vcm
349.00
350.00
351.00
_45u
_02.
vdt /
Met
hod:
FIP
A LA
LS-0
000.
vcm
349.00
350.00
351.00
u_02
.vdt
/ M
etho
d: G
PC L
ALA
-000
1.vc
m
5.6
0
5.4
8
_ ; ; _ _ _ 2008-01-30_21;34;31_309-1-23-08-0_45u_02.vdt : GPC LALA-0001.vcm
0.3ml/min0.5ml/min
293 61
294.00
295.00
296.00
297.00
2008
-02-
20_1
2;20
;04_
310-
3247
-1-2
3-0_
293 22
294.00
295.00
296.00
2008
-02-
20_1
3;22
;18_
309-
1-23
-0_4
5
346.00
347.00
348.00
2008
-01-
30_1
8;45
;18_
310-
3247
-1-2
3-08
-0_
345.00
346.00
347.00
348.00
2008
-01-
30_2
1;34
;31_
309-
1-23
-08-
0_45
u
15
293.61 293.22
4.7 8.1Retention Volume (mL)
5.0 6.0 7.0 8.0344.99 344.59
4.8 8.1Retention Volume (mL)
5.0 6.0 7.0
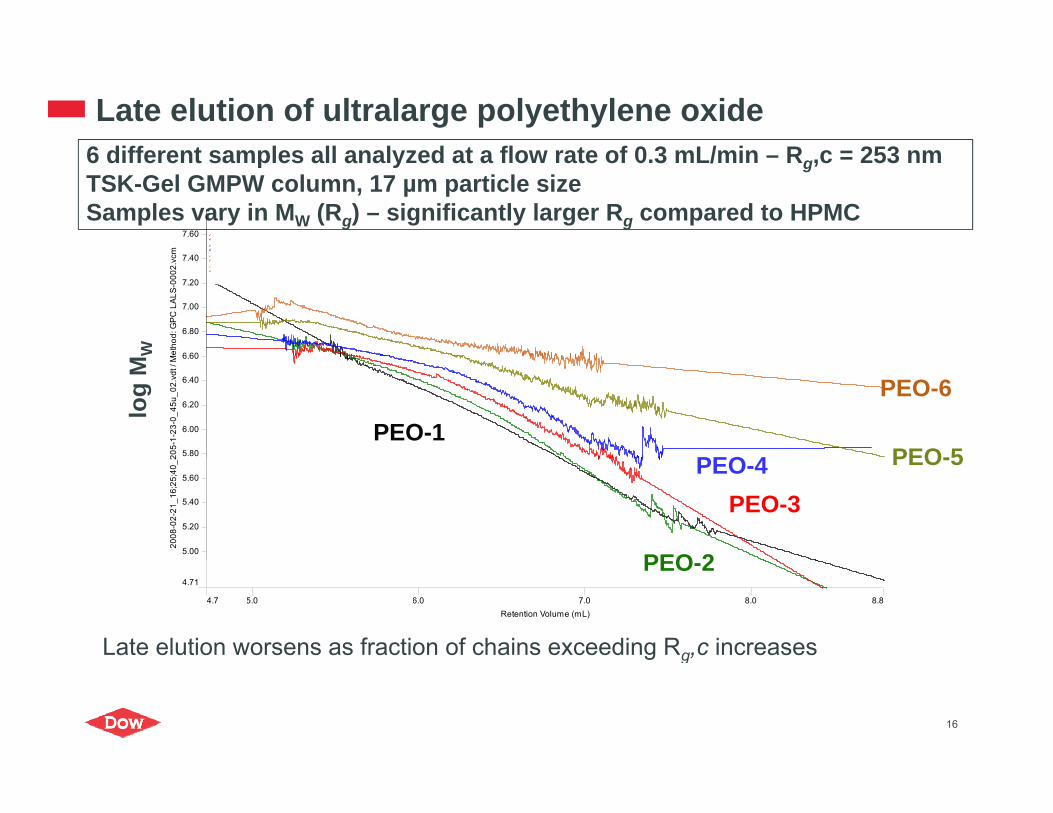
Late elution of ultralarge polyethylene oxide6 different samples all anal ed at a flo rate of 0 3 mL/min R c 253 nm
7.81
7.60
m
Overlay Plot: Log Molecular Weight Vs. Retention Volume (mL)Method: GPC LALS-0002.vcm
2008-02-21_16;25;40_205-1-23-0_45u_02.vdt : GPC LALS-0002.vcm 2008-02-21_17;38;57_2000k-1-23-0_45_01.vdt : GPC LALS-0002.vcm 2008-02-21_09;09;27_n-60knf-1-23-0_45u_01.vdt : GPC LALS-0002.vcm 2008-02-21_05;00;28_coag-1-23-0_45u_01.vdt : GPC LALS-0002.vcm
6 different samples all analyzed at a flow rate of 0.3 mL/min – Rg,c = 253 nmTSK-Gel GMPW column, 17 µm particle sizeSamples vary in MW (Rg) – significantly larger Rg compared to HPMC
6 60
6.80
7.00
7.20
7.40
etho
d: G
PC
LA
LS-0
002.
vcm
2008-02-20_12;20;04_310-3247-1-23-0_45_01.vdt : GPC LALS-0002.vcm 2008-02-20_13;22;18_309-1-23-0_45_01.vdt : GPC LALS-0002.vcm
W
5.80
6.00
6.20
6.40
6.60
205-
1-23
-0_4
5u_0
2.vd
t / M
log
MW
PEO-6
PEO-5PEO 4PEO-1
5.00
5.20
5.40
5.60
2008
-02-
21_1
6;25
;40_
2 PEO-5PEO-4PEO-3
PEO 24.71
4.7 8.8Retention Volume (mL)
5.0 6.0 7.0 8.0
Late elution worsens as fraction of chains exceeding Rg,c increases
PEO-2
16
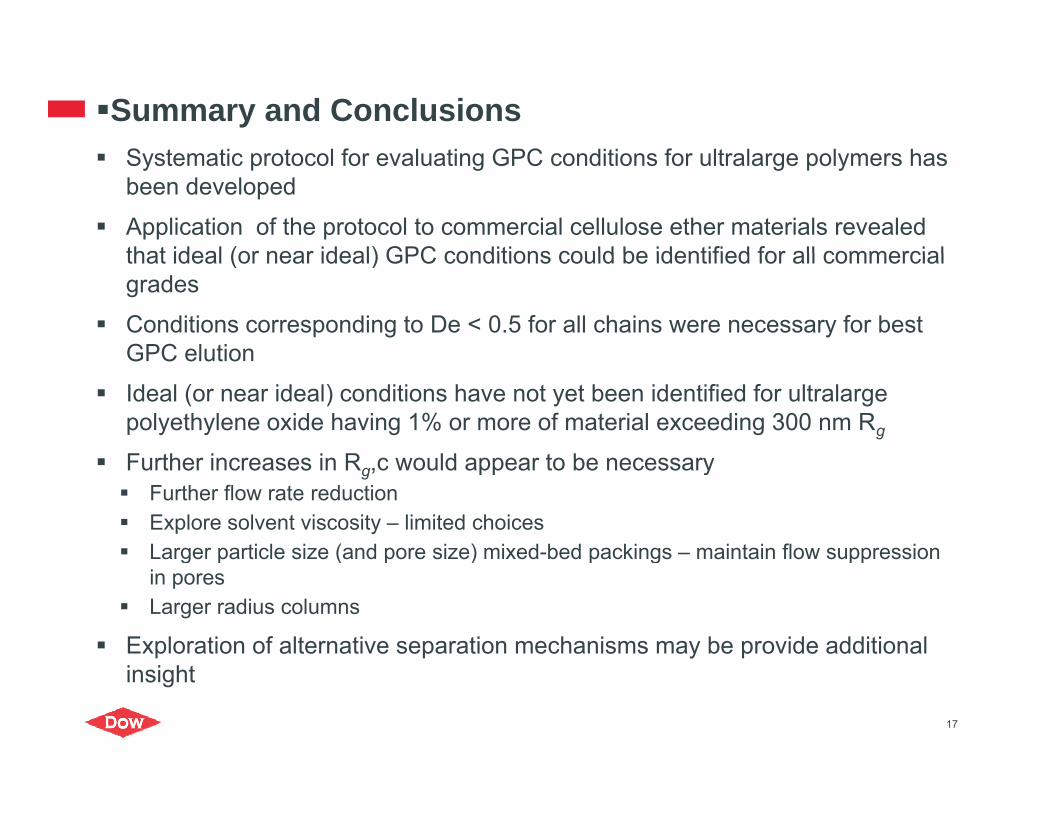
Summary and ConclusionsS t ti t l f l ti GPC diti f lt l l h Systematic protocol for evaluating GPC conditions for ultralarge polymers has been developed
Application of the protocol to commercial cellulose ether materials revealed that ideal (or near ideal) GPC conditions could be identified for all commercialthat ideal (or near ideal) GPC conditions could be identified for all commercial grades
Conditions corresponding to De < 0.5 for all chains were necessary for best GPC elutionGPC elution
Ideal (or near ideal) conditions have not yet been identified for ultralargepolyethylene oxide having 1% or more of material exceeding 300 nm Rg
Further increases in R c would appear to be necessary Further increases in Rg,c would appear to be necessary Further flow rate reduction Explore solvent viscosity – limited choices Larger particle size (and pore size) mixed-bed packings – maintain flow suppression g p ( p ) p g pp
in pores Larger radius columns
Exploration of alternative separation mechanisms may be provide additional insight
17

Acknowledgments
Joe Kiefer
Danielle Dodge
Hongwei Shen
18
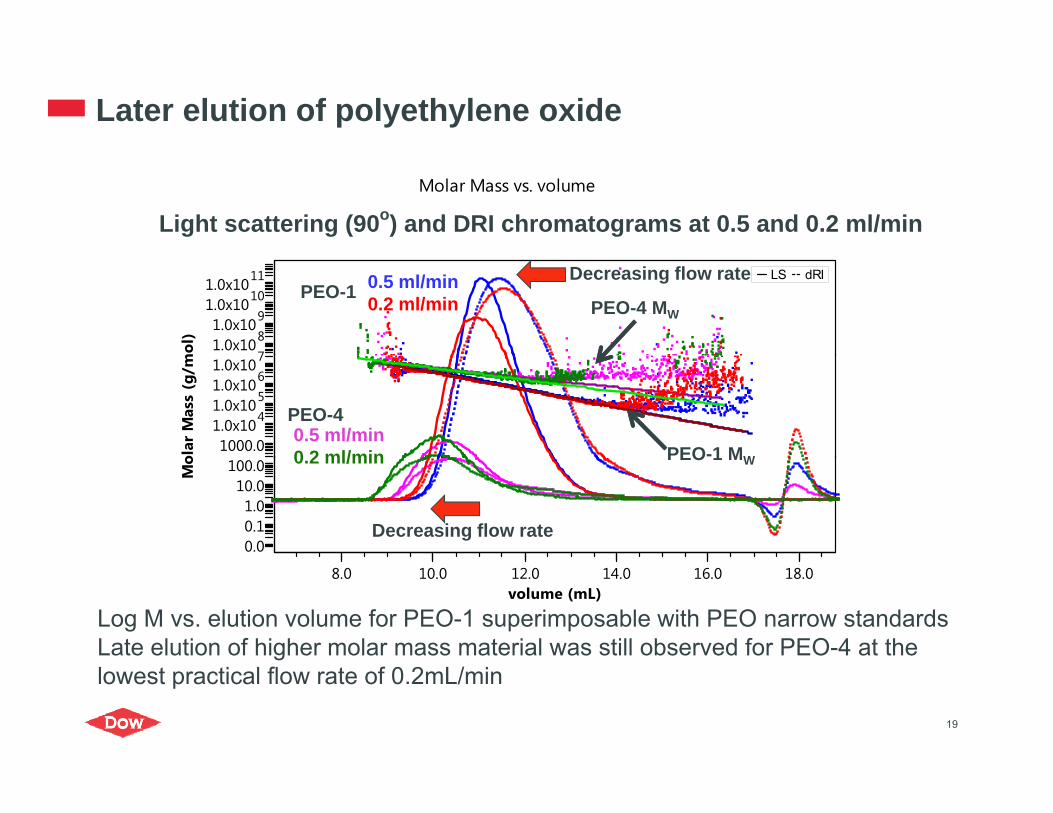
Later elution of polyethylene oxide
Molar Mass vs. volume
205 151966(001)[2014-11-26-1] 301 159844(001)[2014-11-26-1]205 151966(001)[2014-12-8] 301 159844(002)[2014-12-8]Light scattering (90o) and DRI chromatograms at 0.5 and 0.2 ml/min
mol
)
781.0x10
91.0x10
101.0x10
111.0x10LS dRI
PEO-1PEO-4 MW
Decreasing flow rate0.5 ml/min0.2 ml/min
olar
Mas
s (g
/m
1000.0
41.0x10
51.0x10
61.0x10
71.0x10
PEO-4
PEO-1 MW
0.5 ml/min0 2 ml/min
Mo
0.00.11.0
10.0100.0
PEO 1 MW
Decreasing flow rate
0.2 ml/min
volume (mL)8.0 10.0 12.0 14.0 16.0 18.0
Log M vs. elution volume for PEO-1 superimposable with PEO narrow standardsLate elution of higher molar mass material was still observed for PEO-4 at the
19
lowest practical flow rate of 0.2mL/min
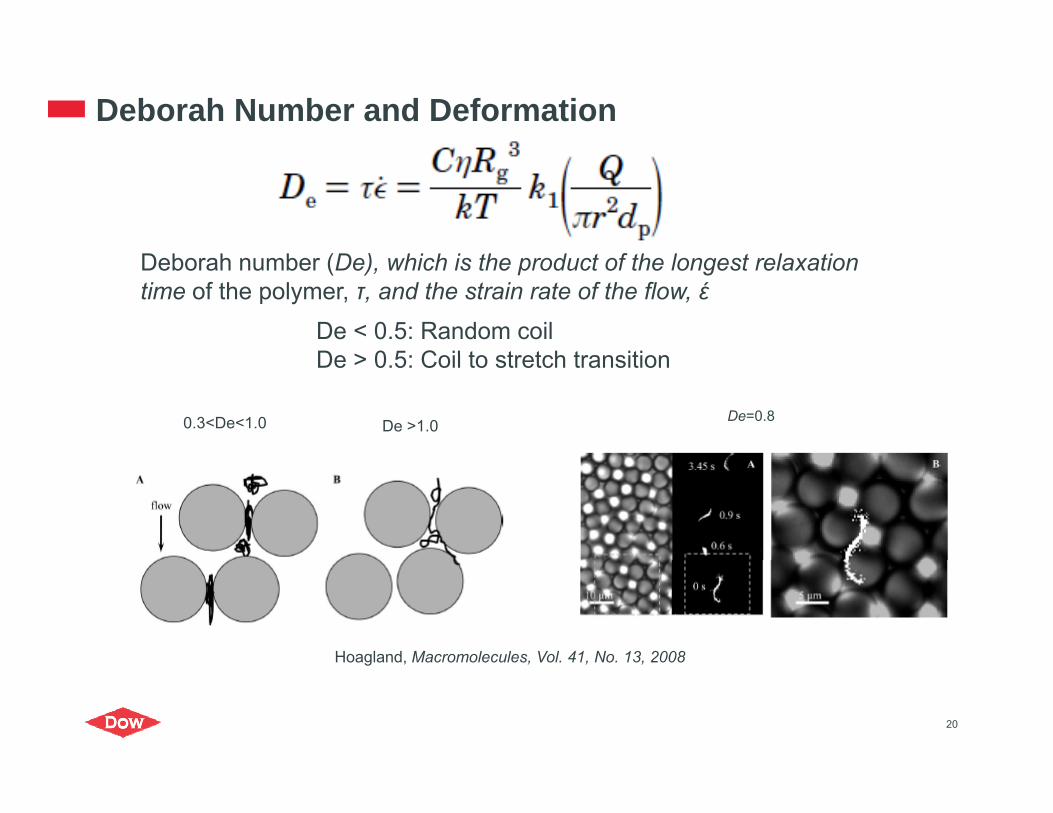
Deborah Number and Deformation
Deborah number (De), which is the product of the longest relaxation time of the polymer, τ, and the strain rate of the flow, έ
De < 0.5: Random coilDe > 0 5: Coil to stretch transition
De=0.80.3<De<1.0 De >1.0
De > 0.5: Coil to stretch transition
Hoagland, Macromolecules, Vol. 41, No. 13, 2008g , , , ,
20


![Seminar on Doing Business with European Countries ...€¦ · Top 10 EU countries which accounts for more than 90 percent of /v ] ... 0.0 500.0 1000.0 1500.0 2000.0 2500.0 3000.0](https://static.fdocuments.us/doc/165x107/5f2cf493ec574b0b042f7827/seminar-on-doing-business-with-european-countries-top-10-eu-countries-which.jpg)
![Linear Data Structures using Sequential organization...Arrays Initializing Arrays Ex-double balance[5] = {1000.0, 2.0, 3.4, 7.0, 50.0}; If you omit the size of the array, an array](https://static.fdocuments.us/doc/165x107/5f0cb2057e708231d436ada2/linear-data-structures-using-sequential-organization-arrays-initializing-arrays.jpg)