Characterization of Voltage Dips due to Faults and...
7
International Journal of Engineering Technology, Management and Applied Sciences www.ijetmas.com February 2016, Volume 4, Issue 2, ISSN 2349-4476 121 Miss.Priyanka N.Kohad , Mr..S.B.Shrote Characterization of Voltage Dips due to Faults and Induction Motor Starting Miss. Priyanka N.Kohad 1 , Mr..S.B.Shrote 2 Department of Electrical Engineering & E &TC Pune, Maharashtra India Abstract: This paper focuses on events that cause a temporary decrease in the fundamental frequency voltage magnitude. It is very important to improve the power quality levels.The main cause of voltage dips due to faults and induction motor starting based on characterization is discussed From these discussion. the modified IEEE distribution system is designed & simulated in PSCAD which can be used to locate the faults. Finally at the time experimentation the data obtained from PSCAD is given to MATLAB program, in MATLAB program feature extraction is carried out using wavelet transform. From magnitude of coefficient various statistical parameter are calculated and used as an input to ANN for characterization of voltage dips due to faults and induction motor starting Keywords: Power quality,Voltage dips, power system faults, induction motor, wavelet transform, ANNs I. INTRODUCTION An electrical power system is expected to deliver undistorted sinusoidal rated voltage continuously at rated frequency to the end users. A PQ problem can be defined as “any problem manifested in voltage, current, or frequency deviations that results in failure or mal-operation of utility or end user equipment.”. Over the last ten years, voltage dips have become one of the main topics concerning power quality among utilities, customers and equipment manufacturers. Voltage Dip is a power quality problem that is prevalent in any power system. It is said to be one of the main problems of power quality. Voltage dips have attracted a lot of attention due to the problems that cause to equipment like adjustable speed drives, computers, industrial control systems etc. The main causes of voltage dip are due to faults and large rating induction motor starting. Since most of the electrica energy conversion to mechanical energy is done by the induction motor. Modern power electronic equipment is sensitive to voltage variation and it is also the source of disturbances for other customers. This increased sensitivity of the equipments to voltage dips has highlighted the importance of quality of power, the electric utilities and customers have become much more concerned about the quality of electric power service. Voltage sags are referred to as voltage dips in Europe. IEEE defines voltage sags as a reduction in voltage for a short time. The duration of voltage sag is less than 1 minute but more than 10 milliseconds (0.5 cycles). The magnitude of the reduction is between 10 percent and 90 percent of the normal root mean square (rms) voltage at 50 Hz [11]. The major causes of voltage sags in electrical networks are: Voltage dips due to Faults Voltage dips due to Motor Starting Voltage Dips due to Transformer energization Extreme loading on a working induction motor can also cause a voltage dip in the network . To achieve the goal, the results obtained from practical experiments in some special cases of voltage dip were studied. Therefore, the presented results may not be regarded as general. In this paper the simulation approach has been chosen to assess the effects of voltage dip on the performance of induction motor. Therefore, as there are no restrictions in simulating under different conditions, obtaining more complete and comprehensive results is possible. For this purpose the simulations has been done by means of PSCAD software and MATLAB to ensure the accuracy and precision of simulation in presence of voltage dips, the simulation results are compared with the experimental results which are taken fro the experimental work. Then,the effects of the degree
Transcript of Characterization of Voltage Dips due to Faults and...
International Journal of Engineering Technology, Management and Applied Sciences
www.ijetmas.com February 2016, Volume 4, Issue 2, ISSN 2349-4476
121 Miss.Priyanka N.Kohad , Mr..S.B.Shrote
Characterization of Voltage Dips due to Faults and Induction
Motor Starting
Miss. Priyanka N.Kohad1 , Mr..S.B.Shrote2
Department of Electrical Engineering & E &TC Pune, Maharashtra India
Abstract: This paper focuses on events that cause a temporary decrease in the fundamental frequency voltage
magnitude. It is very important to improve the power quality levels.The main cause of voltage dips due to faults and
induction motor starting based on characterization is discussed From these discussion. the modified IEEE
distribution system is designed & simulated in PSCAD which can be used to locate the faults. Finally at the time
experimentation the data obtained from PSCAD is given to MATLAB program, in MATLAB program feature
extraction is carried out using wavelet transform. From magnitude of coefficient various statistical parameter are
calculated and used as an input to ANN for characterization of voltage dips due to faults and induction motor
starting
Keywords: Power quality,Voltage dips, power system faults, induction motor, wavelet transform, ANNs
I. INTRODUCTION
An electrical power system is expected to deliver undistorted sinusoidal rated voltage continuously at rated
frequency to the end users. A PQ problem can be defined as “any problem manifested in voltage, current,
or frequency deviations that results in failure or mal-operation of utility or end user equipment.”. Over the
last ten years, voltage dips have become one of the main topics concerning power quality among utilities,
customers and equipment manufacturers. Voltage Dip is a power quality problem that is prevalent in any
power system. It is said to be one of the main problems of power quality. Voltage dips have attracted a lot
of attention due to the problems that cause to equipment like adjustable speed drives, computers, industrial
control systems etc. The main causes of voltage dip are due to faults and large rating induction motor
starting. Since most of the electrica energy conversion to mechanical energy is done by the induction
motor. Modern power electronic equipment is sensitive to voltage variation and it is also the source of
disturbances for other customers. This increased sensitivity of the equipments to voltage dips has
highlighted the importance of quality of power, the electric utilities and customers have become much
more concerned about the quality of electric power service.
Voltage sags are referred to as voltage dips in Europe. IEEE defines voltage sags as a reduction in voltage
for a short time. The duration of voltage sag is less than 1 minute but more than 10 milliseconds (0.5
cycles). The magnitude of the reduction is between 10 percent and 90 percent of the normal root mean
square (rms) voltage at 50 Hz [11].
The major causes of voltage sags in electrical networks are:
Voltage dips due to Faults
Voltage dips due to Motor Starting
Voltage Dips due to Transformer energization
Extreme loading on a working induction motor can also cause a voltage dip in the network . To achieve the
goal, the results obtained from practical experiments in some special cases of voltage dip were studied.
Therefore, the presented results may not be regarded as general.
In this paper the simulation approach has been chosen to assess the effects of voltage dip on the
performance of induction motor. Therefore, as there are no restrictions in simulating under different
conditions, obtaining more complete and comprehensive results is possible.
For this purpose the simulations has been done by means of PSCAD software and MATLAB to ensure the
accuracy and precision of simulation in presence of voltage dips, the simulation results are compared
with the experimental results which are taken fro the experimental work. Then,the effects of the degree
International Journal of Engineering Technology, Management and Applied Sciences
www.ijetmas.com February 2016, Volume 4, Issue 2, ISSN 2349-4476
122 Miss.Priyanka N.Kohad , Mr..S.B.Shrote
of voltage dips and their start time on the motor performance are investigated. II. The modified IEEE
distribution test feeder system
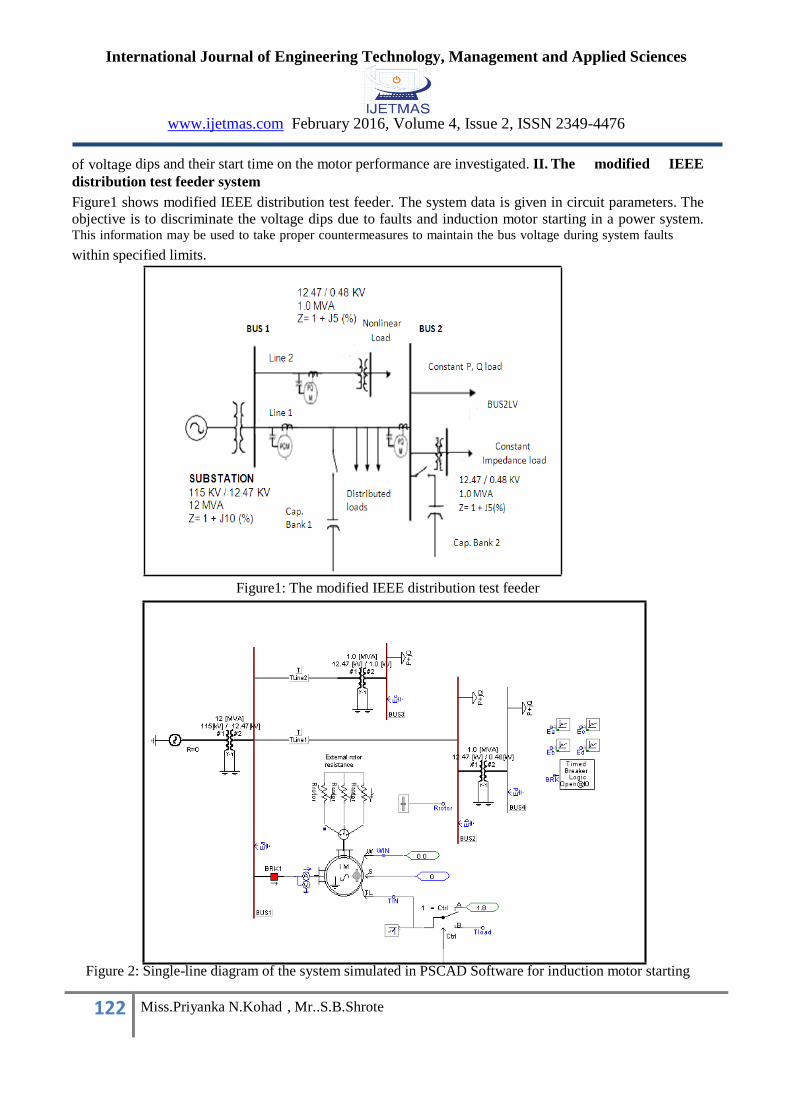
Figure1 shows modified IEEE distribution test feeder. The system data is given in circuit parameters. The
objective is to discriminate the voltage dips due to faults and induction motor starting in a power system. This information may be used to take proper countermeasures to maintain the bus voltage during system faults
within specified limits.
Figure1: The modified IEEE distribution test feeder
Figure 2: Single-line diagram of the system simulated in PSCAD Software for induction motor starting
International Journal of Engineering Technology, Management and Applied Sciences
www.ijetmas.com February 2016, Volume 4, Issue 2, ISSN 2349-4476
123 Miss.Priyanka N.Kohad , Mr..S.B.Shrote
The voltage dip due to induction motor starting can be obtained by using time breaker logic.The
signals obtained from PSCAD are further analyzed using wavelet transform. The wavelet transform
decomposed the signal up to six decomposition levels by using Daubachies Db4 wavelet. The decomposition
gives approximations and detailed coefficients. The detailed coefficients at level 4 obtained from DWT are
further subjected to various statistical parameters for increasing the detection accuracy.Then these extracted
features are provided as an input to ANN for classification of voltage dips due to faults and induction motor
starting.
III. Method of Evaluation
Algorithm to classify the voltage dips due to faults and induction motor starting (simulation)
The modified IEEE distribution test feeder system is simulated in PSCAD.
The voltage dips is observed in the system voltage due to the creation of different faults like LG,
LL, LLG, LLL and LLLG. The faults are created in the circuit by using timed fault logic for
specifying the instant of fault and the duration. The voltage dip due to induction motor starting can be
obtained by using time breaker logic.
The Voltage waveform on four buses are plotted. But the study has been conducted on bus no.1.
The signals obtained from PSCAD are further analyzed using wavelet transform.
Discrete wavelet transform is calculating using Db4 wavelet up to sixth level.
Then various statistical parameters such as maximum value, standard deviation, variance,
skewness, kurtosis and energy are calculated of detailed coefficient at level 4 for increasing detection
accuracy.
The six different statistical parameters are given as input to the neural network. By using
Generalized feed forward neural network (GFNN) for six parameters gives 100% results in
simulation analysis i.e. 100% classification of voltage dips due to faults and induction motor starting
is done.
Algorithm to classify the voltage dips due to faults and induction motor starting (Experimental)
The experimental setup is arranged for classifying the voltage dips due to faults and induction
motor starting.
In an experimental analysis, the voltage dips are observed in the system voltage due to the
different faults like LG, LL, LLG, LLL, LLLG and starting of induction motor.
In order to acquire data DSO is used to capture the voltage dip signal. Then voltage dip waveform
are observed and captured on monitor instantly and save the data for further analysis.
Discrete wavelet transform is calculating using Db4 wavelet up to sixth level.
Then various statistical parameters such as maximum value, standard deviation, variance,
skewness, kurtosis and energy are calculated of detailed coefficient at level 4.
The six different statistical parameters are given as input to the neural network. By using
Generalized feed forward neural network (GFNN) for six parameters gives 100% results in
experimental analysis i.e. 100% classification of voltage dips due to faults and induction motor
starting is done.
IV. RESULT AND DISCUSSION
Wavelet transform approach (Simulation)
The signals obtained from PSCAD are further analyzed using wavelet transform. The wavelet
International Journal of Engineering Technology, Management and Applied Sciences
www.ijetmas.com February 2016, Volume 4, Issue 2, ISSN 2349-4476
124 Miss.Priyanka N.Kohad , Mr..S.B.Shrote
transform decomposed the signal up to six decomposition levels using db4 wavelet. The decomposition
gives approximations and detailed coefficients.
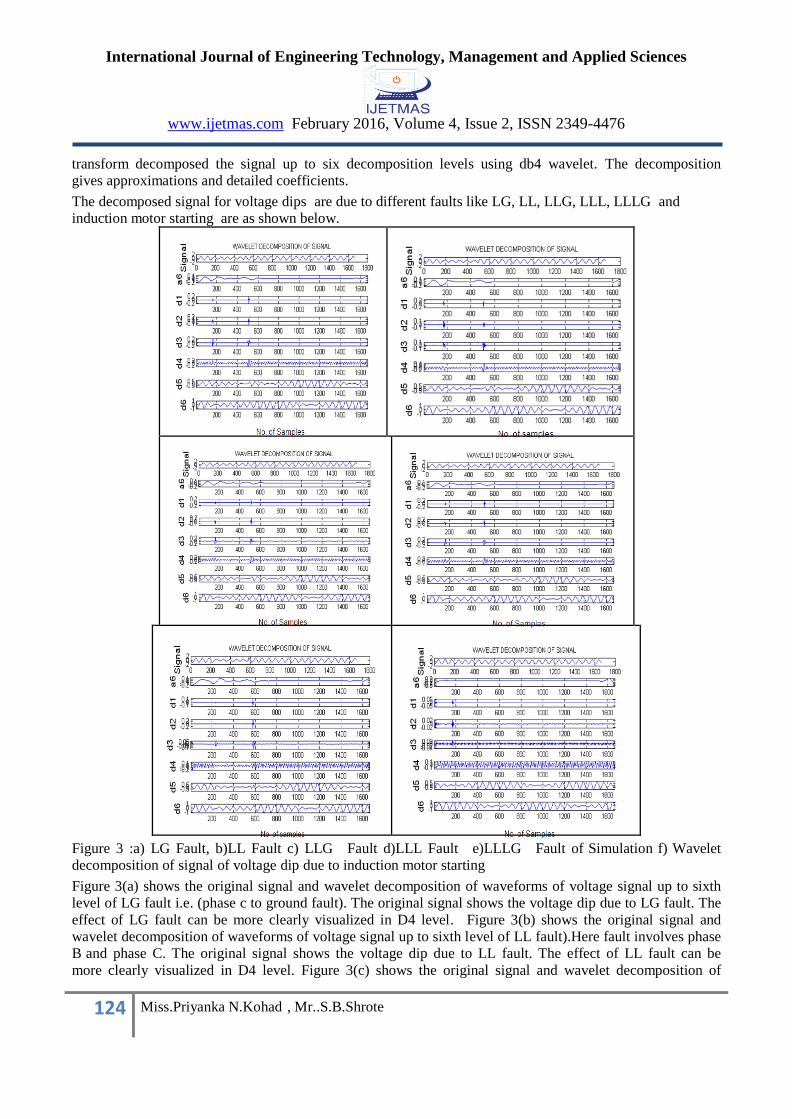
The decomposed signal for voltage dips are due to different faults like LG, LL, LLG, LLL, LLLG and
induction motor starting are as shown below.
Figure 3 :a) LG Fault, b)LL Fault c) LLG Fault d)LLL Fault e)LLLG Fault of Simulation f) Wavelet
decomposition of signal of voltage dip due to induction motor starting
Figure 3(a) shows the original signal and wavelet decomposition of waveforms of voltage signal up to sixth
level of LG fault i.e. (phase c to ground fault). The original signal shows the voltage dip due to LG fault. The
effect of LG fault can be more clearly visualized in D4 level. Figure 3(b) shows the original signal and
wavelet decomposition of waveforms of voltage signal up to sixth level of LL fault).Here fault involves phase
B and phase C. The original signal shows the voltage dip due to LL fault. The effect of LL fault can be
more clearly visualized in D4 level. Figure 3(c) shows the original signal and wavelet decomposition of
International Journal of Engineering Technology, Management and Applied Sciences
www.ijetmas.com February 2016, Volume 4, Issue 2, ISSN 2349-4476
125 Miss.Priyanka N.Kohad , Mr..S.B.Shrote
waveforms of voltage signal up to sixth level of LLG fault. Here fault involves phase A and phase C along
with the ground.
The original signal shows the voltage dip due to LLG fault. The effect of LLG fault can be more clearly
visualized in D4 level. Figure 3(d) shows shows the original signal and wavelet decomposition of waveforms
of voltage signal up to sixth level of LLL fault. Here fault involves all the three phases A, B and C
respectively. The original signal shows the voltage dip due to LLL fault. The effect of LLL fault can be more
clearly visualized in D4 level. Figure 3(e) shows the original signal and wavelet decomposition of
waveforms of voltage signal up to sixth level of LLLG fault. Here fault involves all the three phases A, B and
C along with the ground. The original signal shows the voltage dip due to LLLG fault. The effect of LLLG
fault can be more clearly visualized in D4 level. The wavelet decomposition of waveforms of voltage signal
up to sixth level using Db4 wavelet of induction motor starting is shown in figure.3 (f).
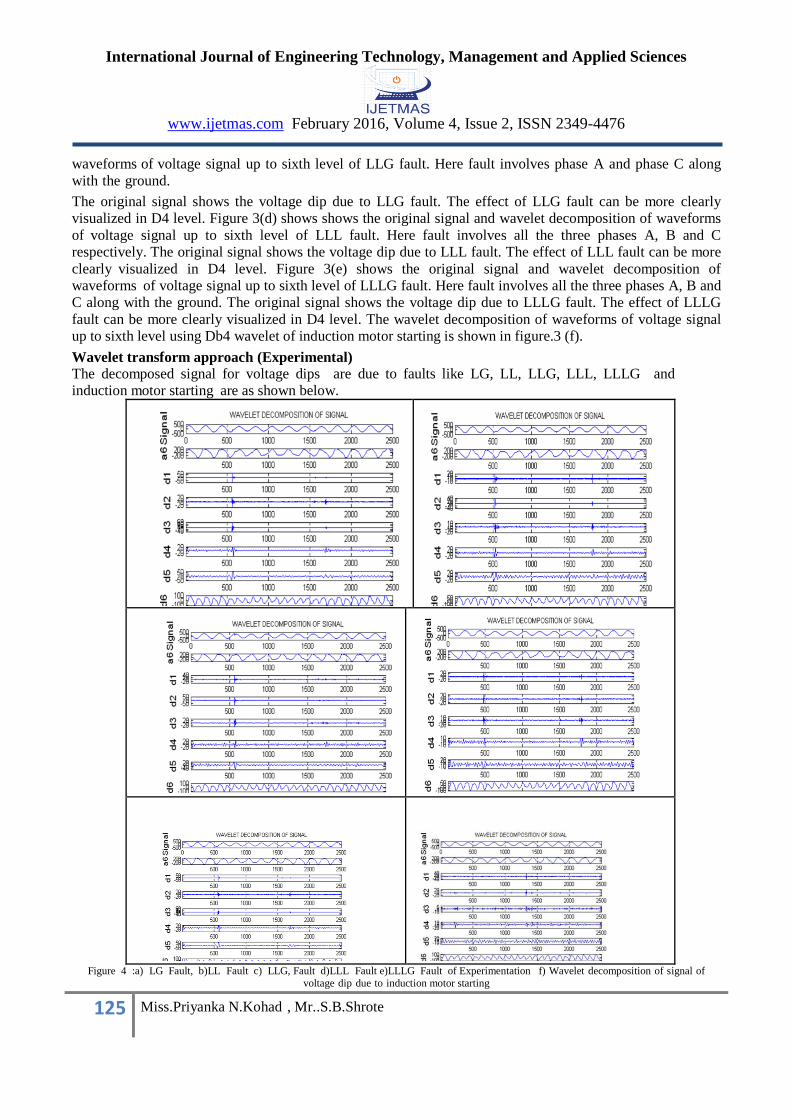
Wavelet transform approach (Experimental) The decomposed signal for voltage dips are due to faults like LG, LL, LLG, LLL, LLLG and
induction motor starting are as shown below.
Figure 4 :a) LG Fault, b)LL Fault c) LLG, Fault d)LLL Fault e)LLLG Fault of Experimentation f) Wavelet decomposition of signal of
voltage dip due to induction motor starting
International Journal of Engineering Technology, Management and Applied Sciences
www.ijetmas.com February 2016, Volume 4, Issue 2, ISSN 2349-4476
126 Miss.Priyanka N.Kohad , Mr..S.B.Shrote
From wavelet transform approach, classification of voltage dip due to faults and induction motor starting are
not possible by visual inspection. Because of this drawback various statistical parameters such as maximum
value, standard deviation, variance, skewness, kurtosis and energy are calculated.
Similarly if the worked done on statistical parameters such as maximum value, standard deviation,
variance, skewness, kurtosis and energy. It is clear that with the help of visual inspection of various statistical
parameters of voltage dips due to different faults and induction motor starting is not an easy task to classify
properly.Hence for proper classification, ANN technique is used.
ANN based classification
One of the most critical difficulties in constructing the ANN is the choice of number of hidden layers
and the number of neurons for each layer. Multilayer perceptron (MLP) and Generalized feed forward neural
network (GFNN) are used in this study.
The six different statistical parameters such as maximum value, standard deviation, variance, skewness,
kurtosis and energy are calculated for level 4 detailed coefficient is given as input to neural network. ANN
with transfer function TanhAxon, the learning rule used is momentum-0.7000, step size is 1.00000 and
maximum epochs are 1000 no.s is used to train the network. The training percentage is 75% and testing
percentage is
25%.The network is then tested and trained for various no. of processing elements in hidden layer. After
performing no. of iteration, at a certain value of processing element then 100% accuracy i.e. voltage dips due
to faults and induction motor starting are completely classified.
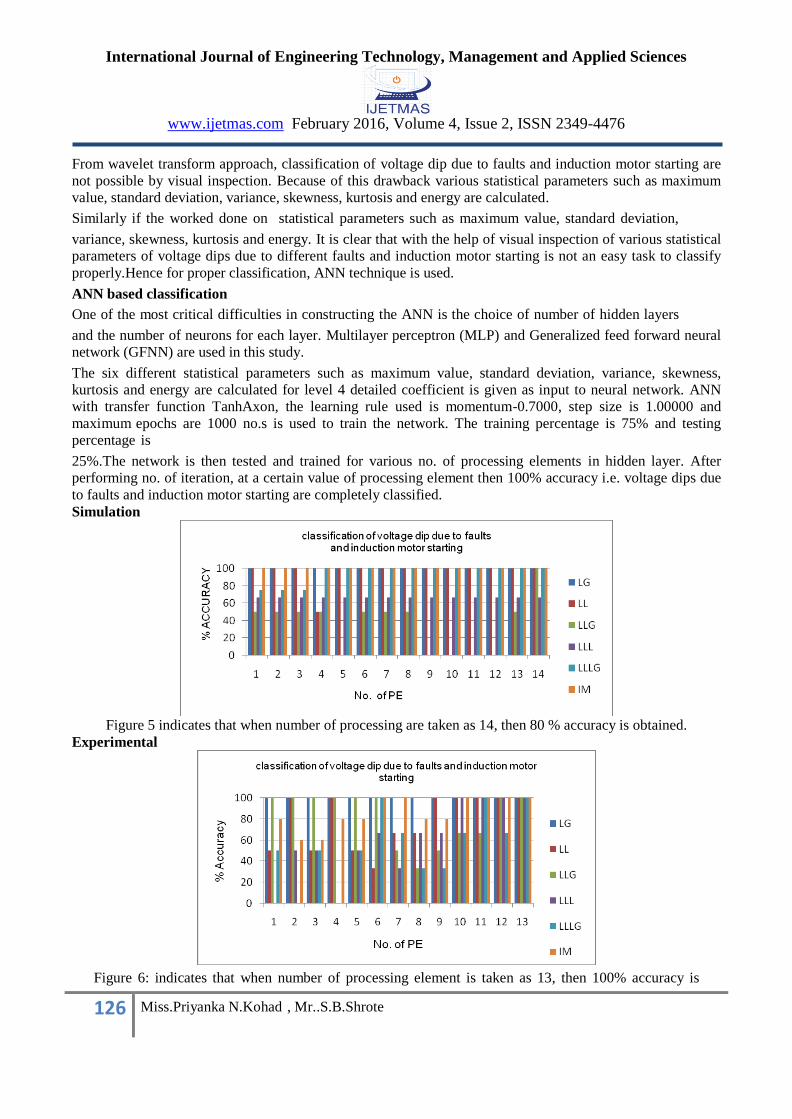
Simulation
Figure 5 indicates that when number of processing are taken as 14, then 80 % accuracy is obtained.
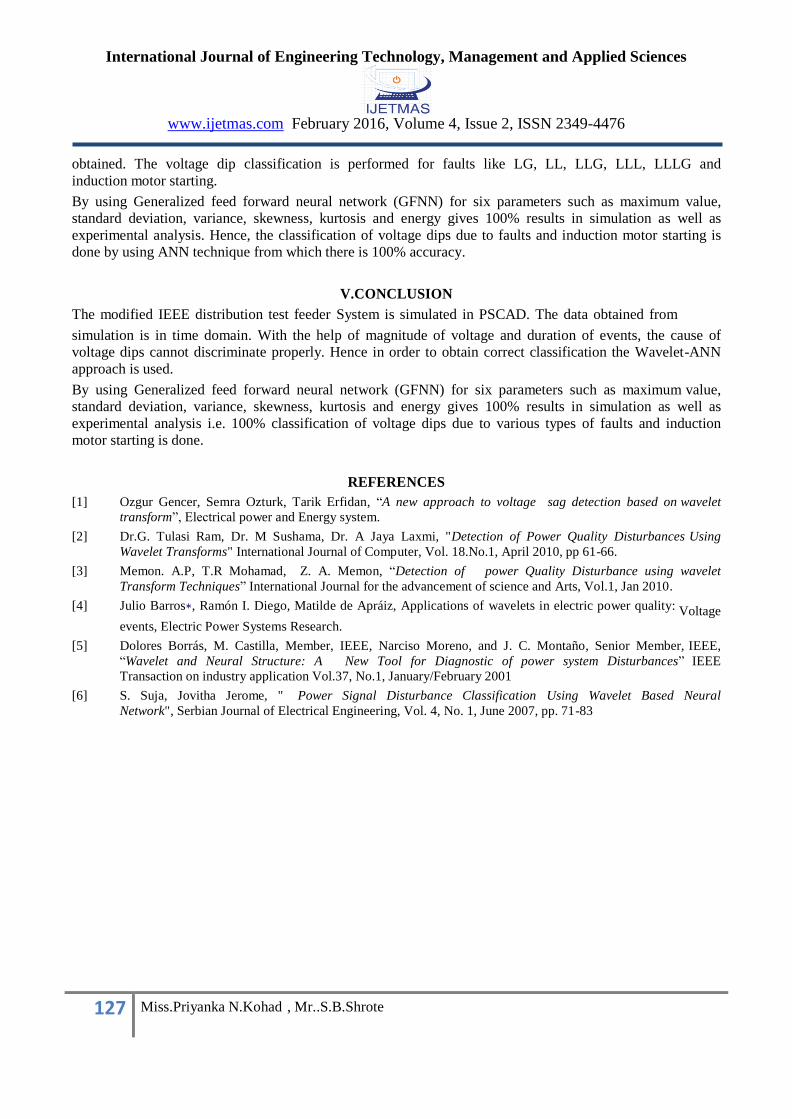
Experimental
Figure 6: indicates that when number of processing element is taken as 13, then 100% accuracy is
International Journal of Engineering Technology, Management and Applied Sciences
www.ijetmas.com February 2016, Volume 4, Issue 2, ISSN 2349-4476
127 Miss.Priyanka N.Kohad , Mr..S.B.Shrote
obtained. The voltage dip classification is performed for faults like LG, LL, LLG, LLL, LLLG and
induction motor starting.
By using Generalized feed forward neural network (GFNN) for six parameters such as maximum value,
standard deviation, variance, skewness, kurtosis and energy gives 100% results in simulation as well as
experimental analysis. Hence, the classification of voltage dips due to faults and induction motor starting is
done by using ANN technique from which there is 100% accuracy.
V.CONCLUSION
The modified IEEE distribution test feeder System is simulated in PSCAD. The data obtained from
simulation is in time domain. With the help of magnitude of voltage and duration of events, the cause of
voltage dips cannot discriminate properly. Hence in order to obtain correct classification the Wavelet-ANN
approach is used.
By using Generalized feed forward neural network (GFNN) for six parameters such as maximum value,
standard deviation, variance, skewness, kurtosis and energy gives 100% results in simulation as well as
experimental analysis i.e. 100% classification of voltage dips due to various types of faults and induction
motor starting is done.
REFERENCES
[1] Ozgur Gencer, Semra Ozturk, Tarik Erfidan, “A new approach to voltage sag detection based on wavelet
transform”, Electrical power and Energy system.
[2] Dr.G. Tulasi Ram, Dr. M Sushama, Dr. A Jaya Laxmi, "Detection of Power Quality Disturbances Using
Wavelet Transforms" International Journal of Computer, Vol. 18.No.1, April 2010, pp 61-66.
[3] Memon. A.P, T.R Mohamad, Z. A. Memon, “Detection of power Quality Disturbance using wavelet
Transform Techniques” International Journal for the advancement of science and Arts, Vol.1, Jan 2010.
[4] Julio Barros∗, Ramón I. Diego, Matilde de Apráiz, Applications of wavelets in electric power quality: Voltage
events, Electric Power Systems Research.
[5] Dolores Borrás, M. Castilla, Member, IEEE, Narciso Moreno, and J. C. Montaño, Senior Member, IEEE,
“Wavelet and Neural Structure: A New Tool for Diagnostic of power system Disturbances” IEEE
Transaction on industry application Vol.37, No.1, January/February 2001
[6] S. Suja, Jovitha Jerome, " Power Signal Disturbance Classification Using Wavelet Based Neural
Network", Serbian Journal of Electrical Engineering, Vol. 4, No. 1, June 2007, pp. 71-83