Characterization of Uplink Transmit Power and Talk … WCDMA handset’s worldwide adoption rate is...
107
Characterization of Uplink Transmit Power and Talk Time in WCDMA Networks Arjun Bhupathi Raju Thesis submitted to the faculty of the Virginia Polytechnic Institute and State University in partial fulfillment of the requirements for the degree of Master of Science In Electrical Engineering Dr R. Michael Buehrer, Chair Dr William H. Tranter Dr Steven W. Ellingson July 15, 2008 Blacksburg, Virginia Keywords: WCDMA, Transmit Power, Talk time, Power Amplifiers Copyright 2008, Arjun Bhupathi Raju
Transcript of Characterization of Uplink Transmit Power and Talk … WCDMA handset’s worldwide adoption rate is...

Characterization of Uplink Transmit Power and Talk Time in WCDMA Networks
Arjun Bhupathi Raju
Thesis submitted to the faculty of the
Virginia Polytechnic Institute and State University
in partial fulfillment of the requirements for the degree of
Master of Science
In
Electrical Engineering
Dr R. Michael Buehrer, Chair
Dr William H. Tranter
Dr Steven W. Ellingson
July 15, 2008
Blacksburg, Virginia
Keywords: WCDMA, Transmit Power, Talk time, Power Amplifiers
Copyright 2008, Arjun Bhupathi Raju

Characterization of Uplink Transmit Power and Talk Time in WCDMA Networks
Arjun Bhupathi Raju
ABSTRACT
As 3G handset manufacturers add more and more features such as multimedia applications,
color displays, video cameras, web browsing, gaming, WLAN, and MP3 players, the current
consumption of a handset is ever increasing. Of the many components, the RF power
amplifiers receive the most attention as they draw significant battery current and continue to
represent the largest power load on the battery. In order to improve the overall efficiency of
a power amplifier, it is important to know the operating uplink transmit power levels of a
mobile phone in the WCDMA network. The work in this thesis makes two major contributions.
First is the characterization of uplink transmit power in WCDMA networks based on current
network data (collected in AT&T’s WCDMA network) and realistic usage scenarios. Second is
an investigation of the relationship between the battery life and the probability distribution
function of the transmit power. Another important finding is that the talk time estimates
using field tests, lab testing and theoretical expressions all give results to within 5%. Based on
these data, design goals for WCDMA power amplifiers (in order to improve the talk times
significantly) are suggested. The output power levels where the PA efficiencies have to be
improved in order to significantly increase the battery life of WCDMA handsets are presented.

iii
Acknowledgements
First of all, I would like to thank my wonderful advisor Dr. Michael Buehrer for his constant
support and guidance throughout this work, and for always being there whenever I needed his
help. Thanks also to my committee members, Dr. William Tranter and Dr. Steve Ellingson.
I would also like to thank Jeong Heon Lee for his help with the measurement work and the
numerous discussions we had, which have enhanced this work greatly. Special thanks to the
staff of MPRG – especially Nancy Goad and Hilda Reynolds for their timely help and support.
Finally, I would like to thank my family and friends, who have been a source of tremendous
inspiration all these years and have always been there whenever I needed them.

iv
Table of Contents
Abstract ...................................................................................................... ii
Acknowledgements ......................................................................................... iii
Table of Contents .......................................................................................... iv
List of Figures ............................................................................................... vi
List of Tables ................................................................................................ ix
CHAPTER 1 Introduction ................................................................................... 1
CHAPTER 2 WCDMA Uplink Transmit Power Distribution.............................................. 3
2.1 Measurement Objectives and Procedure ...................................................... 3
2.2 Empirical PDF of transmit power for each usage scenario and location ................. 7
2.3 Impact of handset position on the uplink transmit power ................................ 12
2.4 Relationship between the transmit power and received signal code power ............ 21
2.5 Impact of network loading on the uplink transmit power ................................. 27
2.6 Comparison with the CDG report ............................................................. 29
2.7 Conclusions ....................................................................................... 31
CHAPTER 3 WCDMA Mobile Phone Talk Time Experiments .......................................... 33
3.1 Laboratory experimental setup and procedure ............................................. 34
3.2 WCDMA laboratory and field talk times ...................................................... 38
3.2.1 Laboratory experiment talk-times ..................................................... 38
3.2.2 Comparison of field and laboratory talk-times ...................................... 39
3.3 WCDMA theoretical talk-times ................................................................ 42
3.4 Overall Efficiency – Battery DC power vs. Uplink Transmit Power ....................... 49
3.5 Impact of the standard deviation of the PDF on talk-time ................................ 50
3.6 Conclusions ....................................................................................... 53
v
CHAPTER 4 Design Goals for WCDMA Power Amplifiers .............................................. 55
4.1 Impact of the WCDMA specifications on PA efficiency ..................................... 56
4.2 Power amplifier Efficiencies for the four phones ........................................... 59
4.3 Output power levels important for improving the talk-times ............................. 63
4.4 Techniques to reduce PA current consumption at low power levels..................... 65
4.5 Conclusions ....................................................................................... 70
CHAPTER 5 Conclusions ................................................................................... 71
APPENDIX A Icons used on the Measurement Locations Map ........................................ 73
APPENDIX B PDF’s of Uplink Transmit Power for each Measurement location .................... 74
APPENDIX C Impact of Handset position on the Uplink Transmit Power ........................... 81
APPENDIX D Impact of Network Loading on the Uplink Transmit Power .......................... 90
REFERENCES ................................................................................................ 95

vi
List of Figures
Figure 2-1: WCDMA coverage in the Northern Virginia area for AT&T cellular network ......... 5
Figure 2-2: Measurement locations in Northern Virginia and Washington D.C ..................... 6
Figure 2-3: Measurement locations in Baltimore ...................................................... 6
Figure 2-4: Empirical PDF for the Indoor Public scenario ............................................ 10
Figure 2-5: Empirical PDF for the Outdoor Public scenario ......................................... 10
Figure 2-6: Empirical PDF for the Home scenario .................................................... 11
Figure 2-7: Empirical PDF for the Transit scenario ................................................... 11
Figure 2-8: Empirical PDF’s for the Indoor Public scenario (a) Ear (b) Bluetooth ................ 14
Figure 2-9: Empirical PDF’s for the Outdoor Public scenario (a) Ear (b) Bluetooth .............. 14
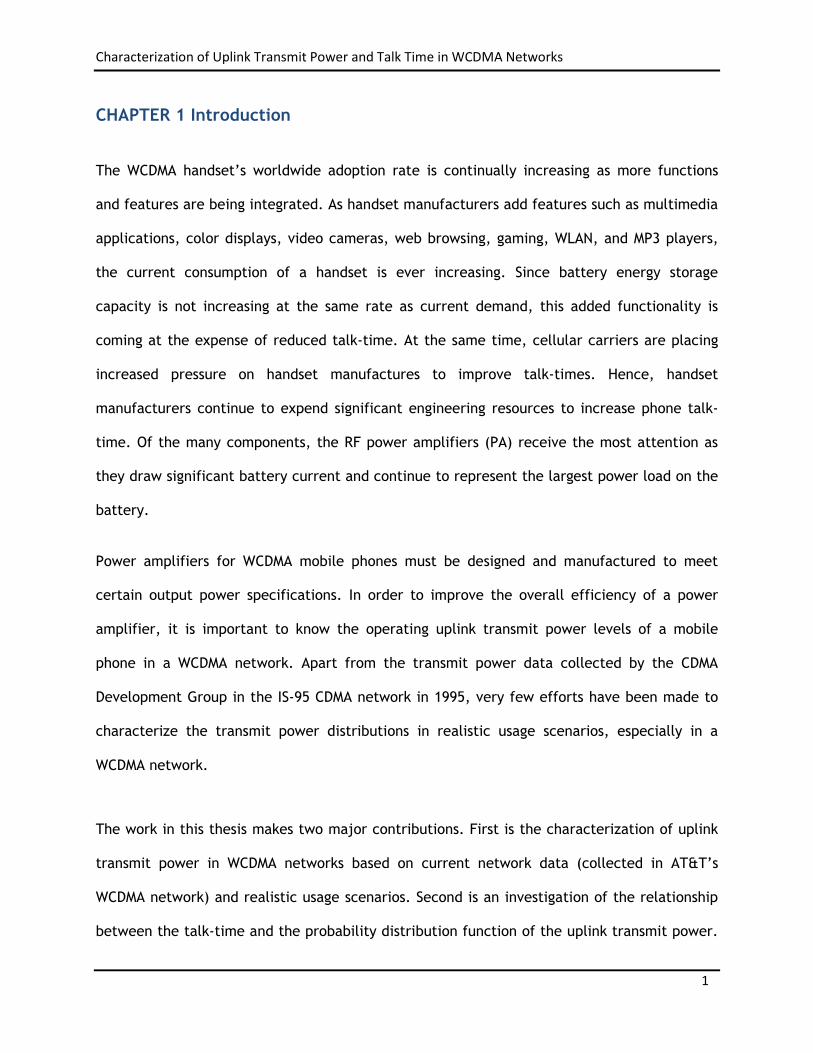
Figure 2-10: Empirical PDF’s for the Home scenario (a) Ear (b) Bluetooth ....................... 15
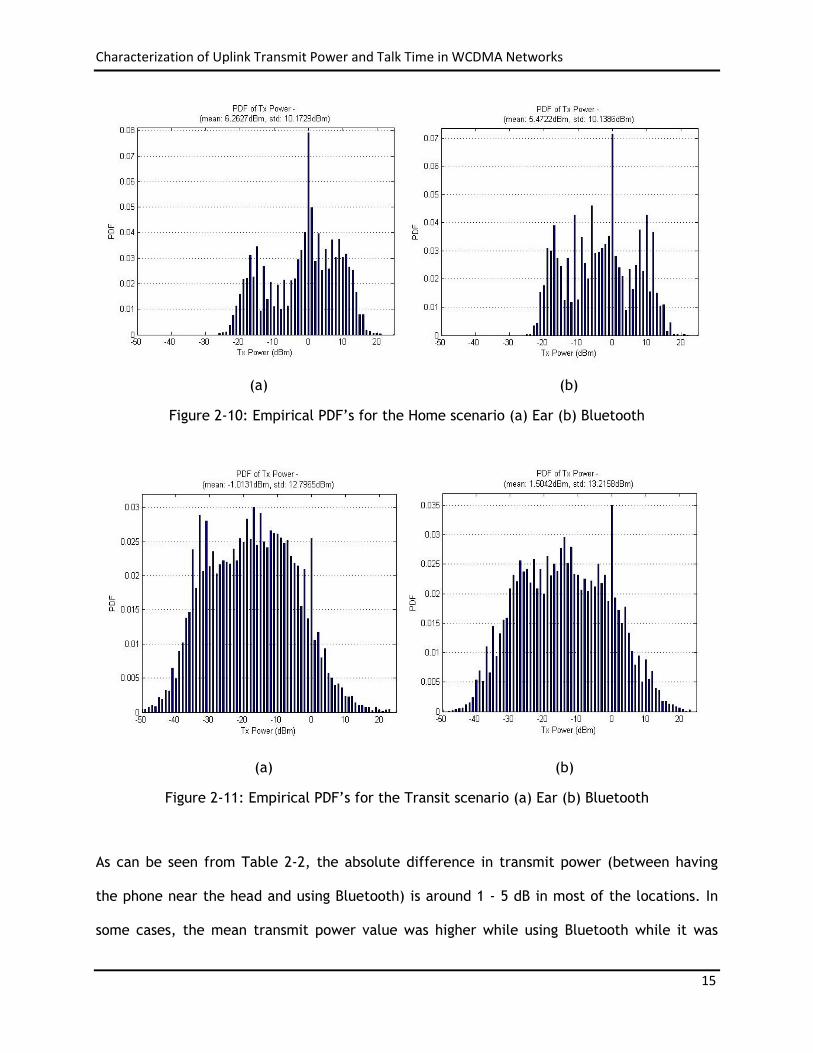
Figure 2-11: Empirical PDF’s for the Transit scenario (a) Ear (b) Bluetooth ...................... 15
Figure 2-12: Map showing the various handset positions for Tests 1 and 2 ....................... 17
Figure 2-13: Transmit power distributions and 3D scatter plots for Test 1 ....................... 20
Figure 2-14: PDF’s and 3D scatter plots for Outdoor Public and Indoor Public scenarios ...... 24
Figure 2-15: PDF’s and 3D scatter plots for Home and Transit scenarios ......................... 25
Figure 2-16: PDF of the transmit power for CDG suburban profile ................................. 29
Figure 2-17: PDF of the transmit power for CDG urban profile ..................................... 30
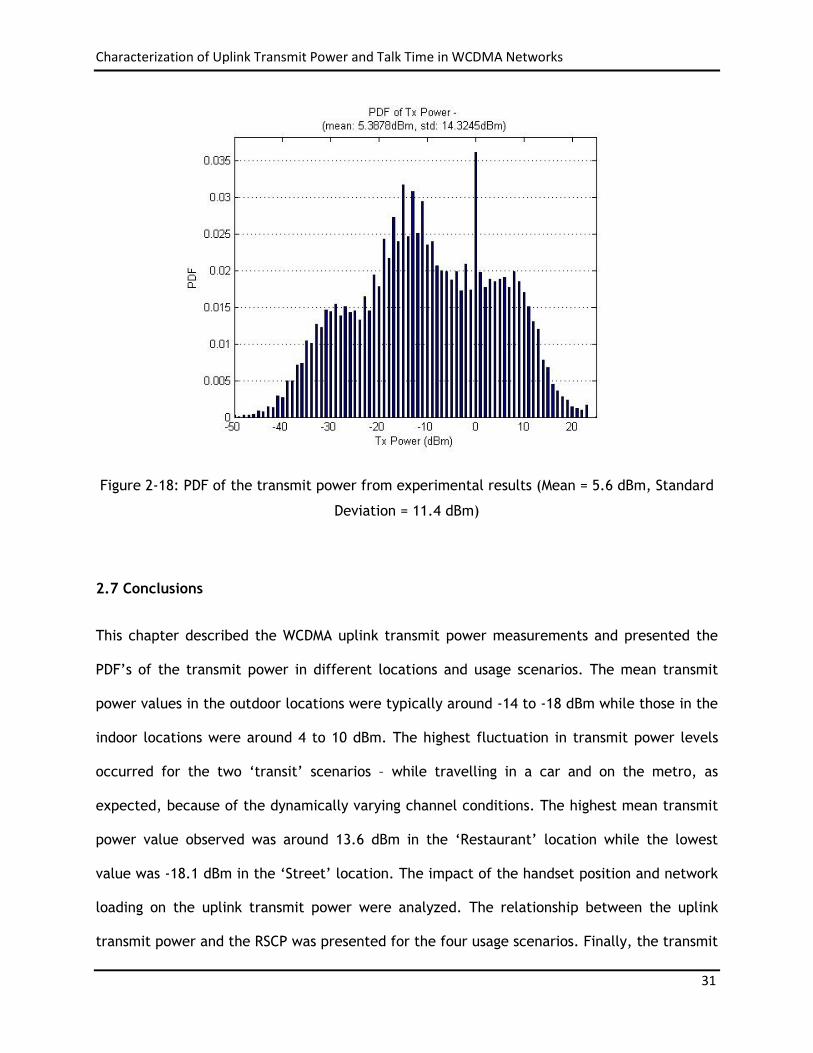
Figure 2-18: PDF of the transmit power from experimental results ............................... 31
Figure 3-1: Experimental setup for the laboratory talk-time tests ................................ 36
Figure 3-2: Agilent E5515C Wireless Communications Test Set ..................................... 36
Figure 3-3: Transmit power PDF for the Mall (a) and Transit (b) scenarios ....................... 40
Figure 3-4: Transmit power PDF for the Restaurant (a) and Hotel (b) scenarios................. 41
Figure 3-5: Battery current measurement setup ...................................................... 44
Figure 3-6: Battery current drain vs. Uplink transmit power ....................................... 44

vii
Figure 3-7: Typical discharge profile of a Lithium ion battery ..................................... 47
Figure 3-8: Overall efficiency curves .................................................................. 50
Figure 3-9: Probability Distribution plots for PDF-1, PDF-2 and PDF-3 ............................ 52
Figure 3-10: Variation of theoretical talk times with the standard deviation of the PDF ...... 52
Figure 4-1: WCDMA Signal Constellation Diagram without HPSK (a) and with HPSK (b) ......... 58
Figure 4-2: Power Amplifier Efficiency curves for the 4 phones.................................... 60
Figure 4-3: Efficiency curve of a Standard WCDMA Amplifier ....................................... 61
Figure 4-4: CDF of the transmit power for the Indoor Public (a) and Home (b) scenarios ...... 63
Figure 4-4: CDF of the transmit power for the Outdoor Public (a) and Transit (b) scenarios .. 64
Figure A-1: Icons used on the Measurement Location Maps ......................................... 73
Figure B-1: Empirical PDF for the Transit-Car scenario .............................................. 74
Figure B-2: Empirical PDF for the Transit-Metro scenario ........................................... 74
Figure B-3: Empirical PDF for the Airport scenario ................................................... 75
Figure B-4: Empirical PDF for the Hotel scenario ..................................................... 75
Figure B-5: Empirical PDF for the Mall scenario ...................................................... 76
Figure B-6: Empirical PDF for the Office scenario .................................................... 76
Figure B-7: Empirical PDF for the Restaurant scenario .............................................. 77
Figure B-8: Empirical PDF for the University scenario ............................................... 77
Figure B-9: Empirical PDF for the Downtown scenario ............................................... 78
Figure B-10: Empirical PDF for the Metro-station scenario .......................................... 78
Figure B-11: Empirical PDF for the Park scenario ..................................................... 79
Figure B-12: Empirical PDF for the Street scenario .................................................. 79
Figure B-13: Empirical PDF for the Apartment scenario ............................................. 80
Figure B-14: Empirical PDF for the House scenario ................................................... 80
Figure C-1: PDF’s for Ear & Bluetooth handset position - Airport .................................. 81
Figure C-2: PDF’s for Ear & Bluetooth handset position - Apartment.............................. 81
viii
Figure C-3: PDF’s for Ear & Bluetooth handset position - Downtown .............................. 82
Figure C-4: PDF’s for Ear & Bluetooth handset position - Hotel .................................... 82
Figure C-5: PDF’s for Ear & Bluetooth handset position - House ................................... 83
Figure C-6: PDF’s for Ear & Bluetooth handset position - Mall ..................................... 83
Figure C-7: PDF’s for Ear & Bluetooth handset position - Metro ................................... 84
Figure C-8: PDF’s for Ear & Bluetooth handset position - Metro Station .......................... 84
Figure C-9: PDF’s for Ear & Bluetooth handset position - Office ................................... 85
Figure C-10: PDF’s for Ear & Bluetooth handset position - Park .................................... 85
Figure C-11: PDF’s for Ear & Bluetooth handset position - Restaurant ............................ 86
Figure C-12: PDF’s for Ear & Bluetooth handset position - Street .................................. 86
Figure C-13: PDF’s for Ear & Bluetooth handset position - Transit-Car............................ 87
Figure C-14: PDF’s for Ear & Bluetooth handset position - University ............................. 87
Figure C-15: Transmit power distributions and 3D scatter plots for Test 2 ....................... 88
Figure C-16: Transmit power distributions and 3D scatter plots for Test 2 (cont’d) ............ 89
Figure D-1: Transmit power distributions and 3D scatter plots for Test 1.1 ...................... 90
Figure D-2: Transmit power distributions and 3D scatter plots for Test 2-1 ...................... 91
Figure D-3: Transmit power distributions and 3D scatter plots for Test 2-2 ...................... 92
Figure D-4: Transmit power distributions and 3D scatter plots for Test 2-3 ...................... 93
Figure D-5: Transmit power distributions and 3D scatter plots for Test 2-3 ...................... 94
ix
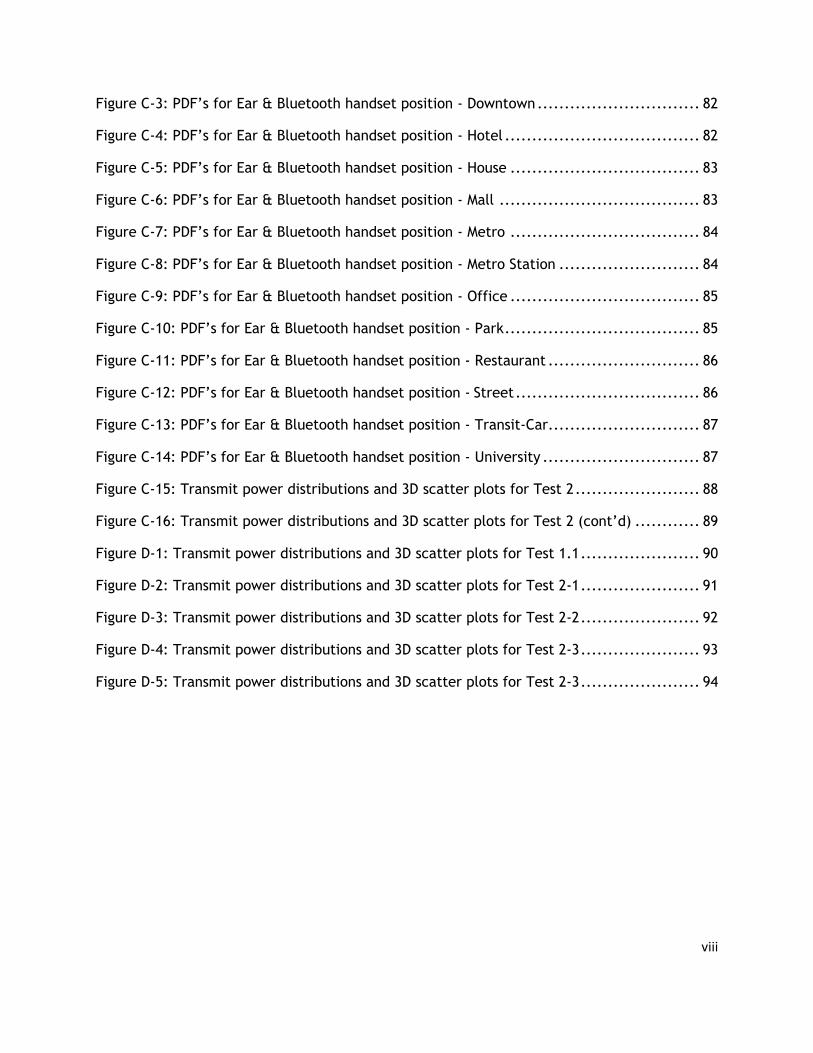
List of Tables
Table 2-1: Uplink transmit power statistics for each measurement location ..................... 8
Table 2-2: Comparison of mean transmit power for the two handset positions ................. 13
Table 2-3: Mean transmit power for different handset positions in Test 1 ....................... 18
Table 2-4: Mean transmit power for different handset positions in Test 2 ....................... 18
Table 2-5: UL-DL power relationship for each usage scenario ..................................... 26
Table 2-6: Standard deviation of transmit power from the linear regression model ........... 27
Table 2-7: Impact of network loading on the transmit power ..................................... 28
Table 3.1: Laboratory talk time results for the 6 PDF’s ............................................ 39
Table 3-2: Comparison of the field and laboratory talk times ..................................... 41
Table 3-3: Field talk times as a percentage of the laboratory talk times ........................ 42
Table 3-4: Advertised current ratings of the four phones .......................................... 45
Table 3-5: Average battery current drain for the 4 phones ........................................ 46
Table 3-6: Comparison of the theoretical and laboratory talk time values ...................... 47
Table 3-7: Laboratory talk times as a percentage of the theoretical values .................... 48
Table 3-8: Comparison of theoretical, laboratory and field talk times ........................... 48
Table 3-9: Laboratory and field talk-times as a percentage of theoretical values ............. 49
Table 3-10: Summary of the transmit power statistics for the 12 PDF’s ......................... 51
Table 4-1: Peak Efficiency values of the four PA’s .................................................. 60
Table 4.2: Average efficiencies of the 4 PA’s ........................................................ 62
Table 4.3: PA current consumption at low power levels ............................................ 68
Table 4.4: Talk-time improvements with reduced current consumption ......................... 68
Table 4-5: PA average efficiency improvement using LPEE techniques .......................... 69
Characterization of Uplink Transmit Power and Talk Time in WCDMA Networks
1
CHAPTER 1 Introduction
The WCDMA handset’s worldwide adoption rate is continually increasing as more functions
and features are being integrated. As handset manufacturers add features such as multimedia
applications, color displays, video cameras, web browsing, gaming, WLAN, and MP3 players,
the current consumption of a handset is ever increasing. Since battery energy storage
capacity is not increasing at the same rate as current demand, this added functionality is
coming at the expense of reduced talk-time. At the same time, cellular carriers are placing
increased pressure on handset manufactures to improve talk-times. Hence, handset
manufacturers continue to expend significant engineering resources to increase phone talk-
time. Of the many components, the RF power amplifiers (PA) receive the most attention as
they draw significant battery current and continue to represent the largest power load on the
battery.
Power amplifiers for WCDMA mobile phones must be designed and manufactured to meet
certain output power specifications. In order to improve the overall efficiency of a power
amplifier, it is important to know the operating uplink transmit power levels of a mobile
phone in a WCDMA network. Apart from the transmit power data collected by the CDMA
Development Group in the IS-95 CDMA network in 1995, very few efforts have been made to
characterize the transmit power distributions in realistic usage scenarios, especially in a
WCDMA network.
The work in this thesis makes two major contributions. First is the characterization of uplink
transmit power in WCDMA networks based on current network data (collected in AT&T’s
WCDMA network) and realistic usage scenarios. Second is an investigation of the relationship
between the talk-time and the probability distribution function of the uplink transmit power.

Characterization of Uplink Transmit Power and Talk Time in WCDMA Networks
2
Based on these data, design goals for WCDMA Power amplifiers (in order to improve the talk
times significantly) are suggested.
This thesis is structured as follows. In Chapter 2, the WCDMA transmit power measurement
campaign is detailed. The measurements were conducted in various usage scenarios in AT&T’s
WCDMA network using the SwissQual Qualipoc testing device. The PDF’s of the uplink transmit
power are presented for the different usage scenarios. Additionally, the impact of factors
such as handset position, received signal code power and network loading on the transmit
power is presented.
In Chapter 3, the relationship between the talk time and the uplink transmit power
distribution is investigated. Several experiments were conducted to investigate the impact of
the transmit power statistics (mean and standard deviation) on the talk time. The
experiments were conducted in the laboratory (using a base station emulator) and in the field
(in AT&T’s WCDMA network) using 4 different phones [LG CU500, Samsung Sync, Motorola Q
and Nokia N75]. In addition to these experiments, the current drawn from the battery at each
uplink power level was measured, thus enabling us to predict a theoretical talk-time based on
the PDF of the transmit power and the total current rating of the battery.
In Chapter 4, design goals for the WCDMA power amplifiers (PA) are presented based on the
measurement results from Chapters 2 and 3. Specifically, the transmit power levels where the
PA efficiencies have to be improved in order to significantly increase the battery life of
WCDMA handsets are presented. The battery current consumption of the PA’s used in the 4
phones is presented. Some of the techniques proposed in the literature to reduce the PA
current consumption are discussed and the improvement in talk time based on these
techniques is investigated.

Characterization of Uplink Transmit Power and Talk Time in WCDMA Networks
3
CHAPTER 2 WCDMA Uplink Transmit Power Distribution
Power amplifier efficiency for wireless communication systems is typically calculated at
maximum output power. While this method has evolved into the de-facto figure of merit, it
ignores the system effects on average output power, and cannot in general provide an
accurate estimate of the PA impact on phone talk-time [1]. A more meaningful efficiency
estimate is the overall PA efficiency, which is based on the distribution of the uplink transmit
power levels. Thus, in order to optimize the overall PA efficiency for a WCDMA mobile phone,
it is critical to know the uplink transmit power distribution in a WCDMA network.
The uplink transmit power distribution commonly used in literature for CDMA-based (viz. IS-
95) mobile phones is based on drive test data collected by the CDMA Development Group
(CDG) in 1995. The CDG collected the transmit power data in urban and suburban
environments and presented the corresponding empirical distribution curves (PDF’s) for IS-95
networks [2]. Besides the fact that the data is dated, one of the primary concerns regarding
the original measurement methodology is that it relied on drive-testing using roof-mounted
antennas and thus may not reflect actual mobile phone transmit power when considering
common usage patterns and environmental factors. Thus, the primary purpose of the
measurement campaign was to characterize the uplink transmit power distribution in WCDMA
Networks based on current network data and realistic mobile phone usage scenarios.
2.1 Measurement Objectives and Procedure
The WCDMA transmit power measurements were conducted with the objective of determining
the impact of various factors such as location type, usage scenario, handset position, user
mobility and network loading on the uplink transmit power distribution. The measurements
were taken in 14 different location types namely – Mall, Office, University, Restaurant,

Characterization of Uplink Transmit Power and Talk Time in WCDMA Networks
4
Airport, Hotel, Downtown, Street, Metro station, Park, Apartment, Townhouse, Transit in car
and Metro. For each location type, measurements were taken at three different sample
locations (belonging to that location type). For example, for the ‘Mall’ location type,
measurements were taken at 3 different Malls A, B, C.
Further, at each location, the uplink transmit power can be impacted by specific usage
factors such as
• User Mobility
• Handset Position
• Network Loading
In order to observe the impact of the ‘user mobility’ and ‘handset position’ on the transmit
power, measurements were performed with two different handset positions (phone next to
the ear and away from the head using Bluetooth hands-free device) and two different
mobility factors (stationary and mobile) at each measurement location. Thus four sets of
measurements were taken at each location, based on the four different combinations of the
user mobility and handset position.
The impact of ‘network loading’ on the transmit power was observed by taking measurements
at the same location but at two different times of the day.
• Peak hours (e.g., rush hours on weekdays)
• Off-peak hours (e.g., night time & weekends)
The measurement location types were classified into the four usage scenarios namely,
• Indoor Public – Mall, Office, University, Restaurant, Airport, Hotel

Characterization of Uplink Transmit Power and Talk Time in WCDMA Networks
5
• Outdoor Public – Downtown, Street, Metro station, Park
• Home – Apartment, Townhouse
• Transit – Car, Metro, Walking (Street & Downtown)
At the time the measurements were conducted, AT&T was the primary operator of WCMDA
networks in the United States. AT&T has been extensively pushing the 3G network into the
market since 2004, and UMTS service was launched in the major metropolitan cities in
December 2005. The WCDMA network in Washington D.C / Northern Virginia / Baltimore area
was chosen to conduct the measurements because it is the closest metropolitan area from
Blacksburg and the WCDMA network in this area was around two years old at the time the
measurements were conducted (sufficiently mature – in terms of coverage and the number of
users). The WCDMA coverage area around Northern Virginia is shown in Figure 2-1. A map
indicating the measurement locations is shown in Figures 2-2 and 2-3. The shaded regions in
figures 2-2 and 2-3 indicate the areas which have good 3G signal coverage (and also well
accessible) and are thus most conducive for conducting the measurements.
Figure 2-1: WCDMA coverage in the Northern Virginia area for AT&T cellular network
[http://www.wireless.att.com/coverageviewer/]

Characterization of Uplink Transmit Power and Talk Time in WCDMA Networks
6
Figure 2-2: Measurement locations in Northern Virginia and Washington D.C
Figure 2-3: Measurement locations in Baltimore
The equipment used for collecting the transmit power data was the SwissQual Qualipoc
testing device which is essentially a Nokia N75 smart phone, loaded with post-processing
software provided by SwissQual. Before starting the measurement, the phone was forced to
operate on the WCDMA network over the 1900 MHz band. Apart from the uplink transmit
power (TxPwr), other data recorded by the software include the Received Signal Code Power
(RSCP). This data was useful in analyzing the relationship between the RSCP and TxPwr, which

Characterization of Uplink Transmit Power and Talk Time in WCDMA Networks
7
is presented later in this chapter. During the testing, the voice activity was kept at
(approximately) 40%. Overall, around 300 measurements were taken with each measurement
consisting of approximately 5 minutes of data.
2.2 Empirical PDF of transmit power for each usage scenario and location
In this section, the empirical probability distributions of the uplink transmit power in
different types of locations are presented. Each histogram is the result of multiple
measurements in a similar environment. For example, the empirical distribution for the
‘Park’ location is based on all of the data taken in parks including both mobile and stationary
measurements and both handset positions (ear & Bluetooth). The transmit power distributions
in each specific location are included in Appendix B. In each figure, the mean and standard
deviation of the transmit power (in dBm) are included. The mean and standard deviation of
the transmit power were calculated in linear and then converted to dBm. A summary of the
transmit power statistics at each location is provided in Table 2-1.

Characterization of Uplink Transmit Power and Talk Time in WCDMA Networks
8
Measurement
Location
Mean Transmit
Power value
(dBm)
Standard
Deviation (dBm)
No of
measurements
Total
measurement
time (in min)
Transit-Car 2.1 9.5 40 315
Metro 1.1 9.7 12 60
Airport -0.6 5.6 24 120
Hotel 4.0 7.1 28 140
Mall 7.4 12.9 28 135
Office 10.4 12.6 12 60
Restaurant 13.1 15.4 14 70
University 8.9 13.6 24 125
Downtown -1.8 3.3 24 116
Metro station -14.1 -6.2 12 60
Park -13.6 0.5 24 120
Street -18.1 -12.9 24 120
Apartment -4.1 0.8 12 60
House 7.2 9.5 24 120
Total 5.6 11.4 302 1620
Table 2-1: Uplink transmit power statistics for each measurement location
From these results, it can be observed that the transmit power levels in indoor locations are
considerably higher than those in outdoor locations. The mean transmit power values in the

Characterization of Uplink Transmit Power and Talk Time in WCDMA Networks
9
outdoor locations were typically around -14 to -18 dBm while those in the indoor locations
were around 4 to 10 dBm. The highest fluctuation in transmit power levels occurred for the
two ‘transit’ scenarios – while travelling in car and metro, as expected, because of the
dynamically varying channel conditions [Figure 2-7]. The highest mean transmit power value
observed was around 13.6 dBm in the ‘Restaurant’ location while the lowest value was -18.1
dBm in the ‘Street’ location. While the transmit power levels in indoor locations are not
alarmingly high, they could be reduced further by employing micro cells, which boost the
network coverage - especially in public places like malls, university buildings, restaurants etc.
The uplink transmit power distribution for each of the four usage scenarios [Indoor Public,
Outdoor Public, Home, Transit] is shown in Figures 2-4 to 2-7. The transmit power distribution
for a particular usage scenario was obtained by accumulating the data from all the locations,
that fall under that usage scenario.
Note: It can be noticed that in most of the distributions (PDF’s) there is a spike at 0 dBm. In
most of the locations, there is a tendency of the phone to be at 0 dBm (especially when the
transmit power level is in the vicinity of 0 dBm). When the data from a number of locations
are added up, the spike at 0 dBm becomes more prominent. It is suspected that this quirky
behavior is due to a bug, either in the software or the Nokia N75 phone's firmware. This issue
is currently being discussed with SwissQual and Nokia.

Characterization of Uplink Transmit Power and Talk Time in WCDMA Networks
10
Figure 2-4: Empirical PDF for the Indoor Public scenario
Figure 2-5: Empirical PDF for the Outdoor Public scenario

Characterization of Uplink Transmit Power and Talk Time in WCDMA Networks
11
Figure 2-6: Empirical PDF for the Home scenario
Figure 2-7: Empirical PDF for the Transit scenario

Characterization of Uplink Transmit Power and Talk Time in WCDMA Networks
12
2.3 Impact of the handset position on the uplink transmit power
During the last few years, the number of Bluetooth hands-free device users has been steadily
increasing. In the context of the uplink transmit power, this brings us to an important
question – How does the uplink transmit power distribution change when a Bluetooth hands-
free device is used with the phone being held away from the head?
In this section, the impact of the handset position on the uplink transmit power is discussed.
At each exact location, two identical (to the degree possible) measurements were taken: first
holding the mobile phone next to the ear and second using Bluetooth with the phone held
away from the head. The transmit power distribution profiles obtained using the two handset
positions at each measurement location are included in the Appendix. A comparison of the
transmit power distributions for each usage scenario is shown in Figures 2-8 to 2-11 and the
transmit power statistics are shown in Table 2-2.

Characterization of Uplink Transmit Power and Talk Time in WCDMA Networks
13
Measurement
Location
Mean Transmit
Power – Ear (dBm)
Mean Transmit
Power –
Bluetooth (dBm)
Additional Power
Required when Phone is
Next to Ear (dB)
Airport -3.4 1.2 -4.6
Apartment -2.6 -6.8 4.2
Downtown -3.9 -0.2 -3.7
Hotel 0.9 5.7 -4.8
House 7.6 6.8 0.8
Mall 8.2 5.8 2.4
Metro -6.1 3.8 -9.9
Metro station -12.6 -16.3 3.7
Office 9.6 11.1 -1.5
Park -15.1 -12.5 -2.6
Restaurant 12.0 13.8 -1.8
Street -18.4 -17.6 -0.8
Transit-Car 1.2 3.4 -2.2
University 8.7 9.1 -0.4
Transit -1.0 1.5 -2.5
Indoor Public 7.8 8.5 -0.7
Outdoor Public -8.3 -4.6 -3.7
Home 6.3 5.5 0.8
Table 2-2: Comparison of mean transmit power for the two handset positions

Characterization of Uplink Transmit Power and Talk Time in WCDMA Networks
14
(a) (b)
Figure 2-8: Empirical PDF’s for the Indoor Public scenario (a) Ear (b) Bluetooth
(a) (b)
Figure 2-9: Empirical PDF’s for the Outdoor Public scenario (a) Ear (b) Bluetooth
Characterization of Uplink Transmit Power and Talk Time in WCDMA Networks
15
(a) (b)
Figure 2-10: Empirical PDF’s for the Home scenario (a) Ear (b) Bluetooth
(a) (b)
Figure 2-11: Empirical PDF’s for the Transit scenario (a) Ear (b) Bluetooth
As can be seen from Table 2-2, the absolute difference in transmit power (between having
the phone near the head and using Bluetooth) is around 1 - 5 dB in most of the locations. In
some cases, the mean transmit power value was higher while using Bluetooth while it was

Characterization of Uplink Transmit Power and Talk Time in WCDMA Networks
16
lower in the other cases. Thus a definitive conclusion cannot be reached about which of the
two handset positions results in higher uplink transmit power. However, the results do tell us
the range of difference (in transmit power) possible, between the two handset positions.
Another possible conclusion from these results is that the difference in transmit power
depends heavily on the orientation of the body relative to the direction of arrival of the
signal. For example, if the body is shadowing the phone from the main receive path, using
Bluetooth may result in higher power [3,4].
The signal transmitted from the mobile phone experiences different fading effects caused by
reflection, diffraction and scattering in different positions. For example, depending on the
position of the mobile phone, the user’s body will affect the transmitted signal propagating to
the Base Transceiver Station (BTS) in different ways [3,4]. Thus, in different positions the
mobile phone will receive different TPC command sequences from the associated BTS’s to
counteract these channel effects.
To explore this relationship further, additional measurements were taken at one particular
location using the Bluetooth hands-free device and varying the position of the handset
(phone). It was found that specific handset position highly affected the transmit power
distribution. During the previous tests with the Bluetooth hands-free device, the handset was
either placed in the hand / pocket or on nearby furniture. However, for these measurements,
the handset position relative to the body and nearby objects is deliberately changed. A map
of the various handset positions in which measurements were taken is shown in Figure 2-12.
Characterization of Uplink Transmit Power and Talk Time in WCDMA Networks
17
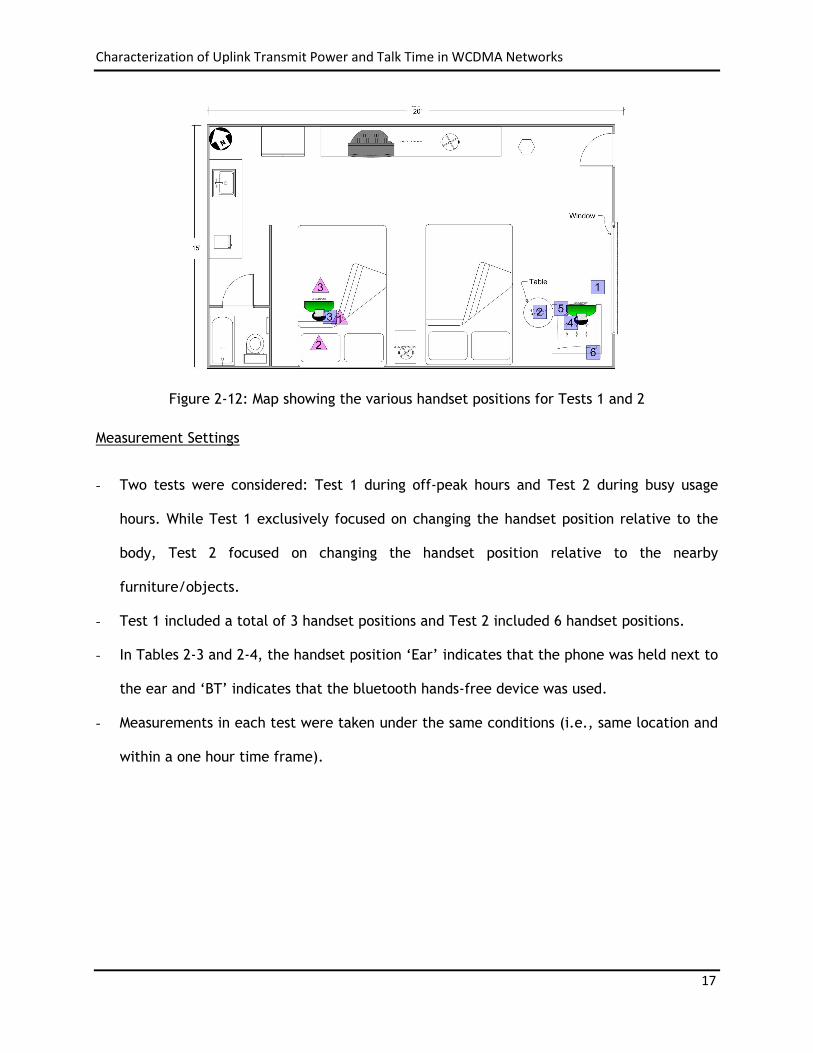
Figure 2-12: Map showing the various handset positions for Tests 1 and 2
Measurement Settings
- Two tests were considered: Test 1 during off-peak hours and Test 2 during busy usage
hours. While Test 1 exclusively focused on changing the handset position relative to the
body, Test 2 focused on changing the handset position relative to the nearby
furniture/objects.
- Test 1 included a total of 3 handset positions and Test 2 included 6 handset positions.
- In Tables 2-3 and 2-4, the handset position ‘Ear’ indicates that the phone was held next to
the ear and ‘BT’ indicates that the bluetooth hands-free device was used.
- Measurements in each test were taken under the same conditions (i.e., same location and
within a one hour time frame).

Characterization of Uplink Transmit Power and Talk Time in WCDMA Networks
18
Results
Handset
Position
Mean Transmit Power
(in dBm)
1 (Ear) 3.3
2 (BT) 6.2
3 (BT) 10.5
Table 2-3: Mean transmit power for different handset positions in Test 1
Handset
Position
Mean Transmit Power
(in dBm)
1 (BT) -1.8
2 (BT) 2.3
3 (Ear) 3.4
4 (Ear) 5.2
5 (BT) 9.9
6 (BT) 10.8
Table 2-4: Mean transmit power for different handset positions in Test 2
From Tables 2-3 and 2-4, it can be observed that the handset position significantly affected
the uplink transmit power during both the tests. The mean transmit power varied from 3 to 10
dBm during test 1 and from -2 to 11 dBm during test 2. During test 2, the mean transmit
power values were 3.4 and 5.2 dBm for handset positions 3 and 4 (Ear) while the mean
transmit power varied from -1.8 to 10.8 dBm for the handset positions 1,2,5,6 (BT). These
results agree with the results in Table 2-2 where the absolute difference in mean transmit
power between the two handset positions was found to be around 1 – 5 dB. These results also
re-affirm that there is no specific trend as to which handset position yields higher transmit

Characterization of Uplink Transmit Power and Talk Time in WCDMA Networks
19
power. Also, using a bluetooth hands-free device does not increase the mean transmit power.
The uplink transmit power distributions and the RSCP plots for Test 1 are shown in Figure 2-13
while those for Test 2 are included in the Appendix C.

Characterization of Uplink Transmit Power and Talk Time in WCDMA Networks
20
Figure 2-13: Transmit power distributions and 3D scatter plots for Test 1

Characterization of Uplink Transmit Power and Talk Time in WCDMA Networks
21
2.4 Relationship between the transmit power and received signal code power
Received Signal Code Power is defined as the received power on the pilot code after de-
spreading. In order to analyze the relationship between the uplink transmit power and the
received signal code power, it is helpful to understand the power control mechanism in UMTS.
The UMTS power control mechanism is briefly presented here before discussing the results
from the measurements.
In UMTS, the air-interface is WCDMA, which is intrinsically interference limited. Thus, it is
important to minimize interference for maximizing the battery life of the mobile phone and
system capacity. Also, network capacity can be negatively affected by near-far effects in
CDMA-based networks. Over-powered UEs located near the BTS could dominate the receive
signal of the UTRA (UMTS Terrestrial Radio Access) network cell. Hence, power control is one
of the crucial system requirements in WCDMA networks.
Power control techniques for UMTS broadly fall into two processes [5]: open-loop power
control and closed-loop power control. The latter is further divided into two control loops
operating in parallel: inner-loop power control and outer-loop power control. Open-loop
power control is performed only for the initial transmission on the RACH (Random Access
Channel) or CPCH (Common Packet Channel) to quickly determine an initial UE transmit
power level. The initial power estimation is done with the RSCP measured on the primary
CPICH (Common Pilot Channel) of the primary cell.
The main goal of closed-loop power control is to control the transmit powers of all of the UEs
in the same cell, thus meeting the target SIR (Signal-to-Interference Ratio) set for each UE at
BTS. The inner-loop power control operating at 1500 Hz (i.e., once per time slot), also known
as fast closed-loop power control, sends a TPC (Transmit Power Control) command to an
individual UE to compensate small scale fading. The BTS compares the estimated SIR to the

Characterization of Uplink Transmit Power and Talk Time in WCDMA Networks
22
target SIR once every time slot or every 0.666 ms. When the estimated SIR is greater than the
target SIR, the BTS sends a TPC command “0” to the UE to reduce its transmit power. On the
other hand, if the estimated SIR is below the target SIR, a TPC command “1” is sent to
increase the transmit power. The SIR target is determined by RNC (Radio Network Controller)
to satisfy the required QoS for the application via outer-loop power control. Outer-loop power
control is used for compensating large scale fading (such as shadowing and path loss) and
other slow-term link level conditions on an individual link between the UE and BTS.
In the UMTS DL, BTSs broadcast CPICH with the same power and using a known bit sequence.
The UE detects a primary cell periodically by measuring the RSCP of CPICHs transmitted by
the active cells. The cell with the highest RSCP is selected as a primary cell. The RSCP is a
function of the distance between UE from the base station and shadowing. As the distance
increases, the RSCP decreases. The path loss is generally calculated as follows:
[ ] [ ]path loss Channel Tx power dBm RSCP dBm= −
Furthermore, the measured RSCP either on the DPCCH (Dedicated Physical Control Channel)
of a Radio Link Set or on the PRACH is used for the SIR estimation for UL / DL power control
as [8]:
RSCPSIR SF
ISCP= ×
Where, ISCP (Interference Signal Code Power) is the interference on the received signal and
SF (Spreading Factor) is the spreading factor used on the DPCCH / PRACH. In the case of
open-loop power control, the RSCP measured at the UE is directly used by higher protocol
layers within the system. Although the RSCP measurement at the UE side is not directly used
for UL closed-loop power control, it provides us insight into the behavior of the power control

Characterization of Uplink Transmit Power and Talk Time in WCDMA Networks
23
mechanism and the effects of external factors such as propagation loss and the distance
between the UE and BTS.
The empirical UL-DL (Uplink-Downlink) power relationship model is now presented, based on
the measurement results. Examining the UL-DL power relationship using CPICH (Common Pilot
Channel) RSCP (Received Signal Code Power) provides useful information about channel and
network conditions such as locations of active BTSs (Base Transceiver Station). The scatter
plots of transmit power versus the RSCP are employed here to infer the environmental
effects. Equations 3.1 and 3.2 are presented below to help better understand the relationship
between RSCP and transmit power.
RSCP = BS transmit power – Path Loss – Shadowing – Fading (DL) (3.1)
BS received power = MS transmit power – Path loss – Shadowing – Fading (UL) (3.2)
In the equations 3.1 and 3.2, the BS transmit power and the BS received power are constant.
Thus, RSCP and MS transmit power are directly related with the exception of multipath fading
which is independent of uplink and downlink. Note, BS is the base station and MS is the
mobile station.

Characterization of Uplink Transmit Power and Talk Time in WCDMA Networks
24
Figure 2-14: PDF’s and 3D scatter plots for Outdoor Public and Indoor Public
scenarios

Characterization of Uplink Transmit Power and Talk Time in WCDMA Networks
25
The scatter plots for Outdoor Public, Indoor Public, Home, and Transit usage scenarios are
shown in Figures 2-14 and 2-15. The linear UL-DL power relationship model on each plot is
obtained by linear regression estimation. The linear equations for each usage scenario are
given in Table 2-5. The scatter plot for each usage scenario reveals a distinct shape. In
particular, the peaks of the 3D scatter plots differ significantly for each usage scenario.
However, all of the plots and the UL-DL power relationship models show one common
pattern; As the RSCP increases, the transmit power tends to decrease. This result agrees with
Figure 2-15: PDF’s and 3D scatter plots for Home and Transit scenarios

Characterization of Uplink Transmit Power and Talk Time in WCDMA Networks
26
our intuition that closer active base stations (thus path loss is smaller) results in lower
transmit power of the UE.
No. Usage Scenario
UL-DL Power Relationship Model
(y = Transmit Power in dBm,
x = RSCP in dBm)
1 Home y = -0.72x – 72
2 Transit y = -0.76x – 78.4
3 Outdoor Public y = -0.83x – 85
4 Indoor Public y = -0.86x – 83.5
Table 2-5: UL-DL power relationship for each usage scenario.
From Figures 2-14 and 2-15, it can be observed that, for a given RSCP value, the transmit
power values fluctuate around the straight line fit obtained using linear regression. This
variation is caused by the small scale fading effects on the uplink and the downlink and hence
can be used to compare the fading effects in the 4 usage scenarios. The standard deviation of
the transmit power values (deviation from the straight line fit obtained using linear
regression) are calculated in dBm and presented in Table 2-6. The standard deviation was the
highest (13.8 dB) in the ‘Indoor Public’ scenario which indicates that the effect of small scale
fading is more dominant in this scenario.

Characterization of Uplink Transmit Power and Talk Time in WCDMA Networks
27
No. Usage Scenario Standard Deviation
1 Home 6.2 dB
2 Transit 8.3 dB
3 Outdoor Public 7.1 dB
4 Indoor Public 13.8 dB
Table 2-6: Standard deviation of transmit power from the linear regression model
2.5 Impact of network loading on the uplink transmit power
In a WCDMA system, since all the users use the same bandwidth, the interference from other
users will affect the uplink transmit power. In order to determine the impact of network
loading on the uplink transmit power, measurements were conducted at the same location,
but at different times of the day (peak and off-peak hours). The measurements were taken in
two locations – Location 1 and Location 2. Location 1 is in a sub-urban area (Northern Virginia)
while Location 2 is in an urban area (Washington DC). A total of 5 tests were performed at
these two locations. For this particular experiment, it is assumed that the network loading
levels are higher during peak hours and lower during off-peak hours.
Results / Observations
1) At the first location (Test 1-1), the mean uplink transmit power was relatively constant,
irrespective of the time (peak / off-peak hour) at which the measurement was taken. One
possible reason is that the population (and the 3G device usage) is relatively low in this
area.
2) At the second location (Tests 2-1 to 2-4), noticeable changes in uplink transmit power [up

Characterization of Uplink Transmit Power and Talk Time in WCDMA Networks
28
to 3-4 dB] are observed depending on the time of the measurement, especially in Tests 2-
1 to 2-3. Note that the positive values indicate that the mean transmit power value was
higher during the peak hours as compared to the value during off-peak hours. The results
are summarized in Table 2-7.
Test
No.
Difference in Mean Transmit Power value
between peak and off-peak hours (dB)
1-1 +0.1
2-1 +4.5
2-2 +3.0
2-3 +2.5
2-4 +1.1
Table 2-7: Impact of network loading on the transmit power
In summary, we can conclude that in sub-urban locations (Location 1), the uplink transmit
power is only slightly affected by the time of the call. However in urban locations (Location
2), the variation in transmit power during peak and off-peak hours is much more noticeable
(around 1.1 – 4.5 dB). Another important factor is that the 3G network usage is still relatively
low. [As of February 2008, 13 percent of AT&T customers own a 3G device]. Hence, it is
possible that even during the peak hours, the 3G network is possibly not fully loaded and thus
the impact on the uplink transmit power is not very high.

Characterization of Uplink Transmit Power and Talk Time in WCDMA Networks
29
2.6 Comparison with the CDG report
In this section, the uplink transmit power distributions obtained from the measurements are
compared to those reported by the CDG – Urban and Sub-urban profiles. The two CDG profiles
are shown in Figures 2-16 and 2-17. The mean values for the CDG urban and sub-urban
profiles are found out to be 5.4 dBm and 10.6 dBm respectively.
Figure 2-16: PDF of the transmit power for CDG suburban profile (Mean = 10.6 dBm, Standard
Deviation = 15.6 dBm)

Characterization of Uplink Transmit Power and Talk Time in WCDMA Networks
30
Figure 2-17: PDF of the transmit power for CDG urban profile (Mean = 5.4 dBm, Standard
Deviation = 12.0 dBm)
Combining all the transmit power data collected from the measurements yields the transmit
power distribution in Figure 2-18. Incidentally, the mean value of this distribution is found to
be 5.4 dBm, which is same as that of the CDG urban profile. However the shapes of the 3
PDF’s are very different from each other. Also, the PDF in Figure 2-18 is plotted by equally
weighing the data collected in all the locations which might not be truly indicative of the
actual mobile usage patterns. A more accurate characterization would include weighing the
data collected at each location / usage scenario according to the actual mobile usage
patterns. However this was not considered because of the unavailability of such information.
Characterization of Uplink Transmit Power and Talk Time in WCDMA Networks
31
Figure 2-18: PDF of the transmit power from experimental results (Mean = 5.6 dBm, Standard
Deviation = 11.4 dBm)
2.7 Conclusions
This chapter described the WCDMA uplink transmit power measurements and presented the
PDF’s of the transmit power in different locations and usage scenarios. The mean transmit
power values in the outdoor locations were typically around -14 to -18 dBm while those in the
indoor locations were around 4 to 10 dBm. The highest fluctuation in transmit power levels
occurred for the two ‘transit’ scenarios – while travelling in a car and on the metro, as
expected, because of the dynamically varying channel conditions. The highest mean transmit
power value observed was around 13.6 dBm in the ‘Restaurant’ location while the lowest
value was -18.1 dBm in the ‘Street’ location. The impact of the handset position and network
loading on the uplink transmit power were analyzed. The relationship between the uplink
transmit power and the RSCP was presented for the four usage scenarios. Finally, the transmit

Characterization of Uplink Transmit Power and Talk Time in WCDMA Networks
32
power data from all the measurements was combined and plotted as a single distribution. The
mean transmit power value of this distribution was similar to that of the CDG urban profile,
while it was around 5 dB less than the CDG sub-urban profile.

Characterization of Uplink Transmit Power and Talk Time in WCDMA Networks
33
CHAPTER 3 WCDMA Mobile Phone Talk Time Experiments
The 3G handset’s worldwide adoption rate is increasing as more functions and features are
being integrated. Phones now have multimedia applications for video cameras, megapixel
camera modules and auto focusing cameras, white LEDs for camera flash and flashlight, MP3
players and Java games. To increase network coverage, many phones are dual-mode
GSM/GPRS+CDMA, GSM/GPRS+W-CDMA, or they have WLAN capabilities. Such rich feature sets
couple with the linearity specifications imposed by the WCDMA standard, challenge battery
power consumption and battery life. Thus, battery power conservation (increasing the talk-
time) has become one of the key priorities of 3G handset designers.
For any cellular handset, the standby time will exceed the talk time by at least a factor of 10.
More specifically, the power consumed by the transmit circuitry during a call will typically be
three to four times that used in receive [7]. Dominating the transmit power consumption is
the RF power amplifier (PA), a component whose efficiency today is typically only around 30%
to 40% for CDMA and WCDMA handsets. In a mobile phone, the PA is the component with the
highest current consumption. Effectively reducing the PA average current (in effect, reducing
the battery current consumption) can increase talk time.
Although improvements in battery technologies continue to be made, there is still
considerable focus on designing techniques to improve the power amplifier efficiency.
Handset owners also want smaller and lighter phones, which limits the size and capacity of
the battery pack. Since the PA can account for as much as 40 to 50 percent of power
consumption, a major focus is being placed on efficiency improvements in the PA solution.

Characterization of Uplink Transmit Power and Talk Time in WCDMA Networks
34
This chapter discusses the relationship between the talk time and the probability distribution
function (PDF) of the uplink transmit power by performing experiments with 4 different
phones for different PDF’s. Two types of talk time experiments were conducted
• Lab Experiments – These experiments were conducted in the laboratory using the base
station emulator.
• Field Experiments – These experiments were conducted in the AT&T’s WCDMA network.
In addition to these two experiments, the current drawn from the battery at each uplink
power level was measured, thus enabling us to predict the “theoretical” talk times based on
the PDF of the transmit power and the total current rating of the battery.
3.1 Laboratory experimental setup and procedure
The primary objective of these experiments was to find out how the talk time of a 3G phone
varies with the uplink transmit power distribution. This is done with a view of establishing a
relationship between the talk time and the transmit power statistics – mean and standard
deviation. The following four phones were chosen for these talk time experiments
• Motorola Q - High Performance Windows Mobile 6.0 smart phone with a 325 MHz
processor, 128 MB RAM and features such as GPS, Corporate email etc.
Predicted talk time is up to 9 hours.
• Nokia N75 - Smart phone running on Symbian OS, QVGA main display, large external
display with advanced camera and music controls.
• LG CU500 - Multimedia phone including features such as includes high speed video,
streaming TV. Music player with 3D stereo sound etc. First carrier-
offered HSDPA phone in US.
Characterization of Uplink Transmit Power and Talk Time in WCDMA Networks
35
• Samsung Sync – Samsung’s first high-end HSDPA phone in the US. Heavily music-
oriented device (supports AT&T Music). Features include LCD
display, 2 MP camera etc.
The talk-times results for 4 phones operating in different scenarios (6 different transmit
power profiles) are presented. Each phone was programmed to transmit power according to
the 6 profiles obtained from the measurements discussed in Chapter 2. The 6 different
transmit power profiles used are:
• PDF of the ‘Indoor Public’ scenario
• PDF of the ‘Outdoor Public’ scenario
• PDF of the ‘Home’ scenario
• PDF of the ‘Transit’ scenario
• CDG Sub-urban PDF.
• CDG Urban PDF.
The equipments used for the talk time experiments in the laboratory were the Agilent’s
E5515C Wireless Communications Test Set and Willtek’s 4921 RF Shield Box. The E5515C test
set was used as the base station emulator. The Willtek’s RF shield box was used to minimize
interference from adjacent mobile phones, the local base station and to isolate the
environment from the RF emitted from the phone. A C++ program running on a laptop
controlled the base station emulator, causing it to change its ‘UE Target power’ parameter
according to the specific PDF of the uplink transmit power (The E5515C device sets its
receiver input power level to the value of the ‘UE Target Power’ setting). In order to simulate
a conversation, an mp3 player and speaker were used to play the recorded voice files [with a
voice activity of approximately 40%] inside the RF shield box. The experimental setup for the

Characterization of Uplink Transmit Power and Talk Time in WCDMA Networks
36
laboratory experiments is shown in Figure 3-1 and the Agilent E5515C test set is shown in
Figure 3-2.
Figure 3-1: Experimental setup for the laboratory talk-time tests
Figure 3-2: Agilent E5515C Wireless Communications Test Set

Characterization of Uplink Transmit Power and Talk Time in WCDMA Networks
37
The talk-time experiments conducted in the laboratory closely followed the procedure
detailed by the CDMA Development Group in the report “CDG System Performance Tests,
Revision 3.0, CDG 35, April 2003” [2].
The following is the sequence of steps followed while conducting the experiment.
1) The battery of the mobile phone was fully charged.
2) The phone was placed in the RF shield box and the RF port of the shield box was
connected to the RF IN/OUT connector of the base station emulator.
3) The laptop was connected to the base station emulator through the GPIB (General Purpose
Interface Bus) port.
4) An external software (C++ program) running on the laptop controlled the “UE Target
Power” parameter of the base station emulator. The software changed this parameter
such that the phone is controlled to transmit at the desired power level for the desired
time duration.
5) The E5515C device sets its receiver input power level to the value of the ‘UE Target Power’
setting.
UE Target Power = Uplink Transmit Power – Path Loss
6) Once the uplink path loss is determined, the uplink transmit power can be controlled
indirectly by controlling the ‘UE Target Power’ parameter at the base station emulator.
The uplink path loss varied slightly between experiments / phones. Hence the path loss
was calculated before each experiment.
7) The phone was switched on and a recorded audio file was played on the mp3 player.
8) The base station emulator controlled the handset as per the desired transmit power
distribution. Power Control was done as follows.
Characterization of Uplink Transmit Power and Talk Time in WCDMA Networks
38
• The mobile handset's transmit power had a dwell time of 2 seconds per each percent
of probability. Example – For a probability of 3%, the dwell time was 6.00 seconds.
• Initially the transmit power was set to the minimum value.
• At the end of each dwell time, the transmit power level was increased by 1 dB.
• Once the transmitter reached maximum power (typically 23 dBm), the transmit power
was decreased after each dwell time until it reached the minimum value.
9) The above procedure was continued until the battery was exhausted.
3.2 WCDMA laboratory and field talk-times
In this section, the results from the talk time experiments conducted in the laboratory are
discussed. In addition to these tests, talk time experiments were also conducted in the field
in AT&T’s 3G network in order to cross check the talk time results in the laboratory.
3.2.1 Laboratory experiment talk-times
The talk time experiments were performed for each of the 4 phones [Samsung Sync, Motorola
Q, Nokia N75 and LG CU500]. Each of these phones was programmed to transmit power
according to the six PDF profiles [four usage scenarios – indoor public, outdoor public, transit,
home and the two CDG profiles – urban, sub-urban]. The talk-time results from these
laboratory experiments are summarized in Table 3-1.
Characterization of Uplink Transmit Power and Talk Time in WCDMA Networks
39
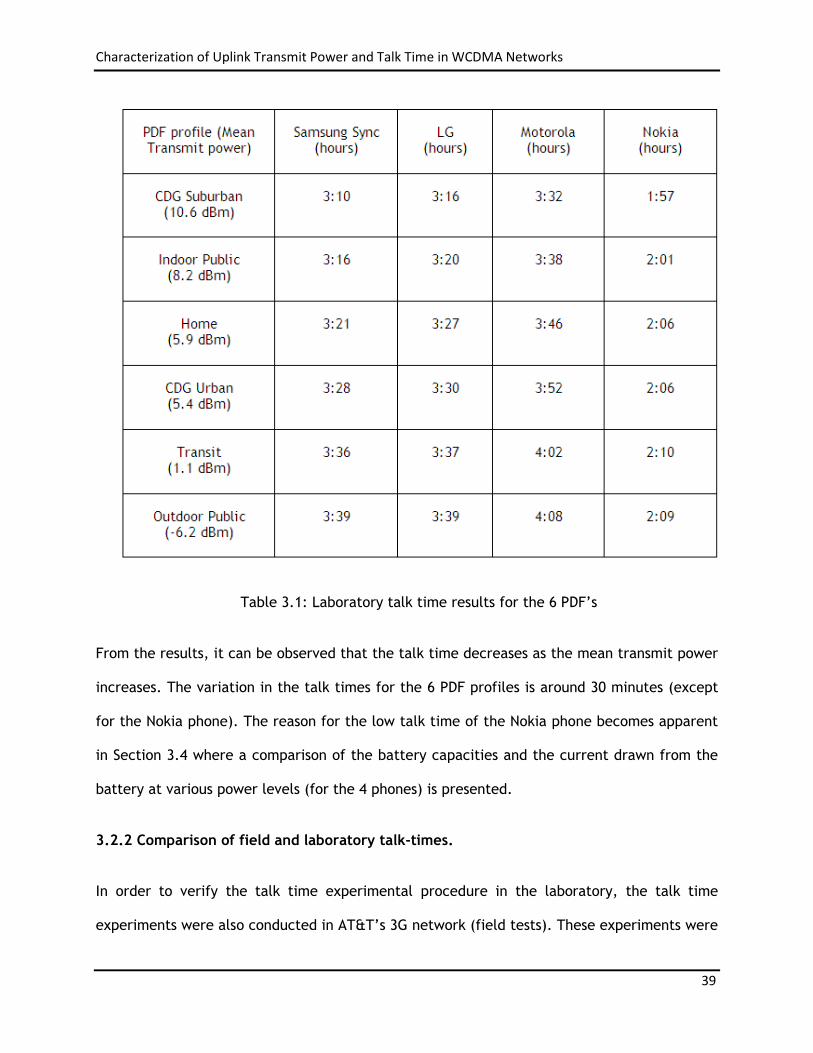
Table 3.1: Laboratory talk time results for the 6 PDF’s
From the results, it can be observed that the talk time decreases as the mean transmit power
increases. The variation in the talk times for the 6 PDF profiles is around 30 minutes (except
for the Nokia phone). The reason for the low talk time of the Nokia phone becomes apparent
in Section 3.4 where a comparison of the battery capacities and the current drawn from the
battery at various power levels (for the 4 phones) is presented.
3.2.2 Comparison of field and laboratory talk-times.
In order to verify the talk time experimental procedure in the laboratory, the talk time
experiments were also conducted in AT&T’s 3G network (field tests). These experiments were

Characterization of Uplink Transmit Power and Talk Time in WCDMA Networks
40
conducted at four different locations [Mall, Transit, Restaurant and Hotel]. The PDF profiles
collected at these 4 locations are presented in Figures 3-3 and 3-4.
During the field experiments, all the 3 phones were forced to lock onto 3G. They were placed
on a call simultaneously, with the Nokia N75 Qualipoc phone recording the uplink transmit
power data for the entire duration of the call. It was ensured that the antennas of all the
phones were oriented in the same direction so that the signal received from the base station
(and hence the uplink transmit power distribution) was the same (or close to the same) for all
the phones. This was necessary because an important assumption made here is that the uplink
transmit power distributions for all the phones is the same and can be approximated by the
data recorded in the QualiPoc software. A comparison of the talk times from the field and
laboratory experiments is given in Table 3-2.
(a) (b)
Figure 3-3: Transmit power PDF for the Mall (a) and Transit (b) scenarios

Characterization of Uplink Transmit Power and Talk Time in WCDMA Networks
41
(a) (b)
Figure 3-4: Transmit power PDF for the Restaurant (a) and Hotel (b) scenarios
Table 3-2: Comparison of the field and laboratory talk times

Characterization of Uplink Transmit Power and Talk Time in WCDMA Networks
42
Table 3-3: Field talk times as a percentage of the laboratory talk times
From Tables 3-2 and 3-3, it can be observed that the laboratory talk time values match
reasonably close to the field talk time values. The error margin is around 5 %, except for the
‘Transit’ measurements where the error margin is around 10% for the Motorola phone. A
possible reason for this larger variation is that the transmit power changed very quickly during
transit and the rate at which the software recorded the data was less than the rate of actual
uplink transmit power changes.
3.3 WCDMA theoretical talk-times
The theoretical talk times are beneficial for the operator and end-user, because this
procedure offers a much easier and quicker way to compare the talk times of WCDMA phones
from different manufactures. For a given probability distribution function, the discrete
weighing factors are determined for each power level. The current consumption of the phone
is then measured at the specified power levels and weighted with the specified weighting
factors. The sum of weighted current consumptions is then compared to the capacity of the
battery to calculate talk time for a WCDMA terminal [14].
Characterization of Uplink Transmit Power and Talk Time in WCDMA Networks
43
In order to estimate the theoretical talk time of a phone in a given scenario, the following
factors need to be determined.
1) The current drawn from the battery at each uplink power level.
2) The probability of transmitting at each uplink power level (obtained from the PDF).
3) The current rating of the battery (given in mAh).
For a given PDF, the average current drawn from the battery, can be calculated as per the
equation,
P = Power (Random Variable)
p(Pi) = Probability of the random variable, P (= Pi)
Ic(Pi) = Measured current consumption recorded at discrete power level Pi
Talk time = Current rating of the battery (mAh) / Average current (mA)
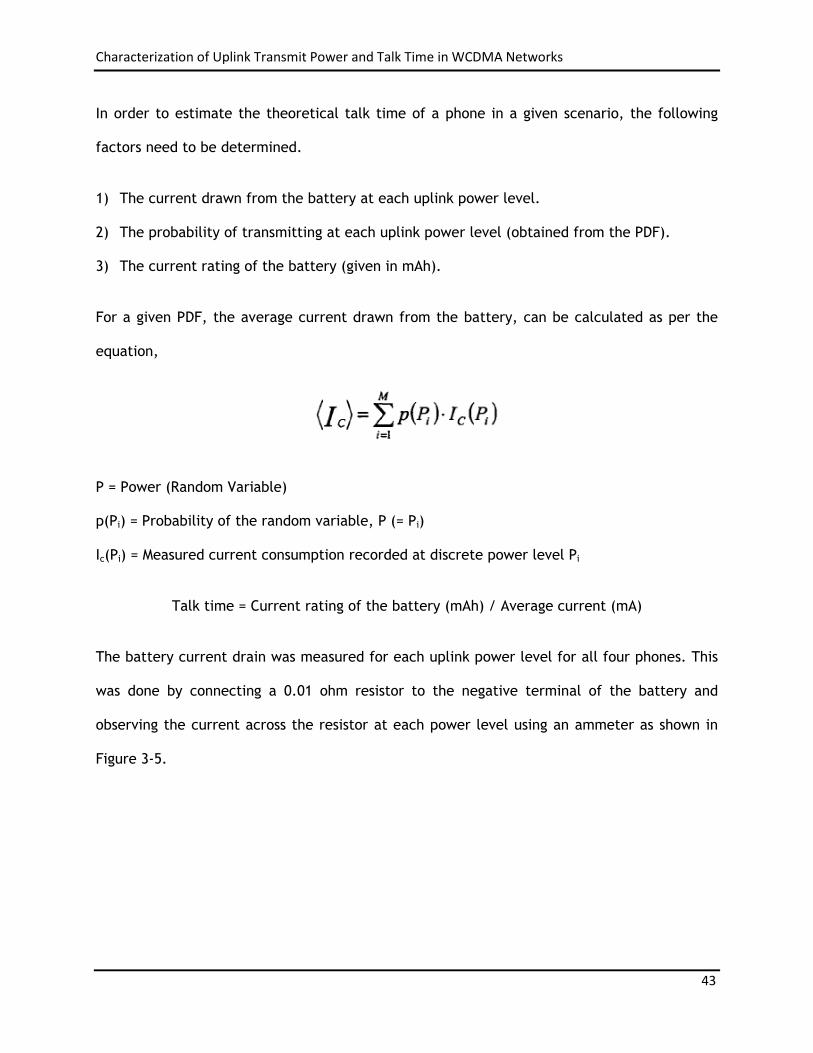
The battery current drain was measured for each uplink power level for all four phones. This
was done by connecting a 0.01 ohm resistor to the negative terminal of the battery and
observing the current across the resistor at each power level using an ammeter as shown in
Figure 3-5.

Characterization of Uplink Transmit Power and Talk Time in WCDMA Networks
44
Figure 3-5: Battery current measurement setup
The plots showing the relationship between the battery current consumption and the uplink
transmit power, for all the phones, are shown in Figure 3-6 below.
Figure 3-6: Battery current drain vs. Uplink transmit power

Characterization of Uplink Transmit Power and Talk Time in WCDMA Networks
45
From Figure 3-6, it can be observed that the current drawn by the Nokia phone is much higher
as compared to the other 3 phones, especially at low power levels. This phenomena, coupled
with the fact that the current rating of the Nokia phone battery is 800 mAh (less than the
other 3 batteries) explains the lower talk time values of the Nokia phone. The current ratings
of the phones are given below in Table 3-4.
Phone Current Rating
Nokia 800 mAh
Samsung 1100 mAh
LG 1100 mAh
Motorola 1130 mAh
Table 3-4: Advertised current ratings of the four phones
The average current values for the 4 phones for all the 10 PDF profiles (6 PDF profiles and the
4 PDF profiles from the field talk-time experiments) are summarized in Table 3-6. It can be
observed that as the mean transmit power value increases, the average current drawn from
the battery increases. The theoretical talk-times for a particular scenario were determined by
dividing the advertised current rating of the battery by the average current drawn for that
particular scenario.

Characterization of Uplink Transmit Power and Talk Time in WCDMA Networks
46
Table 3-5: Average battery current drain for the 4 phones
The theoretical and laboratory talk-time values for the 10 scenarios (6 usage scenarios and
the 4 PDF’s from the field talk-time tests) are summarized in Tables 3-6 and 3-8 respectively.
It can be observed that the laboratory talk-time values are reasonably close to the theoretical
values (around 85-90 %). One of the reasons for this discrepancy is that 100% of the battery
capacity is usually not available for Lithium-ion batteries. Li-ion battery systems are typically
equipped with a circuit that shuts down the system when the battery is discharged below a
predefined threshold. This is done in order to prevent ‘deep discharge’ of the battery
(Discharging below a certain point will cause a structural change within the battery and
reduce its capacity permanently). The typical discharge profile for a Lithium-ion battery is
shown in Figure 3-7 [15]. This shaded region in the figure highlights the unused battery
capacity. So, if 90-95% of the rated capacity is actually available, the theoretical talk times
would more closely align to the field and laboratory talk times (within 5 %)

Characterization of Uplink Transmit Power and Talk Time in WCDMA Networks
47
Figure 3-7: Typical discharge profile of a Lithium ion battery [15]
Table 3-6: Comparison of the theoretical and laboratory talk time values

Characterization of Uplink Transmit Power and Talk Time in WCDMA Networks
48
Table 3-7: Laboratory talk times as a percentage of the theoretical values
Table 3-8: Comparison of theoretical, laboratory and field talk times

Characterization of Uplink Transmit Power and Talk Time in WCDMA Networks
49
Table 3-9: Laboratory and field talk-times as a percentage of theoretical values
Based on the results in Tables 3-7 and 3-9, the theoretical talk times were found to be in
good agreement with the field and laboratory talk times and can be used to predict with
reasonable accuracy, the trends / variations in the talk time values for different PDF’s. It is
also noted that the results are generally consistent i.e., in most of the cases, the field talk
times were less than the laboratory talk times. Similarly, the theoretical talk times were
always greater than the field and laboratory talk times.
3.4 Overall Efficiency – Battery DC Power vs. Uplink Transmit Power
The current drawn from the battery is multiplied by the battery voltage (3.7 V) to obtain the
DC power drawn from the battery. The overall efficiency is calculated as follows,
Efficiency % = (Uplink Transmit Power / DC power drawn from the battery) * 100
The efficiency curves for the 4 phones are shown in Figure 3-8. The peak efficiency
(efficiency at the maximum output power) is around 8-10 % for all the phones. These
efficiencies are used to derive the corresponding power amplifier (PA) efficiencies in Chapter
4.

Characterization of Uplink Transmit Power and Talk Time in WCDMA Networks
50
Figure 3-8: Overall efficiency curves
3.5 Impact of the standard deviation of the PDF on talk time
In Sections 3-2 and 3-3, it was observed that the talk time of the phone increases as the mean
transmit power (of the PDF) was decreased. In this section, the impact of the standard
deviation (of the transmit power distribution) on the talk time is discussed. In order to
examine the impact of the standard deviation, three different PDF’s were created. For these
3 PDF’s, the mean of the transmit power distribution was kept constant, while the standard
deviation was varied. This experiment was repeated at four different power levels (0 dBm, 6
dBm, 11 dBm and 16 dBm). The transmit power statistics [mean and standard deviation
values] for the 12 PDF’s are shown in Table 3-10. Three sample probability distribution plots
are shown in Figure 3-9.

Characterization of Uplink Transmit Power and Talk Time in WCDMA Networks
51
PDF Mean
Transmit
Power (dBm)
Standard
Deviation of the
Transmit Power
(dBm)
Talk time
(min)
Average current
consumption
(mA)
Percentage of
time, the
transmit
power level is
<= 10 dBm
1 16 16.9 179 369 42 %
2 16 11.4 163 405 0 %
3 16 -inf 163 406 0 %
4 6 9.3 226 289 100 %
5 6 2.3 228 292 88 %
6 6 -inf 228 289 100 %
7 0 -1.4 234 282 100 %
8 0 -3.5 234 282 100 %
9 0 -inf 233 283 100 %
10 11 11.9 202 326 58 %
11 11 6.4 199 332 50 %
12 11 -inf 185 357 0 %
Table 3-10: Summary of the transmit power statistics for the 12 PDF’s
The theoretical talk times (for the LG phone) were calculated for these 12 PDF’s using the
procedure described in Section 3-3. A plot of the variation of talk time with the standard
deviation is shown in Figure 3-10.

Characterization of Uplink Transmit Power and Talk Time in WCDMA Networks
52
Figure 3-9 Probability distribution plots for PDF-1, PDF-2 and PDF-3 (same mean but
difference variance)
Figure 3-10: Variation of theoretical talk times with the standard deviation of the PDF for the
LG phone

Characterization of Uplink Transmit Power and Talk Time in WCDMA Networks
53
From the Figure 3-10, it can be observed that at low to moderate mean transmit powers, the
standard deviation of the PDF does not have a significant impact on the talk time. However
when the mean transmit power is very large (greater than 10 dBm), the large standard
deviation values have a noticeable impact on the talk time (difference of around 15 minutes).
This is consistent with our intuition because, the battery current consumption is relatively
constant until around 10 dBm and hence variation of transmit power around the mean does
not affect the battery current consumption too much. However, after 10 dBm, there is an
exponential increase in the battery current consumption and hence the talk time increases
noticeably with higher variance (Note: Higher variance means that the phone transmits at low
power levels i.e., less than 10 dBm, for a greater percentage of the time, as compared to the
lower variance case. This is shown in Table 3-10 and Figure 3-9)
3.6 Conclusions
This chapter discussed the relationship between the talk time and the PDF of the uplink
transmit power. In general, the talk-time decreased as the mean transmit power value
increased. In the case of higher mean transmit power values, the talk time also changed
noticeably with the variance (talk time increased when the variance is high). The variation in
the talk times for different usage scenarios / PDF’s is around 30-35 minutes (except for the
Nokia phone). The talk times values were lesser (by around 30-35 minutes) in the indoor
scenarios as compared to the outdoor scenarios. Femto cells and micro cells, which are
employed to boost the network coverage in houses and possibly other indoor locations, might
be helpful in improving the talk times (in indoor scenarios).
The laboratory talk-time values were found to be in good agreement with the talk-times from
the field tests with an error margin of less than 5% and the talk time results were consistent.

Characterization of Uplink Transmit Power and Talk Time in WCDMA Networks
54
The theoretical talk-time values were also calculated based on the relationship between the
battery current and uplink transmit power. The theoretical talk-times were found out to be
about 10-15% greater than the laboratory values. This is reason for this discrepancy is because
100% of the battery capacity is usually not available for Lithium-ion batteries. So, if 90-95% of
the rated capacity is actually available, the theoretical talk times would more closely align to
the field and laboratory talk times (within 5 %). The theoretical talk times are beneficial for
the operator and end-user, because this procedure offers a much easier and quicker way to
compare the talk times of WCDMA phones from different manufactures.

Characterization of Uplink Transmit Power and Talk Time in WCDMA Networks
55
Chapter 4 Design Goals for WCDMA Power Amplifiers
The circuit within a mobile phone that typically consumes the most power (sometimes as
much as half of the DC power supplied) is the RF power amplifier (PA), which converts DC
power from the battery into the RF signal that is transmitted through an antenna. Maximizing
the efficiency of the PA can allow for a reduction in battery size, prolonged battery life,
increased signal strength, or a combination of the three. Efficient amplifiers also generate
less heat, increasing the mobile phone lifetime and reliability.
A dominant trend in the telecommunication industry for the last few years has been the
introduction of wideband digital modulation systems such as the third generation (3G) cellular
system specification based on wideband code division multiple access (WCDMA). This trend
has had a profound effect on the requirements of the PA. In contrast to second generation
(2G) systems, such as GSM, the PA must now amplify a signal which has a fast changing
envelope, a high peak-to-average power ratio (PAPR) and a bandwidth that is on the order of
a few megahertz.
The UMTS standard imposes a system linearity requirement of –33 dBc (decibels relative to
the carrier) measured at a 5 MHz offset (i.e., 5MHz from the center frequency). To meet this
linearity specification, a WCDMA PA must operate at a power level reduced from saturation.
Operating in this “backed off” condition makes it extremely difficult for a WCDMA PA to
achieve a PAE of 50%. In addition to this, limitations in the linearity of the remainder of the
transmit chain (modulator) can force a more typical minimum requirement of –35 or –36 dBc.
Achieving such a stringent linearity requirement generally forces a trade-off in efficiency of
the PA.

Characterization of Uplink Transmit Power and Talk Time in WCDMA Networks
56
In this chapter, the impact of the WCDMA specifications on the PA efficiency is discussed.
Based on the transmit power distribution data presented in Chapter 2, the transmit power
levels where the PA efficiencies have to be improved in order to significantly increase the
battery life of WCDMA handsets are presented.
4.1 Impact of the WCDMA Specifications on PA Efficiency
For an RF power amplifier, power added efficiency (PAE) is defined as the ratio of the RF
power added by the amplifier to its DC power consumption. In other words, it is the ratio of
the difference between the output and input signal power to the DC power consumed by the
PA. Typically, power amplifier (PA) efficiencies are advertised at the maximum output power
PAE = 100*{[POUT]RF – [PIN]RF} / [PDC]AMLIFIER (4.1)
[POUT]RF = Power of the RF output signal.
[PIN]RF = Power of the RF input signal.
[PDC]AMLIFIER = DC Power consumed by the PA.
The power amplifiers designed for 2G GSM handsets typically have PAE’s greater than 50%.
But, in the case of WCDMA handsets, the PA efficiencies are only around 30-40% at the
maximum output power (+28 dBm). This is because of the stringent linearity requirements
imposed by the WCDMA standard. In this section, the reason for these requirements and the
subsequent impact on PA efficiency is discussed.
In order to obtain high power efficiency, power amplifiers must operate close to the
saturation region, exhibiting nonlinear distortion. This requires the average power level of the
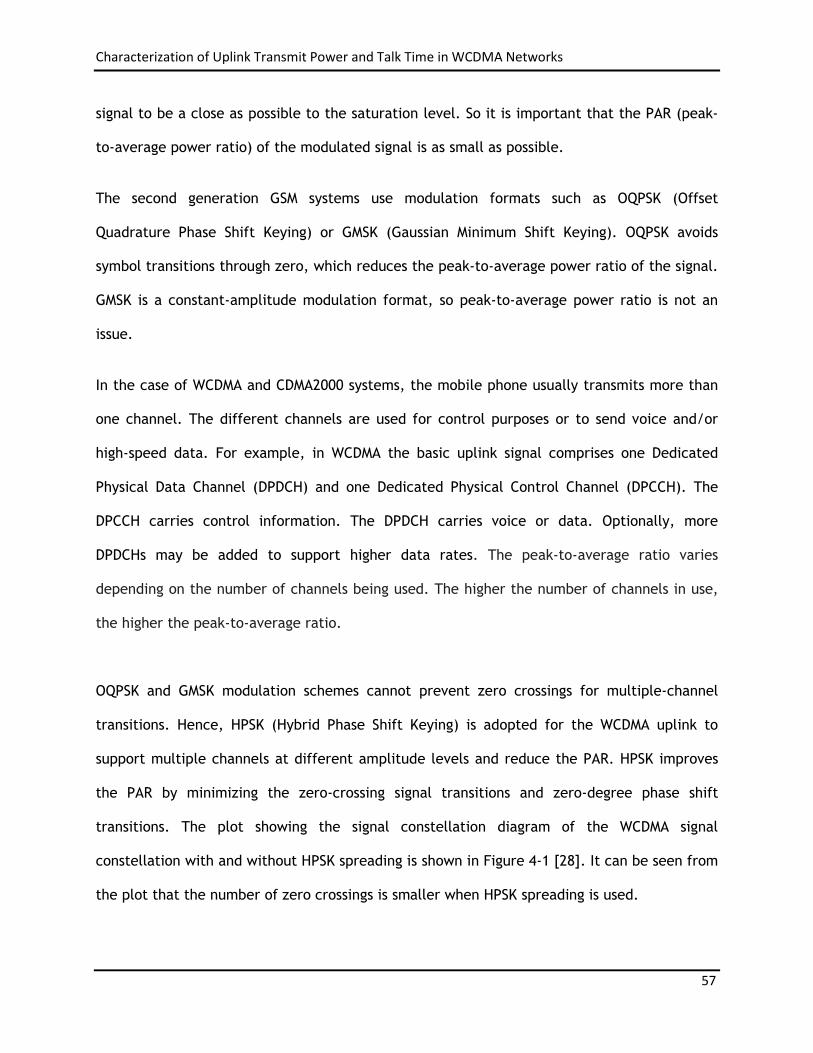
Characterization of Uplink Transmit Power and Talk Time in WCDMA Networks
57
signal to be a close as possible to the saturation level. So it is important that the PAR (peak-
to-average power ratio) of the modulated signal is as small as possible.
The second generation GSM systems use modulation formats such as OQPSK (Offset
Quadrature Phase Shift Keying) or GMSK (Gaussian Minimum Shift Keying). OQPSK avoids
symbol transitions through zero, which reduces the peak-to-average power ratio of the signal.
GMSK is a constant-amplitude modulation format, so peak-to-average power ratio is not an
issue.
In the case of WCDMA and CDMA2000 systems, the mobile phone usually transmits more than
one channel. The different channels are used for control purposes or to send voice and/or
high-speed data. For example, in WCDMA the basic uplink signal comprises one Dedicated
Physical Data Channel (DPDCH) and one Dedicated Physical Control Channel (DPCCH). The
DPCCH carries control information. The DPDCH carries voice or data. Optionally, more
DPDCHs may be added to support higher data rates. The peak-to-average ratio varies
depending on the number of channels being used. The higher the number of channels in use,
the higher the peak-to-average ratio.
OQPSK and GMSK modulation schemes cannot prevent zero crossings for multiple-channel
transitions. Hence, HPSK (Hybrid Phase Shift Keying) is adopted for the WCDMA uplink to
support multiple channels at different amplitude levels and reduce the PAR. HPSK improves
the PAR by minimizing the zero-crossing signal transitions and zero-degree phase shift
transitions. The plot showing the signal constellation diagram of the WCDMA signal
constellation with and without HPSK spreading is shown in Figure 4-1 [28]. It can be seen from
the plot that the number of zero crossings is smaller when HPSK spreading is used.

Characterization of Uplink Transmit Power and Talk Time in WCDMA Networks
58
(a) (b)
Figure 4-1: WCDMA Signal Constellation Diagram without HPSK (a) and with HPSK (b) (Agilent
Technologies [28])
Characterization of Uplink Transmit Power and Talk Time in WCDMA Networks
59
4.2 Power amplifier Efficiencies for the four phones
The power amplifier efficiencies (PAE) for the four phones (LG, Samsung, Motorola and Nokia)
were estimated from the overall efficiency curves (Total DC power drawn from the battery vs.
Uplink transmit power) shown in Figure 3-7 of Chapter 3. In order to calculate the PAE of an
amplifier, three parameters are required – [POUT]RF, [PIN]RF and [PDC]AMLIFIER (Equation 4.1). The
following approximations are made in order to derive the amplifier efficiencies.
1) The RF power input to the amplifier is very small compared to the RF power output. (RF
PA’s typically have a gain of around 15-20 dB across the output power range [17])
[PIN]RF ≈ 0 (4.2)
2) For WCDMA phones, the current consumption of the PA is assumed to be equal to 40 % of
the total current drawn from the battery1 [8],[38].
[PDC]AMPLIFIER = 0.4 * [PDC]TOTAL (4.3)
The above approximations were made because of the difficulty in obtaining the power
amplifier current data directly from the phone. Based on these approximations, the PAE of
the amplifier is derived from the overall efficiency as per equation 4.4. The efficiency curves
for the amplifiers in the 4 phones are shown in Figure 4-2.
PAEAMPLIFIER = 2.5 * EfficiencyOVERALL (4.4)
_________________________
1 In most of the literature, it is mentioned that the PA typically consumes about 40 – 50 % of the total power drawn
from the battery. Also, this percentage is not constant at all power levels. Typically the PA consumes slightly
greater percentage of total power at higher power levels. A constant value of 40 % has been chosen for
mathematical simplicity.
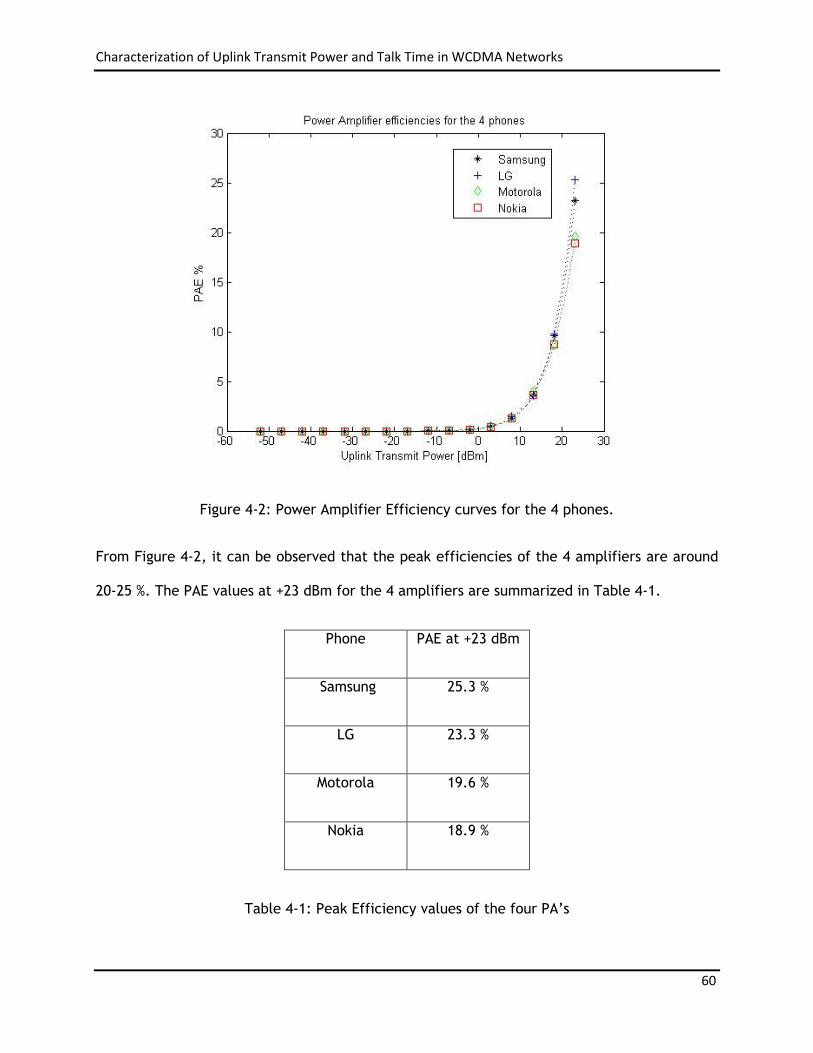
Characterization of Uplink Transmit Power and Talk Time in WCDMA Networks
60
Figure 4-2: Power Amplifier Efficiency curves for the 4 phones.
From Figure 4-2, it can be observed that the peak efficiencies of the 4 amplifiers are around
20-25 %. The PAE values at +23 dBm for the 4 amplifiers are summarized in Table 4-1.
Phone PAE at +23 dBm
Samsung 25.3 %
LG 23.3 %
Motorola 19.6 %
Nokia 18.9 %
Table 4-1: Peak Efficiency values of the four PA’s
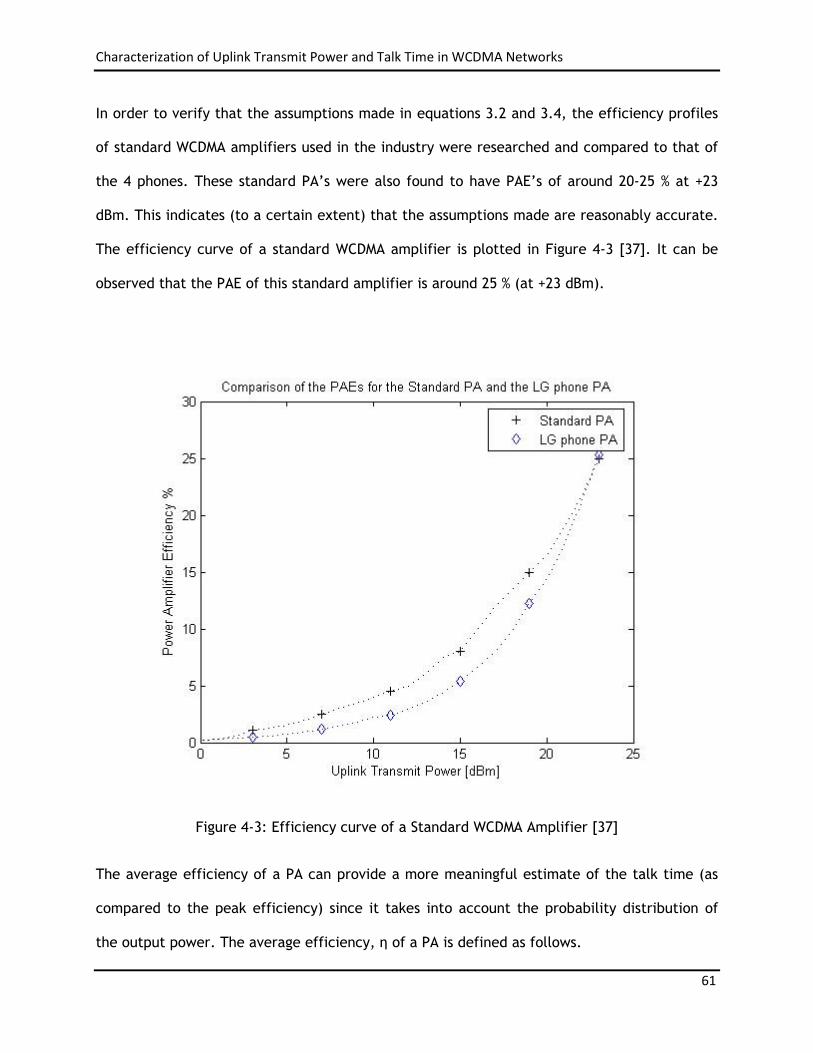
Characterization of Uplink Transmit Power and Talk Time in WCDMA Networks
61
In order to verify that the assumptions made in equations 3.2 and 3.4, the efficiency profiles
of standard WCDMA amplifiers used in the industry were researched and compared to that of
the 4 phones. These standard PA’s were also found to have PAE’s of around 20-25 % at +23
dBm. This indicates (to a certain extent) that the assumptions made are reasonably accurate.
The efficiency curve of a standard WCDMA amplifier is plotted in Figure 4-3 [37]. It can be
observed that the PAE of this standard amplifier is around 25 % (at +23 dBm).
Figure 4-3: Efficiency curve of a Standard WCDMA Amplifier [37]
The average efficiency of a PA can provide a more meaningful estimate of the talk time (as
compared to the peak efficiency) since it takes into account the probability distribution of
the output power. The average efficiency, η of a PA is defined as follows.

Characterization of Uplink Transmit Power and Talk Time in WCDMA Networks
62
Where, g(PL) is the transmit power distribution and f(PL) represents the DC power consumed
as a function of output power. The g(PL) used here is based on the 4 different scenarios
presented in Chapter 2 (Figures 2-2 to 2-5). The average efficiency values were calculated for
the 4 PA’s over the entire transmit power range [-54 to + 23 dBm]. The reason for the low
average efficiency values (< 1%) is because at low output powers, the DC power drawn from
the battery is around 1 W, while the RF output is of the order of a few milli watts (or less).
Since, the phone transmits at low output powers for a greater percentage of the time, the
average efficiency is drastically reduced.
Phone Avg Efficiency,
Outdoor Public
Avg Efficiency,
Transit
Avg Efficiency,
Home
Avg Efficiency,
Indoor Public
Motorola 0.06 % 0.35 % 0.98 % 1.60 %
Samsung 0.04 % 0.33 % 0.93 % 1.54 %
LG 0.06 % 0.31 % 0.90 % 1.49 %
Nokia 0.05 % 0.26 % 0.79 % 1.30 %
Table 4.2: Average efficiencies of the 4 PA’s
The average efficiencies are lower for the ‘Outdoor Public’ and ‘Transit’ scenarios (less than
0.4 %) as compared to the other two scenarios because the mean transmit powers are much
lower for these two scenarios. Further, the peak efficiency for the Motorola phone is lower
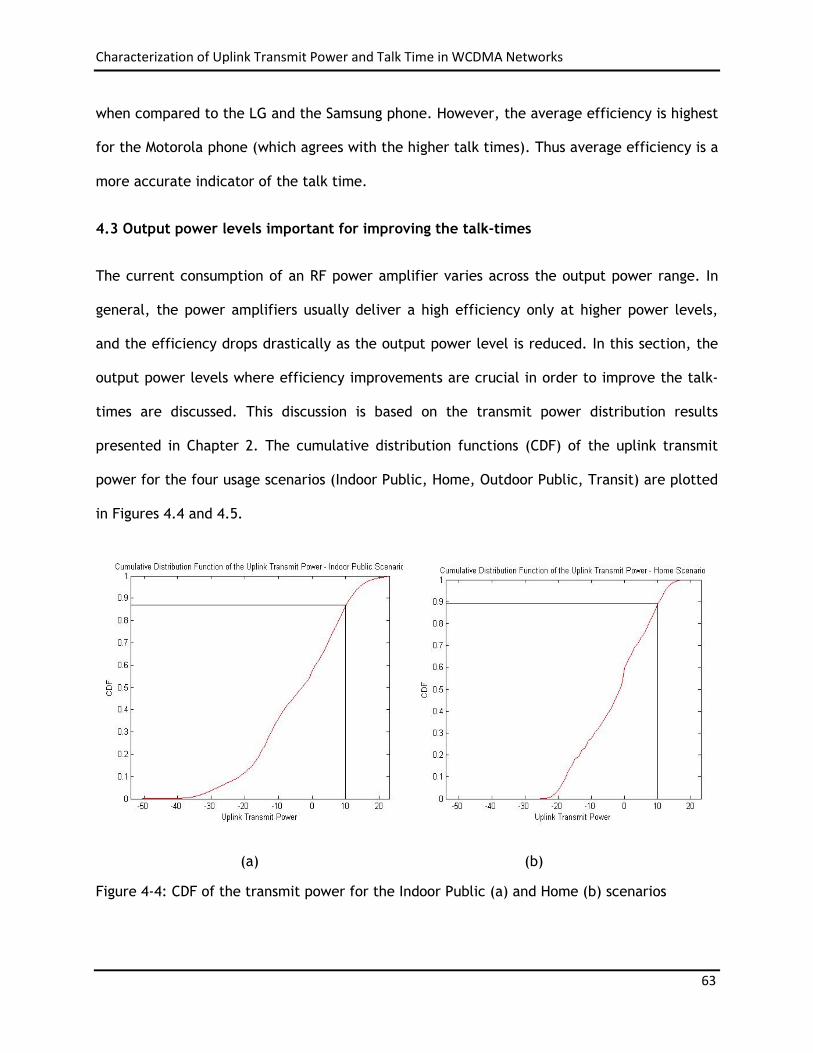
Characterization of Uplink Transmit Power and Talk Time in WCDMA Networks
63
when compared to the LG and the Samsung phone. However, the average efficiency is highest
for the Motorola phone (which agrees with the higher talk times). Thus average efficiency is a
more accurate indicator of the talk time.
4.3 Output power levels important for improving the talk-times
The current consumption of an RF power amplifier varies across the output power range. In
general, the power amplifiers usually deliver a high efficiency only at higher power levels,
and the efficiency drops drastically as the output power level is reduced. In this section, the
output power levels where efficiency improvements are crucial in order to improve the talk-
times are discussed. This discussion is based on the transmit power distribution results
presented in Chapter 2. The cumulative distribution functions (CDF) of the uplink transmit
power for the four usage scenarios (Indoor Public, Home, Outdoor Public, Transit) are plotted
in Figures 4.4 and 4.5.
(a) (b)
Figure 4-4: CDF of the transmit power for the Indoor Public (a) and Home (b) scenarios

Characterization of Uplink Transmit Power and Talk Time in WCDMA Networks
64
(a) (b)
Figure 4-5: CDF of the transmit power for the Outdoor Public (a) and Transit (b) scenarios
From the Figures 4-4 and 4-5, it can be observed that transmit power is less than (or equal to)
10 dBm for around 90% of the time in all the four usage scenarios (More than 97 % of the time
for ‘Outdoor Public’ and ‘Transit’ scenarios). This indicates that the current consumption of
the PA at low power levels (less than 10 dBm) has to be reduced in order to improve the talk
time.
At low power levels, the power amplifier consumes higher current compared to its output
power. Therefore, we can increase the talk-time by reducing the current at the low power
levels. Design techniques that improve the efficiency at low power levels and at the same
time allow full specification compliance at high power will be extremely important in order to
increase the talk times. Efficient reduction of current at low power levels also brings an
added benefit of low thermal rise in the handset.

Characterization of Uplink Transmit Power and Talk Time in WCDMA Networks
65
4.4 Techniques to reduce PA current consumption at low power levels
The author has conducted an extensive literature survey of the techniques that have been
proposed to reduce the PA current consumption at low power levels. An overview of each
technique as well as the reduction in PA current (as reported) and the possible improvements
in talk times are discussed. All these techniques are referred to as Low Power Efficiency
Enhancement (LPEE) Techniques.
Variable Quiescent Current Selection – In this technique, the PA efficiency at low power
levels is improved by reducing the quiescent bias point of the PA as the output power goes
down. The simplest method to achieve variable quiescent current is direct control by a digital
voltage (Vctrl) applied from the base-band controller of handset. The quiescent current of the
amplifier is controlled by the Vctrl. The control logic is designed to be switched at various
power thresholds, to achieve current reduction at low output power. This method can be
expanded to include two or more bias control inputs in order to achieve multiple quiescent
current levels. Depending on the transmitter power level, an optimum quiescent current is
selected. When the transmit power is high, the current consumption is unchanged (as
compared to a standard amplifier). However at low power levels, the current consumption is
reported to be reduced to as low as 33 mA [8].
Some of the concerns about this technique are that the digital control circuit can cause
problems like gain discontinuity, additional calibration of handsets. The power gains change
dramatically when switched from the high-power region to the low-power region which can
create problems in the power control loop operation of WCDMA systems. To overcome these
problems, other approaches such as the use of an analog biasing circuitry [18] have been
proposed to reduce the PA current.
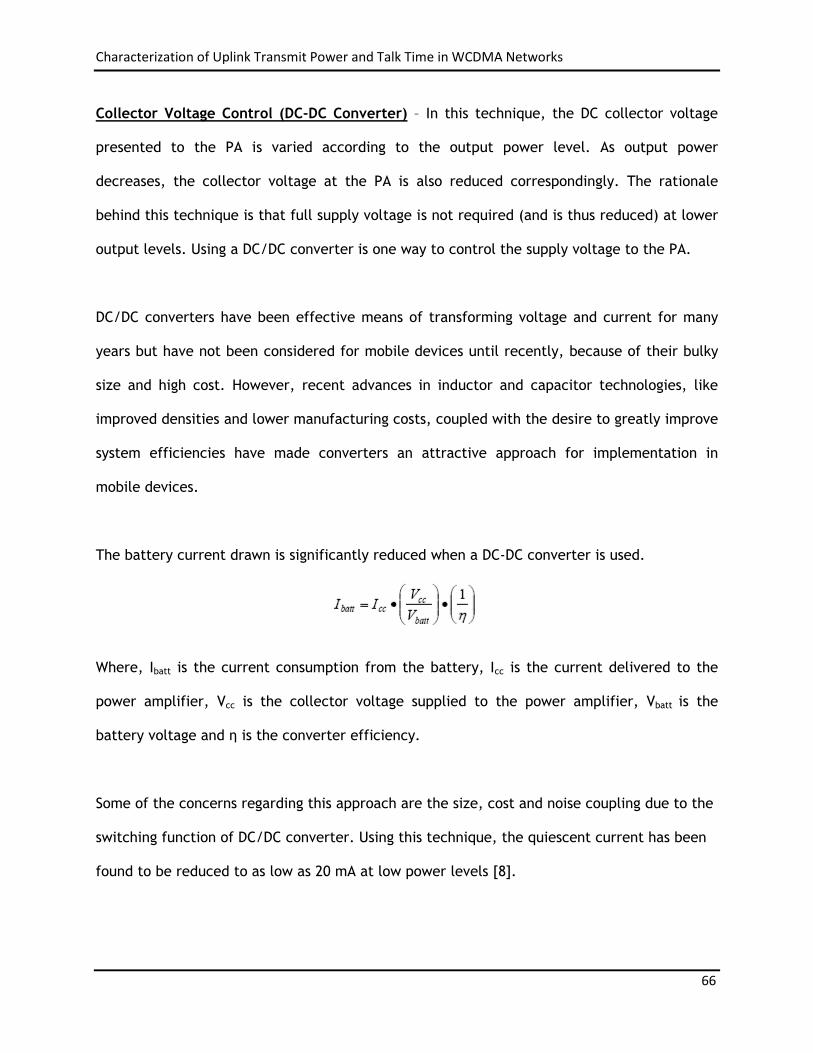
Characterization of Uplink Transmit Power and Talk Time in WCDMA Networks
66
Collector Voltage Control (DC-DC Converter) – In this technique, the DC collector voltage
presented to the PA is varied according to the output power level. As output power
decreases, the collector voltage at the PA is also reduced correspondingly. The rationale
behind this technique is that full supply voltage is not required (and is thus reduced) at lower
output levels. Using a DC/DC converter is one way to control the supply voltage to the PA.
DC/DC converters have been effective means of transforming voltage and current for many
years but have not been considered for mobile devices until recently, because of their bulky
size and high cost. However, recent advances in inductor and capacitor technologies, like
improved densities and lower manufacturing costs, coupled with the desire to greatly improve
system efficiencies have made converters an attractive approach for implementation in
mobile devices.
The battery current drawn is significantly reduced when a DC-DC converter is used.
Where, Ibatt is the current consumption from the battery, Icc is the current delivered to the
power amplifier, Vcc is the collector voltage supplied to the power amplifier, Vbatt is the
battery voltage and η is the converter efficiency.
Some of the concerns regarding this approach are the size, cost and noise coupling due to the
switching function of DC/DC converter. Using this technique, the quiescent current has been
found to be reduced to as low as 20 mA at low power levels [8].
Characterization of Uplink Transmit Power and Talk Time in WCDMA Networks
67
Load Switching Techniques – In this method, the output load is switched between low and
high power modes. Some of the load switching techniques that have been proposed are
Doherty amplifiers, parallel amplifiers, switch stage approaches etc. While each of these
techniques has significant differences in implementation and architecture, they improve the
PA efficiency at low power levels by increasing the output load. Most of the above mentioned
techniques require an output power level detection circuit. Of late, many variations of these
load switching techniques such as multi-stage Doherty amplifiers [27]. Using the load
switching technique, the current consumption at low power levels is found to be reduced to
around 30 mA [16].
Among the above techniques, the highest improvement in the current consumption (at low
power levels) has been achieved using the collector voltage control technique (as reported in
the references). Using the DC-DC converter, the lowest current consumption is reported to
be around 20 mA [8].
The PA current at low power levels is around 100 - 120 mA (almost 5 times higher) for the 4
phones used in the experiments. Hence employing the above LPEE (Low Power Efficiency
Enhancement) techniques can reduce the current consumption significantly and thus improve
the talk times. The PA current consumptions at low power levels for the 4 phones are
summarized in Table 4.3.

Characterization of Uplink Transmit Power and Talk Time in WCDMA Networks
68
Phone Current drawn at low power levels
LG 107 – 120 (mA)
Samsung 95 – 110 (mA)
Nokia 126 – 142 (mA)
Motorola 96 – 115 (mA)
Table 4.3: PA current consumption at low power levels
If the current consumption for the 4 phones can be reduced to 20 mA using the LPEE
techniques, there will be an improvement of around 35 – 45 % in the talk times of the 4
phones. The ‘Outdoor’ and ‘Transit’ scenarios will have the highest talk time improvement
(40-45% increase) as the phone is transmitting at low power levels for a greater percentage of
time (97%), in these scenarios. The improvements in talk times are summarized in Table 4.4.
Scenario
LG
Samsung
Nokia
Motorola
Indoor Public 37% 36% 40% 36%
Home 39% 39% 42% 38%
Outdoor Public 49% 47% 50% 43%
Transit 46% 45% 48% 45%
CDG Urban 43% 42% 46% 41%
CDG Sub-urban 37% 36% 54% 34%
Table 4.4: Talk-time improvements with reduced current consumption

Characterization of Uplink Transmit Power and Talk Time in WCDMA Networks
69
Further, the new average efficiency values were also calculated for the 4 PAs. The reduction
in current consumption at low power levels leads to an improvement of around 200 – 400 % in
the average efficiency values. These results are summarized in Table 4-5.
Phone Avg Efficiency,
Outdoor Public
Avg Efficiency,
Transit
Avg Efficiency,
Home
Avg Efficiency,
Indoor Public
Motorola 0.31 % 1.49 % 3.19 % 4.58 %
Samsung 0.30 % 1.50 % 3.10 % 4.56 %
LG 0.30 % 1.49 % 3.08 % 4.57 %
Nokia 0.30 % 1.48 % 3.06 % 4.43 %
Table 4-5: PA average efficiency improvement using LPEE techniques
While the above calculations are purely based on the current consumption values reported in
the references (and such improvements might not be fully realizable in practice), they are
still indicative of the tremendous opportunity for improving the talk times by reducing the PA
current at low power levels, especially considering that the current drawn by the 4 PA’s at
low power levels is around 100 – 120 mA.

Characterization of Uplink Transmit Power and Talk Time in WCDMA Networks
70
4.5 Conclusions
This chapter discussed the reasons for the low PA efficiencies in WCDMA handsets as
compared to GSM handsets. The PA efficiency curves for the 4 phones are estimated from the
overall efficiency values. The average efficiency values are also presented for the 4 PA’s.
Based on the transmit power distribution results in Chapter 2, it was shown that the PA
current consumption has to be reduced at low power levels in order to significantly improve
the talk times. Finally, the techniques used to reduce the PA current consumption at low
power levels [LPEE techniques] are discussed. It was shown that these techniques offered talk
time improvements of as much as 35 – 45 %.

Characterization of Uplink Transmit Power and Talk Time in WCDMA Networks
71
CHAPTER 5 Conclusions
The work in this thesis is of particular importance to the power amplifier industry in order to
improve the talk times of WCDMA handsets via better and more efficient PA designs. The
techniques reported in literature to reduce the current consumption of the PA at low power
levels need to researched further and integrated into the existing PA architectures in order to
significantly improve the mobile phones talk times in WCDMA networks.
The important contributions of this thesis are summarized below.
• Characterization of the uplink transmit power distribution based on current network
data and realistic usage scenarios.
• Investigation of the impact of the handset position and the network loading on the
uplink transmit power.
• Investigation of the relationship between the received signal code power and the
transmit power (UL-DL power relationship model).
• Characterization of the relationship between the battery life (talk times) and the PDF
of the transmit power.
• Comparison of the talk time estimates from field tests, lab tests and theoretical
expressions – The talk time results from these 3 tests are very close and are generally
consistent.
• Design Goals for WCDMA Power amplifiers – Investigation of the output power levels
where the PA efficiencies have to be improved in order to significantly increase the
battery life of WCDMA handsets.

Characterization of Uplink Transmit Power and Talk Time in WCDMA Networks
72
The important findings of this thesis can be summarized as follows.
• The difference in the transmit power levels between the indoor and outdoor locations
was found to be around 20-30 dBm and the resulting difference in talk times is around
30-35 minutes for all the 4 phones (except the Nokia N75 phone).
• The transmit power levels are less than 10 dBm for around 90% of the time in all the
four usage scenarios (More than 97 % of the time for ‘Outdoor Public’ and ‘Transit’
scenarios).
• The absolute difference in transmit power between having the phone near the head
and using bluetooth is around 1 - 5 dB in most of the locations (although there is no
trend as to which handset position yields higher transmit power). Using a bluetooth
hands-free device does not reduce the transmit power.
• The impact of network loading is more noticeable in the urban locations (difference of
1 - 5 dB in the transmit power levels) as compared to the sub-urban locations.
• The talk time estimates from the theoretical equations are within 5% of the talk times
obtained from the field and laboratory tests.
• The current consumption of the PAs has to be improved at low power levels in order to
significantly increase the battery life of WCDMA handsets.
• Average Efficiency of the PA provides a more accurate estimate of the talk time than
the peak efficiency.

Characterization of Uplink Transmit Power and Talk Time in WCDMA Networks
73
APPENDIX
A. Icons used on the Measurement Locations Map
Location
No. Location Name Icon Used
1 Mall
2 Office
3 University
4 Restaurant
5 Airport
6 Hotel
7 Downtown / Street
8 Metro station
9 Park
10 Apartment
11 House
Figure A-1: Icons used on the Measurement Location Maps
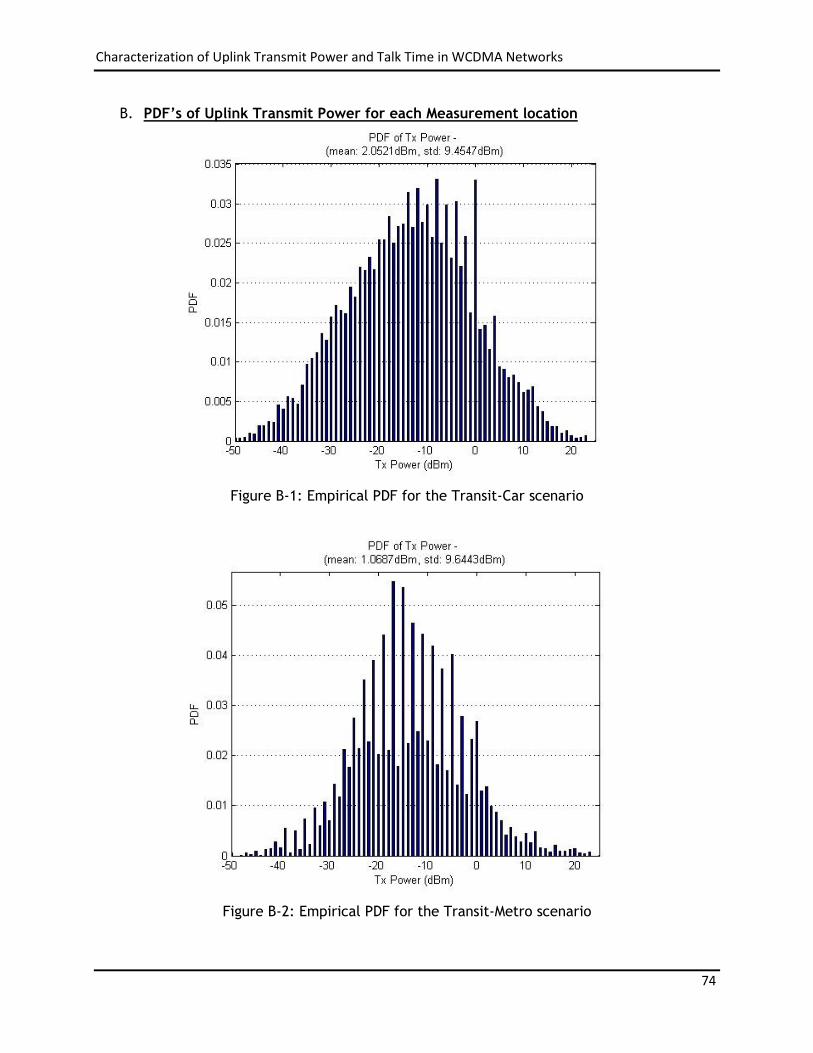
Characterization of Uplink Transmit Power and Talk Time in WCDMA Networks
74
B. PDF’s of Uplink Transmit Power for each Measurement location
Figure B-1: Empirical PDF for the Transit-Car scenario
Figure B-2: Empirical PDF for the Transit-Metro scenario

Characterization of Uplink Transmit Power and Talk Time in WCDMA Networks
75
Figure B-3: Empirical PDF for the Airport scenario
Figure B-4: Empirical PDF for the Hotel scenario

Characterization of Uplink Transmit Power and Talk Time in WCDMA Networks
76
Figure B-5: Empirical PDF for the Mall scenario
Figure B-6: Empirical PDF for the Office scenario

Characterization of Uplink Transmit Power and Talk Time in WCDMA Networks
77
Figure B-7: Empirical PDF for the Restaurant scenario
Figure B-8: Empirical PDF for the University scenario
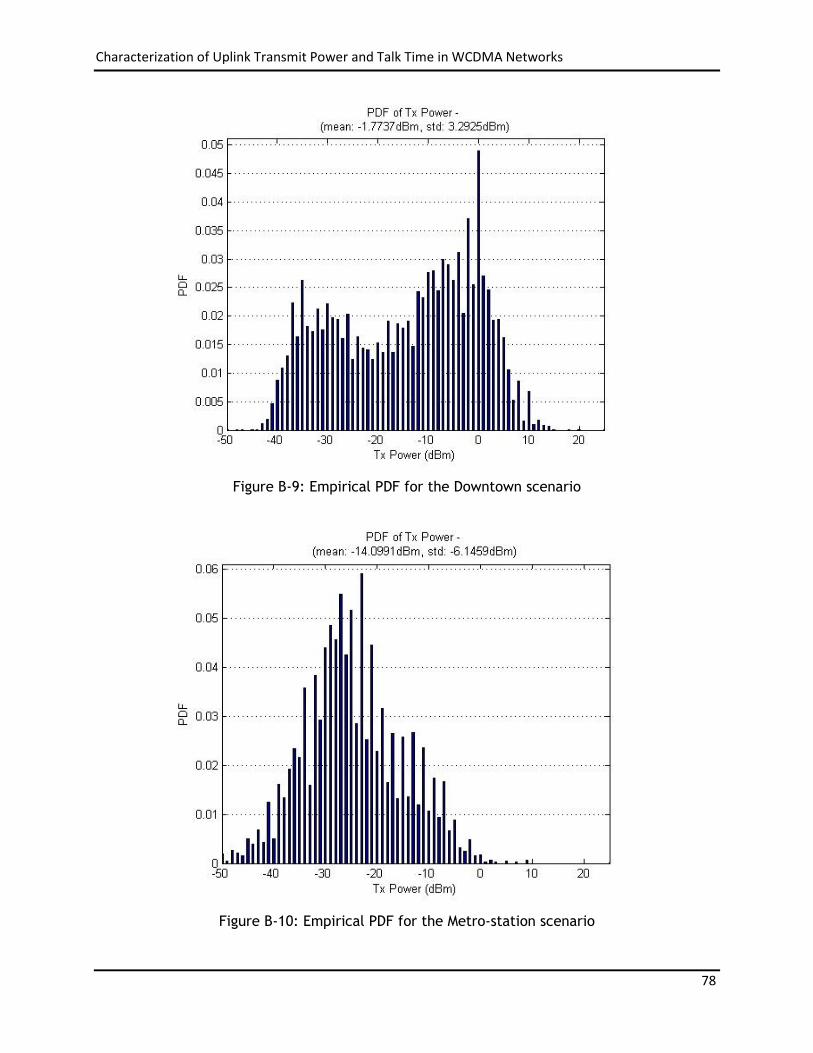
Characterization of Uplink Transmit Power and Talk Time in WCDMA Networks
78
Figure B-9: Empirical PDF for the Downtown scenario
Figure B-10: Empirical PDF for the Metro-station scenario

Characterization of Uplink Transmit Power and Talk Time in WCDMA Networks
79
Figure B-11: Empirical PDF for the Park scenario
Figure B-12: Empirical PDF for the Street scenario

Characterization of Uplink Transmit Power and Talk Time in WCDMA Networks
80
Figure B-13: Empirical PDF for the Apartment scenario
Figure B-14: Empirical PDF for the House scenario

Characterization of Uplink Transmit Power and Talk Time in WCDMA Networks
81
C. Impact of Handset position on the Uplink Transmit Power
Figure C-1: PDF’s for Ear & Bluetooth handset position - Airport
Figure C-2: PDF’s for Ear & Bluetooth handset position - Apartment

Characterization of Uplink Transmit Power and Talk Time in WCDMA Networks
82
Figure C-3: PDF’s for Ear & Bluetooth handset position - Downtown
Figure C-4: PDF’s for Ear & Bluetooth handset position - Hotel

Characterization of Uplink Transmit Power and Talk Time in WCDMA Networks
83
Figure C-5: PDF’s for Ear & Bluetooth handset position - House
Figure C-6: PDF’s for Ear & Bluetooth handset position - Mall

Characterization of Uplink Transmit Power and Talk Time in WCDMA Networks
84
Figure C-7: PDF’s for Ear & Bluetooth handset position - Metro
Figure C-8: PDF’s for Ear & Bluetooth handset position - Metro Station

Characterization of Uplink Transmit Power and Talk Time in WCDMA Networks
85
Figure C-9: PDF’s for Ear & Bluetooth handset position - Office
Figure C-10: PDF’s for Ear & Bluetooth handset position - Park

Characterization of Uplink Transmit Power and Talk Time in WCDMA Networks
86
Figure C-11: PDF’s for Ear & Bluetooth handset position - Restaurant
Figure C-12: PDF’s for Ear & Bluetooth handset position - Street

Characterization of Uplink Transmit Power and Talk Time in WCDMA Networks
87
Figure C-13: PDF’s for Ear & Bluetooth handset position - Transit-Car
Figure C-14: PDF’s for Ear & Bluetooth handset position - University

Characterization of Uplink Transmit Power and Talk Time in WCDMA Networks
88
Figure C-15: Transmit power distributions and 3D scatter plots for Test 2

Characterization of Uplink Transmit Power and Talk Time in WCDMA Networks
89
Figure C-16: Transmit power distributions and 3D scatter plots for Test 2
(cont’d)

Characterization of Uplink Transmit Power and Talk Time in WCDMA Networks
90
D. Impact of Network Loading on the Uplink Transmit Power
Figure D-1: Transmit power distributions and 3D scatter plots for Test 1.1

Characterization of Uplink Transmit Power and Talk Time in WCDMA Networks
91
Figure D-2: Transmit power distributions and 3D scatter plots for Test 2-1

Characterization of Uplink Transmit Power and Talk Time in WCDMA Networks
92
Figure D-3: Transmit power distributions and 3D scatter plots for Test 2-2

Characterization of Uplink Transmit Power and Talk Time in WCDMA Networks
93
Figure D-4: Transmit power distributions and 3D scatter plots for Test 2-3
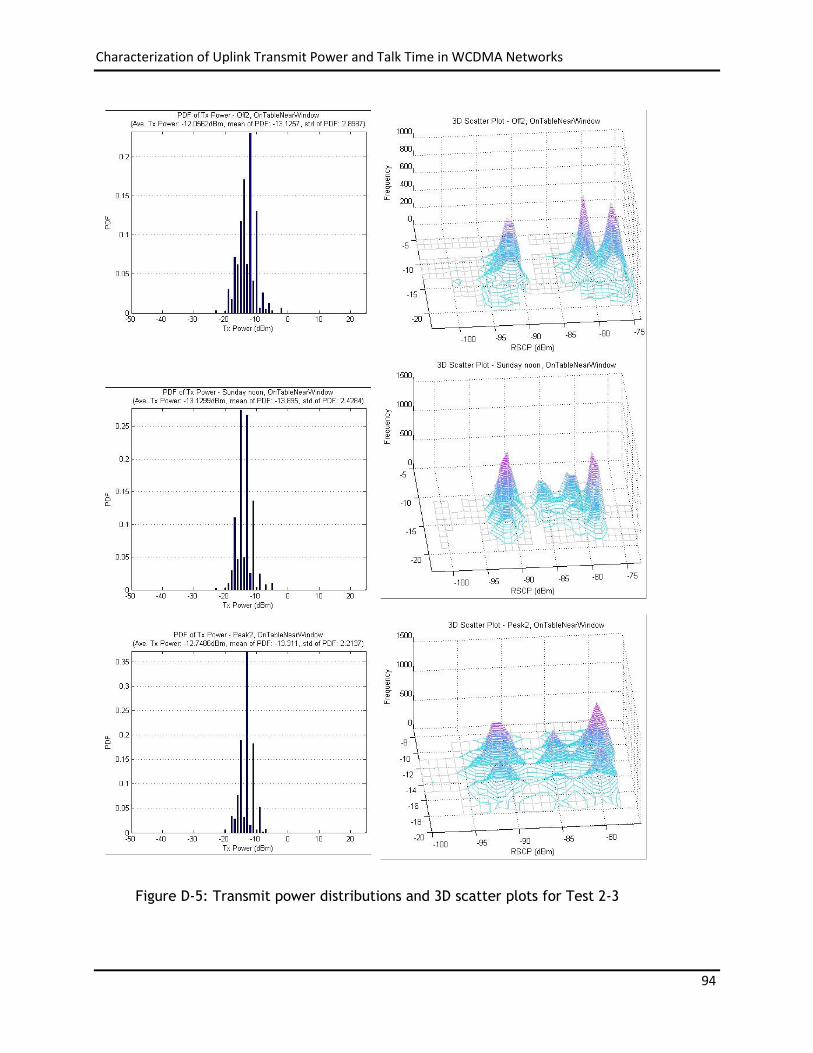
Characterization of Uplink Transmit Power and Talk Time in WCDMA Networks
94
Figure D-5: Transmit power distributions and 3D scatter plots for Test 2-3

Characterization of Uplink Transmit Power and Talk Time in WCDMA Networks
95
REFERENCES
[1] Sevic, J.F. “Statistical Characterization of RF Power Amplifier Efficiency for CDMA
Wireless Communication Systems”, Proc of IEEE Wireless Communications Conference,
1997.
[2] CDMA Development Group. “CDG System Performance Tests, Revision 3.0, CDG 35”, April
2003.
[3] Nielsen, J., Pedersen, G. F., Olesen, K. & Kovacs, I. Z. "Statistics of Measured Body Loss
for Mobile Phones", IEEE Transactions on Antennas and Propagation, September, 2001.
[4] Ebrahimi-Ganjeh, M.A. & Attari, A. R. “Interaction of Dual Band Helical and Pifa Handset
Antennas with Human Head and Hand”, Progress in Electromagnetics Research, PIER 77,
2007.
[5] 3G TS 25.214v4.6.0. “3rd Generation Partnership Project: Technical Specification Group
Radio Access Network; Physical Layer Procedures (FDD) (R4)”, March 2003.
[6] 3G TS 25.215v7.4.0. “3rd Generation Partnership Project; Technical Specification Group
Radio Access Network; Physical Layer – Measurements (FDD)”, Nov 2007.
[7] Bateman, A. “Extending Talk Time through Improved Transmitter Efficiency”, IEEE
Wireless Communications and Networking Conference, 1999.
[8] Thomas, F., Kerry, B., Nai-Shuo, C., Apostolos, S., Ede, E. & Stephan, R. “Efficiency
Improvement Techniques at Low Power Levels for Linear CDMA and WCDMA Power
Amplifiers”, 2002 IEEE Radio Frequency Integrated Circuits Symposium.
[9] Biranchinath, S. & Gabriel, A. “A High Efficiency WCDMA RF Power Amplifier with
Adaptive, Dual-Mode Buck-Boost Supply and Bias-Current Control”, IEEE Microwave and
Wireless Components Letters, March 2007.
[10] Chang, A. Avago Technologies, “PA design boosts 3G handset talk time handset”.
[11] Staudinger, J. Motorola Semiconductor Products Sector, ”An Overview of Efficiency
Enhancements with Application to Linear Handset Power Amplifiers”.

Characterization of Uplink Transmit Power and Talk Time in WCDMA Networks
96
[12] Waters, J., Mansell, A., McGeehan, J.P. & Bateman, A. “Power Efficiencies of Linear
Transmitter Architectures for Hand portable, Satellite Communications”, HPL-95-26,
March 1995.
[13] Mann, S., Beach, M., Warr, P. & McGeehan, J. “Increasing the talk-time of mobile radios
with efficient linear transmitter architectures”, Electronics and Communication
Engineering Journal, April 2001.
[14] Lilja, H. & Mattila, H. “WCDMA Power Amplifier Requirements and Efficiency
Optimization Criteria”, IEEE MTT-S Digest, 1999.
[15] AVR453: Smart Battery Reference Design, Application Note, Atmel Corporation, 2006.
[16] Teeter, D.A., Spears, E.T., Bui, H.D., Jiang, H. & Widay, D. ”Average Current Reduction
in WCDMA Power Amplifiers”, Radio Frequency Integrated Circuits (RFIC) Symposium,
2006 IEEE, Volume , Issue , 11-13 June 2006.
[17] Joongjin, N., Jin-Ho, S. & Bumman, K. “The Handset Power Amplifier using Continuous
Bias Control”.
[18] Kim, Y.W., Han, K.C., Hong, S.Y. & Shin, J.H. “A 45% PAE /18mA Quiescent Current CDMA
PAM with a Dynamic Bias Control Circuit”, IEEE Radio Frequency Integrated Circuits
Symposium, 2004.
[19] Junxiong, D., Prasad, G., Lawrence, E.L. & Peter, M.A. “A High-Efficiency SiGe BiCMOS
WCDMA Power Amplifier with Dynamic Current Biasing for Improved Average Efficiency”,
IEEE Radio Frequency Integrated Circuits Symposium, 2004.
[20] Hau, G., Turpel, J., Garrett, J. & Golladay, H. “A WCDMA HBT Power Amplifier Module
with Integrated Si DC Power Management IC for Current Reduction under Backoff
Operation”, IEEE Radio Frequency Integrated Circuits Symposium, 2007.

Characterization of Uplink Transmit Power and Talk Time in WCDMA Networks
97
[21] Fowler, T., Burger, K., Cheng, N.S., Samelis, A., Enobakhare, E. & Rohlfing, S.
“Efficiency Improvement Techniques at Low Power Levels for Linear CDMA and WCDMA
Power Amplifiers”, IEEE Radio Frequency Integrated Circuits Symposium, 2002.
[22] Lee, J., Potts, J., & Spears, E. “DC/DC Converter Controlled Power Amplifier Module for
WCDMA Applications”, Radio Frequency Integrated Circuits (RFIC) Symposium, 2006
IEEE.
[23] Nam, J., Kim, Y., Shin, J.H. & Kim, B. “A CDMA and AMPS Handset Power Amplifier based
on Load Modulation Technique”, 34th European Microwave Conference, 2004.
[24] Nam, J., Shin, J.H. & Kim, B. “A Handset Power Amplifier with High Efficiency at a Low
Level Using Load-Modulation Technique”, IEEE Transactions on Microwave Theory and
Techniques, August 2005.
[25] Kim, S., Lee, K., Peter J.Z & Kim, B. CDMA Handset Power Amplifier with Diode Load
Modulator, IEEE Microwave Symposium Digest, 2005.
[26] Jeon, Y.J., Kim, H.W., Kim, H.T., Ryu, G.H., Choi, J.Y., Kim, K., Sung, S.E. & Oh, B. “A
Highly Efficient CDMA Power Amplifier Based on Parallel Amplification Architecture”,
IEEE Microwave and Wireless Components Letters, September 2004.
[27] Srirattana, N., Raghavan, A., Heo, D., Phillip, E.A. & Joy, L. “Analysis and Design of a
High-Efficiency Multistage Doherty Power Amplifier for Wireless Communications”, IEEE
Transactions on Microwave Theory and Techniques, March 2005.
[28] Application Note 1335, HPSK Spreading for 3G, Agilent Technologies.
[29] Staudinger, J., Gilsdorf, B., Newman, D., Norris, G., Sadowniczak, G., Sherman, R.,
Quach, T. “High Efficiency CDMA RF Power Amplifier using Dynamic Envelope Tracking
Technique”, IEEE Microwave Symposium Digest, 2000.

Characterization of Uplink Transmit Power and Talk Time in WCDMA Networks
98
[30] Metzger, A.G., Zampardi, P.J., Sun, M., Li, J., Cismaru, C., Rushing, L., Ramanathan, R.
& Weller, K. “An InGaP/GaAs Merged HBT-FET (BiFET) Technology and Applications to the
Design of Handset Power Amplifiers”, IEEE Compound Semiconductor Integrated Circuit
Symposium, 2006.
[31] Itoh, Y. “High Power Amplifiers for Mobile Communication Systems”, URSI International
Symposium on Signals, Systems, and Electronics, 1995.
[32] Cha, J., Yi, J., Kim, J. & Kim, B. ‘Optimum Design of a predistortion RF Power Amplifier
for Multicarrier WCDMA Applications”, IEEE Transactions on Microwave Theory and
Techniques, February 2004.
[33] Staudinger, J. “An Overview of Efficiency Enhancements With Application To Linear
Handset Power Amplifiers”, IEEE Radio Frequency Integrated Circuits Symposium, 2002.
[34] Huang, Y. & Lin, Z. “High Power CMOS Power Amplifier for WCDMA”, IEEE Asia Pacific
Conference on Circuits and Systems, 2006.
[35] Bensmida, S., Hammi, Q. & Fadhel, M.G. “High Efficiency Digitally Linearized GaN Based
Power Amplifier for 3G Applications”, IEEE 2008.
[36] Kim, H., Lee, K., Choi, H., Choi,J., Lee, K., Kim, J., Ryu, G., Jeon, Y., Han, C., Kim, K.
& Lee, K. “High Efficiency and Linear Dual Chain Power Amplifier with Automatic Bias
Current Control for CDMA Handset Applications”, 34th European Microwave Conference,
Amsterdam, 2004.
[37] RF Micro Devices. “RFMD RF 5198 and RF 5184, High-Power, High-Efficiency Linear Power
Amplifier Modules for WCDMA Applications”.
[38]http://www.mobilehandsetdesignline.com/202402790;jsessionid=5ETVTGV4LEWUWQSND
LQSKIKCJUNN2JVN?printableArticle=true