Characterization of Emissions from Open Burning of Meals ...

CHARACTERIZATION OF TRANSFLUTHRIN EMISSIONS OVER TIME IN AN
ENCLOSED SPACE OVER A RANGE OF DISCRETE TEMPERATURES
by
LT Merrick S. Pettebone
Industrial Hygiene Officer
United States Navy
Thesis submitted to the Faculty of the Occupational & Environmental Health Sciences Graduate Program
Uniformed Services University of the Health Sciences In partial fulfillment of the requirements for the degree of MASTERS OF SCIENCE IN PUBLIC HEALTH, 2014
r SCHOOL OF
4301 Jones
GR/:DUATE PHOGR/\MS
Betheso2, fVlD 20814
DISSERTATION APPROVAL FOR THE MASTER IN SCIENCE IN PUBLIC HEALTH DISSERTATION IN THE PREVENTIVE MEDICINE AND BIOMETRICS GRADUATE PROGRAM
Title of Thesis: "Characterization of Transfluthrin Emissions Over Time in an Enclosed Space Over a Range of Discreet Temperatures"
Name of Candidate: LT Merrick S. Pettebone Master of Science in Public Health Degree May 14,2014
AB.STRACT APPROVED:
DATE:
CAPT ia K. ifvlaJar, CIH DEPARTMENT,QJ3 PREVENTIVE MEDICINE AND BIOMETRICS
CD ae ev r., Ph.D. DEPARTMENT OF PREVENTIVE MEDICINE AND BIOMETRICS Thesis Advisor
L~Ph.D. !""'1hfr'f NAVAL MEDICAL RESEARCH CENTER-ASIA Committee Member
Eleanor S. i\lie~calf, Ph D. Dean ii [email protected]
Toll Free: 800-772-17<17 :: Comn1erml: 301-295-3913 / 9474 OSI~· 295-9474 !I F21c 301-295-5772

ACKNOWLEDGMENTS
I would like to thank the United States Department of Agriculture, Agricultural
Research Service for their assistance and use of their facilities at the Agricultural
Research Center in Beltsville, Maryland. Without the assistance and analytical support of
Dr. Kamlesh Chauhan and Filadelfo Guzman, this study would not have been possible.
I would also like to thank the following members of my committee for their
patience and confidence in my abilities: Captain Maria Majar, Assistant Professor,
Department of Preventive Medicine and Biometrics (Chairperson), Commander Michael
Stevens, Assistant Professor, Department of Preventive Medicine and Biometrics,
Lieutenant Commander Nicholas Martin, Viral and Rickettsial Diseases Department,
Naval Medical Research Center.
Ill

DEDICATION
I dedicate this master's thesis to my friends and classmates who helped me
navigate the process, and to my loving girlfriend who supported me and kept me sane
throughout. I couldn't have done it without you.
iv

COPYRIGHT STATEMENT
The author hereby certifies that the use of any copyrighted material in the thesis
manuscript entitled: CHARACTERIZATION OF TRANSFLUTHRIN EMISSIONS
OVER TIME IN AN ENCLOSED SPACE OVER A RANGE OF DISCRETE
TEMPERATURES is appropriately acknowledged and, beyond brief excerpts, is with the
permission of the copyright owner.
[Signature] J
LT Merrick S. Pettebone
August 5th, 2014
v

ABSTRACT
CHARACTERIZATION OF TRANSFLUTHRIN EMISSIONS OVER TIME IN AN
ENCLOSED SPACE OVER A RANGE OF DISCRETE TEMPERATURES
LT Merrick S. Pettebone, Masters of Science in Public Health, 2014
Thesis directed by: CDR Michael E. Stevens, Jr., Assistant Professor, Department of
Preventive Medicine and Biometrics
The Armed Forces Pest Management Board (AFPMB) has expressed interest in
using the commercially available pyrethroid, transfluthrin, as a spatial repellent in
ongoing efforts to protect military personnel from vector-borne diseases. Transfluthrin is
currently used in malaria endemic areas as an indoor residual spray. It is effective at
significantly reducing the number of bites from mosquitoes. However, little is known
about the actual amounts of transfluthrin in the air when effective repellency/bite
reduction occurs, and if those concentrations are of concern to human health.
The purpose of this research is to characterize airborne transfluthrin
concentrations, when a known amount of transfluthrin liquid is applied to fabric and then
subjected to a range of discrete temperatures. A l 7cm by 20 cm (340cm2) piece of
transfluthrin treated fabric was placed in a temperature-controlled, enclosed space
simulating a tent or hut. Air samples were taken at multiple locations within the space
Vl
over an 8-hour day to track the movement of transfluthrin through the space.
Experimentation was conducted at four temperatures (27-50)°C.
This research has demonstrated several relationships with the airborne
concentration of transfluthrin. It increases as temperature and height are increased, it
decreases as the distance from the source increases, and within the enclosed space used in
this study, transfluthrin was well below the levels of current occupational exposure
guidelines.
vii

TABLE OF CONTENTS
LISrf OFT ABLES .............................................................................................................. x
LIST OF FIGURES ............................................................................................................ xi
Chapter 1: Introduction ........................................................................................................ I
Background and Significance .......................................................................................... 1 Brief History of Insecticides and Repellents ................................................................... 2
Dichloro-diphenyl-trichloroethane (DDT) .................................................................. 2 Pyrethrum and Pyrethroids .......................................................................................... 6 Spatial Repellents ........................................................................................................ 8
Transfluthrin .................................................................................................................. 10 Human Health Effects ............................................................................................... 11
Research Purpose ........................................................................................................... 12 Objective .................................................................................................................... 14 Aims .......................................................................................................................... 14
Chapter 2: Literature Review ............................................................................................ 15
Actively Volatized Transfluthrin ................................................................................... 15 Combustible Mosquito Coils ..................................................................................... 15 Kerosene Lamps ........................................................................................................ 16 Electro-Vaporizers ..................................................................................................... 16
Passively Emitted Transfluthrin .................................................................................... 17 Multilayer Paper Strips .............................................................................................. 17 Hessian Strips ............................................................................................................ 17
Passively Emitted Airborne Concentrations .................................................................. 18 Passive DDT Emissions from Treated Fabric ........................................................... 19 Residual DDT Levels ................................................................................................ 21 Comparison of Laboratory vs. Field Emission Rates of DDT .................................. 21
Physical and Chemical Characteristics of Transfluthrin ............................................... 22 Method of Action ....................................................................................................... 24 Human Exposures ...................................................................................................... 24 Exposure Guidelines .................................................................................................. 26
Chapter 3: Methodology .................................................................................................... 29
Method ........................................................................................................................... 29 Set-lJp ............................................................................................................................ 29
Greenhouse & Chamber ............................................................................................ 29 Source Material. ......................................................................................................... 31 Air Sampling Points .................................................................................................. 31 Sample Blocks ........................................................................................................... 33 Air Pump Location .................................................................................................... 34
viii

Sampling Plan ................................................................................................................ 35 8-Hour Sampling Day ................................................................................................ 35 Sample Locations ...................................................................................................... 36 Sampling Temperatures ............................................................................................. 37 Sample Blanks and Passive Samples ........................................................................ .37 Combined Sampling Plan .......................................................................................... 37
Temperature Spikes ....................................................................................................... 38 Cold Chamber ................................................................................................................ 38 Post Sunset Warming .................................................................................................... 39 The Destructive Forces of Nature ................................................................................. .39
Chapter 4: Results .............................................................................................................. 41
Statistical Analysis ........................................................................................................ 41 Time ............................................................................................................................... 42 Temperature ................................................................................................................... 44 Distance ......................................................................................................................... 46 Height ............................................................................................................................ 48
Chapter 5: Discussion ........................................................................................................ 51
Time ............................................................................................................................... 51 Temperature ................................................................................................................... 53 Distance ......................................................................................................................... 54 Height ............................................................................................................................ 55 Other Factors of Note .................................................................................................... 56
Mass Loading ............................................................................................................ 57 Surf ace Area .............................................................................................................. 57
Chapter 6: Conclusions I Future Research ........................................................................ 59
REFERENCES .................................................................................................................. 62
IX

LIST OF TABLES
Table 1.1: Pyrethrins ............................................................................................................ 7 Table 2.1: Physical Characteristics of Several Insecticides I Repellents .......................... 23 Table 2.2: Military Exposure Guidelines (MEGs) for transfluthrin (89) .......................... 28 Table 3.1: Details of sampling method (59) ...................................................................... 29 Table 3.2: Visual representation of sample timing ........................................................... .36 Table 4.1: One-way ANO VA of Concentrations Over Time, Split by Location ............. .43 Table 4.2: Univariate Analysis of Variance- Time Displayed .......................................... 44 Table 4.3: One-way ANO VA of Concentrations Over Temperature ............................... .45 Table 4.4: Univariate Analysis of Variance Temperature Displayed ............................. 46 Table 4.5: One-way ANOVA Over Distance, Split by Temperature ............................... .47 Table 4.6: Univariate Analysis of Variance Distance Displayed .................................. .48 Table 4.7: One-way ANOVA Over Distance, Split by Temperature ............................... .49 Table 4.8: Univariate Analysis of Variance - Height Displayed ...................................... 50 Table 4.9: Homogeneous Subset<> of Concentrations by Height. ...................................... 50
x

LIST OF FIGURES
Figure 1.1: Structural Diagram of DDT (72) ....................................................................... 3 Figure 1.2: How voltage-gated channels work (1) ............................................................. .4 Figure 1.3: Structural Diagram of Transfluthrin (49) ........................................................ 11 Figure 3 .1: Small greenhouse used for sampling .............................................................. 30 Figure 3.2: Top view of experimental layout. ................................................................... 32 Figure 3.3: Side view of experimental layout.. .................................................................. 32 Figure 3.4: Example of a sample block ............................................................................ .33 Figure 3.5: Air sampling pump stand ................................................................................ 34 Figure 3.6: Side view of experimental layout.. .................................................................. 36 Figure 4.1: Comparison pptv vs. log10(pptJ ...................................................................... .41 Figure 4.2: Mean Airborne Concentration Over Time ..................................................... .43 Figure 4.3: Mean Airborne Concentrations Over Discrete Temperatures ........................ .45 Figure 4.4: Mean Airborne Concentration Over Distance ............................................... .47 Figure 4.5: Mean Airborne Concentration Over Height.. ................................................. .49 Figure 5.2: Potential overlapping areas of protection ........................................................ 55 Figure 5.3: Airborne concentration levels by layer. .......................................................... 56
XI

Chapter 1: Introduction
BACKGROUND AND SIGNIFICANCE
History is full of incidences in which diseases wiped out entire cities or defeated
armies (8; 30; 33; 82; 88; 92). The role insects have played as vectors for these diseases
was not understood until the late nineteenth century when a team led by Ronald Ross
discovered mosquitoes could transmit malaria from infected patients to non infected
patients (30). Many breakthroughs by other scientists soon followed, including the
connection of mosquitoes to yellow fever transmission by U.S. Anny Major Walter Reed
and his team working in Cuba in 1900 (92).
Vector borne diseases have contributed more to worldwide morbidity rates
throughout recorded history than all other causes combined (34). This held true until the
early 1900's when the discoveries by Ronald Ross, Walter Reed, William Gorgas, and
many others enabled public health officials to enact measures capable of reducing disease
incidence rates (30; 34; 92). Malaria, dengue, and yellow fever, all of which are mosquito
borne diseases, have seen a resurgence over the past three decades. This resurgence is at
least partly due to a dramatic increase in vector resistance to currently used insecticides
(86). As a result, the U.S. Armed Forces Pest Management Board (AFPMB) is
investigating new insecticides and strategies, including the use of non-lethal spatial
repellents (8; 82). Some promising work by Nicole Achee's group in 2012 showed
repellency could be achieved at much lower concentrations than required for vector
mortality (3). Additional work is desperately needed as the World Health Organization
(WHO) estimates nearly half of the world's population is infected with at least one type
1

of vector-borne pathogen (34). Malaria is the most common and wide spread mosquito
borne disease. In 2010 alone, there were 219 million new cases; 660,000 of which
resulted in deaths ( 17).
BRIEF HISTORY OF INSECTICIDES AND REPELLENTS
The first attempts to repel insects were quite rudimentary out of necessity. Our
ancestors most likely stuck close to cooking fires hoping the smoke would keep the
insects away. In addition, our ancestors likely followed the example of the animals
around them by spreading mud and dust over their skin. This layer of dirt would have
provided a partial physical barrier to the insects (29).
The earliest recorded use of pesticides is in the time of Homer around 1000 B.C.
when people would bum brimstone (sulfur) as a fumigant (29). In the first century A.O.
Pliny the Elder recommended a wide variety of substances, including the use of gall from
a green lizard (67). With the exception of sulfur, botanicals have been the type of
pesticide in use the longest. Extracts from tobacco, chrysanthemums, legumes, and even
citrus peels have been providing some level of deterrence to mosquitos for centuries (29).
However, once it was discovered mosquitoes were not only annoying, but actually made
people sick, interest in widespread application was heightened and synthetic forms of
natural pyrethrins and other compounds were pursued.
Dichloro-diphenyl-trichloroethane (DDT)
Dichloro-diphenyl-trichloroethane (DDT) (see Figure 1.1) was first synthesized in
1874 (52), but it wasn't until 1939 that its insecticidal properties were discovered and
DDT became the first of the modern synthetic insecticides ( 16; 24). DDT was found to be
2

a contact axionic nerve poison which shared a mode of action with pyrethrum and
pyrethroids (83).
Figure 1.1: Structural Diagram of DDT (72). Molecular Weight 354 AMU (72). Melting Point 107-l 10°C (78). Boiling Point= 260°C (78). Density 0.99 g/cm (78). Vapor Pressure 2.lxl0-4 Pa@ 20°C (78). Solubility in Water 0.001-0.004 mg/L (9).
In both vertebrates and invertebrates, DDT and pyrethroids interfere with the
voltage gated sodium channels in the neurons (20). When a neuron is stimulated, the
voltage gated sodium channel opens. This allows Na+ ions to enter the cell (see Figure
1.2). The inside of the neuron becomes positively charged in relation to the space within
the synaptic gap creating the "action potential" used to transmit an impulse to the next
neuron (71). Each of these depolarization events usually lasts two to three milliseconds
(39).
3

How voltage-gated channels work
M!lll .... ~+, ~
At the resting potential, voltage-gated Na+ channels are closed.
Figure 45~~k Biological Science, 2/e © 2005 Purson Prentice Hatl, Inc.
lllt
When the membrane is depolarized, conformational changes open the voltage-gated channel.
Figure 1.2: How voltage-gated channels work ( 1 ).
DDT, pyrethrins, and pyrethroids, bind to the voltage gated sodium channels
causing the channels to stay open significantly longer (20). The length of time the sodium
channels are open is dependent upon the chemical used, and ranges from 20 milliseconds
up to 200 milliseconds, or even minutes (71). This persistent inward flow of Na+ ions
causes repetitive discharges of the neuron after only one stimulation (96). These
repetitive discharges result in tremors, prostration, and seizures (71 ).
During World War II DDT was used to control malaria, typhus, body lice, and
plague. It's effectiveness was shown when the incidence rate for malaria cases among the
troops fell from 400,000 in 1946 to almost zero in 1950 (52). DDT was also used
extensively on the home front. Small aircraft sprayed DDT over farm fields, forests,
towns, and even entire cities as a method of pest control (16).
4

There were a variety of reasons for this wide spraying approach. DDT was being
used in efforts to control a wide range of pests including spruce budworm, Dutch elm
disease, typhus, spider mites, and malaria (16). Most importantly, DDT was cheap, long
lasting, and effective (52).
By the late 1950's, problems with the heavy widespread use of DDT were
becoming a concern. The persistence in the environment was considered by some
scientists to present a problem. Given DDT's highly lipophilic nature, the concern was
based on its potential accumulation in the fatty tissue of wildlife, which may lead to
adverse health effects in wildlife and was postulated to lead to potential human health
issues (24).
While the concerns about animal accumulation had some validity, no human
deaths or cancers have been attributed to the compound (11; 66). The application of
DDT has proven to be a tremendous benefit to human health worldwide. The Global
Malaria Eradication Program that started in 1955 successfully eliminated malaria from
Europe, North America, the Caribbean, and parts of Asia and South-Central America
(84). Over the past decade, its use on the continent of Africa has slowly and judiciously
been re-introduced due to the millions of malarial deaths associated with discontinuing
the use of DDT in previous decades (46). However, as target insects have demonstrated
DDT-resistance in the past in areas of extensive compound application (requiring higher
and higher concentrations of DDT in the spray), the need to continue to expand the
number of effective pesticide/repellent compounds exists (19).
5

Pyrethrum and Pyrethroids
The extract from crushed chrysanthemum flowers (pyrethrum) has proven to be
very effective in repelling and/or killing insects. Pyrethrum actually consists of six
insecticidally active esters collectively known as pyrethrins (see table 1.1) (71). These
pyrethrin extracts are highly viscous liquids that are sensitive to oxidation, have high
boiling points, and are difficult to store for long periods (38). As a result, historically
pyrethrins have been expensive and supplies were dependent upon the growing season
and the weather. Therefore, during World War II, one of the highest priorities was to
discover a way to synthesize a pyrethroid (artificial pyrethrin). The first one was
successfully produced in 1949 (85).
A potential limitation when using natural pyrethrum is its short shelf life when
exposed to ultra violet light. The first synthetic pyrethroid synthesized specifically to
have a reduced photosensitivity was permethrin in 1973 (45). Due to this development,
synthetic pyrethroids now have half-lives of greater than 30 days, last longer than natural
pyrethrum, and do not have to be applied as often (71). Unlike DDT, which can
accumulate in the soil for decades, the synthetic pyrethroids will accumulate for only
weeks or months before decaying (85). This allows farmers, or pest control personnel to
spray once or twice a season without the concern of environmental buildup.
6

Pyretbrin I
II ,,
0
Cinerin I
!!
ll -u
I
0
Jasmolin I
(l
...... h ......
r"O
Table 1.1: Pyrethrins.
Pyrethrin II
Cinerin ll
0
Jasmolin II
-·O
0
. ()
0
. --o
II
/ .(,
n li u
The six insecticidally-active esters (pyrethrins) that make up pyrethrum (49; 71).
7
0
0

DDT, pyrethroids, and pyrethrins are all part of a group of neurotoxic chemicals
that share a distinctive mode of action (discussed previously in DDT section) (71).
Uptake of pyrethroids can occur in an organism either by absorption, ingestion, or
inhalation. Typically, the most likely route is via dermal absorption. The highly lipophilic
properties of pyrethroids allow for quick penetration of the skin. Diffusion along the cells
of the epidermis is main distribution route to the central nervous system (CNS) once it is
in the body (54).
There are currently over 3,500 pyrethroids registered with the U.S. Environmental
Protection Agency (EPA) (87). Now into the fourth generation of synthetic pyrethroids,
chemists continue to work on improving resistance to UV light and minimizing the
effects on non-target species (29). These improvements have resulted in pyrethroids that
are thought to be less toxic to birds and mammals than the pesticides they replaced, such
as DDT (85). According to Elliot et al. in the Annual Review of Entomology, the new
pyrethroids are also an order of magnitude more insecticidally active than DDT (22).
Spatial Repellents
The traditional methods of protecting people in their homes from vector borne
diseases have focused on insecticide-treated bed nets (ITNs) and indoor residual spraying
(IRS) (3 ). These methods have significantly decreased the disease burden in many
countries; however, the effectiveness of some of these compounds is diminishing as
insecticide resistance to these compounds increases (58). This increase in insecticide
resistance is the direct result of both ITNs and IRS depending on delivering a lethal dose
upon contact with the vector (3). Within every population there is genetic diversity.
Within any given insect population, that diversity will allow a few individuals to be
8

resistant to any one pesticide. Once the insect population is exposed to an insecticide, the
majority will die. However, those individuals with the innate resistance will survive and
reproduce, passing on their resistance to the next generation. As time goes on, each
generation within that insect population will have a higher percentage of individuals
whom are resistant to the insecticide, eventually causing the insecticide to be all but
useless (91).
The goal of a spatial repellent is not to kill the vector, but to repel it by irritating it
or incurring some other non-lethal effect upon exposure to the compound. A benefit to
this approach is even the most susceptible vectors live to reproduce. With all of the
vectors surviving to reproduce and not just the naturally insecticide resistant ones, there is
no resulting increase in the percentage of vectors who are resistant to the repellent (58).
In addition, spatial repellents are effective at a much lower concentration than what is
required to achieve a lethal exposure (3). This lower concentration, and a potentially
different mechanism of action, allows for the possibility of using chemicals previously
only used as pesticides as repellents (41).
Spatial repellents are able to achieve this goal of behavior modification by
functioning in the volatile phase. Mosquitoes have been shown to avoid enclosures with
an airborne concentration of DDT at only 51 parts per trillion as compared to the average
lethal airborne concentration of 1 % or IO billion parts per trillion (57; 93). Such low
requirements for the amount of insecticide/repellent in the air have several benefits. The
lower amount of insecticide/repellent in the air results in lower exposures to the
inhabitants of the structures and costs are reduced, as less chemical is needed per unit
area. With direct contact between vector and insecticide/repellent no longer required, the
9

treated material can be anything from window curtains to a floor mat. This would
increase use of the products, as they would now be multi-functional (58).
The spatial repellent properties of DDT were noted in the 1940' s; however, little
research on its repellency effects was conducted, as it was believed that vector mortality
was the critical goal, not vector deterrence (58). In recent years however, as resistance to
current insecticides has increased, so has interest in spatial repellency (3). Researchers
have found several chemicals that have spatial repellency properties. One of the most
favorable of these is transfluthrin (74).
TRANSFLUTHRIN
Transfluthrin is a 4th generation pyrethroid that has been in use since 1996 (74).
Like the rest of the pyrethroids, it is an insecticidally-active ester compound (see figure
1.3) (71). Transfluthrin is used in commercial pest management around the world. It is
also available in several countries in consumer products such as combustible coils (23).
Manufacturers of transfluthrin recommend the commercial application of transfluthrin be
conducted in unoccupied spaces due to the risk of adverse human health effects from
inhalation or skin contact (23; 81).
10

0
0
F F
F
Figure 1.3: Structural Diagram of Transfluthrin (49) Molecular Weight== 371 AMU (94). Melting Point 32°C (94). Boiling Point 250°C (74). Density== 1.5072 g/cm@ 23°C (74). Vapor Pressure= 9.0xl0-4 Pa @ 20°C (94). Solubility in Water - 0.057 mg/L (94).
Human Health Effects
No studies have been conducted on humans to determine the signs and symptoms
of an over exposure to transfluthrin. However, studies indicating human health effects
resulting from exposure have been conducted with chemicals of the same class of
compounds as transfluthrin (pyrethroids) (42; 47). Additionally, studies conducted on rats
have shown profuse salivation, choreoathetosis, increased startle response, and terminal
chronic seizures (71). The Material Safety Data Sheet (MSDS) for transfluthrin warns of
potential skin and respiratory tract irritation (81). The list of reported signs and symptoms
from exposed individuals is as follows: burning facial sensation, itchy face sensation,
tingling face sensation, paresthesia, skin irritation, mucosal irritation, respiratory tract
11

irritation, headache, dizziness, nausea, epigastric pain, vomiting, anorexia, fatigue,
twitching muscles, salivation, fluid in lungs, runny nose, and convulsion (70). These
signs and symptoms are similar to typical nerve agent or organophosphorus poisoning
(14; 32). The recommended treatment for transfluthrin poisoning is decontamination with
soap and water, and supportive measures to treat the symptoms (2; 70).
Long-term exposures to humans can come from dietary, environmental, and
occupational sources. The United States Environmental Protection Agency (USEPA) has
evaluated long-term pyrethroid dietary exposure and found the estimated worst-case
lifetime average daily exposure to be 0.117 micrograms (µg) per kilogram of body
weight. This exposure is estimated by the EPA to not increase the cancer rates in the
general US population (90). The major environmental route for pyrethroid exposure is
through ultra-low volume (ULV) spraying techniques. These techniques result in aerosol
clouds that are designed to stay airborne. The World Health Organization, along with
others, has determined the short and long term risks to humans from ULV applications of
transfluthrin to be negligible (36; 68; 94).
RESEARCH PURPOSE
Vector-borne disease has always had a devastating effect on armies during war.
During the Mexican-American war, Ulysses S. Grant noted in his memoirs, "It was very
important to get the army away from Vera Cruz as soon as possible, in order to avoid
yellow fever, or vomito, which usually visits that city early in the year, and is very fatal
to persons not acclimated". Of the 13,000 U.S. soldiers who died over the course of the
Mexican-American War, only about 1,700 succumbed to combat related injuries. The
other 90% died of disease, the majority being from yellow fever (88).
12

War may have changed over the years, but the threat of vector-borne diseases has
not. The United States Department of Defense (DoD) Armed Forces Pest Management
Board (AFPMB) has an initiative called the Deployed War-Fighter Protection (DWFP)
research program. The purpose of this program is to "develop and validate novel methods
to protect United States Military deployed abroad from threats posed by disease-carrying
insects" (8). In the past the DoD has had a strong working relationship with the United
States Department of Agriculture (USDA) Agricultural Research Service (ARS). This
collaboration has produced many well-known insect-fighting products such as DEET and
permethrin-impregnated fabrics (82). Currently the AFPMB (in conjunction with the
Navy Medical Research Center (NMRC), the Walter Reed Army Institute of Research
(WRAIR), and the USDA) is interested in researching and potentially deploying spatial
repellent compounds such as transfluthrin to better protect deployed military personnel.
Recent efforts to investigate the use of transfluthrin for passive spatial repellency
have been reported in the literature. In 2004, Argueta et al. studied novel transfluthrin
impregnated paper strips (7). In 2012, Ogoma et al. worked with novel transfluthrin
treated hessian (a type of canvas) strips (61). Both groups observed over 80% reductions
in mosquito bites during their studies, yet no attempts were made to measure airborne
concentrations of transfluthrin produced from their respective passive approaches (7; 61).
Given the promising results reported by these researchers, and since previous studies
have not characterized passively emitted transfluthrin in air, the goal, objective, and aims
of this research are as follows:
13
Objective
The goal of this study is to characterize airborne concentrations of transfluthrin, a
spatial repellent for mosquitoes, emanating from novel transfluthrin treated canvas strips
at discrete temperatures, distances, and heights. The objective is to provide quantitative
results of passively emitted airborne concentrations at various distances and heights from
the pre-treated source material over a range of discrete temperatures. These data could
then be linked with future entomologist-led vector behavior studies at different
concentrations to assist in determining the most effective application method and
concentration for vector repellency.
Aims
The following specific aims provide the framework necessary to accomplish the
goal and objective of the study.
1) Over a range of discrete temperatures, determine the airborne concentration of
transfluthrin at multiple distances and heights over time from a passive pre
treated source in an enclosed space using an established Occupational Safety
and Health Administration (OSHA) sampling method (59).
2) Use descriptive and inferential statistics to assess differences, if any, in
airborne concentrations over time and temperature at each of the various
heights and distances from the repellent source material.
14

Chapter 2: Literature Review
As the concept of using passively emitted insecticides as spatial repellents is
relatively new, there is a growing amount of research focused on the effectiveness of this
approach on bite deterrence. However, there is not much in the literature on the topic of
effective airborne repellent concentrations. Characterizations of airborne levels of
actively emitted transfluthrin have been reported in the literature (55; 64; 69). In addition,
efforts have demonstrated that passively-emitted transfluthrin from various substrates
such as fabric or paper can repel mosquitoes, but the airborne concentrations were not
measured (7; 61 ). While no one as of yet has tried to measure the airborne levels of
passively emitted transfluthrin, several studies found DDT (a similarly sized molecule)
was passively emitted in measurable levels (37; 57; 63).
ACTIVELY VoLATIZED TRANSFLUTHRIN
Combustible Mosquito Coils
Mosquito coils have been used for years to repel mosquitoes in attempts to
provide for a disease free sleep environment throughout Asia, Africa, and South America
(43). The acceptance of coil use, and likely effectiveness in reducing disease, is
evidenced by the estimated 32 billion coils purchased every year (43). While the
effectiveness in repellency when burning pyrethroid-treated coils has been known for
years to be more than anecdotal, until 2001, no one had investigated how much active
ingredient was actually being released into the air.
In 2001, Ramesh et al. analyzed the emissions from a burning mosquito coil
containing 0.03% transfluthrin inside a 3.0 m x 3.5 m x 2.5 m study room. Air samples of
15

100 cm3 were collected from various locations and times from within the study room and
analyzed using gas chromatography-electron capture detection (GC-ECD). This work
showed detectable airborne concentrations of transfluthrin in the low parts-per-billion by
volume range (0.0134 ppmv, or 13.4 ppbv) (69).
As a result of work by Ramesh et al., researchers established a 'ballpark' high end
value for effective airborne repellency concentration of transfluthrin (69). This
information can be used to formulate both more effective coils, and coils that expose the
users to lower levels of airborne insecticide.
Kerosene Lamps
In 2002, Pates et al. studied two active methods of using kerosene lamps to
increase the mass of transfluthrin emanated into the air. The first method was to mix the
transfluthrin directly into the kerosene fuel for the lamp. The resulting reduction in
mosquito bites was statistically insignificant regardless of how much transfluthrin they
mixed into the kerosene.
The second method involved using the kerosene lamp to heat vegetable oil with
0.1 % and 0.5% transfluthrin mixed into it. This approach resulted in bite rate reductions
of 50-75% and >90% over a period of 4 hours, respectively. The researchers did not
report airborne concentrations of transfluthrin for either method, but the second method
importantly confirmed again that airborne transfluthrin effectively repels mosquitoes
(64).
Electro-Vaporizers
In 2011, Nazimek et al. set out to determine the airborne concentration of
transfluthrin from an electro-vaporizer. The researchers used Baygon brand electro-
16

vaporizers produced by S.C. Johnson, which uses both transfluthrin-containing liquid and
gel inserts as the respective active ingredient materials. These electro-vaporizers are
designed for indoor use and plug in like a small night-light. The manufacturer states that
they are not to be used in non-ventilated rooms, or in rooms in which there are small
children or very sensitive persons as skin irritation, itching, or coughing may result ( 10).
The electro-vaporizers were run for 6 hours, during which air samples were
collected continuously at a rate of 0.5 Umin, for a total of 180 L per sample. The samples
were then analyzed using a gas chromatograph (GC) with an electron capture detector
(ECD) attached. The results indicated that the highest mean airborne concentration
sample yielded an average airborne transfluthrin concentration of 2.4 µg/m3 (0.00016
ppmv, or 0.16 ppbJ (55).
PASSIVELY EMITTED TRANSFLUTHRIN
Multilayer Paper Strips
In 2004, Argueta et al. studied the spatial repellency of 2,000 cm2, multilayer
paper strips, impregnated with 200 mg of transfluthrin (0.1 mg/cm2). The study looked at
the ability of these treated paper strips to repel Aedes albopictus mosquitoes under
outdoor conditions. The researchers found the transfluthrin treated strips could repel over
80% of mosquitoes for over a month, relative to non-treated controls (7).
Hessian Strips
[n Tanzania in 2012, Ogoma et al. evaluated the ability of transfluthrin-treated
hessian strips (a burlap type material made from fine sisal fibers and locally used in
cereal storage bags) to repel laboratory raised Anopheles arabiensis mosquitoes in an
outdoor, naturally ventilated net tunnel measuring 60 m x 2 m x 2.5 m. The researchers
17

treated a 4.0 m x 0.3 m (12,000 cm2) strip of hessian sacking with 10 ml of transfluthrin
resulting in a mean concentration of 1.25 mg/cm2•
After hanging the treated 12,000cm2 strip in a perimeter around an individual
seated in a chair, malaria-free mosquitoes were released. Trials were conducted on four
consecutive nights each month, for six months, during which time the treated hessian
strips were stored in uncovered bins at ambient temperature indoors (61). Their findings
suggested freshly treated strips reduced the mosquito bite rate by >99%. And more
importantly, they found that the treated strips provided >90% protection for the full 6
month length of the study (61).
Environmental conditions within the experimental netting enclosure were not
discussed. However, the rearing conditions within the nearby insectary were listed as 28-
29 °C, with 70-80% relative humidity (61). The insectary was constructed on a
greenhouse frame with mosquito netting walls and a polyethylene roof (31). As both the
experimental tunnel and the insectary had mosquito netting for walls, it can be assumed
that the temperature and relative humidity were similar.
PASSIVELY EMITTED AIRBORNE CONCENTRATIONS
No published study was identified which focused on measuring and characterizing
airborne concentrations of transfluthrin from passively emitting sources. However,
several studies have investigated the airborne concentration of passively emitted DDT (3;
13; 37; 57; 63). The DDT molecule is similar in structure and size to transfluthrin,
resulting in similar volatilities and has demonstrated spatial repellency properties (23; 35;
72).
18

Passive DDT Emissions from Treated Fabric
In a paper by Martin et al. published in 2013, the airborne DDT concentrations
emitted from treated polyester fabric in both laboratory and field environments were
evaluated. As the passively emitted DDT was expected to be found in very low
concentrations in the air, thermal desorption (TD) tubes were utilized to avoid solvent
background affecting analytical detection at these low levels. The TD tubes were attached
to low flow personal sampling pumps ( 100 mL/min lab, 200 mL/min field) to collect
each of the samples. Sample analysis was conducted using a gas chromatograph (GC)
paired with a mass spectrometer (MS) (57).
The GC-MS results yielded detectable and quantifiable amounts of DDT in the air
both in the laboratory setting and in a field setting. The mean airborne concentration in
the laboratory environment was approximately 29 µg/m3, while the mean airborne
concentration from the field setting was approximately 1.17 µg/m3• The mass loading for
both laboratory and field experiments covered the range of 0.09-2.0 g/m2• The
temperature and relative humidity in the laboratory were 26-31°C and 10-20%
respectively. The field environment had temperatures of 22.4-29.2°C and relative
humidity of 72-99% (57).
The determination of airborne DDT concentrations by Martin et al. was part of a
larger study concurrently being conducted by Achee et al. (3; 57). The overall goal of the
larger study was to quantify the chemical concentration in a treated air space that elicits a
spatial repellent response in a vector population (3). This study showed a 70% reduction
in the number of mosquitoes entering huts containing DDT treated fabric panels (2 g/m2).
The 70% reduction in the number of mosquitoes entering the hut, combined with the
19

measured 1.17 µg/m3 of DDT in the air, suggests that DDT is an effective spatial
repellent at ppt,, airborne concentrations (3; 57).
The higher concentration of 29 µg/m3 found in the laboratory environment has
several potential causes and implications (57). The laboratory conditions were measured
at the start of each day. The temperature was between 26-31°C, and the relative humidity
was reported at 10-20%. The mean field collection temperatures were all 25-26°C (57).
With a potential temperature difference of up to 6°C, the difference in measured airborne
concentration may be partially due to the higher laboratory temperature resulting in a
higher vapor pressure for the DDT(13). In addition, while both laboratory and field
experiments used identically treated fabric, the sizes of the fabric and the volume of the
spaces were drastically different. The laboratory chamber had a volume of 0.0284m3, and
a 0.3097m2 piece of treated fabric (57). With a mass loading of 2 g/m2, this translates into
2L8g of DDT for every cubic meter of air in the chamber. The field experiments used
huts with volumes of 50m3 and 19.8m2 of treated fabric (57). Using the same mass
loading of 2 g/m2, the huts had only 0.792g of DDT per cubic meter of air. As a result,
the laboratory test chamber had 27.5 times the amount of DDT proportionately.
The mean relative humidities under field conditions were 83-86% (57). This is
drastically different than the 10-20% relative humidity in the laboratory environment.
The Tenax-TA used in the sampling is the preferred adsorbent for use in high relative
humidity environments, but even it is affected by the high moisture content of the air
(76). This results in lower concentrations being reported than actually exist. The
implication being that the airborne concentration of DDT in the huts during the study
were most likely higher than the 1.17 µg/m3 reported (57).
20

Residual DDT Levels
The previously discussed studies evaluated airborne concentrations of DDT from
freshly treated fabric sources (3; 57). Van Dyk et al. and Singh et al. both evaluated
levels of DDT which may be bioaccumulated, found as metabolic by-products and/or
exist as residual concentrations in the living environment. Van Dyk et al. collected leafy
vegetables, chicken samples (muscle, fat, and liver), human serum, indoor air, floor dust,
outside soil, and potable water. All samples were collected two months after DDT was
used for indoor residual spray treatments. DDT was detected in all indoor air samples,
with a mean concentration in such samples of 3.9 µg/m 3 (37).
Singh et al. evaluated residual airborne concentrations for eight months after DDT
was used for indoor residual spray treatments. The indoor air samples revealed airborne
concentrations of DDT that ranged from 1.0-14.6 µg/m3• The samples also indicated that
after an initial concentration decrease, at the end of the eight-month sampling period, the
airborne concentration was measured at 5.9 µg/m3 (63 ).
Comparison of Laboratory vs. Field Emission Rates of DDT
In his unpublished thesis completed at Uniformed Services University of the
Health Sciences in Bethesda, Maryland, Brown compared DDT emission rates in the
laboratory environment to emission rates in a field environment, as well as measured the
air change rate using a C02 decay method. The laboratory work was conducted in thermal
micro chambers over a range of temperature to try to predict what would be found in the
field (13).
The fieldwork was conducted using two experimental huts in Thailand. The huts
were equipped with screen windows and doors. These screens allowed for natural
21
ventilation, with a mean air change rate measured at 7.21 air changes per hour. Samples
were collected at five locations within both huts. There was no significant difference in
the results from the samples between the two huts. Within each hut, the results indicated
airborne concentrations of DDT from 1.1-2.l µg/m3 (13). These findings were consistent
with the airborne concentrations found by other researchers using similar mass loading of
DDT (37; 63).
PHYSICAL AND CHEMICAL CHARACTERISTICS OF TRANSFLUTHRIN
Transfluthrin is a 4th generation pyrethroid that has been in use since 1996 (74).
Like the rest of the artificial pyrethroids, it is an insecticidally active ester compound
(figure 1.2) (71). It has a molecular weight of 371 g/mol, a density of 1.51 g/cm3 at 23°C,
a boiling point of 135°C at 0.1 mm Hg, and a vapor pressure of 9.0xl0-4 Pa at 20°C (23;
74; 81 ). Table 2.1 compares the some of the physical and chemical characteristics of
transfluthrin with several common insecticides and repellents. Many of the characteristics
of transfluthrin are similar to the other insecticides listed in the table. However, while the
vapor pressure of transfluthrin in lower than that of the insect repellent DEET, it is higher
than those of the other insecticides listed.
22

r 1 Transfluthrin I Permethrin DDT I Empirical C1sH12ClzF402C74J T, C21H20Clz03CBOJ ·1 C14H9ClsC72J
DEET
l Formula ! I 1
Molecular , 371.2(74) I 391.3(53) 354.5C7~2J _ __,_ .. _
I Weight (g/mol) I I 191.3(731
I Appearance
1
Colorless · Colorless I Colorless crystals(74) or I crystals or I crystals(9)
i ! brown IiquidC65J I yellow 1
I 1 liguid(53) 1
[Density-·11.5072 g/c~~tf -1.190-1.270 l-0-.9-9-g/cm3(7BJ I 23°CC74J g/cm3 at I
i I - 20°C(80) I 1 Vapor 9.0xl0·4 Pa at 2.87x1Q-6 , 2.13xl0-4 Pa l Pressure 20°CC94J PaC53J at 20°CC7BJ ! MeltingPoint. 32°CC74J 34-39°CC25J 107-110°CC78J · Boiling Point 250°C at 760 220°c at 0.05 , 260°CC7BJ
Solubility in Water
mm/HgC74J n:!mHgCZSJ 0.057 mg/LC74J 0.0055
rl!M_L(53) 0.001-0.04
m_gL_LC9l Table 2.1: Physical Characteristics of Several Insecticides I Repellents (4; 9; 15; 25; 53; 65; 72-74; 78-80; 94).
Light yellow liquidC79l
0.998 g/cm3(79J
0.34 Pa at 25ocr79J
·---1
-450C(4)
111°C at 1 mmHgC79J
2-3 mg/mlC15J I
Transfluthrin is used in commercial pest management globally against flies,
mosquitoes, and cockroaches. It is also available in several countries in consumer
products such as combustible coils (23). Manufacturers of transfluthrin recommend the
commercial application of transfluthrin be conducted in unoccupied spaces due to the risk
of adverse human health effects from inhalation or skin contact, such as skin, eye, or
respiratory tract irritation (23; 81).
23

Method of Action
Transfluthrin is considered an axonic poison (29). Even though it is a nerve
poison, it is not a cholinesterase inhibitor like organophosphorus or carbamate
insecticides (51). Transfluthrin, along with rest of the pyrethroids, is part of a group of
neurotoxic chemicals that share a distinctive mode of action which was discussed in the
DDT section of Chapter I (71). Transfluthrin can enter an organism in many different
ways, but the highly lipophilic properties of transfluthrin allows for quick penetration of
the skin. Diffusion along the cells of the epidermis is main distribution route to the
central nervous system (CNS) once it is in the body (54).
Human Exposures
Research by Baygon suggests transfluthrin's action on mammals is 1,000 to
10,000 times weaker than on insects (74). However, human over exposure is possible
through ingestion, inhalation, and dermal exposure. Review of the published scientific
literature contains no reports of transfluthrin poisoning, and contained no reported
clinical cases of acute pyrethroid poisonings of any kind until pyrethroids started being
used in China in 1982 (26). Since then, overexposures to pyrethroids have been reported
from occupational exposures, accidental exposures, and suicide attempts around the
world (2; 5; 21; 26; 56; 75).
Occupational over exposures to pyrethroids are usually the result of not
complying with safe handling techniques while spraying or during handling of the liquid
pyrethroids, resulting in significant dermal absorption (26; 75). These exposures typically
result in burning or itching sensations of the face, which can be accompanied by
24

dizziness (26). Symptoms usually disappear on their own within 24 hours, and all
disappear within 2 days (2; 75).
Reported cases of accidental over exposure were mostly due to ingestion of
pyrethroids, generally resulting in digestive related symptoms. Symptoms included
epigastric pain, nausea, and vomiting. Some of the ingestive poisonings resulted in
temporary comas (26).
The most severe over exposures were suicide attempts in which people
intentionally consumed pyrethroids. The literature did not contain any references to
successful suicide attempts involving pyrethroids, but two unsuccessful tries were
discussed as case studies (2; 21). Initially, one of the patients presented with only mild
throat pain and epigastric discomfort. After receiving a gastric lavage, the patient was
transferred to intensive care for monitoring. During the first 24 hours the patient's
condition seemed to improve, but then she developed a cardiac conduction disturbance.
She was provided with supportive care, and after 3 days, her cardiac issues resolved
themselves. At the 4-week follow up, there were no signs or symptoms of cardiac issues
or any other sign of her pyrethroid ingestion (21).
The other case study present in the literature involved a 20 year old man who
presented with abdominal pain, vomiting, dizziness, convulsions, altered mental state,
elevated heart rate, increased respiratory rate, semi-dilated pupils, hypoxia, and
pulmonary edema. The patient was placed on a ventilator and given supportive care. His
condition gradually improved, and after four days he was weaned off the ventilator. His
remaining complaints of mild headache, dizziness, and fatigue all improved and he was
discharged from the hospital on the 61h day (2).
25

The complete list of symptoms of overexposure to transfluthrin include burning,
itchy, or tingling sensation; parasthesia; skin or mucosal irritation; respiratory tract
irritation; headache; dizziness; nausea; epigastric pain; vomiting; anorexia; fatigue;
twitching muscles; salivation; fluid in lungs; runny nose; and convulsions. All of which
are consistent with neurotoxin poisoning. There is no antidote for transfluthrin poisoning.
The theoretical lowest lethal oral dose of pyrethrum is 750 mg/kg in children and 1000
mg/kg in adults (56). Treatment involves decontamination (such as washing of the skin
and gastric lavage) and symptomatic and supportive care (70). Human experience and
some experimental work conducted on human volunteers and a guinea pig model show
that non-lethal effects of pyrethroid poisoning are reversible and result in no permanent
change (5).
Exposure Guidelines
Within the United States, there are three places to tum for exposure limit
regulation and/or guidance in regard to transfluthrin. The Occupational Safety and Health
Administration (OSHA) provides legally binding standards. The American Conference of
Governmental Industrial Hygienists (ACGIH) and the National Institute for Occupational
Safety and Health (NIOSH) provide non-binding recommendations and guidelines. These
three groups have the common goal of protecting workers, but they are distinctly separate
organizations with different purposes.
The ACGIH is a "private, not-for-profit, nongovernmental corporation whose
members are industrial hygienists or other occupational health and safety professionals
dedicated to promoting health and safety within the workplace" (6). ACGIH does not set
legally binding standards. It reviews the current literature in order to issue suggested
26

guidelines called Threshold Value Limits (TLVs). These TLVs are recommendations and
not legally binding (6).
NIOSH (a United States governmental organization) also looks at the most
current science to make recommendations for exposure limits. NIOSH issues
Recommended Exposure Limits (RELs) based upon its findings. Just like the ACGIH
TLVs, the NIOSH RELs are recommendations and are not legally binding (50).
OSHA on the other hand, does issue legally binding limits. These limits are called
Permissible Exposure Limits (PELs) (50). However, due to the fact that PELs are legally
binding, any changes must go through the legislative process. As a result they are
perpetually slightly outdated. Another significant difference is that ACGIH and NIOSH
do not need to consider technical or economic feasibility when making recommendations
whereas OSHA is required to do so (6; 50).
In the case of transfluthrin, or any of the other synthetic pyrethroids, there are no
regulatory standards or guidelines listed. The accepted practice for establishing exposure
limits for pyrethroids (as recommended by the ACGIH and NIOSH) is to use the standard
developed for pyrethrum (28). The TL V, REL, and PEL for pyrethrum, and therefore
transfluthrin, are all 5 mg/m3, or 0.33 ppm, (6; 28; 50). These guidelines are developed
with the intent of determining what level of exposure a worker can be exposed for 8
hours a day, 5 days a week, for 40 years of work life, without experiencing any negative
health outcomes (6). For transfluthrin, the expected adverse health issues from long-term
over exposure are liver damage and irritation to the lungs and the respiratory tract (6).
The United States military also uses Military Exposure Guidelines (MEGs). These
MEG's are used to determine acceptable exposure levels to troops while deployed. Some
27
potential exposures to troops may be only a couple of hours in duration, a couple of days,
or a year due to extended deployment periods. As a result, MEGs are issued for 8-hour,
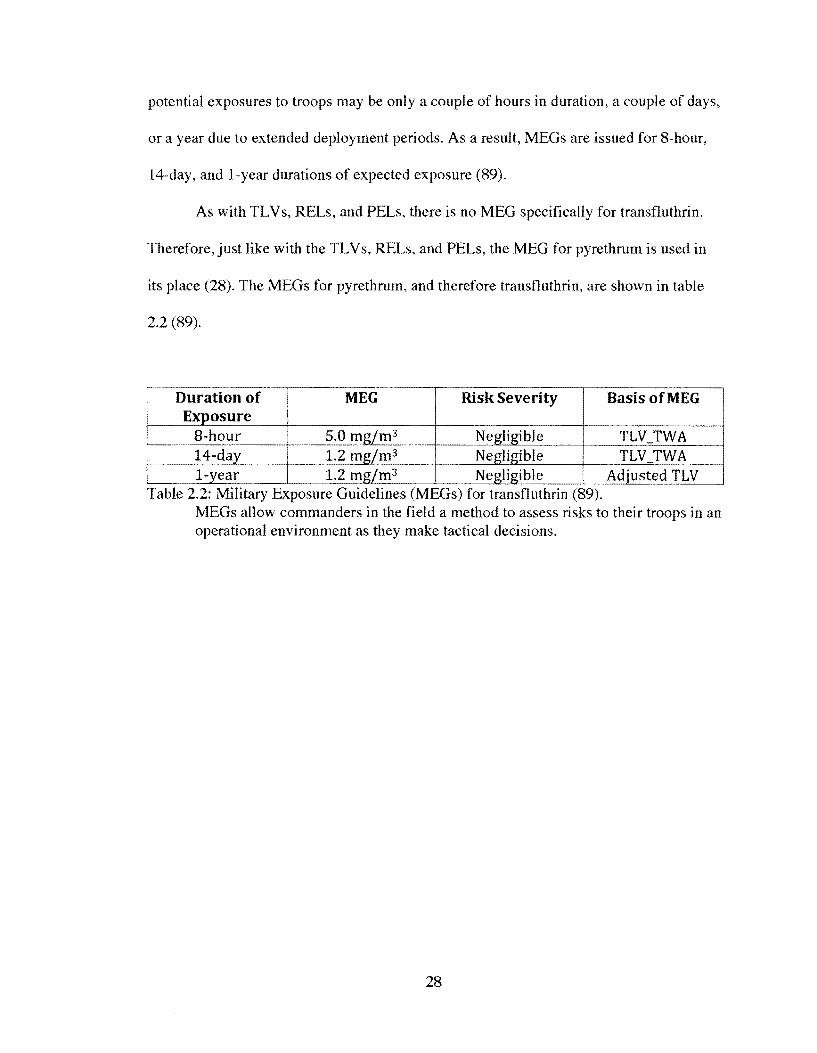
14-day, and 1-year durations of expected exposure (89).
As with TL Vs, RELs, and PELs, there is no MEG specifically for transfluthrin.
Therefore, just like with the TL Vs, RELs, and PELs, the MEG for pyrethrum is used in
its place (28). The MEGs for pyrethrum, and therefore transfluthrin, are shown in table
2.2 (89).
Duration of MEG Risk Severity Basis of MEG E
5.0 m m3 TL\f__TWA f-----~---+-_L2 mg/!113 TLV _TWA
1- ear 1.2 m m3 Negligible Adjusted TLV Table 2.2: Military Exposure Guidelines (MEGs) for transfluthrin (89).
MEGs allow commanders in the field a method to assess risks to their troops in an operational environment as they make tactical decisions.
28

Chapter 3: Methodology
METHOD
The concentration of airborne transfluthrin released from the treated hessian strips
was determined using an established OSHA air sampling method (OSHA Method 70)
under controlled conditions. There are no validated sampling and analysis methods
developed specifically for transfluthrin, or the other synthetic pyrethroids. The accepted
practice is to use the pyrethrum method (see Table 3.1) (28).
I !:~~~--~HA Method 70 (Pyrethrum) ·-· -~-J mpling I OSHA Versatile Sampler (OVS) tubes containing I
Media i XAD-2 ~esin (OVS-2) ! Ai_r Flow Rate 1.0 L_Lmin · Sample Time I 60 minutes ____ ---i Total Sample
60 L I
Volume __________________ I Analytical Gas Chromatograph - Flame Ionization Detector I
1 Method lGC-FlDJ j Table 3.1: Details of sampling method (59).
SET-UP
Greenhouse & Chamber
The research was conducted within an empty, temperature-controlled greenhouse
at the U.S. Department of Agriculture Agricultural Research Service (USDA-ARS)
facility in Beltsville, Maryland. This space was chosen because it was similar in size to
both single room dwellings and tents used by the military for work and sleeping (see
Figure 3.1 ).
29

Figure 3.1: Small greenhouse used for sampling. This small greenhouse was located at the USDA Agricultural Research Services, Agricultural Research Center in Beltsville, Maryland.
The greenhouse was equipped with a natural gas heater. The heater was
operational, but its blower caused turbulence within the air space of the greenhouse each
time it turned on. Therefore a chamber was constructed within the greenhouse to provide
a static environment. The chamber measured 4ft (1.22m) wide by 7ft (2.13m) tall by l lft
(3.35m) long, for a total chamber volume of 308ft3 (8.72m3). The chamber was
constructed on a platform to allow air from the greenhouse to circulate underneath it, and
all sides of the chamber had at least lft (0.3m) clearance to allow the surrounding air to
circulate and warm it evenly. The chamber was constructed of lumber and 6-mil clear
plastic sheeting.
30

Source Material
The source material consisted of transfluthrin-treated hessian strips. Hessian strips
are a burlap-type material made from grain storage bags (61). These burlap-like strips
were treated with a combined transfluthrin, detergent, and water solution (lOml
transfluthrin, 90ml liquid detergent, and 400ml water) and were prepared by the USDA
laboratory in Jacksonville, Florida. The resulting treated strips contained 15.0?g of
transfluthrin at 0.29g per 100cm2• The treated 263cm by 20cm (5260cm2
) hessian strip
was cut into I ?cm by 20cm (340cm2) sections each containing 0.9 grams of transfluthrin.
The treated 340cm2 hessian strips were stored in a refrigerator until use.
In the Ogoma study, 400cm by 30cm strips of treated hessian sacking were used
in a 60m by 2 m by 2.Sm netting tunnel. For this work, a fresh 17cm by 20cm piece of
treated hessian strip was hung at one end of the experimental chamber at the beginning of
each sampling day. The strip was hung at a height of Im, centered left to right within the
chamber.
Air Sampling Points
The sampling points were distributed throughout the chamber at 1 m intervals
horizontally from the source material. Samples were collected at horizontal distances of
I, 2, and 3 meters from the source. These sample points and the source material were all
located at a height of lm above the floor. In addition, at the 2m distance, samples were
collected at the floor (height of Om) and ceiling (height of 2m). This arrangement allowed
for the comparison of airborne concentrations at the 3 distances, and the 3 heights.
Figure 3.2 is the view from the top of the chamber looking down. It shows the
spacing between the source material and sample blocks. It also shows that the source
31

material and sample blocks were positioned down the center of the chamber. Figure 3.3 is
the view from the side of the chamber, which displays the corresponding distances and
heights for both the source material and the sample blocks.
+ 0.6m
+
+ 0.6m
+
+Im+ Sample Block
+Im+ Sample Block
+Im+
Figure 3.2: Top view of experimental layout. The top view of the experimental layout indicates the distances between the sample blocks and the source material. All sample blocks, and the source material were positioned along the center of the chamber.
Sample I I
+ Im +
Burlap Strip
1 (Hei ht=Im
+ lm +
+tm+ Sample Block
Hei ht=Im +Im+
Figure 3.3: Side view of experimental layout.
Block l1
... (Hei ght=2m)
+ lm +
!Sample I Block + lm + i (Hei ht=lm
+ Im +
Sample Block
Hei ht=Om
I
Samplej11
Block (Hei ht=lm) !
The side view of the experimental chamber indicates distances and heights between sample blocks and source material.
32

Sample Blocks
In order to collect multiple sequential samples from each sampling location,
sample blocks were created to hold up to 10 samples each (see Figure 3.4). Before each
sampling day, the OVS-2 tubes for each sampling point were attached to the appropriate
piece of Tygon tubing and placed into the corresponding hole in the block. This allowed
sequential samples to be taken without the need to enter the chamber by switching the air
pumps from one tube to another outside the chamber.
Figure 3.4: Example of a sample block. Each sample block was designed to hold up to 10 OVS-2 sample tubes. This enabled multiple samples to be taken at each location during a run.
33

Air Pump Location
Due to the distinct temperature drop every time the door to the greenhouse was
opened, it was determined the air sampling pumps should be located not only outside the
chamber, but outside the greenhouse as well. To this end, first a tent, and then a shed
were erected next to the greenhouse. The Tygon tubing was run out of the greenhouse
from an air vent, through insulated ducting, and into the heated tent Once in the tent, the
multitude of Tygon tubes were labeled, color coded, and run to an air sampling pump
stand created for this specific purpose (see Figure 3.5). The air sampling pumps used
were Gillian 5000's (800-5000 cc/min)(Sensidyne, Clearwater, Florida) (77). The pumps
were calibrated before every run, and a post-run calibration check was performed at the
end of each day. All calibrations were conducted volumetrically with a DryCal Defender
510-M (Bias International, Butler, New Jersey) (12).
Figure 3.5: Air sampling pump stand. Color-coded and labeled air sampling pump stand located in tent adjacent to greenhouse. The color-coding and numbering system reduced the possibility of accidentally connecting the wrong tygon tube when changing samples during a run.
34

SAMPLING PLAN
8"Hour Sampling Day
Due to the wide variation in the times people may be working or sleeping in huts
or tents containing transfluthrin-treated hessian strips, an 8-hour sampling day was
selected. Additionally, utilizing an 8-hour day provided an opportunity to study the
movement of transfluthrin over time through the chamber, both from a distance and
height perspective from the source material. It was expected airborne concentration levels
of transfluthrin would start low and then rise over the course of the sampling day.
The 8-hour length of time as the length of time also matches the typical 8-hr
occupational exposure limit standards for most chemicals. Samples collected and
analyzed in this study allowed an 8-hour exposure to be calculated, with subsequent
comparison to the OSHA PEL and ACGIH TLV. Exposures from this study were not
expected to approach or exceed standards, the ability to quantitate over this period
allowed an easy comparison to established regulatory standards for a similar compound
(pyrethrum).
Per the OSHA method, each sample was collected at a flow rate of 1 Umin for 60
minutes (59). Due to logistical restrictions, it was decided to collect 5 samples from each
sampling point over the 8-hour day. These samples were collected during hours 1, 2, 4, 6,
and 8 of each sampling day (Table 3.2 shows visually how the samples were spread out
over time). No sampling took place during hours 3, 5, and 7. This timing scheme was
developed in an attempt to evaluate any potential initial increases in airborne
concentration and to characterize the directional movement and airborne concentration
over the entire chamber over the 8-hour sample day.
35

~···
t Hour# 1 2 3 4 7 8
Sample# 1 2 4 6 8
Table 3.2: Visual representation of sample timing. This visual representation shows sample collection times over each 8-hour run. A total of (5) - 1 h samples were collected from each sample point during each run.
Sample Locations
In order to assess the various airborne concentration levels of transfluthrin
throughout the chamber, sample points were needed at multiple locations. The simplest,
and most straightforward design was to place the sampling positions in a cross or plus
configuration (see Figure 3.6). The comparison of results from sample points 'Near',
'Center', and 'Far' allowed for analysis of airborne concentration gradients over distance
from the source material. And the comparison of results from sample points 'Top',
'Center', and 'Bottom' allowed for analysis of concentration gradients relative to height.
I Cen~ij Hessian 1
~!!:!P_J Near
Figure 3.6: Side view of experimental layout. This side view of the experimental sampling chamber indicates the sample point positions. The "plus" shaped pattern enabled comparisons of airborne concentrations over both distance from source and height above the floor.
36

Sampling Temperatures
To enable comparison of airborne transfluthrin concentrations over a range of
temperatures, discrete temperature points were required. The low end of the temperature
range of interest was 25°C (77°F). The temperatures used were 27°C, 33°C, 42°C, and
50°C ( +/- 2°C). Temperature was monitored continuously and recorded every 60 seconds
with a Hobo Data Logger ( +/-0.21°C)( Onset, Bourne, Massachusetts)( 62).
Sample Blanks and Passive Samples
The analytical method required one sample blank per 8-hour sampling day (59).
The blank is never exposed to the experimental environment and is used to detect
potential contamination of the samples from other sources. In addition, as no entry into
the greenhouse and sampling chamber was made during the 8-hour sampling day to avoid
affecting the airborne transfluthrin concentration levels, an assessment of the potential
impact of leaving uncapped 1-hour samples in the chamber for the entire day was desired.
This was due to the ability of the sorbent to potentially passively adsorb transfluthrin
from the air after the 1-hour active sampling period was complete. To document and
quantify any such passively adsorbed transfluthrin, one OVS-2 tube per run was
uncapped and placed in the 'Near' sample block. No Tygon tubing was attached to, or air
pulled through this passive sample.
Combined Sampling Plan
For each 8-hour sampling day during which successive I-hour samples were
taken, samples were collected at each of five locations within the chamber. At each of
these locations, 1-hour samples were collected during hours 1, 2, 4, 6, and 8, for a total of
five 1-hour samples per location. In addition, during each 8-hour sampling day there was
37

a passively exposed sample and one sample blank. The five samples for each of the five
locations, plus the passive and blank samples, resulted in twenty-seven samples per 8-
hour day. With four temperatures, each collected in triplicate; the resultant total of
samples collected was 324.
TEMPERATURE SPIKES
During the preliminary work to determine how consistent the thermostat within
the greenhouse was, it was observed that everyday there was a midday spike in
temperature of roughly 2°C. Once the test chamber was constructed within the
greenhouse, the midday temperature spike increased to almost 10°C. Covering the
greenhouse with a green 16x20ft general purpose tarp from Home Depot, and hanging a
blue 6x8ft Home Depot general purpose tarp inside the southerly facing end of the
greenhouse corrected this issue. The tarp inside the southerly facing end of the
greenhouse also helped reduce the severity of the temperature drop resulting from
opening the greenhouse door.
COLD CHAMBER
Subsequent to the tarp corrections to reduce overheating of the test chamber, it
was observed that the chamber inside the greenhouse was consistently 5°C cooler than
the rest of the greenhouse. There was observed to be adequate space on all sides of the
chamber, including beneath it, for the warm air from the greenhouse to keep it at
temperature. However, there was discovered to be insufficient air circulation around all
sides of the test chamber. The hot air from the heater was blowing down one side of the
chamber directly at the thermostat. Therefore, only one half of the greenhouse was being
kept at temperature. This resulted in the side of the chamber away from the heater
38
exhaust being exposed to considerably cooler air. This issue was resolved by hanging two
HDX 20in high velocity floor fans from the ceiling and placing one Lasko 16in
oscillating stand fan on top of the heater. The fans were able to increase circulation
within the greenhouse sufficiently to eliminate the temperature differences.
POST SUNSET WARMING
Once the mid-day temperature spikes and inadequate circulation issues were
resolved, it was discovered that the temperature within the chamber was still gradually
cooling by 5°C throughout the afternoon and into the evening. It was also observed once
the sun set, the temperature within the chamber would slowly increase back to the desired
set point. The thermostat was mounted to a dark piece of plywood. This plywood would
absorb a thermal load from the sun and radiate the heat to the thermostat mounted on the
other side of it. Covering a white plastic sign with aluminum foil and placing it between
the greenhouse glass and the dark plywood resolved the issue. After resolving the radiant
heat issue with the thermostat, the thermostat was able to function properly (within+/-
20C of set point temperature) at all times.
THE DESTRUCTIVE FORCES OF NATURE
After six of the twelve sampling days were completed, nature interrupted the
research by dumping 12 inches of snow on the research site and destroying the tent in
which the air sampling pumps and other equipment were located. While all equipment
was undamaged, a new environmentally controlled enclosure was needed before
sampling could resume. This obstacle was overcome by purchasing a small 3ft by 7ft
shed from Home Depot. This sturdier enclosure provided a space in which the air
39

sampling pumps could operate within their designed temperature range, therefore
allowing research to resume.
40
Chapter 4: Results
ST A TISTICAL ANAL YSJS
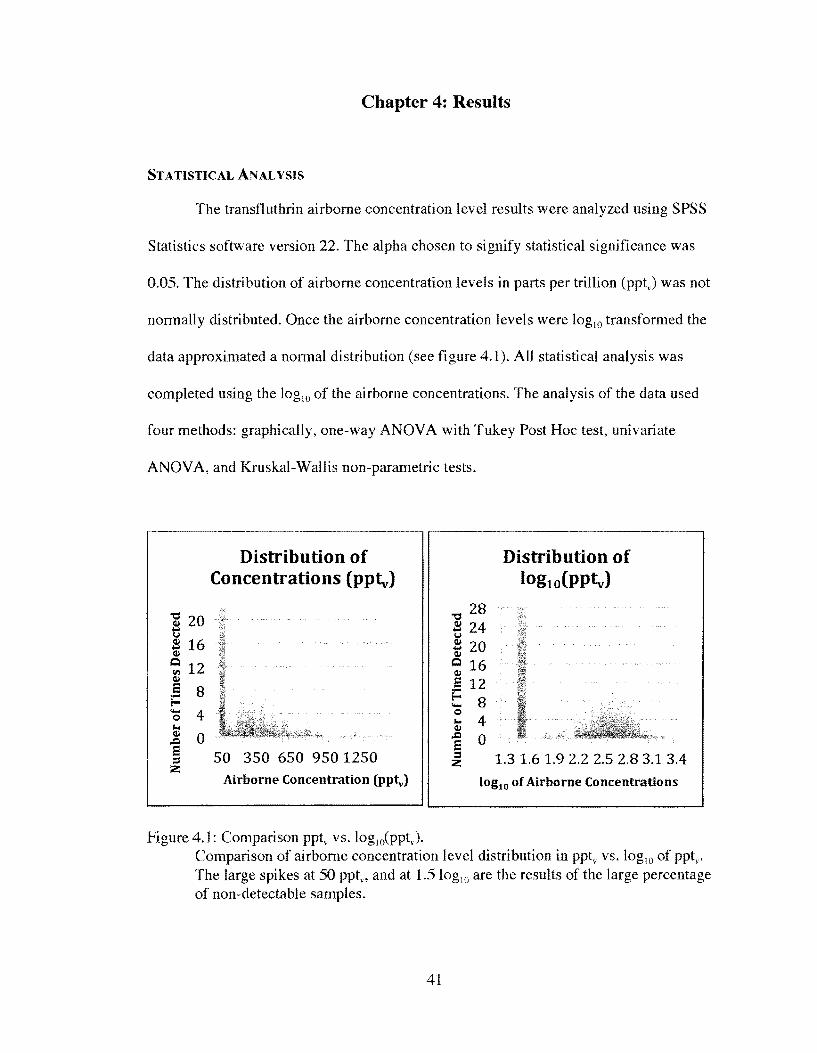
The transfluthrin airborne concentration level results were analyzed using SPSS
Statistics software version 22. The alpha chosen to signify statistical significance was
0.05. The distribution of airborne concentration levels in parts per trillion (pptJ was not
normally distributed. Once the airborne concentration levels were log10 transformed the
data approximated a normal distribution (see figure 4.1). All statistical analysis was
completed using the log10 of the airborne concentrations. The analysis of the data used
four methods: graphically, one-way ANO VA with Tukey Post Hoc test, univariate
ANOVA, and Kruskal-Wallis non-parametric tests.
-g 20 t $ 16 Q)
'; 12 Q)
.5 8 r-'O 4 '"' ~ 0 E = :z:
Distribution of Concentrations (pp4)
so 350 650 950 1250 Airborne Concentration (pp~)
Figure 4.1: Comparison pptv vs. log10(pptv).
"O 28 $ 24 u ~ 20 Q)
Q 16 Q)
E 12 E 8 0
'"' 4 Q)
..c 0 E = :z:
Distribution of log10(PP4)
1.3 1.6 1.9 2.2 2.5 2.8 3.1 3.4 log10 of Airborne Concentrations
Comparison of airborne concentration level distribution in pptv vs. log10 of pptv. The large spikes at 50 pptv, and at 1.5 log10 are the results of the large percentage of non-detectable samples.
41

Sixty-nine percent (208/300) of the analyzed samples were found to be below
analytical detection limits (57 ppt). These non-detects do not necessarily indicate the
sample was transfluthrin-free, only that the results fell below the analytical sensitivity
level of the instrument used in the analysis. All 75 samples collected at 27°C resulted in
non-detects; therefore the data from the three 8-hour sampling days at this temperature
were excluded from the statistical analysis. Following the guidelines for statistical
treatment of non-detects in environmental sampling from the United States
Environmental Protection Agency, (EPA) fifty-nine percent (133/225) of the remaining
samples were replaced with values equal to one half the limit of detection (60).
TIME
Airborne concentration levels of transfluthrin were not significantly different
when analyzed over time. This held true both for each of the individual sampling
locations (Near, Top, Center, Bottom, and Far) and for the chamber as a whole. The
"bottom" sample location was observed to experience the most change over time, which
would seem to suggest an association between concentration and time. However, the
effect was not statistically significant (see Table 4.1 ). Graphing the mean airborne
concentrations for the chamber as a whole does not suggest any impact in concentration
over time (see Figure 4.2). The univariate analysis of variance indicates combining
"time" with "temperature", "distance", or "height" causes the other condition to no longer
have a significant impact on concentration (see Table 4.2).
42

Significance :
Sample Location i
CJ!.-value) Near 0.489 TOJ!. 0.936 I
Center 0.763
'-Bottom 0.360 I
Far 0.837 i -- .... ~-~-'" ·····-~---~~··-- -·---·-·
Table 4.1: One-way ANO VA of Concentrations Over Time, Split by Location. One-way ANOVAs were conducted for each sampling location within the chamber, comparing concentrations over time. No location had a significant change in concentration during the 8-hour runs.
~ 3.0 Q. Q.
~ 2.5 Q f.l'l ,-4 2.0
I
........... + = 1.5 "' C1.)
~ 1.0
0
Mean Values Over Time log10(ppt)
1 2 3 4 5 6
Time Period
Figure 4.2: Mean Airborne Concentration Over Time.
7 8 9
The analysis of the data comparing the sample time periods to each other showed no significant difference (p=0.721) in airborne concentrations (log 10(pptJ) over time.
43

D d t v . bl e_Q_en en ana e: L o_g f t 10 0 ..2.Q!v
Source Significance (p-value}
Time .776
Time *Temp .727 Time * Distance .577 Time* Height .488 Time* Temp* Distance .850 Time* Temp* Height .382
Table 4.2: Univariate Analysis of Variance- Time Displayed. The analysis of the impact time had on airborne concentrations of transfluthrin showed that neither time, nor any combination of factors that took time into account, had any significant effect.
TEMPERATURE
Airborne concentration levels of transfluthrin were significantly different when
analyzed over the range of discrete temperatures. At three of the five sampling locations
(near, top, and center) the differences in airborne concentrations at each temperature were
statistically significant at p=0.000. For the other two locations (bottom and far), the
differences in airborne concentrations over the range of temperatures were not
statistically significant, with p-values of 0.441 and 0.110, respectively (see table 4.3). The
graph of the mean concentrations at each temperature suggests a direct correlation
between temperature and concentration (see Figure 4.3). The result of a univariate
analysis of variance comparing airborne concentrations at each of the discrete
temperatures confirms the correlation between airborne concentrations of transfluthrin
and temperature (p=0.000) (see Table 4.4).
44

--- ···········--······--·~
Significance -value) Sample Location
Near 0.000 To 0.000
· Center 0.000 Bottom 0.441 Far 0.110
Table 4.3: One-way ANO VA of Concentrations Over Temperature. One-way ANOVAs were conducted for each sampling location within the chamber, comparing concentrations at each temperature. Significant changes were found at the Near, Top, and Center locations (p=0.000). However, the Bottom, and Far locations did not show significant changes (p=0.441 & p=0.110)
Mean Values Over Temperate Range log10(ppt)
,,,..... 3.0 ..... c. c. ~2.5 ~
OD 0 Q 2.0
~ 1.5 f + = ~ 1.0 ~ 30 35 40 45 so
Run Temperature (°C)
Figure 4.3: Mean Airborne Concentrations Over Discrete Temperatures.
55
Comparison of the means of log10(pptJ at 33°C, 42°C, and 50°C. The analysis showed a clear correlation between increased temperature and increased airborne concentrations (p=0.000).
45

D d t V . bl L e_.e.en en ana e: 0_9.10 0 f PP1v
Source S!.g_nificance _(Q_-valuel
Temp .000
Time* Temp .727
Temp * Distance .000
Temp* Height .001
Time* Temp* Distance .850
Time* Temp* Height .382 Table 4.4: Univariate Analysis of Variance -Temperature Displayed.
The analysis of the data evaluating the impact of temperature on airborne concentrations show that temperature, and any other factor combined with temperature (except time) have significant impacts on airborne levels of transfluthrin.
DISTANCE
Airborne concentration levels of transfluthrin were significantly different when
analyzed over distance from the source material. At two of the three temperatures
analyzed (42°C and 50°C), the differences in airborne concentrations over distance were
statistically significant with p-values of 0.000 for both (see Table 4.5). There were no
statistically significant differences in airborne concentration over distance at 33°C
(p=0.628). The findings suggest an inverse correlation between distance from the source
material and airborne transfluthrin concentration levels (see Figure 4.4). The result of a
univariate analysis of variance comparing airborne concentrations at each distance
confirms the significant decrease in concentrations over distance (p=0.000) (see Table
4.6).
46

Temperature
33°C 42°C
Significance -value) 0.628 0.000 0.000
Table 4.5: One-way ANO VA Over Distance, Split by Temperature One-way ANOV As conducted for each temperature, evaluated the impact of distance on concentration levels. At the cooler temperature (33°C) there was no significant difference between distances (p::::0.628). However, at the higher temperatures (42°C & 50°C) distance did have a significant impact on concentration (p::::0.000). The disagreement between the temperatures is likely due to the high number of non-detects at 33°C.
Mean Values Over Distance log10 (ppt)
r-"I 3.0 "S-2.8 ~2.6 ~2.4
gf 2.2 ,_ 2.0 ~ 1.8 ,-4 1.6 '-._1.4 + 1.2 ; 1.0 QJ 0 ~
1 2 3
Distance From Source Material (meters)
Figure 4.4: Mean Airborne Concentration Over Distance Comparison of the means of log10(pptJ at l, 2, and 3 meters laterally from the source material. The analysis of the data comparing each of the distances to each other showed a clear inverse correlation between increasing distance and decreasing airborne concentrations (p::::0.000).
47

De endent Variable:
Source
Distance
ime * Distance
emp * Distance
Time* Temp* Distance
Si nificance -value
.000
.577
.000
.850
Table 4.6: Univariate Analysis of Variance - Distance Displayed. The univariate analysis of variance shows that both distance and any other variable combined with distance (except time) have significant impacts on airborne concentrations of transfluthrin.
HEIGHT
Airborne concentration levels of transfluthrin at 50°C were significantly different
when analyzed over height above the floor (p=0.002). However, this did not hold true at
the lower temperatures. At 33 °C and 42°C, the ANOV A resulted in p-values of 0.198 and
0.440 respectively (see Table 4.7). Neither of which is statistically significant. The
disparity in results at different temperatures is likely due to the high number of non-
detects at the lower temperatures making accurate analysis of the lower temperatures
difficult. The graph of the mean concentrations for all temperatures at each height does
not visually suggest a correlation between height and airborne concentrations of
transfluthrin (see Figure 4.5). The univariate analysis of variation, however, suggests
significant differences in airborne concentrations from one height to another do
exist(p=0.023) (see Table 4.8). Further analysis of the data indicates the airborne
concentrations of transfluthrin at heights of 1 and 2 meters are not statistically different
from each other. However, the airborne concentration of transfluthrin at a height of 0
meters (on the floor) is significantly lower than the other two heights. These differences
are made evident when comparing homogeneous subsets of the data (see Table 4.9).
48
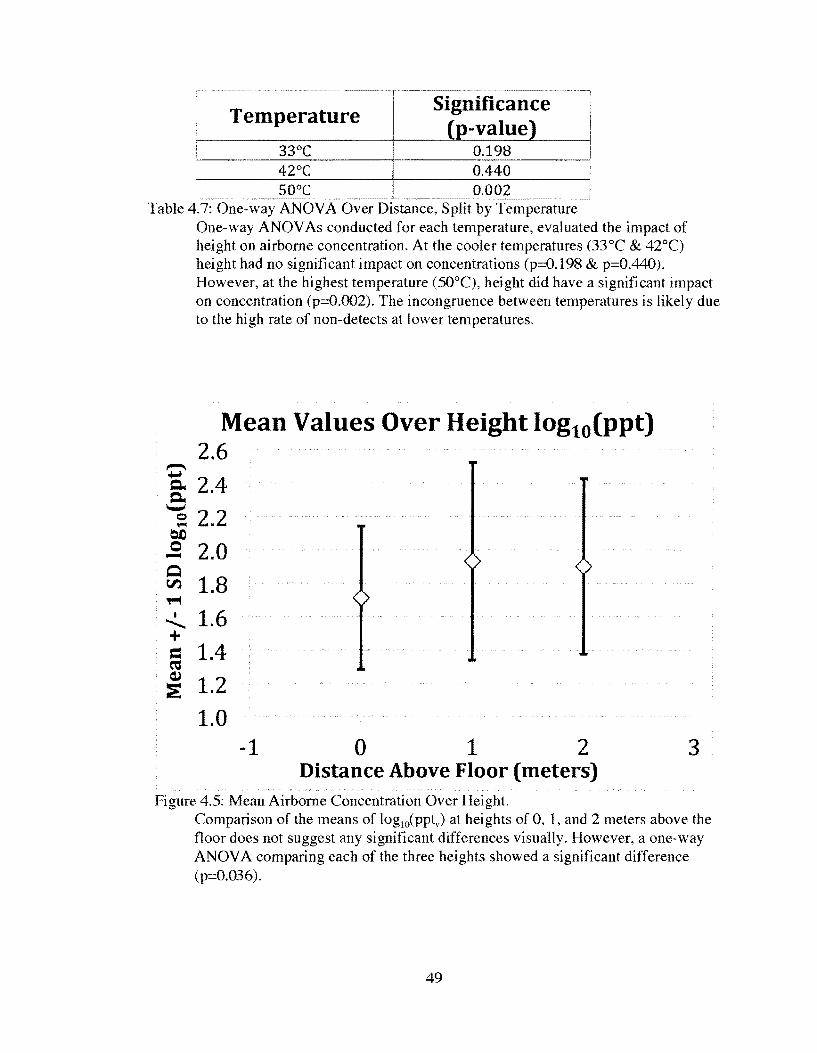
Temperature
33°C 42°C 50°C
Significance -value 0.198 0.440 0.002
Table 4.7: One-way ANOVA Over Distance, Split by Temperature
,,...., ..... Q.. Q..
"-"" Cl ~
~ 0 -Q
V'l ~
I ........... + = cu Q)
:;:
One-way ANOVAs conducted for each temperature, evaluated the impact of height on airborne concentration. At the cooler temperatures (33°C & 42°C) height had no significant impact on concentrations (p:::::0.198 & p:::::0.440). However, at the highest temperature (50°C), height did have a significant impact on concentration (p:::::0.002). The incongruence between temperatures is likely due to the high rate of non-detects at lower temperatures.
Mean Values Over Height log10(ppt) 2.6
2.4
2.2 2.0
1.8 1.6
1.4 1.2 1.0
-1 0 1 2 Distance Above Floor (meters)
3
Figure 4.5: Mean Airborne Concentration Over Height. Comparison of the means of log10(pptv) at heights of 0, 1, and 2 meters above the floor does not suggest any significant differences visually. However, a one-way ANOVA comparing each of the three heights showed a significant difference (p=0.036).
49

Dependent Variable: LOQ10 of pptv
Source Significance (p-value)
Height .023
Time * Height .488
Temp* Height .001
Time* Temp* Height .382
Table 4.8: Univariate Analysis of Variance -Height Displayed. The univariate analysis of variance shows that both height and temperature have significant impacts on airborne concentrations.
T k HSDab u ey
Height Above Floor Subset
N 1 ~-·
2
On Floor 45 1.7226 1 Meter From Floor 135 1.9401 2 Meters From Floor 45 1.9094 Sig. 1.000 i 0.911 Means for group in homogeneous subsets are displayed. Based on observed means. The error term is Mean Square (Error) = 0.162
a. Uses Harmonic Mean Sample Size= 57.857
b. The group sizes are unequal. The harmonic mean of the group sizes is used. Type I error levels are not JlUaranteed.
Table 4.9: Homogeneous Subsets of Concentrations by Height. Comparing the homogeneous subsets show where the significant difference is in airborne concentration of transfluthrin. The concentrations at heights of 1 & 2 meters above the floor are statistically the same, while the concentration at a height of 0 meters (on the floor) is significantly lower.
50

Chapter 5: Discussion
This research attempted to characterize the movement of transfluthrin in the
airborne environment within an enclosed space when emitted passively from treated
source material. To properly evaluate the behavior of transfluthrin in the air, several
specific factors were investigated. These factors were time, temperature, distance from
the source of transfluthrin, and height.
TIME
In evaluating the effects of time on airborne concentrations of transfluthrin,
several decisions had to be made. Based on the proposed ideas by the Armed Forces Pest
Management Board (AFPMB) to use passively emitted transfluthrin source material in
work places and sleeping tents, an 8-hour sampling day was selected. The duration of
each air sample was defined by the validated OSHA sampling method 70 which was
determined to be the most appropriate for the compound (as no established method
specifically for transfluthrin exists), which is 60 minutes in length (59). With each sample
being 1 hour in length, the sampling frequency was established as one sample at each
location, every hour, for the duration of each 8-hour sampling day. Logistical issues
forced the number of samples to be reduced to five, l-hour samples, spread over each 8-
hour sampling day.
The finding of no significant differences in airborne concentration levels between
time periods suggests two important things. The first is that transfluthrin seems to rapidly
permeate the chamber space. This suggestion appears to be supported as the sample
results from hour 1 (minute 0 to minute 60) were not statistically different from the
51

sample results from hour 8 (minute 420 to minute 480). This meets the American Society
for Testing and Material (ASTM) standard of three consecutive time periods without
significant differences for establishing equilibrium (13). This implies once an effective
mass loading of transfluthrin is established and loaded onto a material, it could provide
near-immediate effectiveness as a spatial repellency device upon hanging the source
material/device in the desired space. The second important point regarding these
statistically insignificant findings is a consistency and stability in airborne concentration
levels. Once a steady state airborne concentration level is achieved, protection of the
people inside the space is provided for the duration of the workday/night if this airborne
concentration level has been determined through mosquito studies to be a level that
produces an effective spatial repellency.
There were no evident differences when visualizing the airborne concentration
levels of transfluthrin between samples from hour 1 through hour 8 at each respective
location, relative to the same location point, but statistically significant differences were
observed when comparing the different locations within the chamber. While the number
of data points for each of the five sampling locations was too small to conduct a statistical
analysis for each location, a clear pattern emerged from the data. Within the first hour,
transfluthrin had spread to every part of the chamber according to the airborne
concentration levels measured at the various sampling points in the chamber. Sampling
points close to the source material produced higher concentration levels of transfluthrin
than those farther away from the source. As time progressed, the airborne concentration
levels at the locations close to the source material remained steady (suggesting
concentration equilibrium at the locations nearest to the source), while the airborne
52

concentration levels at the farther points increased with each subsequent sampling period.
This pattern suggests that the transfluthrin contained in the source material rapidly
spreads throughout the chamber in a diffusive manner, eventually equilibrating with the
environment over a relatively short timeframe.
TEMPERATURE
The discrete temperatures used in this study were selected on the basis of varying
diurnal temperatures and extreme temperature points which deployed service members in
different locations abroad may potentially encounter. U.S. military and civilian personnel
are deployed or stationed all over the world in climates that range from arctic conditions
in Alaska, hot and humid in the Philippines, to the desert conditions of the Middle East.
Many places have significant temperature fluctuations between day and night. Personnel
need to be protected from vector borne diseases 24 hours a day. Any potential spatial
repellent would need to work over a wide range of temperatures. The low temperature
was selected to be 25°C as it is a common night or winter temperature, it is considered
standard work environment temperature, and there is growing evidence that mosquitoes
are less active and less infectious at temperatures below 25°C (27; 48). The high end of
the temperature range to be tested was determined by the capabilities of the natural gas
heater and the desire to replicate the extreme temperature encountered in areas such as
the Middle East (53.3°C recorded in Kuwait in 2010) (97). The sample runs were
conducted at 27°C, 33°C, 42°C, and 50°C (+/- 2°C). The +/-2°C level of consistency was
only achievable after taking into account and correcting the issues discussed in the
"methodology" chapter.
53

The findings of significant differences in airborne concentration levels of
transfluthrin at each of the four selected temperatures were consistent with previous work
on volatilization rates of other pesticides (18; 40). The vapor pressure of a pesticide is a
major factor in determining the volatilization rate. Increases in temperature increase the
effective vapor pressure and therefore the volatilization rate (40).
The research suggested a correlation between increasing temperatures and
increased airborne concentration levels of transfluthrin. Disease carrying vectors live in a
wide variety of temperature range. The Anopheles mosquito, which is responsible for
transmitting malaria, lives comfortably between 17-33°C (44).
The cooler it is, the more protective clothing people can comfortably wear. As the
temperature increases, and comfort drives people to wear fewer protective layers and to
leave windows open to allow for a cooling breeze, the protective concentration of
transfl uthrin in the air increases. In a fortuitous way, as people may increase their
vulnerability to disease-carrying insects in warmer temperatures, the airborne
concentration of transfluthrin will be higher as well, thus likely providing increased
repellency against these pests.
DISTANCE
The findings of significant differences in airborne concentrations of transfluthrin
at different distances suggest the potential for overlapping areas of protection (see Figure
5.2). Not every tent may require a transfluthrin-containing device or source within it if
the effective spatial repellency area of the compound extends beyond the tent containing
it. It may be enough to protect every other tent, and the remaining tents and surrounding
areas may be adequately protected by the overlap. Future studies correlating airborne
54

concentrations to mosquito behavior are required to determine how wide, high, and
directional the protective "bubble" actually is, and what spacing is required to provide
protective overlapping areas.
•=Area of adequate protection
D=Area of inadequate protection
Figure 5.2: Potential overlapping areas of protection. In a camp or village setting, structures tend to be closely spaced. Each structure protected by a spatial repellent would also be surrounded by a bubble of lower concentration that would provide inadequate protection. The overlapping areas of these larger bubbles have the potential to reach sufficient concentration levels to be protective.
HEIGHT
The findings suggest a clear pattern of movement and delineation of airborne
concentrations by height. As the transfluthrin emanates from the treated source material
at a height of I meter, it was observed to move laterally and upward. As a result, the
highest concentrations were found at height of 1 and 2 meters above the floor.
Transfluthrin was detected at a height of 0 meters (floor height), but at significantly lower
55

concentrations. The implication of this finding is the best protection would seem to be
provided at heights of lm and above. While active, personnel may have exposed skin
(sleeves rolled up) but would be within the range of higher concentration (see Figure 5.3).
At night, while sleeping on the floor (height of O.Om) or on a cot (height of 0.45m),
personnel would be in the area of lower concentration, but would likely have the
additional protection of bed netting (95). This lower concentration would also allow
sleeping personnel to minimize their inhalation exposure to airborne transfluthrin.
Top 1/3
Middle 1/3
Bottom 1/3
Figure 5.3: Airborne concentration levels by layer.
2m
•=Higher Concentration
D=Lower Concentration
The data suggests that as transfluthrin moves through still air, that it progresses laterally and upward. As a result the highest concentrations of airborne transfluthrin are located at heights equal to, and above the source material.
OTHER FACTORS OF NOTE
In addition to the factors of time, temperature, distance, and height already
discussed, two other factors played a major roll in determining the airborne
concentrations of transfluthrin detected. These factors are the amount of transfluthrin
56

loaded onto the source material and the surf ace area of said source material. During this
research, both factors were kept consistent to enable comparisons between sampling
days. But the potential impact of both factors must be understood.
Mass Loading
During the Ogoma et al. study each strip was loaded with 15.07g of transfluthrin
(61). As discussed earlier in the methodology section, this research used strips containing
only 0.9g of transfluthrin each. If both masses were applied to sufficiently large, and
identical pieces of hessian cloth, and these strips were placed into identical testing
chambers in which it was possible to achieve equilibrium, logic dictates different results
would be expected. If a theoretical 1 % of the transfluthrin from each strip were required
to be airborne to achieve equilibrium, then one test chamber would have 0.15g of
transfluthrin spread throughout the chamber volume, while the other would only have
0.009g of transfluthrin in the air. This distinction is important when trying to compare
research conducted by different groups.
Surface Area
Continuing the comparison of the Ogoma et al. study with this research, surface
area must be accounted for. Ogoma et al. applied 15.07g of transfluthrin to hessian strips
12,000cm2 in size resulting in a concentration of 0.0012g of transfluthrin per cm2 ( 61 ).
This research used strips of 340cm2 containing 0.9g of transfluthrin resulting in a
concentration of 0.0026g of transfluthrin per cm2, or just over double the concentration of
the Ogoma study. If a direct comparison study were conducted comparing airborne
concentrations resulting from an identically sized strip with each concentration, the
57

expected results would show the higher strip concentration resulting in a higher airborne
concentration.
The correlation of higher concentrations on fabric to higher airborne
concentrations only holds true to a point. Any given piece of fabric only has a certain
amount of surface area to which transfluthrin can be placed. Once the surface is saturated
with transfluthrin, any additional transfluthrin will form a new layer covering the lower
one. The resulting covered layer is unable to volatize, as it has no contact with the air.
The result of this complicated relationship between the concentrations of transfluthrin on
fabric to airborne transfluthrin makes it hard to compare research conducted by different
groups to each other. But an understanding of the impact must be taken into account
when designing future research.
58

Chapter 6: Conclusions I Future Research
The results of this study suggest temperature, distance from source, and height
above the floor, all have significant impacts on the airborne concentration of
transfluthrin. Time did not appear to have an effect on concentration. These results
suggest transfluthrin may be an effective choice for use as a fast-acting spatial repellent
against disease-carrying pests. However, future studies are required to determine the
mass loading and surface area of source material that will yield airborne concentrations
for effective repellency as well as airborne concentrations that will provide an acceptable
margin of safety for human health.
Many locations with endemic vector-borne diseases are geographically located in
tropical or sub-tropical areas having high, or greatly fluctuating levels of relative
humidity (RH). This study controlled RH levels to below 40% in an attempt to focus on
the impact of ambient temperature. A dehumidifier was utilized to keep the RH below
40% for all sample runs. Future research should evaluate the effects of RH on passive
emission rates of transfluthrin as it may have a significant impact on the airborne
concentration levels, and thus the effective spatial repellency of the compound(40).
Few tents or huts are sealed tightly, resulting in most having some level of air
exchange. Many even have screen windows to allow for a cooling breeze. Previous
research has shown the typical air change rate in a typical Thailand hut with screen
windows to be 6-9 complete air changes per hour (13). This research looked at airborne
concentrations in an enclosed space with still air and an air change rate of 0.03 air
changes per hour, or about 1 complete air change per day. Future work should be
59

conducted to evaluate airborne concentration levels in spaces over a range of reasonable
air change rates.
This study was conducted at temperatures between 27°C and 50°C. Potential
vectors for disease live comfortably at temperatures lower than 27°C (44). Future
research should include cooler temperatures such as 20°C, or even l5°C. If the trend
suggested by this study continues to lower temperatures, the airborne concentrations of
transfluthrin at these cooler temperatures will require modifying the sampling method
used, or require using a different sampling method completely, given the likely trace
amounts of transfluthrin mass within the airborne space.
Occupational Safety and Health Administration sampling method 70 calls for the
samples to be collected at 1 liter of air per minute, for 60 minutes (59). Future studies
should consider increasing the flow rate and/or increasing the sampling time. Doubling
the sample time to 120 minutes would cut the limit of detection in half. This increase in
sampling time would reduce a researcher's ability to track changes in concentrations over
smaller time periods. However, the number of non-detect samples would be greatly
reduced. lncreasing the collection rate from 1 liter per minute to 2 or 3 liters per minute is
also a possibility, as long as the pressure drop effects within the sampling tubes are
evaluated. If a higher flow rate could be used, then the researcher could continue to track,
and perhaps enhance the tracking, of changes in airborne concentrations over time by
examining changes every 30-60 minutes. Non-OSHA methods may also provide
additional sampling options.
This study collected 1-hour samples successively over 8-hour sampling days.
When the chamber as a whole was evaluated, there were no significant changes in
60
concentration over time. Individual locations did demonstrate changes, indicating the
entire chamber volume had not reached equilibrium during the 8-hour time day (see Time
section of chapter 5 and Figure 5.1). Future research should evaluate airborne
concentrations of transfluthrin over a longer time period, such as 24 hours. Larger spaces
designed for living in deployed environments, such as medium and large tents, should
also be used in evaluating the spread of transfluthrin within spaces over time.
The potential variations in mass of transfluthrin and surface area are nearly
infinite. Future research should evaluate the effects of keeping the mass consistent while
changing the surface area, and the effects of changing the mass while keeping the surface
area consistent. This information would help guide future work into establishing the most
efficient, and cost effective, method of delivering desired airborne concentrations for use
as a spatial repellent or insecticide.
A multi-disciplinary approach to future research would greatly enhance the level
of knowledge and help create a more complete picture in regards to the potential use of
transfluthrin as a spatial repellent. Future work involving both mosquito behavioral
studies and airborne concentration characterization of transfluthrin over a range of
temperatures would allow entomologists and pest control personnel to determine the most
judicious mass amounts required for spatial repellency over desired spaces and
timeframes while public health/occupational health personnel such as industrial
hygienists could compare measured airborne concentration values to human health
guidelines developed for specific pyrethroids or similar classes.
61

REFERENCES
1. 2005. Biological Science. pp Figure 45-8c. Pearson Prentice Hall, Inc.
2. A. Ardhanari, U. Srivastava, A. Kumar, S. Saxena. 2011. Management of a Case of Prallethrin Poinsoning - An Unusual Agent for Suicidal Ingestion. Sri Lankan Journal of Anaestesiology 19:51-2
3. Achee N, Masuoka P, Smith P, Martin N, Chareonviryiphap T, et al. 2012. Identifying the effective concentration for spatial repellency of the dengue vector Aedes aegypti. Parasites & vectors 5:300
4. Agency for Toxic Substances and Disease Registry. 2004. DEET Chemical Technical Summary for Public Health and Public Safety Professionals. bJtfil/W~ilJ:$dr .. ~d_!7_.gQy/c_o_ri$Y]tiiJJ9nsJ.d(;gtJ?nYiro_nm~_n_t:C1l.ht:rnl
5. Aldridge WN. 1990. An Assessment of the Toxicological Properties of Pyrethroids and Their Neurotoxicity. Critical Reviews In Toxicology 21:89-104
6. American Conference of Governmental Industrial Hygienists. 2010. TL V's and BEi's. In TLV's, ed. ACGIH. Cincinnati, Ohio: ACGIH
7. Argueta, Tamara Belzabel Obispo, Kawada H, Takagi M. 2004. Spatial repellency of metofluthrin-impregnated multilayer paper strip against Aedes albopictus under outdoor conditions, Nagasaki, Japan. flfl!EIJ/fff!I (Animal Health Service) 55:211-6
8. Armed Forces Pest Management Board. 2014. Depoyed War-Fighter Protection (DWFP) Program Overview. htt:pj/www,9Jp_mb_&rg/nod~6.2
9. Baskin S. 1996. DDT and its Metabolites. ht:t_p_:J/www.c?.?Jeciwf!rci_s.~gJJJch~mLCh~mi~t_rYLCHEM_29LCHEMZ9Jddt/dci_t ,_ht:rnJ
10. Baygon. 20 l 4. FAQ's. ht:t:p: LlwwW,$Giob n$Qn.co.Yl<L11sc:ont:rnts.:fm?aJd::::ZJS
11. Beard J. 2006. DDT and Human Health. Science of The Total Environment 355:78-89
12. Bios International Corporation. 2014. Bias. htt:p~/J:wwvv"~-rivironm~ntcil:: ?_)(pen._c:_o_m /_c:smipfl_l)_i~~/_bJo~--_int:~rm1 ti QDfl1::f_QU19J:f!Ji Qll:3!if27
13. Brown CW. 2012. Use of a Box Model to Estimate the Airborne Concentration of Volatilized DDT in as Experimental Hut in a Tropical Climate. Uniformed Services University of the Health Sciences, Bethesda, Maryland
62

14. Bushra Mina, Maciej Walczyszyn, Mary Jane Reed,. 2014. Noninvasive Mechanical Ventilation After Chemical Disasters. pp 163-173. Springer Vienna
15. Californai Environmental Protection Agency. 2000. DEET Risk Characterization Document. ed. DoP Regulation. Sacramento, California: Department of Pesticide Regulation
16. Carson R. 1%2. Silent Spring. pp 158-161. Boston, Massachusetts: Haughton Mifflin Company. 378 pp.
17. Centers for Disease Control and Prevention. 2014. Malaria. ht:tp:/ iwww.c_d~.gmrj_m9l¥liil
18. Claude Schummer, Elodie Mothiron, Brice M.R. Appenzeller, Anne-Laure Rizet, Robert Wennig, Maurice Millet,. 2010. Temporal variations of concentrations of currently used pesticides in the atmoshphere of Strasbourg, France. Environmental Pollution 158
19. Constant V. Edi, Luc Djogbenou, Adam M. Jenkins, Kimberly Regna, Marc A.T. Muskavitch, Rodolphe Poupardin, Christopher M. Jones, John Essandoh, Guillaume K. Ketoh, Mark J.I. Paine, Benjamin G. Koudou, Martin J. Donnelly, Hilary Ranson, David Weetman,. 2014. CYP6 P450 Enzymes and ACE-1 Duplicate Produce Extreme and Multiple Insecticide Resistance in the Malaria Mosquito Anopheles gambiae. PLOS Genetics 10
20. D.M. Soderlund, J.R. Bloomquist,. 1989. Neurotoxic Actions of Pyrethroid Insecticides. Annual Review of Entomology 34
21. Bhaskar, S. Moorthy, G. Gnaeshwala, G. Abraham. 2010. Cardiac Conduction Disturbance Due To Prallethrin (Pyrethroid) Poisoning. Journal of Medical Toxicology 6:27-30
22. Elliott M, Janes N, Potter C. 1978. The future of pyrethroids in insect control. Annual Review of Entomology 23:443-69
23. Endura Fine Chemicals. 2013. Transfluthrin.
24. Environmental Protection Agency. 2012. DDT-A Brief History and Status. ht:tp;Ljw_ww&p<:1,g9yjpe~_tlclcies/fac:tshee1:$/~he_mic:<:ils/ci_c:lJ:brie_f:hi~J9ry: st:(ltus.ht:m
25. EXTOXNET. Permethrin. pmep.cce.cornell.edu/profiles/extoxnet/metirampropoxur/permethrin-ext.html
26. F. He, S. Wang, L. Liu, S. Chen, Z. Zhang, J. Sun,. 1989. CUnical manifestations and diagnosis of acute pyrethriod poisoning. Archives of Toxicology 63:54-8
63
27. Food and Drug Administration Office of Regulatory Affairs. 2008. Facilities and Environmental Conditions.
28. G. Cecchine, B.A. Golomb, L.H. Hilborne, D.M. Spektor, C.R. Anthony. 2000. A Review of the Scientific Literature as it Pertains to Gulf War Illnesses. National Defense Research Institute
29. George W. Ware, David M. Whitacre. 2004. The Pesticide Book. Willoughby, Ohio: MeisterPro Information Resources
30. Harrison G. 1978. Mosquitoes, malaria and man: A history of the hostilities since 1880 . . Mosquitoes, malaria and man: a hfa-rory of the hostilities since 1880.
31. Heather M. Ferguson, Kija R. Hg'habi, Thomas Walder, Demetrius Kadungula, Sarah J. Moore, Issa Lyimo, Tanya L. Russell, Honarathy Urassa, Hassan Mshinda, Gerry F. Killeen, Bart G.J. Knols,. 2008. Establishment of a large semifield system for experimental study of African malaria vector ecology and control in Tanzania. Malaria Journal 7
32. Indranil Banerjee, SK Tripathy, A Sinha Roy,. 2012. Clinico-Epidemiological Characteristics of Patients Presenting with Organophosphorus Poisoning. North American Journal of Medical Sciences 4: 147-50
33. Infectious Diseases Society of America. 2005. New Study ldent~fies Louse-bourne Diseases That Ravaged Napoleon's Army. ht:tp://wID'Y.s_ci~nced_a_i_Iy.comLrg@51~~~/ZOO!iLWOSJZl.SJ28-17Z~,ht:rn
34. Institute of Medicine (US) Forum on Microbial Threats. 2008. Vector-Borne Diseases: Understanding the Environmental, Human Health, and Ecological Connections, Workshop Summary. Washington DC: National Academies Press (US)
35. Isabelle Dusfour, Nicole L. Achee, Donald R. Roberts, John P. Grieco. 2009. Contact irritancy and spacial repellency behaviors in Anopheles albimanus Wiedemann (Diptera: Culicidae) collected in Orange Walk, Belize, C.A. Journal of Vector Ecology 34:232-7
36. J. Schleier, P. Macedo, R. Davis, L. Shama, R. Peterson,. 2009. A twodimensional probabilistic acute human-health risk assessment of insecticide exposure after adult mosquito management. Stochastic Environmental Research and Risk Assessment 23:555-63
37. J.C. Van Dyk, H. Bouwman, l.E.J. Barnhoorn, M.S. Bornman. 2010. DDT contanimation from indoor residual spraying for malaria control. Science of The Total Environment 408:2745-52
38. J.E. Casida, G.B. Quistad,. 1995. Pyrethrum Flowers: Production, Chemistry, and Uses. pp 121. New York: Oxford University Press
64

39. J.L. Nation. 2002. Insect Physiology and Biochemistry. Boca Ratan, Florida, USA: CRC Press LLC
40. J.W. Jansma, J.B.H.J. Linders,. 1995. Volatilization of Pesticides from Soil and Plants After Spraying. Bilthoven, Netherlands: National Institute of Public Health and Environmental Protection
41. Joseph C. Dickens JDB. 2013. Mini review: Mode of action of mosquito repellents. Pesticide Biochemistry and Physiology 106: 149-55
42. Junshi Miyamoto, Hideo Kaneko, Ryozo Tsuji, Yasuyoshi Okuno,. 1995. Pyrethroids, nerve poisons: how thier risks to human health should be assessed. Toxicology Letters 82:933-40
43. L. Koo, J. Ho,. 1994. Mosquito Coil Smoke and Respiratory Health among Hong Kong Chinese: Results of Three Epidemiological Studies. Indoor and Built Environment 3 :304-10
44. Lindsay M. Beck-Johnson, William A. Nelson, Krijn P. Paaijmans, Andrew Read, Matthew B. Thomas, Ottar N. Bjornstad,. 2013. The Effect of Temperature on Anopheles Mosquito Population Dynamics and the Potential for Malaira Transmission. PLOS ONE 8
45. M. Elliott, A.W. Farnham, N.F. Janes, P.H. Needham, D.A. Pulman, J.H. Stevenson,. 1973. A Photostable Pyrethroid. Nature: 169-70
46. Maria Cone, Environmental Health News,. Should DDT Be Used to Combat Malaria? Scientific American
47. Michalis Koureas, Andreas Tsakalof, Aristidis Tsatsakis, Christos Hadjichristodoulou,. 2012. Systematic review of biomonitoring studies to determine the association between exposure to organophsphorus and pyrethroid insecticides and human health outcomes. Toxicology Letters 210: 155-68
48. Moshe B. Hos hen, Andrew P. Morse. 2004. A weather-driven model of malaria transmission. Malaria Journal 3
49. National Center for Biotechnology Information. PuhChem Compound. pu bchem.ncbi .nlm.nih. gov
50. National Institute for Occupational Safety and Health. 2005. NIOSH Pocket Guide to Chemical Hazards. Cincinnati, Ohio: NIOSH Publications
51. National Pesticide Information Center. 1998. Pyrethrins & Pyrethroids.
52. National Pesticide Information Center. 1999. DDT (General Fact Sheet).
65

53. National Pesticide Information Center. 2014. Permethrin Technical Fact Sheet. npic.orst.edu/factsheets/Permtech.html
54. Naumann K. 1990. Synthetic Pyrethroid Insectides: Structures and Properties. Springer-Verlag
55. Nazimek T, Wasak M, Zgrajka W, Turski WA. 2011. Content of transfluthrin in indoor air during the use of electro-vaporizers. Annals of Agricultural and Environmental Medicine 18:85-8
56. Network ET. 1994. Pyrethins and Pyrethroids. b_ttp:/f~}{_tmm~_tor~t&cJµipJpupyrntbri.hLrn
57. Nicholas J. Martin, Philip A. Smith, Nicole L Achee, Gerald T. DeLong. 2013. Determining Airborne Concentrations of Spatial Repellent Chemicals in Mosquito Behavior Assay Systems. PLOS ONE 8
58. Nicole Achee, Michael Bangs, Robert Farlow, Gerry Killeen, Steve Lindsay, James Logan, Sarah Moore, Mark Rowland, Kevin Sweeney, Steve Torr, Laurence Zwiebel, John Grieco,. 2012. Spatial repellents:from discovery and development to evidence-based validation. Malaria Journal
59. Occupational Safety and Health Administration (OSHA). Method 70 - Pyrethrum.
60. Office of Pesticide Programs. 2000. Assigning Values to Non-Detect/NonQuantified Pesticide Residues in Human Health Food Exposure Assessments. ed. OoP Programs. Washington, DC: United States Environmental Protection Agency
61. Ogoma SB, Ngonyani H, Simfukwe ET, Mseka A, Moore J, Killeen GF. 2012. Spatial repellency of transfluthrin-treated hessian strips against laboratory-reared Anopheles arabiensis mosquitoes in a semi-field tunnel cage. Parasit Vectors 5:54-61
62. Onset. 2014. Ul4 LCD Logger.
63. P.P. Singh, A.S. Udeaan, S. Battu. 1992. DDT and HCH residues in indoor air arising from their use in malaria control programmes. Science a/The Total Environment 116:83-92
64. Pates H, Lines J, Keto A, Miller J. 2002. Personal protection against mosquitoes in Dar es Salaam, Tanzania, by using a kerosene oil lamp to vaporize transfluthrin. Medical and veterinary entomology 16:277-84
65. Pesticide Target Interaction Database. 2012. Transfluthrin. httllJJJjlab_,_~~µst.egµ,.cn/ptid}i;gfl1P_Q_lJl1d/q~@ilil().4i,bJml
66

66. Pierluigi Cocco, Domenica Fadda, Beatrice Billai, Mario D'Atri, Massimo Melis, Aaron Blair,. 2005. Cancer Mortality among Men Occupationally Exposed to Dichlorodiphenyltrichloroethane. Cancer Research 65:9588-94
67. Pliney The Elder. 0078. The Natural History of Cultivated Trees. In Natural History. Rome
68. R. Peterson, P. Macedo, R. Davis,. 2006. A Human-Health Risk Assessment for West Nile Virus and Insecticides Used in Mosquito Management. Environmental Health Perspectives 114:366-72
69. Ramesh A, Vijayalakshmi A. 2001. Monitoring of allethrin, deltamethrin, esbiothrin, prallethrin and transfluthrin in air during the use of household mosquito repellents. Journal of Environmental iWonitoring 3: 191-3
70. Right Diagnosis. 2013. Chemical Poisoning - Transfluthrin. http:JLwww.rigbtgia,grrn$i$.cQmLc[c,h~mic,i!LpQisoning_transfh.1!brin/i11!rn~b
tm
71. Royal Society of Chemistry. 2011. Green Trends in Insect Control. Royal Society of Chemistry
72. Royal Society of Chemistry. 2014. DDT. httn:Li_www.ch~m$pide_r,<,:9mJCb~mic_al:Strn_c_tµre.23_2J3J1tml
73. Royal Society of Chemistry. 2014. DEET. h_ttf2:L/ww_w,c,he m_s_pJd~L<::P_m/C:h~mi<::<tJ:Strtt~t!fft;:.4.13 3Jitml
74. S.C. Johnson & Son Inc. 2014. Baygon Agents. b!tp://'tt'!iw.scj9J1nson,co_,µkjnq~QiltenJ.c_fm Za~id:::i20
75. S.Chen, Z. Zhang, F. He, P. Yao, Y. Wu, J. Sun, L. Liu, Q. Li,. 1991. An epidemiological study on occupational acute pyrethroid poisoning in cotton farmers. British Journal of Industrial Medicine 48:77-81
76. Salah A. Idris, Claire Robertson, M.A. Morris, Lorraine T. Gibson. 2010. A comparitive study of selected sorbents for sampling aromatic VOC's from indoor air. Analytical Methods 2: 1803-9
77. Sensidyne. 2009. Gilian 5000. ed. SIHS Instrumentation
78. Sigma-Aldrich. DDT MSDS. htt:p_:jjww_w.filgm9a,Jc,lJ'ic,h,<,:_0_1njMJ;J2S/MSDS/Oi$plC1yM_SJ2SE_a,ge,go1~9\.lJl!IY=: IJS&l<!_IJg_u_gg<;_:::_i;:n&_prncll.l ctN Y.mbe r::::36()3_4_Q&brnnd =AL 081Cl:l&Pa,gt;J oGoTQ lJRL=:http31t3A%2_F%f£\YWY.Y-~igmga,Jci_ri_c:~h,c:om%2E~a,~t<iJQg%2E~<tn::h%3Ein ter_fu~~%:312AU%2!l!~rrn%:3_D DJ2T%_26N% 3DQ%2-6-mP9~%_3J)_matc:b pa,rt_i_c1l_111<t){%26focJ.1$9(q_3_l)p_r9du_c:t%2_()la11_g%:3_De_11%2_6_rggiQJ1_%_aQJJS
67

79. Sigma-Aldrich. DEET MSDS. bttp:jjww_w~jgm_actlclri<::h_._c:ornLMSJ)S/_MSDSlPJsJJlctyMS_DSPC!g~.do?c;oyntry:::: llS_&l_ctnguage_:::e_u&prQcll1c.tNmnber_:::g~S_42&Jirnrni=FL11_M&P_<;u~tiQGc>TQURL,
=::bttp%3A%2E%2Fw~w,siw'!aklric:b,c9rn%-2Fc:.atal9g%2Ese_ctrc;h%3_Eim_erf f!C:~%3QAl1%_2Jitgr_m%3_I)I)_EJ~:T%2-6N%3D_Q~26mod~%3Pmatc;h pa.rti;:ilmct~%_2 6fpc_ys%3J::>.prn_cllLct%2(Jlf.!ng%3[)~n %29_rngiQ_l1°io.3 D U_S
80. Sigma-Aldrich. Permethrin MSDS. bttJlJJwww.!'>igmai!Jdri<::_b&Qrn/_M SPS/ M_S_ D SjDi~filciy_MS!)_SP_qg~,ci9}_c;9lJnJry::: 1LS-8tlct_IJg_l!age=e_n_&prociJ!~tNumJ~er::::442Z4J~&brand_:::SlJPE_L_c::_Q&Page1'QGoI_o 1l_RL.=::_http%_3_.t\%_2J'°ia.2Eww_w.?igmctalc:lrich.c.qrn__%2Jcatal_Qg%2Fprn_d.ll<::t-0/Q2E $l1pgk9%2.F 442ZJS_%3Elang%3 Pen
81. Sigma-Aldrich. 2012. Transfluthrin MSDS.
82. Stanton Cope, Daniel A. Stri.ckman, Graham B. White,, 2008. The Deployed Warfighter Protection Research Program: Finding New Methods to Vanquish Old Foes. The United States Army Medical Department Journal:9-20
83. T.G.E. Davies, L.M. Field, P.N.R. Usherwood, M.S. Williamson,. 2007. DDT, Pyrethroids and Insect Sodium Channels. Life 59:151-62
84. Tanner M, Savigny Dd. 2008. Malaria eradication back on the table. Bulletin of the World Health Organization 86:82-
85. Texas A&M AgriLife Extension. What is a pyrethroid insecticide? http: I Lwww. clt:ylmgs, t!lrrm,e_ci_l1/f9_ctshe~~fipm[e_11_t~{)9.Q3.
86. The Malaria Research Programme of the Medical Research Council SA. 2008. Malaria in South Africa. http://w'V!'lf.mCi1<!rif1.Qig.ZC1/IDala_ria_risJQl1P<:tate.htm1
87. U.S. Environmental Protection Agency. Pyrethroids and Pyrethrins. http://WW.Yt,~.Pfl,gQY/Qppsr:r:~U}_r!?!?Y<!l.Yill.iQn/py~t;hrqigs_:pJ!r~J:b.rin§_.hJ:ml
88. Ulysses S. Grant. 1885. Personal Memoirs of U.S. Grant. New York: Charles L. Webster & Company
89. United States Army Public Health Command. Technical Guide 230 Environmental Health Risk Assessment and Chemical Exposure Guidelines for Deployed Military Personnel. ed. Dot Army. Aberdeen Proving Ground, Maryland, USA: United States Army Public Health Command
90. United States Environmental Protection Agency. 2009. Reregistration Eligibility Decision for Permethrin. ed. USEPA
91. University of California San Diego. Bacillus thuringiensis: Resistance. htt12_:/Jw_ww.btM<::~d,ed_y[p_e_s_t..resista11c::e.,html
68

92. Walter Reed Society. 2010. Legacy of Walter Reed. l1ttp:/Jwww,w~lt~rrefJ!~Qc:igty,Qig/kg<lcy_QLWilLtE!r_rn~~df
93. Wharton RH. 1955. The Susceptibility of various Species of Mosquitos to DDT, Dieldrin and BHC. Bulletin of Entomological Research 46:301-9
94. World Health Organization. 2006. Transfluthrin, World Health Organization
95. httJJ://www,miltt<l,ryfielci~9f&Qm. 2014. US Military Aluminum Issued Cots.
96. Y. Du, W. Song, J.R. Groome, Y. Nomura, N. Luo, K. Dong. 2010. A negative charge in transmembrane segment 1 of domain II of the cockroach sodium channel is critical for channel gating and action of pyrethroid insecticides. Toxicology and Applied Pharmacology 247:53-9
97. Yale Environment 360. 2011. Nations Set Heat Records As Summer Temperatures Scorched Asia. Yale School of Forestry & Environmental Studies
69