RNA-Seq transcriptome analysis of Gonium pectorale cell cycle.
Characterization of the Small RNA Transcriptome of theDiatom, Thalassiosira pseudonanaTrina M. Norden-Krichmar1,2, Andrew E. Allen2*, Terry Gaasterland1, Mark Hildebrand1
1 Scripps Institution of Oceanography, University of California San Diego, La Jolla, California, United States of America, 2 J. Craig Venter Institute, San Diego, California,
United States of America
Abstract
This study presents the first characterization of endogenous small RNAs in a diatom, Thalassiosira pseudonana. Small RNAsact as transcriptional and translational regulators, controlling specific target genes involved in various cellular functions.Diatoms are unicellular photosynthetic organisms that play major roles in environmental processes, such as food webs andglobal carbon fixation. Small RNA cDNA libraries were constructed for exponentially growing T. pseudonana, and thensubjected to highly parallel pyrosequencing (454) and sequencing-by-ligation (Applied Biosystems SOLiD). From thecomputational analysis of approximately 300,000 sequences in the 454 library and over 17 million sequences in the SOLiDlibraries, there exists evidence of a core set of small RNA genes including: novel microRNAs, repeat-associated shortinterfering RNAs, and endogenous short interfering RNAs. The diatom genome contains elements similar to plant small RNAsystems, such as the RNAi machinery, a high percentage of short interfering RNAs originating from protein-coding andrepetitive regions of the genome, and putative binding sites of the small RNAs occurring primarily in the coding section ofthe predicted targets. The characterization of the small RNA transcriptome of T. pseudonana establishes the possibility of awide range of gene regulatory mechanisms in diatoms.
Citation: Norden-Krichmar TM, Allen AE, Gaasterland T, Hildebrand M (2011) Characterization of the Small RNA Transcriptome of the Diatom, Thalassiosirapseudonana. PLoS ONE 6(8): e22870. doi:10.1371/journal.pone.0022870
Editor: Iddo Friedberg, Miami University, United States of America
Received February 25, 2011; Accepted July 7, 2011; Published August 12, 2011
Copyright: � 2011 Norden-Krichmar et al. This is an open-access article distributed under the terms of the Creative Commons Attribution License, which permitsunrestricted use, distribution, and reproduction in any medium, provided the original author and source are credited.
Funding: This work was supported by the National Science Foundation [NSF-OCE-0722374, NSF-OCE-0727997, and NSF-MCB-1024913 to A.E.A.; NSF GraduateResearch Fellowship to T.M.N.-K.]; and the Air Force Office of Scientific Research [FA9550-08-1-0178 to M.H.]. The funders had no role in study design, datacollection and analysis, decision to publish, or preparation of the manuscript.
Competing Interests: The authors have declared that no competing interests exist.
* E-mail: [email protected]
Introduction
Diatoms are unicellular photosynthetic phytoplankton of global
importance. They are responsible for 20% of global carbon
fixation [1,2], and as such not only provide a major source of
carbon for food webs, but also are key players in atmospheric
carbon cycling and its attendant environmental issues. Diatoms
are in the heterokont class of microalgae, and have a distinct
evolutionary history relative to land plants and red, green, and
glaucophyte algae in that they are the result of a secondary
endosymbiotic event, whereby a free living heterotroph acquired a
plastid through enslavement of a red or green algae [3,4]. This
leads to a unique genetic complement in diatoms [5] and, by
inference, potentially unique gene expression control mechanisms.
In addition, the ocean environment is subject to dynamic changes
that frequently occur on short time scales, and organisms in this
environment must have gene expression control mechanisms to
enable rapid adaptation to these changes.
Complete genome sequences have now been reported for two
diatoms, Thalassiosira pseudonana [3] and Phaeodactylum tricornutum
[6]. Both species were selected for their small genome sizes (32.4
Megabases (Mb) and 27.4 Mb, respectively). These two diatom
genomes contain between 10,000 and 14,000 genes [3,6,7,8], of
which only around 50% of the genes can be assigned a putative
function based on current experimental knowledge, and about
35% are specific for each diatom [6,9].
Small non-coding RNA genes have been found in numerous
organisms where they act as transcriptional and translational
regulators of gene expression. Their ability to silence specific genes
affects a wide range of biological functions, ranging from gene
regulation during embryological development and cell differenti-
ation, to genome rearrangement [10]. Of the classes of small
RNAs, the microRNA (miRNA) family is the most extensively
characterized. MicroRNAs are estimated to occur at a frequency
of approximately 0.5–1.5% of the total genes in the genome of an
organism [11], and it is estimated that 20 to 30% of human genes
are regulated by miRNA [12]. Besides microRNAs, the remaining
types of small RNAs may be grouped together collectively as
endogenous short interfering RNAs (siRNA). Endogenous siRNAs
have been found in multicellular and unicellular plants and
animals [13]. The common characteristic of siRNA genes is that
their biogenesis involves double-stranded RNA, without a hairpin
precursor, which is in contrast to miRNAs [14]. The siRNA types
of relevance to this study include repeated-associated siRNAs
(rasiRNAs) and natural antisense siRNA.
While most research on eukaryotic small RNA to date has
focused on multicellular plants and animals, there have recently
been studies in unicellular eukaryotes. In particular, several types
of small RNAs were reported in the unicellular green algae
Chlamydomonas reinhardtii, following 454 sequencing of a small
cDNA library [15,16], and evidence of miRNAs has also been
recently found in the heterokont brown algae Ectocarpus siliculosus
PLoS ONE | www.plosone.org 1 August 2011 | Volume 6 | Issue 8 | e22870

[17] and the red algae Porphyra yezoensis [18]. Overall, these
studies identified miRNAs, phased siRNAs, tasiRNAs, and nat-
siRNAs. All of the miRNAs found that had the characteristic
hairpin structure precursor, were novel and did not exhibit
sequence identity with known plant and animal miRNAs. These
results are significant, since they imply that deep sequencing might
be the key to discovering miRNAs in organisms that have not yet
been studied extensively for small RNAs, or in which specific
miRNAs are not exceptionally highly represented. Highly ex-
pressed plant and animal small RNAs were initially characterized
using traditional cloning approaches [19,20,21]. Re-examination
of these organisms by deep sequencing approaches has revealed a
larger population that includes miRNAs expressed at lower levels
[22]. miRNAs with lower expression levels are generally not
conserved between organisms, suggesting that they play special-
ized roles [22].
Applied Biosystems (ABI) SOLiD next-generation sequencing
represents an emerging technology that may aid in the discovery of
small RNAs. The SOLiD (Supported Oligonucleotide Ligation
and Detection) platform utilizes a sequencing-by-ligation method,
which involves iterations of hybridization and ligation, on a glass
slide support, using probes labeled with four different fluorescent
dyes [23,24]. Each dye encodes a two-nucleotide pair, generating
sequence data represented in ‘‘colorspace’’ format, rather than in
nucleotide ‘‘base space’’ data format. The promise of resequencing
applications and transcriptomic analyses has brought this next
generation sequencing technology to the forefront [23,25]. To
date, there have been only a small number of published studies
using SOLiD for identifying miRNAs in standard model orga-
nisms, such as human, rat, and Arabidopsis [26,27,28,29], and no
studies have been reported on a nonstandard model organism,
such as the diatom.
In this study, we applied both 454 and SOLiD deep sequencing
approaches to characterize classes of small RNAs from the diatom
Thalassiosira pseudonana, determine their similarity to plant and
animal small RNAs, examine their genomic distribution, and
identify potential target mRNAs for regulation. Comparison of
both approaches (which included two different sample preparation
methods and biological and technical replicates) was done to
obtain a broader-based look at the small RNA population, with
454 providing accurate evaluation of small RNA lengths and
terminal nucleotides, and SOLiD providing deep coverage. For
SOLiD data analysis, the standard ABI SOLiD data processing
pipeline includes a step whereby the data is filtered by a
comparison to the Sanger miRBase database of known miRNAs
([http://microrna.sanger.ac.uk/]) [30]. Because the majority of
miRNAs in the diatom may be novel, as was found for
Chlamydomonas miRNAs [15,16], filtering by the known Sanger
miRBase may have undesirable effects. Therefore, this study also
reports the development of a new methodology to process SOLiD
data to extract the entire small RNA population, which can then
be examined to identify and predict novel miRNAs and
endogenous siRNAs.
Materials and Methods
Experimental MethodsCell culture. Thalassiosira pseudonana strain CCMP1335 was
obtained from the Provasoli-Guillard National Center for Culture
of Marine Phytoplankton, Bigelow Laboratory for Ocean Sciences
(West Boothbay Harbor, ME, USA), and maintained in artificial
seawater (ASW) medium [31], supplemented with biotin and
vitamin B12, each at 1 ng?L21. Cultures were magnetically stirred
and aerated using sterile techniques. Two separate cell cultures
were maintained at 18uC–20uC in continuous light at an intensity
of 150 mmol photons ? m22 ? s21. One T. pseudonana exponential
growth culture sample (Tp-EF) was grown in an 8-liter glass bottle
of ASW to a density of 1.86106 cells ? ml21 and the other
(Tp_EC) was grown similarly to a density of 1.146106 cells ? ml21.
The Tp-EF cell culture sample was used to construct both a small
RNA cDNA library for 454 pyrosequencing and a cDNA library
for SOLiD sequencing. The Tp-EC sample was used to construct
a biological replicate small RNA cDNA library for SOLiD
sequencing.
Small RNA cDNA library construction for 454
library. Total RNA was extracted with TriReagent (Sigma) as
previously described [32]. Following total RNA extraction, PEG/
NaCl precipitation was performed to separate low and high
molecular weight RNAs in order to generate a small RNA library
suitable for deep sequencing [33].
Subsequent processing included size-selection using gel electro-
phoresis and ligation of specific linkers. MicroRNAs and small
RNAs that are generated by an RNase III mechanism have 59P
and 39OH terminal groups, which is the opposite of mRNA
degradation products. This feature enables sequential ligation of
appropriate linkers specifically to the small RNAs. Linkers suc-
cessfully used in several other laboratories [20,21] were used here.
The 59 linker (called ‘‘Nelson’’ [20,21], ATCGTAGGCACCT-
GAAA), has a 39 hydroxyl group, and was ligated to RNAs with a
59 phosphate using T4 RNA ligase. The ligation product was size-
selected and purified using denaturing PAGE as described [33].
The 59 end of the 39 linker (called ‘‘Modban’’, ACTGTAGG-
CACCATCAAT), contains a 59 phosphate that enables ligation to
a 39OH group, and a 39 di-deoxyC group that acts as a block to
prevent further ligation. Small RNAs generated from the protocol
only exist in the configuration: Nelson linker, small RNA, Modban
linker. Following purification of the second ligation product, the
ligated small RNAs were subjected to RT-PCR with Super-
script III RT (Invitrogen), using primers corresponding to the
linker sequences. A 4% Metaphor agarose (Lonza) gel purification
was used to isolate amplified small RNAs of the correct size
(Figure 1A).
TOPO cloning (TOPO TA for Sequencng kit, Invitrogen) of
the purified small cDNA fraction was performed, and approxi-
mately 50 transformants were grown for DNA preparation using a
Qiagen QIAprep-spin Miniprep kit, and sequenced to confirm the
quality of the library. Briefly, the purified PCR product was used
to transform One Shot TOP10 Competent cells, and plated onto
LB-ampicillin plates. The plates were incubated overnight at
37uC. Colonies were picked and placed into tubes containing 5 ml
of 2XYT media and 5 ml of 50 mg/ml ampicillin. The tubes were
shaken overnight at 37uC. Cloned DNAs were sequenced by the
Sanger method using a service provided by SeqXcel (San Diego,
CA).
After verification of the quality of the TOPO library, amplified
cDNA material was quantified on an Agilent Bioanalyzer and
approximately 160 ng of material was prepared for one half plate
of 454 FLX sequencing [34] at the J. Craig Venter Institute (JCVI)
in Rockville, MD.
Small RNA cDNA library construction for SOLiD
libraries. Total RNA from T. pseudonana cell cultures was
extracted with TriReagent (Sigma) as previously described [32].
To enrich for the ,18–40 nt small RNA fraction, the total RNA
samples were treated with the flashPAGE fractionator (Ambion
#AM13100) and flashPAGE Clean-Up Kit (Ambion #AM
12200). The small RNA enriched samples were then processed
according to the SOLiD Small RNA Expression Kit protocol
(Applied Biosystems, Life Technologies, Carlsbad, CA).
Thalassiosira pseudonana Small RNA Transcriptome
PLoS ONE | www.plosone.org 2 August 2011 | Volume 6 | Issue 8 | e22870

The first step of the SOLiD Small RNA Expression Kit protocol
involved a ligation step with Adapter Mix A using RNA ligase,
which requires an RNA with a 59 phosphate and a 39 hydroxyl
group, as is characteristic of small RNAs. Adapter Mix A is used
for SOLiD sequencing starting from the 59 ends of the small RNA.
cDNA from each culture was barcoded by amplifying the
library with a particular PCR primer set provided in the kit, where
each primer set differed by a known 6-nucleotide sequence.
Therefore, after sequencing, the samples could be identified and
sorted into barcoded condition sequences. The barcode number-
ing scheme was as follows: Tp_EF was barcoded G00032, and
Tp_EC was barcoded G31013.
The quality and quantity of the samples was verified on the
Agilent Bioanalyzer (Figure 1B). Approximately 200 ng of each
condition and adapter mix was prepared for Applied Biosystems
SOLiD next generation high throughput sequencing at JCVI.
Duplicates of each sample were run on two quadrants of the slide.
That is, the first quadrant (A1) and second quadrant (A2) both
contained a sample of the Adapter A mix preparation.
Computational MethodsComputational search for RNA interference (RNAi)
machinery in diatoms. The capacity of Thalassiosira pseudonana
to employ RNAi-related mechanisms was evaluated bioinfor-
matically. To assess sequence similarity to RNAi-related genes,
the filtered gene model predicted transcripts for T. pseudonana was
downloaded from the JGI website. Using the list of proteins in Text
S1, a FASTA file was created that contained these protein
sequences of interest from the UniProt site ([http://www.pir.
uniprot.org/]). A BLASTp alignment [35] was performed between
the gene models and the test set of protein sequences. The results
were sorted by alignment length and E-value significance.
For evidence of pattern/motif similarity, the motifs lists in Text
S1 were used to create a test set of Pfam identifiers from the Pfam
database ([http://pfam.sanger.ac.uk/]). The Hidden Markov Model
for Pfam software, hmmpfam, was used to search for the Pfam
motifs in the filtered gene model predicted transcripts for T.
pseudonana. Gene models containing matches to the domains of
interest with appropriate HMM cutoffs were manually examined
for completeness and, if necessary, extended. The extended gene
models were then subjected to an expanded search.
Finally, a keyword search was performed using the following
steps. The filtered gene model predicted transcripts for T.
pseudonana were aligned with the BLAST program against the
proteins in the non-redundant database, ‘‘nr’’ ([http://www.ncbi.
nlm.nih.gov/]). The top match for each gene model was chosen as
the functional description. The description text for each match was
then searched for the presence of the protein and motif names
listed in Text S1.
Data Files. Computational analysis of the small RNA
sequence data was performed with the Thalassiosira pseudonana
genome, version 3.0 ([http://genome.jgi-psf.org/Thaps3/Thaps3.
home.html]). The unmasked version of the genome was used in
the study. The Thaps3 JGI website also contained the chloroplast
and mitochondrial sequences in the file organelle.fasta. Extra
sequences that could not be assembled into the genome were
available as bottom_drawer.fasta. The GFF formatted filtered
gene models were processed to define the locations of the introns,
exons, and intergenic regions used in the small RNA analysis. The
functional mapping was obtained from a database created and
Figure 1. General characteristics of the small RNA libraries. 1A. T. pseudonana preparatory gel showing presence of small RNA bandsafter library construction and amplification, prior to 454 sequencing. Agarose gel electrophoretic separation of final amplified small RNAproducts. Right, zoomed gel detail highlights the presence of several predominant bands and size classes. 1B. T. pseudonana Agilent gel showingpresence of small RNA band after library construction and amplification, prior to SOLiD sequencing. 1C - Length distribution of T.pseudonana small RNA candidate sequences. Length distribution of unique sequences was calculated after removal of RNA degradationproducts and alignment with the T. pseudonana genome. 1D - Nucleotide frequency at the 59 end of the small RNA candidate sequences.Nucleotide frequency of unique sequences was tabulated after removal of RNA degradation products and alignment with the T. pseudonanagenome.doi:10.1371/journal.pone.0022870.g001
Thalassiosira pseudonana Small RNA Transcriptome
PLoS ONE | www.plosone.org 3 August 2011 | Volume 6 | Issue 8 | e22870

maintained at JCVI. The coordinates for the repetitive regions of
the T. pseudonana genome were obtained from JGI as a
RepeatMasker file.
The one half plate of 454 FLX sequencing generated 305,484
sequences, which were deposited into a fasta formatted file. The
slide of ABI SOLiD sequencing generated 17,047,245 sequences,
which were sorted by slide region (A1, A2) and barcode (G00032,
G31013) and deposited into colorspace formatted files.
Initial processing of 454 data. Figure S1A contains a flow
chart of the computational analysis steps that were performed for
the 454 sequence data. The 59 and 39 adapter sequences were
matched and removed from the ends of the insert sequences.
Sequences that did not possess both adapters (with less than 4
missing nucleotides) were removed from further consideration. To
reduce redundancy, the sequences were subjected to clustering
using the program CD-hit [36]([http://www.bioinformatics.org/
cd-hit/]) at 100% identity for a length similarity of at least 80%.
rRNA is degraded by an RNaseIII mechanism [37,38], there-
fore, rRNA degradation products of the selected size are expected
to be cloned along with authentic small RNAs. Since the T.
pseudonana genome is not annotated for non-coding RNA, such as
rRNA and tRNA, the consensus sequences were aligned with the
non-redundant database ‘‘nr’’ ([http://www.ncbi.nlm.nih.gov/])
and the RNA family database ‘‘Rfam’’ ([39] [http://rfam.sanger.
ac.uk/]). Consensus sequences which aligned with these databases
with at least 70% alignment and whose best match had functional
descriptions of ‘‘rRNA’’, ‘‘tRNA’’, or ‘‘ribosomal’’, were consid-
ered to be degraded non-coding RNA and were removed from
further consideration. Some degradation products may remain in
the candidate pool, since the sequences may have matched ‘‘nr’’ at
less than 70% alignment, or the best match to ‘‘nr’’ may not have
contained a functional description indicating ribosomal or transfer
RNA origin.
The consensus sequences were aligned with the T. pseudonana
nuclear genome’s unmasked chromosomes. 4,287 unique sequenc-
es which contained 1 mismatch or less were retained as potential
small RNA candidates. The inability of the remaining sequences
to align with the T. pseudonana assembled genome may be due to
sequencing errors in the data set or the assembled genome itself,
derivation of the sequence from unsequenced regions of the
assembled genome, or mismatches due to different alleles [3]. The
percentage of sequences that did not match the assembled genome
is similar to the results found in other studies [16,40]. The
sequences were also aligned with the T. pseudonana organelle
(chloroplast and mitochondria) data, and with the bottom drawer
sequence data (a set of sequences that did not assemble with the
bulk genomic sequence). At each step, statistics were collected for
the counts, lengths, and first nucleotide of each of the sequences.
Processing of SOLiD data. Figure S1B contains a flow chart
of the computational analysis methodology that was designed and
implemented in the current study to process the SOLiD sequence
data. The colorspace data was first converted to its basespace
equivalent using CLCbio’s tofasta software. This program does not
reference a genome, so color errors were not detected. Addi-
tionally, all SOLiD sequencing reads in the data set were 35
nucleotides, even though the small RNA insert could be any
length. Therefore, to remove sequences containing color errors,
and to trim off extra nucleotides surrounding the small RNA
insert, a methodology was developed in this study using BLAST
[35] alignment to the T. pseudonana genome. Only sequences which
matched the genome perfectly for 100% identity regardless of
length, or which had 1-mismatch to the genome, were retained. By
retaining the coordinates of the match to extract the sequences
from the data file, the sequences could be trimmed to the exact
length of the small RNA insert. Sequences that did not match the
genome were removed from further consideration. On average,
22% (3,817,895 sequences) of the reads from the individual
libraries aligned to the genome, which was higher than when the
data was processed with the CLC NGS Cell reference assembly
software (7%), or with the ABI Small RNA pipeline (6%). In
contrast, in the T. pseudonana small RNA library sequenced with
the 454 platform, approximately 60% of the reads aligned with the
T. pseudonana genome. To reduce redundancy, the sequences were
subjected to clustering using the program CD-hit [36][http://
www.bioinformatics.org/cd-hit/]) at 100% identity for a length
similarity of at least 80%. Clustering of the SOLiD data resulted in
a set of unique consensus sequences representing an average of
3.9% (675,173 unique sequences) of the total sequences in the
original data set. This value fell into a similar range as the 454
sequencing data at 6.5% of the total sequences.
RNA degradation products, such as degraded rRNA and tRNA,
were removed from the pool using the locations of these entities.
Sequences which aligned with the Rfam database [39] were also
removed, except for those sequences that were annotated as
miRNA in Rfam. Following removal of RNA degradation pro-
ducts, a pool of 602,087 unique SOLiD sequences (107,711 from
sample Tp-EF, and 494,376 from sample Tp-EC) was retained for
further processing as potential small RNA candidates. The lengths
and first nucleotide of each of the sequences was also tabulated.
A Matlab program was written to indicate strand specificity,
localize, and compute coverage of the sequences along each chro-
mosome. A bin-size of 10000 was used, unless otherwise noted. A
second Matlab program was written to visualize coverage of the
data along the chromosomes as a heatmap, and to accentuate the
similarities and differences between the libraries. In both the
histograms and heatmaps, the data were normalized by dividing
the frequency counts in the bins by the total number of sequences
for that particular library.
To determine if the SOLiD small RNA candidate consensus
sequences could be further assembled to the genome, each SOLiD
data set was processed with CLCbio’s CLC Genomics Workbench
(version 4.0.3) High-Throughput Sequencing tool for mapping
reads to a reference, using the default settings. The assembled
sequences were parsed for length and first nucleotide.
Prediction of microRNA candidates. Prediction of micro-
RNA candidates was performed using the miRDeep miRNA
prediction program [41], with the small RNA candidate consensus
sequences in the 18–24 nucleotide size range that aligned with the
T. pseudonana genome, did not align with repetitive regions of the
genome, and did not contain sequence similarity to degraded non-
coding RNA. The miRDeep code was modified to allow for the
excision of precursors of length +/2 100 nucleotide surrounding
the candidate sequence, and to utilize Decypher Timelogic hard-
ware accelerated boards for the alignment. The putative precursor
sequences were folded with the RNA folding software RNAfold [42]
and manually examined to constrain the putative mature miRNA
sequence to contain bulges with no more than 3 unpaired
nucleotides, and a loop of at least 10 nucleotides in length [43].
The minimum free energy value was required to be less than
220 kcal/mol. All miRNA candidates were required either to be
present in at least 2 of the 3 sequence libraries, or the opposite arm
of the mature miRNA, known as the miRNA* arm, to be found in
at least one of the libraries. MiRNA candidates that passed these
tests were further classified as intron, exon, or intergenic, by their
location in the predicted gene models.
The miRNA candidate sequences were also aligned with the
known mature miRNA sequences in the Sanger microRNA
database, miRBase [30]. The query sequences were aligned using
Thalassiosira pseudonana Small RNA Transcriptome
PLoS ONE | www.plosone.org 4 August 2011 | Volume 6 | Issue 8 | e22870

the FASTA/ssearch34 alignment program [44]. Software that was
written and used previously for a published miRNA search [45]
was utilized to examine the results. Matches of 90% identity or
better for the first 10 nucleotides of the known miRNAs, were
considered ‘‘seed’’ matches [46], and were retained.
Prediction of endogenous siRNA candidates. Two types
of endogenous siRNA classes were investigated in this study:
repeat-associated siRNA and natural antisense transcribed siRNA.
Repeat-associated endogenous siRNA candidates were charac-
terized by aligning the small RNA sequence data with the
RepeatMasker repetitive elements in the T. pseudonana genome.
The matches to each repetitive region family were grouped by
transposable element family [47] and tabulated. Additionally, to
get an estimate of the sequence similarity of rasiRNA candidates
present across the two sequencing platforms, each rasiRNA
candidate set was aligned against the other sets using BLAST [35].
Matches that generated an E-value less than or equal to 161025
were retained and tabulated.
The small RNA library consensus sequences were analyzed for
the presence of endogenous siRNAs, possibly regulating genes via
cis and trans mechanisms. In this study, code was written to
determine the orientation of the small RNA transcripts in relation
to the genomic DNA and to the coding mRNA. BLAST align-
ments of the transcripts with the genomic DNA resulted in a
reference orientation for the small RNA sequences. The genomic
coordinates of the small RNA transcripts were then combined with
the gene locations and orientation for the predicted T. pseudonana
genes in the GFF format file.
Prediction of target genes. The prediction of target genes
for the predicted miRNA candidate sequences was performed
using a few modifications to previously published target prediction
software [45]. To predict targets with animal miRNA binding
characteristics, the reverse complement matches were classified
according to the length of their seed binding, retaining 6-mer
matches with perfect complementary for nucleotides 2–7 of the 59
end of the small RNA. For plant-like binding, the entire length of
the small RNA sequence was examined for similarity, allowing at
most 1 mismatch or gap in the 8-nucleotide seed region, and no
more than 3 mismatches or gaps in the remainder of the miRNA.
The minimum free energy of the pairing was calculated using
RNAhybrid [48], and a maximum of 220 kcal/mol was applied
to the miRNA:mRNA target hybrids.
The potential target gene data sets used for the target prediction
consisted of the T. pseudonana filtered gene model transcripts and
the T. pseudonana EST sequences which had annotated evidence in
the GFF format file of a start codon and stop codon. These ESTs
represented 3,932 of the 11,890 predicted transcripts in the T.
pseudonana genome. It was then possible to assign the match
locations to occur in the 39UTR, coding section (CDS), or 59UTR.
The Gene Ontology (GO) terms for the mRNA targets were
assigned based on the GO annotation file for the T. pseudonana
filtered gene models. The GO identifiers were then input into the
Gene Ontology (GO) Terms Classification Counter [49]([http://
www.animalgenome.org/bioinfo/tools/countgo]), using the EGA-
D2GO classification filter for higher level grouping.
Results
Computational search for RNA interference (RNAi)machinery
The first step in this study required determining if the necessary
RNA interference (RNAi) machinery was present in the genome of
the diatom, Thalassiosira pseudonana, using sequence similarity,
pattern similarity, and keyword similarity against the list of known
RNAi proteins and motifs (see Text S1). Combining the results of
these analyses provided evidence of several key components of
small RNA processing machinery, including homologs for one
Argonaute protein, two Dicer-like proteins, and three RNA-
dependent RNA polymerases. Although T. pseudonana did not have
full sequence alignments for Argonaute or Dicer, it had good
partial alignments. This may be sufficient for the production of
small RNAs, since the pattern/motif search via HMM analysis
showed that T. pseudonana has many of the necessary domains
present. T. pseudonana does not have evidence of the protein
Drosha, which is utilized in miRNA biogenesis in animals [50].
Additionally, T. pseudonana does not have the DUF283 domain, so
it apparently does not have an animal-like Dicer present.
However, this data suggests that diatoms possess one or more of
the homologous plant Dicer-like proteins, as well as other
important RNAi-related proteins and motifs (Figure S2).
Figure S2 contains a schematic diagram of the key eukaryotic
RNAi-related proteins present in the T. pseudonana genome. It was
found that the matches to the PAZ and PIWI domains fell on the
same transcript in the proper order for Argonaute proteins. This
finding was confirmed by the subsequent mapping of one Argo-
naute homolog for T. pseudonana on the Superfamily website [51].
There was also evidence of three homologs of RNA dependent
RNA polymerase (RdRP), and one protein encoding two Ribo-
nuclease III (RNaseIII) domains (Figure S2). The gene encoding
the two RNaseIII domains additionally encodes a PAZ domain,
thus showing homology to the Giardia intestinalis Dicer gene [52]. A
second Dicer-like homolog present in T. pseudonana appears to
contain the domains for DEAD/DEAH box helicases (DEAD),
Helicase conserved C-terminal domain (HELICc), a weak match
to the PAZ domain, and a double-stranded RNA binding motif
(DSRM) (Figure S2). This is unlike most other organisms
with RNAi pathways, which additionally contain two RNaseIII
domains in the Dicer protein. Since T. pseudonana contains a Dicer-
like protein that has two RNaseIII domains and a PAZ domain,
these two Dicer-like homologs may act in conjunction. There are
examples in T. brucei and Entamoeba histolytica where Dicer proteins
with single RNaseIII domains may act as dimers [52].
A recent study, using different computational analysis tech-
niques, found similar evidence of the RNAi protein machinery
present in T. pseudonana [53]. In particular, they found evidence of
Argonaute, two types of Dicer-like proteins, and several RNA
dependent RNA polymerases (RdRp). The main difference
between our analyses involves their omission of the PAZ domains
in the Dicer-like protein candidates. We found that one putative
Dicer-like protein contains a match to the PAZ domain upstream
from the two RNaseIII domains. However, since this T. pseudonana
Dicer-like homolog is missing the DEAD-like helicase, HELIc, and
DUF domains, this motif subset is most similar to that of G.
intestinalis, which also contains only the PAZ and two RNaseIII
domains [52].
Homologs for bacterial small RNA processing, such as RNA
polymerase sigma factor (rpoS) and the LSM domain of the Hfq
chaperone protein [54,55], were also found in the T. pseudonana
genome. This suggests that bacterial, as well as eukaryotic, small
RNA mechanisms may be possible in T. pseudonana, which is
consistent with the presence of relatively high numbers of bacterial
gene homologs found in the diatom genomes [6]. The presence of
bacterial small RNAs was not pursued in this study because the
protocol used for 454 sequencing involved a size-selection step,
which excluded sequences greater than ,50 nucleotides in length,
and the protocol for SOLiD sequencing involved 35 nucleotide
reads. Since bacterial small RNAs are generally 80–100 nucleotides
in length, we would not see this type of RNA in our sequence data.
Thalassiosira pseudonana Small RNA Transcriptome
PLoS ONE | www.plosone.org 5 August 2011 | Volume 6 | Issue 8 | e22870
General characteristics of the small RNA librariesThe small RNA cDNA 454 sequence library was constructed
from RNA isolated from exponentially-growing T. pseudonana
(sample Tp-EF) using established procedures (Methods and [33]).
The final gel purification step of the small RNA cDNA library
construction revealed the presence of the expected size small
RNAs that amplified with the known linkers (Figure 1A). After
confirming the presence of cloned small RNAs in a subsample of
the library by TOPO cloning and Sanger sequencing, the purified
products were sequenced with parallel pyrosequencing on a 454
platform [34], resulting in 305,454 reads.
The two small RNA SOLiD sequence libraries derived from the
Tp-EC and Tp-EF cell samples were prepared for sequencing with
the ABI SOLiD Small RNA Expression Kit (Life Technologies,
Carlsbad, CA). Figure 1B shows an Agilent Bioanalyzer separation
of the small RNA library after construction and amplification with
the Small RNA Expression Kit. Sequencing generated a total of
17,047,245 sequences in colorspace format.
The length distribution of the small RNA libraries candidate
sequences were tabulated after removal of rRNA degradation
products and alignment with the T. pseudonana genome, and is
shown graphically in Figure 1C. For the 454 library, the lengths
are consistent with the library construction protocol, as we had
size-selected a gel region comprising a range between 20–50
nucleotides. The data show a normal distribution with an average
length of approximately 30 nucleotides, with the majority of
sequence lengths centered from 28–32 nucleotides. For the two
SOLiD libraries, the data do not show a normal distribution, and
instead are biased at the extreme ends with major peaks at 18 and
35 nucleotides. Based on the dramatic differences between the 454
and SOLiD data in our study, and previous documentation of bias
in SOLiD sequencing of small RNAs [56], we believe that these
peaks are not representative of true populations in the small RNA
suite of T. pseudonana. The 35 nt peak is presumably due to
sequences that exceeded the maximum length of the SOLiD
sequencing limit. The presence of the 18 nt peak suggests that the
actual sequence reads were somehow artificially truncated. Agilent
gel analysis (Fig. 1B) does not indicate that the cDNA resulted
from substantially degraded RNA. If the 18 nt sequences were
artifactual truncations, we reasoned that assembly of them into
longer contigs might provide a more accurate representation of the
native population. We attempted to assemble the 18 nt data into
longer reads using CLC Genomics Workbench. Only about 25%
of the 18 nt reads were assembled into longer reads, which had no
evidence of clear bias towards truncation at either the 59 or 39 end.
Thus, the underlying reason(s) for the 18 nt peak are unclear.
Based on the established biases in SOLiD data for small RNAs
[27,56], we cannot consider the length distribution data from
SOLiD in Fig. 1C as representative of the actual case, whereas the
454 data is. In some other organisms, small RNA lengths are
tightly constrained [13]; the 454 results (Fig. 1C) suggests that
several types of small RNAs might be present in the diatom.
Because the small RNA prediction methods for this study allow for
a range of lengths, and use multiple criteria for classification, the
truncation of the SOLiD data is not expected to have a significant
effect on the subsequent analysis.
The nucleotide present at the 59 end of a small RNA, which is
most frequently a U in most organisms [14,57], is important due to
its link to sorting by the Argonaute protein [58]. Due to truncation
of the SOLiD sequences, only the 454 sequences are likely to
represent the true 59 nucleotide [56]. These data showed (Fig. 1D)
that G or U was most frequently found at the 59 end. Since there is
only one Argonaute protein annotated in the T. pseudonana
genome, which must process the different types and lengths of
small RNAs, it may be adapted to work with either a 59 U or G.
Another possibility is that other currently underdetermined
mechanisms for cleavage and processing are present in T.
pseudonana.
Comparative mapping along the chromosomes. To
compare the expression profile between the small RNA libraries,
each set of sequences was binned, normalized, and represented in
a heatmap plot along the length of the chromosomes (Figure 2). As
an example, Figure 2 shows the location and frequency of
generation of small RNAs along chromosomes 16a, 16b, 22, and
24. (Figure S3 contains the mappings for all of the chromosomes.)
The small RNAs do not appear evenly distributed on the
chromosomes, but instead are grouped into clusters or hotspots.
These results are consistent with other studies of small RNAs [59].
The similarity between the 454 data and the SOLiD data,
indicates that the truncated SOLiD sequences are still useful for
analysis, and more importantly, gives strong evidence that there
exists a core complement of small RNAs expressed in T.
pseudonana. Sequences uniquely present in the SOLiD data
(Fig. 2) are consistent with the greater depth of coverage using
this approach.
Prediction of miRNA candidatesOur initial small RNA characterization analysis focused on
searching for miRNA candidates. The sequences for all three
libraries were pooled and input into the miRNA prediction
program, miRDeep [41], which predicts miRNAs according to
statistical evidence of Dicer processing. In the 18–24 nucleotide
size range of the small RNA sequences, the structures of possible
precursor sequences obtained from flanking regions of genomic
DNA produced by the folding software RNAfold were examined for
quality of intramolecular hairpin candidates. In particular, the
hairpins were considered good candidates if they contained bulges
of less than 3 unpaired nucleotides in the mature miRNA stem
region, and a loop length greater than or equal to 10 nucleotides.
The base pairing requirement is based upon the accepted criteria
for annotating microRNA [43]. The loop length parameter is
based on statistics gathered from known miRNAs in the Sanger
miRBase from a previous study [45], and by experimental
evidence that Drosha RNase III processing of animal miRNAs
requires a loop length greater than 10 nucleotides [60]. Addi-
tionally, the minimum free energy value, as calculated by RNAfold,
for the precursor hairpin was required to be less than 220 kcal/
mol. For the sequences that met the basic folding criteria for base
pairing, loop length, and minimum free energy value, two
subsequent steps were taken before classifying the sequence as a
miRNA candidate. First, to strengthen the validity of the mature
miRNA expression, the mature miRNA sequence had to be either
present in the same polarity in at least 2 of the 3 sequence libraries,
or the opposite arm of the mature miRNA, known as the miRNA*
arm, had to be present in at least one of the sequence libraries.
The occurrences of both the miRNA and miRNA* arms strongly
suggests the ability to form miRNA:miRNA* duplexes during
miRNA biogenesis [14]. Second, to rule out misannotation of
repeat-associated siRNA as miRNA candidates, the sequence was
not permitted to align with a repetitive region in the genome.
Of the structures that met these criteria, 29 miRNA candidates
were predicted over the 18–24 nucleotide size range that is
characteristic for miRNAs. These miRNA candidates originated
from reads present in the SOLiD libraries, rather than the 454
library, presumably due to the lack of sequencing depth with the
454 platform coupled with our stringent criteria for miRNA
prediction. The percent of miRNAs relative to the total number of
genes in the genome is lower than described in other organisms
Thalassiosira pseudonana Small RNA Transcriptome
PLoS ONE | www.plosone.org 6 August 2011 | Volume 6 | Issue 8 | e22870

(0.25% relative to 0.5–1.5%) [11]. Table S1 contains a list of the
miRNA candidates with information about their length, number
of mature miRNA reads, number of miRNA* reads, genome
coordinates, terminal loop length, precursor length, and the
sequences that contributed to their predition. Figure S4 contains
the secondary structures for the predicted miRNAs.
The precursor sequences of the miRNA candidate hairpin
structures ranged in length from 70 to 132 nucleotides, with an
average length of 107 nucleotides and a median length of 110
nucleotides. These lengths are within the range of plant miRNA
precursors, which range from 50 to more than 350 nucleotides
[61]. Longer lengths may have been precluded due to the limits in
the miRDeep prediction algorithm. These results are different
from the miRNAs present in Chlamydomonas, for which the majority
of the miRNA precursors ranged from 150 to 729 nucleotides
[15].
The predicted miRNA candidates were also mapped relative to
the T. pseudonana annotated genes. Intergenic regions produced
Figure 2. Heatmaps and histograms of small RNA candidate abundance mapped along chromosomes 16a, 16b, 22, 24. All alignmentsto the T. pseudonana genome were binned, normalized, and then plotted along the length of the chromosome as a heatmap and as a histogram. Theintensity of the spot on a heatmap denotes the abundance of sequences generated at the particular site relative to the total dataset for that sample,with darker colors depicting higher abundance. Additionally, the alignment coordinates of the sequences were binned into histograms along eachchromosome. Values above the x-axis signify that the small RNA was transcribed along the plus strand of DNA, and below the x-axis for the minusstrand. Each row of the heatmap represents a different sample library in the following order: Tp_454data, Tp_EF, Tp_EC. Bars above the line representthe plus strand and bars below the line represent the complimentary strand. A binsize of 10000 was used for both types of plots.doi:10.1371/journal.pone.0022870.g002
Thalassiosira pseudonana Small RNA Transcriptome
PLoS ONE | www.plosone.org 7 August 2011 | Volume 6 | Issue 8 | e22870

24% of the miRNA candidates, while approximately 60% were
found in exons, and only 6% in introns. These results suggest
similarity to the characteristics of plant miRNAs, for which a
greater proportion of the candidates occur within intergenic,
rather than intronic, regions of the genome [62]. These results are
also similar to those found in a small RNA study of the moss,
Physcomitrella patens, which reported 43% of the miRNAs were
generated from intergenic regions, and the remainder of miRNA
loci originated from exons, introns, and exon-intron boundaries
[63]. In the green algae, Chlamydomonas, the majority of miRNAs
were generated from intronic, rather than intergenic regions as
they are in plants [16]. In animals, the majority of miRNA are
transcribed from intronic regions [64]. The lower number of
miRNA candidates originating from introns in the T. pseudonana
data set relative to some other organisms may be due to the small
size and amount of intronic sequence in the T. pseudonana genome.
It is estimated that in the T. pseudonana genome, there are 1.52
introns/gene, with an average size of 125–135 bp, and a median
length of 90–92 bp [6]. Additionally, it is estimated that 39% of
the genes are single-exon gene models.
To determine if known conserved miRNAs were present, the 29
putative T. pseudonana miRNA candidate sequences were com-
pared to the Sanger miRBase. The seed region was examined for
homology to known miRNAs. When enforcing a 90% identity
constraint for the first 10 nucleotides, only 9 sequences matched
the Sanger miRBase. On visual inspection, the hairpins did not
show significant structural homology to the corresponding miRNA
in miRBase. The lack of strong phylogenetic conservation of our
small RNA candidates to those found in other organisms was not
surprising. Recently, it was determined that although the
unicellular green algae Chlamydomonas reinhardtii possess miRNA
genes, they do not share miRNA sequence conservation with
plants and animals [15,16]. Since the diatom is a unicellular
brown algae, which is not represented in the Sanger miRBase, it is
very likely that diatom miRNAs will provide a new set of miRNAs
to the database.
Prediction of endogenous siRNA candidatesShort interfering small RNAs (siRNAs) are generated from
double stranded RNA in the transcriptome by several mechanisms
[65]. The two types of siRNAs that were explored in this study
were repeat-associated siRNAs and natural antisense transcribed
siRNAs.
Repeat-associated siRNAs, or rasiRNAs, have been found to
silence homologous retrotransposons and other repetitive sequenc-
es in the genome of an organism in sense and antisense
orientations. In this study, the small RNA sequence data was
aligned with the RepeatMasker repetitive elements in the T.
pseudonana genome. A total of 857 unique small RNA sequences
from the 454 small RNA candidate pool mapped to the repetitive
elements (15.9% of the small RNA candidate pool), while the
counts were 8093 and 19,006 for the SOLiD Tp-EF (7.1%) and
SOLiD Tp-EC (3.7%) libraries, respectively. These percentages
are notable, considering that only approximately 2% of the T.
pseudonana genome is composed of interspersed repeats and
transposable elements [3,6]. In contrast, the Chlamydomonas small
RNA study [16] found a lower percentage of repeat-associated
small RNAs in their library than in the genome. The amoeba
Dictyostelium discoideum, on the other hand, was found to have
approximately 68% of small RNAs derived from the DIRS-1
retrotransposon [40]. DIRS-1 is the most abundant retrotranspo-
son in the amoeba, and is believed to function as centromeres at
mitosis. Small RNAs found in repetitive regions near centromeres
are also a hallmark of gene regulation in yeast, S. pombe [66].
Currently, no evidence for centromeric sequences has been found,
based on G+C content, transposable element distribution, or gene
poor regions in the T. pseudonana genome [6]. Therefore, no
statement can be made concerning the relation of the locations of
the repetitive regions or the repeat-associated small RNAs to the
centromeres. However, the abundance of small RNA sequences
derived from the repetitive regions of the T. pseudonana genome
suggests that they play important roles in regulation and silencing
of the transposable elements. The transcriptional activity of
transposable elements in diatoms is known to be elevated under
stress conditions, such as nitrogen starvation [67].
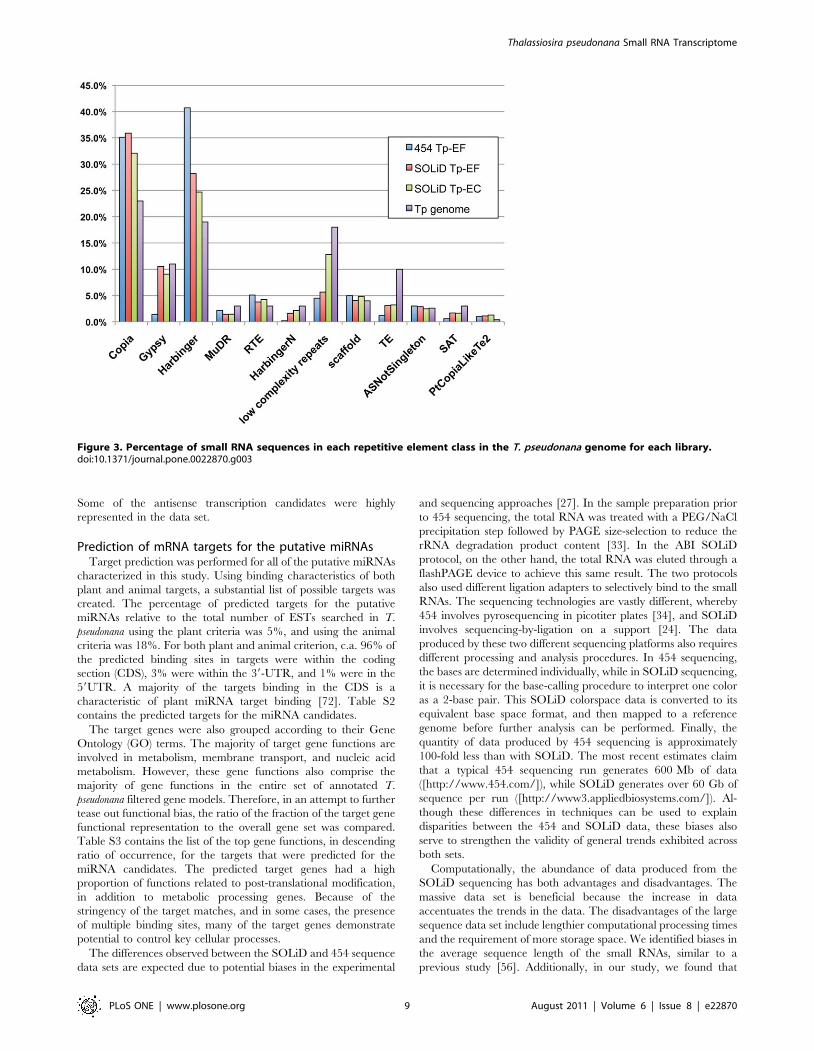
Figure 3 contains the results of the repeat-associated siRNA
mapping with the types of repetitive elements found in the T.
pseudonana genome [47]. For both of the SOLiD libraries, the long-
terminal repeat (LTR) retrotransposon class, which contains Copia
and Gypsy, was expressed in the highest abundance. The DNA
transposons, Harbinger and MuDR, were expressed in lower
abundance. This is to be expected, since the LTR retrotransposons
comprise a larger proportion of the T. pseudonana genome [3,6,67].
This result is different from the 454 data, where the DNA
transposons were expressed at a higher percentage than the LTR
retrotransposons. This may be due to a bias in the processing or in
the lower quantity of sequences in the 454 data set.
By aligning the rasiRNA candidates against each library using
BLAST [35], a high percentage of similarity between the two
technologies was found. In particular, for the 454 sequence data:
66% of the rasiRNA candidates contained matches to the SOLiD
TP-EF rasiRNAs, 79% contained matches to the SOLID-EC
rasiRNAs, and 82% contained matches to the combined SOLiD
rasiRNA candidate pool. Between the SOLiD libraries, 80% of the
SOLiD Tp-EF rasiRNA candidates contained matches to the
SOLiD Tp-EC rasiRNAs. The detection of these candidates
across the libraries suggests the expression of a core set of
rasiRNAs.
Natural antisense transcript-derived siRNA (nat-siRNA) are
produced from double stranded RNA formed from by transcrip-
tion of overlapping gene regions. These endogenous short inter-
fering RNAs may act as cis or trans regulatory elements. From the
pool of T. pseudonana small RNA sequences, after removing repeat-
associated and miRNA candidates, the sequences were examined
for their orientation in relation to the genomic DNA and the
predicted gene transcripts. As shown in Figure 4, the majority of
the endogenous siRNA candidates were transcribed from sense,
antisense, or intergenic RNA, suggesting a possible natural anti-
sense regulatory role in the cell. Antisense transcription is pre-
valent in the mammalian genome, with original estimates that
20% of the human transcripts may form sense-antisense pairs [68],
to later estimates of twice that value [69]. Regulation by antisense
transcription has also been reported in the plant, Arabidopsis thaliana
[70]. The Chlamydomonas reinhardtii small RNA study [16] classified
over half of their total small RNA reads as originating in protein-
coding genes and intergenic regions. Therefore, the abundance of
putative natural antisense transcript-derived siRNAs found in the
T. pseudonana small RNA candidate pool is in line with these other
studies.
The endogenous sense-antisense siRNA candidates analysis
determined that there were a large number of sequences
transcribed from intergenic regions, which is consistent with
studies of plant small RNAs [71]. However, the most interesting
candidates were transcribed in the antisense direction to the
introns and exons, or mapped to both intergenic and protein
coding regions. These characteristics suggest that the small RNAs
could form double-stranded RNA with the protein coding genes,
generating endogenous siRNAs that have regulatory properties.
Thalassiosira pseudonana Small RNA Transcriptome
PLoS ONE | www.plosone.org 8 August 2011 | Volume 6 | Issue 8 | e22870
Some of the antisense transcription candidates were highly
represented in the data set.
Prediction of mRNA targets for the putative miRNAsTarget prediction was performed for all of the putative miRNAs
characterized in this study. Using binding characteristics of both
plant and animal targets, a substantial list of possible targets was
created. The percentage of predicted targets for the putative
miRNAs relative to the total number of ESTs searched in T.
pseudonana using the plant criteria was 5%, and using the animal
criteria was 18%. For both plant and animal criterion, c.a. 96% of
the predicted binding sites in targets were within the coding
section (CDS), 3% were within the 39-UTR, and 1% were in the
59UTR. A majority of the targets binding in the CDS is a
characteristic of plant miRNA target binding [72]. Table S2
contains the predicted targets for the miRNA candidates.
The target genes were also grouped according to their Gene
Ontology (GO) terms. The majority of target gene functions are
involved in metabolism, membrane transport, and nucleic acid
metabolism. However, these gene functions also comprise the
majority of gene functions in the entire set of annotated T.
pseudonana filtered gene models. Therefore, in an attempt to further
tease out functional bias, the ratio of the fraction of the target gene
functional representation to the overall gene set was compared.
Table S3 contains the list of the top gene functions, in descending
ratio of occurrence, for the targets that were predicted for the
miRNA candidates. The predicted target genes had a high
proportion of functions related to post-translational modification,
in addition to metabolic processing genes. Because of the
stringency of the target matches, and in some cases, the presence
of multiple binding sites, many of the target genes demonstrate
potential to control key cellular processes.
The differences observed between the SOLiD and 454 sequence
data sets are expected due to potential biases in the experimental
and sequencing approaches [27]. In the sample preparation prior
to 454 sequencing, the total RNA was treated with a PEG/NaCl
precipitation step followed by PAGE size-selection to reduce the
rRNA degradation product content [33]. In the ABI SOLiD
protocol, on the other hand, the total RNA was eluted through a
flashPAGE device to achieve this same result. The two protocols
also used different ligation adapters to selectively bind to the small
RNAs. The sequencing technologies are vastly different, whereby
454 involves pyrosequencing in picotiter plates [34], and SOLiD
involves sequencing-by-ligation on a support [24]. The data
produced by these two different sequencing platforms also requires
different processing and analysis procedures. In 454 sequencing,
the bases are determined individually, while in SOLiD sequencing,
it is necessary for the base-calling procedure to interpret one color
as a 2-base pair. This SOLiD colorspace data is converted to its
equivalent base space format, and then mapped to a reference
genome before further analysis can be performed. Finally, the
quantity of data produced by 454 sequencing is approximately
100-fold less than with SOLiD. The most recent estimates claim
that a typical 454 sequencing run generates 600 Mb of data
([http://www.454.com/]), while SOLiD generates over 60 Gb of
sequence per run ([http://www3.appliedbiosystems.com/]). Al-
though these differences in techniques can be used to explain
disparities between the 454 and SOLiD data, these biases also
serve to strengthen the validity of general trends exhibited across
both sets.
Computationally, the abundance of data produced from the
SOLiD sequencing has both advantages and disadvantages. The
massive data set is beneficial because the increase in data
accentuates the trends in the data. The disadvantages of the large
sequence data set include lengthier computational processing times
and the requirement of more storage space. We identified biases in
the average sequence length of the small RNAs, similar to a
previous study [56]. Additionally, in our study, we found that
Figure 3. Percentage of small RNA sequences in each repetitive element class in the T. pseudonana genome for each library.doi:10.1371/journal.pone.0022870.g003
Thalassiosira pseudonana Small RNA Transcriptome
PLoS ONE | www.plosone.org 9 August 2011 | Volume 6 | Issue 8 | e22870

approximately 80% of the data did not align with the genome and
had to be discarded. Low alignment rates, ranging from 50–80%
unmapped reads, have been reported for SOLiD sequencing, due
to intolerance of the dibasic color reads to mismatches and
polymorphisms in the genome [73,74].
The methodology presented in this study provides the steps
necessary to discover small RNA genes in next generation
sequence data, and to perform a comparative analysis of different
libraries of sequence data. This is especially important in
organisms which lack hyper-abundant small RNAs. In control
experiments, we were unable to detect several of the more highly
represented small RNAs in the datasets using Northern analysis,
confirming their low abundance. Unlike the ABI SOLiD Small
RNA data analysis pipeline, the method described here contains
no filtering of the data by Sanger miRBase [30], thereby freeing
the analysis to pursue all types of small RNAs. By using the
BLAST program [35] to align the reads to the genome, all length
classes are represented and all locations of the matches are
collected, while trimming the adapters from the ends of the reads.
Additionally, this method assembled, on average, two or three
times more reads to the genome than the ABI SOLiD Small RNA
pipeline and CLCbio’s NGS Cell program, thereby producing a
large data set for further analysis. Although the quality of SOLiD-
based analyses on small RNAs has been substantiated by
comparison with other methods [27,56], these studies have also
documented biases comparing the different methods. One bias is
introduced during sample preparation; comparison of the
‘‘Modban’’ or ‘‘SREK’’ sample preparation methods showed
substantial differences in the representation of specific small RNAs
in sequenced libraries [27]. Another bias occurs in the actual
sequencing method; a comparison of SOLiD vs. two Illumina
sequencing methods indicated a more dispersed distribution of
length and higher frequency variation for nucleotides near the 39-
and 59-ends when using SOLiD, and in one dataset, the SOLiD
approach indicated a smaller size class (in this case 20 nt) of small
RNAs than two Illumina methods [27]. As long as these biases are
considered, SOLiD (which has a greater depth of coverage) has
proven to be a valid approach to characterizing small RNAs
[26,27,28,29].
Discussion
Combining the results from all of the sequencing data analyses,
this study demonstrates strong evidence of small RNA expression
in the transcriptome of the diatom, Thalassiosira pseudonana. Figure 4
shows the percentage of small RNA sequences that may be acting
as endogenous siRNAs, repeat-associated RNAs, or miRNAs. The
similarities between the expression profiles of the T. pseudonana
small RNA libraries confirm that the common small RNAs
discovered in this study are valid, since they were generated from
multiple cell samples, as biological replicates, and with two
different protocols and sequencing approaches, as technical
replicates. The agreement between the libraries is most clearly
visible as hotspots of transcription for the small RNAs in the
histogram and heatmap distribution plots along the chromosomes
(Figure 2; Figure S3). An overall similarity between the libraries for
the predicted repeat-associated siRNAs (Figure 3) and over the
entire small RNA profile (Figure 4), can also be observed. These
features demonstrate the existence of a core group of small RNAs
that is expressed in the diatom.
Several pieces of evidence suggest that diatom small RNAs are
more similar to plant than animal small RNAs. The T. pseudonana
genome lacks the protein Drosha, which is involved in animal
miRNA biogenesis. It also lacks a DUF283 domain, which is
characteristic of animal Dicer proteins. Other plant-like charac-
teristics include 1) the predominance of siRNAs in the small RNA
candidate pool [75], 2) similar lengths of miRNA precursors, and
3) most predicted targets in the coding regions.
The presence of small RNA in T. pseudonana unlocks the potential
to discover small RNA gene regulation mechanisms and gene
regulatory networks in the diatom. Understanding the gene
regulation mechanisms involved in carbon fixation, nitrogen, iron,
and silicon utilization in the diatom creates the possibility to
manipulate these processes for beneficial environmental purposes
and technological advances. Furthermore, because of the unique
evolutionary footprint of diatoms and other chlorophyll c algae,
which has been greatly influenced by eukaryotic-eukaryotic endo-
symbioses, the small RNA repertoire found in diatoms may provide
insight into the evolutionary history of regulatory small RNAs.
Figure 4. Summary of the small RNA sequence distribution inthe T. pseudonana genome for each library.doi:10.1371/journal.pone.0022870.g004
Thalassiosira pseudonana Small RNA Transcriptome
PLoS ONE | www.plosone.org 10 August 2011 | Volume 6 | Issue 8 | e22870
Accession numbersSequencing data is available at the NCBI Sequence Read
Archive (SRA) ([http://www.ncbi.nlm.nih.gov/Traces/sra/]). Ac-
cession number SRA027169 contains the Tp-EF 454 sequence
data. Accession number SRA027146 contains the Tp-EF G00032
SOLiD sequence data. Accession number SRA027168 contains
the Tp-EC G31013 SOLiD sequence data.
Supporting Information
Figure S1 Flow charts of the computational analysissteps performed on the T. pseudonana data sequences.S1A - Flow chart for the 454 data sequences. S1B - Flowchart for the SOLiD data sequences.(PDF)
Figure S2 Evidence of RNAi machinery in the T.pseudonana genome. Schematic diagram of the T. pseudonana
genes demonstrating homology to the Argonaute, Dicer, and RNA
dependent RNA polymerase (RdRp) families of proteins. The gene
names refer to the filtered gene models from the T. pseudonana JGI
website (http://genome.jgi-psf.org/Thaps3/Thaps3.home.html). In
parentheses below each motif are the residue coordinates and
HMM E-value for the motif in the gene. The typical Dicer motifs,
DUF283 and RNaseIII, which were not find in transcript 20605 are
denoted with an ‘X’ through the motif. Abbreviations used in this
diagram: DEAD - DEAD-like helicase, DSRM - Double-stranded
RNA binding domain, DUF - DUF283 domain, Hel-C - Helicase
C-terminal domain, PAZ - PAZ domain, PIWI - PIWI domain,
RdRp - RNA dependent RNA polymerase, RNaseIII - Ribonucle-
ase III domain.
(PDF)
Figure S3 Heatmaps and histograms of small RNAcandidate abundance mapped along all of the T.pseudonana chromosomes.(PDF)
Figure S4 Predicted secondary structures of the micro-RNA candidates in the T. pseudonana small RNAlibraries. The precursor sequences have been folded with
RNAfold. The mature miRNA portions are highlighted in yellow.
The miRNA* arm, if present, is highlighted in blue.
(PDF)
Table S1 List of microRNA candidates in the T.pseudonana genome. This file contains the information about
the sequences that folded into hairpin structures, and were thereby
classified as miRNA candidates. The information includes the
length, number of reads, mature miRNA sequence, terminal loop
length, location of match to T. pseudonana genome (chr:start-end),
orientation, mature miRNA structure in RNAfold notation,
minimum free energy of the hairpin structure, miRNA* name
and sequence if present, precursor length, and sequences that
contributed to the prediction.
(XLS)
Table S2 List of the predicted targets for the miRNAcandidates. The target prediction uses plant-like and animal-like
target binding characteristics.
(XLS)
Table S3 Predicted target gene functional categories formiRNA candidates. Functional categories are in an ordered list
as a ratio to the frequency of the functional groups in the genome.
(XLS)
Text S1 List of proteins and motifs used in search forRNAi machinery in T. pseudonana genome.
(DOC)
Acknowledgments
Special thanks to Tina McIntosh for performing protocol optimization and
the 454 sequencing at the J. Craig Venter Institute in Rockville, MD. The
ABI SOLiD small RNA libraries were constructed by Jing Bai at JCVI.
Initial code for barcode removal of the SOLiD data was provided by
Jamison McCorrison at JCVI in Rockville, MD. Thanks also to Sheila
Podell for advice and code contribution in the RNAi protein annotation
section. Portions of this manuscript were submitted as a thesis in partial
fulfillment of the requirements for the degree of Doctor of Philosophy
(T.M.N.-K.).
Author Contributions
Conceived and designed the experiments: TMNK AEA TG MH.
Performed the experiments: TMNK MH. Analyzed the data: TMNK
MH AEA. Contributed reagents/materials/analysis tools: AEA TG MH.
Wrote the paper: TMNK MH AEA.
References
1. Falkowski PG, Barber RT, Smetacek VV (1998) Biogeochemical Controls and
Feedbacks on Ocean Primary Production. Science 281: 200–207.
2. Field CB, Behrenfeld MJ, Randerson JT, Falkowski P (1998) Primary production
of the biosphere: integrating terrestrial and oceanic components. Science 281:
237–240.
3. Armbrust EV, Berges JA, Bowler C, Green BR, Martinez D, et al. (2004) The
genome of the diatom Thalassiosira pseudonana: ecology, evolution, and
metabolism. Science 306: 79–86.
4. Moustafa A, Beszteri B, Maier UG, Bowler C, Valentin K, et al. (2009) Genomic
footprints of a cryptic plastid endosymbiosis in diatoms. Science 324: 1724–1726.
5. Allen AE, Vardi A, Bowler C (2006) An ecological and evolutionary context for
integrated nitrogen metabolism and related signaling pathways in marine
diatoms. Curr Opin Plant Biol 9: 264–273.
6. Bowler C, Allen AE, Badger JH, Grimwood J, Jabbari K, et al. (2008) The
Phaeodactylum genome reveals the evolutionary history of diatom genomes.
Nature 456: 239–244.
7. Mock T, Samanta MP, Iverson V, Berthiaume C, Robison M, et al. (2008)
Whole-genome expression profiling of the marine diatom Thalassiosira
pseudonana identifies genes involved in silicon bioprocesses. Proc Natl Acad
Sci U S A 105: 1579–1584.
8. Maheswari U, Mock T, Armbrust EV, Bowler C (2009) Update of the Diatom
EST Database: a new tool for digital transcriptomics. Nucleic Acids Research
37: D1001–D1005.
9. Bowler C, Vardi A, Allen AE (2010) Oceanographic and Biogeochemical
Insights from Diatom Genomes. Annual Review of Marine Science 2: 429–461.
10. Kloosterman WP, Plasterk RH (2006) The diverse functions of microRNAs in
animal development and disease. Dev Cell 11: 441–450.
11. Carthew RW (2006) Gene regulation by microRNAs. Current Opinion in
Genetics & Development 16: 203–208.
12. Lewis BP, Burge CB, Bartel DP (2005) Conserved seed pairing, often flanked by
adenosines, indicates that thousands of human genes are microRNA targets. Cell
120: 15–20.
13. Kim VN (2005) Small RNAs: Classification, biogenesis, and function. Molecules
and Cells 19: 1–15.
14. Bartel DP (2004) MicroRNAs: Genomics, biogenesis, mechanism, and function.
Cell 116: 281–297.
15. Molnar A, Schwach F, Studholme DJ, Thuenemann EC, Baulcombe DC (2007)
miRNAs control gene expression in the single-cell alga Chlamydomonas
reinhardtii. Nature 447: 1126–1129.
16. Zhao T, Li G, Mi S, Li S, Hannon GJ, et al. (2007) A complex system of small
RNAs in the unicellular green alga Chlamydomonas reinhardtii. Genes Dev 21:
1190–1203.
17. Cock JM, Sterck L, Rouze P, Scornet D, Allen AE, et al. (2010) The Ectocarpus
genome and the independent evolution of multicellularity in brown algae.
Nature 465: 617–621.
18. Liang C, Zhang X, Zou J, Xu D, Su F, et al. (2010) Identification of miRNA
from Porphyra yezoensis by high-throughput sequencing and bioinformatics
analysis. PLoS One 5: e10698.
19. Lagos-Quintana M, Rauhut R, Lendeckel W, Tuschl T (2001) Identification of
novel genes coding for small expressed RNAs. Science 294: 853–858.
Thalassiosira pseudonana Small RNA Transcriptome
PLoS ONE | www.plosone.org 11 August 2011 | Volume 6 | Issue 8 | e22870

20. Lau NC, Lim LP, Weinstein EG, Bartel DP (2001) An abundant class of tiny
RNAs with probable regulatory roles in Caenorhabditis elegans. Science 294:858–862.
21. Lee RC, Ambros V (2001) An extensive class of small RNAs in Caenorhabditis
elegans. Science 294: 862–864.22. Rajagopalan R, Vaucheret H, Trejo J, Bartel DP (2006) A diverse and
evolutionarily fluid set of microRNAs in Arabidopsis thaliana. Genes &Development 20: 3407–3425.
23. Morozova O, Marra MA (2008) Applications of next-generation sequencing
technologies in functional genomics. Genomics 92: 255–264.24. Shendure J, Porreca GJ, Reppas NB, Lin XX, McCutcheon JP, et al. (2005)
Accurate multiplex polony sequencing of an evolved bacterial genome. Science309: 1728–1732.
25. Morozova O, Hirst M, Marra MA (2009) Applications of new sequencingtechnologies for transcriptome analysis. Annu Rev Genomics Hum Genet 10:
135–151.
26. Schulte JH, Marschall T, Martin M, Rosenstiel P, Mestdagh P, et al. (2010)Deep sequencing reveals differential expression of microRNAs in favorable
versus unfavorable neuroblastoma. Nucleic Acids Research 38: 5919–5928.27. Linsen SEV, de Wit E, Janssens G, Heater S, Chapman L, et al. (2009)
Limitations and possibilities of small RNA digital gene expression profiling.
Nature Methods 6: 474–476.28. Ma ZR, Coruh C, Axtell MJ (2010) Arabidopsis lyrata Small RNAs: Transient
MIRNA and Small Interfering RNA Loci within the Arabidopsis Genus. PlantCell 22: 1090–1103.
29. Goff LA, Davila J, Swerdel MR, Moore JC, Cohen RI, et al. (2009) Ago2immunoprecipitation identifies predicted microRNAs in human embryonic stem
cells and neural precursors. PLoS One 4: e7192.
30. Griffiths-Jones S (2004) The microRNA Registry. Nucleic Acids Research 32:D109–D111.
31. Darley WM, Volcani BE (1969) Role of silicon in diatom metabolism. A siliconrequirement for deoxyribonucleic acid synthesis in the diatom Cylindrotheca
fusiformis Reimann and Lewin. Exp Cell Res 58: 334–342.
32. Hildebrand M, Dahlin K (2000) Nitrate transporter genes from the diatomCylindrotheca fusiformis (Bacillariophyceae): mRNA levels controlled by
nitrogen source and by the cell cycle. Journal of Phycology 36: 702–713.33. Lu C, Meyers BC, Green PJ (2007) Construction of small RNA cDNA libraries
for deep sequencing. Methods 43: 110–117.34. Margulies M, Egholm M, Altman WE, Attiya S, Bader JS, et al. (2005) Genome
sequencing in microfabricated high-density picolitre reactors. Nature 437:
376–380.35. Altschul SF, Gish W, Miller W, Myers EW, Lipman DJ (1990) Basic local
alignment search tool. J Mol Biol 215: 403–410.36. Li WZ, Godzik A (2006) Cd-hit: a fast program for clustering and comparing
large sets of protein or nucleotide sequences. Bioinformatics 22: 1658–1659.
37. Hsu D, Shih LM, Zee YC (1994) Degradation of rRNA in Salmonella strains: anovel mechanism to regulate the concentrations of rRNA and ribosomes.
J Bacteriol 176: 4761–4765.38. Elbashir SM, Lendeckel W, Tuschl T (2001) RNA interference is mediated by
21- and 22-nucleotide RNAs. Genes Dev 15: 188–200.39. Griffiths-Jones S, Bateman A, Marshall M, Khanna A, Eddy SR (2003) Rfam:
an RNA family database. Nucleic Acids Res 31: 439–441.
40. Hinas A, Reimegard J, Wagner EG, Nellen W, Ambros VR, et al. (2007) Thesmall RNA repertoire of Dictyostelium discoideum and its regulation by
components of the RNAi pathway. Nucleic Acids Res 35: 6714–6726.41. Friedlander MR, Chen W, Adamidi C, Maaskola J, Einspanier R, et al. (2008)
Discovering microRNAs from deep sequencing data using miRDeep. Nature
Biotechnology 26: 407–415.42. Hofacker IL, Fontana W, Stadler PF, Bonhoeffer LS, Tacker M, et al. (1994)
FAST FOLDING AND COMPARISON OF RNA SECONDARY STRUC-TURES. Monatshefte Fur Chemie 125: 167–188.
43. Ambros V, Bartel B, Bartel DP, Burge CB, Carrington JC, et al. (2003) A
uniform system for microRNA annotation. Rna-a Publication of the Rna Society9: 277–279.
44. Hudson D (1995) FASTA software.45. Norden-Krichmar TM, Holtz J, Pasquinelli AE, Gaasterland T (2007)
Computational prediction and experimental validation of Ciona intestinalismicroRNA genes. BMC Genomics 8: 445.
46. Ruby JG, Jan C, Player C, Axtell MJ, Lee W, et al. (2006) Large-scale
sequencing reveals 21U-RNAs and additional microRNAs and endogenoussiRNAs in C.elegans. Cell Cycle 127: 1193–1207.
47. Kohany O, Gentles AJ, Hankus L, Jurka J (2006) Annotation, submission and
screening of repetitive elements in Repbase: RepbaseSubmitter and Censor.
BMC Bioinformatics 7: 474.
48. Rehmsmeier M, Steffen P, Hochsmann M, Giegerich R (2004) Fast and effective
prediction of microRNA/target duplexes. Rna-a Publication of the Rna Society
10: 1507–1517.
49. Hu Z, Bao J, Reecy JM (2007) A Gene Ontology (GO) Terms Classification
Counter Plant and Animal Genome XV Conference, San Diego, CA.
50. Kim VN (2005) MicroRNA biogenesis: Coordinated cropping and dicing.
Nature Reviews Molecular Cell Biology 6: 376–385.
51. Gough J, Karplus K, Hughey R, Chothia C (2001) Assignment of homology to
genome sequences using a library of hidden Markov models that represent all
proteins of known structure. J Mol Biol 313: 903–919.
52. Cerutti H, Casas-Mollano JA (2006) On the origin and functions of RNA-
mediated silencing: from protists to man. Current Genetics 50: 81–99.
53. De Riso V, Raniello R, Maumus F, Rogato A, Bowler C, et al. (2009) Gene
silencing in the marine diatom Phaeodactylum tricornutum. Nucleic Acids Res
37: e96.
54. Vogel J, Sharma CM (2005) How to find small non-coding RNAs in bacteria.
Biol Chem 386: 1219–1238.
55. Gottesman S (2005) Micros for microbes: non-coding regulatory RNAs in
bacteria. Trends Genet 21: 399–404.
56. Tian G, Yin XY, Luo H, Xu XH, Bolund L, et al. (2010) Sequencing bias:
comparison of different protocols of MicroRNA library construction. Bmc
Biotechnology 10.
57. Aravin AA, Lagos-Quintana M, Yalcin A, Zavolan M, Marks D, et al. (2003)
The small RNA profile during Drosophila melanogaster development. Dev Cell
5: 337–350.
58. Kim VN (2008) Sorting out small RNAs. Cell 133: 25–26.
59. Ho T, Wang H, Pallett D, Dalmay T (2007) Evidence for targeting common
siRNA hotspots and GC preference by plant Dicer-like proteins. FEBS Lett 581:
3267–3272.
60. Zeng Y, Yi R, Cullen BR (2005) Recognition and cleavage of primary
microRNA precursors by the nuclear processing enzyme Drosha. Embo Journal
24: 138–148.
61. Bonnet E, Van de Peer Y, Rouze P (2006) The small RNA world of plants. New
Phytol 171: 451–468.
62. Jones-Rhoades MW, Bartel DP, Bartel B (2006) MicroRNAS and their
regulatory roles in plants. Annu Rev Plant Biol 57: 19–53.
63. Axtell MJ, Snyder JA, Bartel DP (2007) Common functions for diverse small
RNAs of land plants. Plant Cell 19: 1750–1769.
64. Kim YK, Kim VN (2007) Processing of intronic microRNAs. EMBO J 26:
775–783.
65. Carthew RW, Sontheimer EJ (2009) Origins and Mechanisms of miRNAs and
siRNAs. Cell 136: 642–655.
66. Reinhart BJ, Bartel DP (2002) Small RNAs correspond to centromere
heterochromatic repeats. Science 297: 1831.
67. Maumus F, Allen AE, Mhiri C, Hu H, Jabbari K, Vardi A, Grandbastien M,
Bowler C (2009) Potential impact of stress activated retrotransposons on genome
evolution in a marine diatom. BMC Evolutionary Biology (in review).
68. Chen J, Sun M, Kent WJ, Huang X, Xie H, et al. (2004) Over 20% of human
transcripts might form sense-antisense pairs. Nucleic Acids Res 32: 4812–4820.
69. Katayama S, Tomaru Y, Kasukawa T, Waki K, Nakanishi M, et al. (2005)
Antisense transcription in the mammalian transcriptome. Science 309:
1564–1566.
70. Borsani O, Zhu J, Verslues PE, Sunkar R, Zhu JK (2005) Endogenous siRNAs
derived from a pair of natural cis-antisense transcripts regulate salt tolerance in
Arabidopsis. Cell 123: 1279–1291.
71. Lu C, Tej SS, Luo SJ, Haudenschild CD, Meyers BC, et al. (2005) Elucidation of
the small RNA component of the transcriptome. Science 309: 1567–1569.
72. Axtell MJ, Bowman JL (2008) Evolution of plant microRNAs and their targets.
Trends Plant Sci 13: 343–349.
73. Rumble SM, Lacroute P, Dalca AV, Fiume M, Sidow A, et al. (2009) SHRiMP:
accurate mapping of short color-space reads. PLoS Comput Biol 5: e1000386.
74. Ondov BD, Varadarajan A, Passalacqua KD, Bergman NH (2008) Efficient
mapping of Applied Biosystems SOLiD sequence data to a reference genome for
functional genomic applications. Bioinformatics 24: 2776–2777.
75. Voinnet O (2009) Origin, biogenesis, and activity of plant microRNAs. Cell 136:
669–687.
Thalassiosira pseudonana Small RNA Transcriptome
PLoS ONE | www.plosone.org 12 August 2011 | Volume 6 | Issue 8 | e22870