Characterization of the image-derived carotid artery input ...rosie/mypapers/pmb7_23_019.pdf ·...
17
IOP PUBLISHING PHYSICS IN MEDICINE AND BIOLOGY Phys. Med. Biol. 52 (2007) 7055–7071 doi:10.1088/0031-9155/52/23/019 Characterization of the image-derived carotid artery input function using independent component analysis for the quantitation of [18F] fluorodeoxyglucose positron emission tomography images * K Chen 1,2,3 , X Chen 4 , R Renaut 2,3,5 , G E Alexander 3,6 , D Bandy 1,3 , H Guo 2,3 and E M Reiman 1,3,7,8 1 The Banner Alzheimer Institute and the Banner Good Samaritan Positron Emission Tomography (PET) Center, Phoenix, AZ, USA 2 The Department of Mathematics and Statistics, Arizona State University, Tempe, AZ, USA 3 The Arizona Alzheimer’s Consortium, Phoenix, AZ, USA 4 Div Computer Stud, Arizona State University, Mesa, AZ, USA 5 Department of Biomedical Informatics, Arizona State University, Tempe, AZ, USA 6 The Department of Psychology, Arizona State University, Tempe, AZ, USA 7 The Department of Psychiatry, University of Arizona, Tucson, AZ, USA 8 The Translational Genomics Research Institute (TGen), Phoenix, AZ, USA Received 26 June 2007, in final form 20 September 2007 Published 15 November 2007 Online at stacks.iop.org/PMB/52/7055 Abstract We previously developed a noninvasive technique for the quantification of fluorodeoxyglucose (FDG) positron emission tomography (PET) images using an image-derived input function obtained from a manually drawn carotid artery region. Here, we investigate the use of independent component analysis (ICA) for more objective identification of the carotid artery and surrounding tissue regions. Using FDG PET data from 22 subjects, ICA was applied to an easily defined cubical region including the carotid artery and neighboring tissue. Carotid artery and tissue time activity curves and three venous samples were used to generate spillover and partial volume-corrected input functions and to calculate the parametric images of the cerebral metabolic rate for glucose (CMRgl). Different from a blood-sampling-free ICA approach, the results from our ICA approach are numerically well matched to those based on the arterial blood sampled input function. In fact, the ICA-derived input functions and CMRgl measurements were not only highly correlated (correlation coefficients >0.99) to, but also highly comparable (regression slopes between 0.92 and 1.09), with those generated using arterial blood sampling. Moreover, the reliability of the ICA-derived input function remained high despite variations in the location and size of the cubical region. The ICA procedure makes it possible to quantify FDG PET images in an objective and reproducible manner. (Some figures in this article are in colour only in the electronic version) * Image-derived input function by ICA for FDG-PET. 0031-9155/07/237055+17$30.00 © 2007 IOP Publishing Ltd Printed in the UK 7055
-
Upload
vuongnguyet -
Category
Documents
-
view
218 -
download
2
Transcript of Characterization of the image-derived carotid artery input ...rosie/mypapers/pmb7_23_019.pdf ·...

IOP PUBLISHING PHYSICS IN MEDICINE AND BIOLOGY
Phys. Med. Biol. 52 (2007) 7055–7071 doi:10.1088/0031-9155/52/23/019
Characterization of the image-derived carotid arteryinput function using independent component analysisfor the quantitation of [18F] fluorodeoxyglucosepositron emission tomography images*
K Chen1,2,3, X Chen4, R Renaut2,3,5, G E Alexander3,6, D Bandy1,3,H Guo2,3 and E M Reiman1,3,7,8
1 The Banner Alzheimer Institute and the Banner Good Samaritan Positron EmissionTomography (PET) Center, Phoenix, AZ, USA2 The Department of Mathematics and Statistics, Arizona State University, Tempe, AZ, USA3 The Arizona Alzheimer’s Consortium, Phoenix, AZ, USA4 Div Computer Stud, Arizona State University, Mesa, AZ, USA5 Department of Biomedical Informatics, Arizona State University, Tempe, AZ, USA6 The Department of Psychology, Arizona State University, Tempe, AZ, USA7 The Department of Psychiatry, University of Arizona, Tucson, AZ, USA8 The Translational Genomics Research Institute (TGen), Phoenix, AZ, USA
Received 26 June 2007, in final form 20 September 2007Published 15 November 2007Online at stacks.iop.org/PMB/52/7055
AbstractWe previously developed a noninvasive technique for the quantification offluorodeoxyglucose (FDG) positron emission tomography (PET) images usingan image-derived input function obtained from a manually drawn carotid arteryregion. Here, we investigate the use of independent component analysis (ICA)for more objective identification of the carotid artery and surrounding tissueregions. Using FDG PET data from 22 subjects, ICA was applied to an easilydefined cubical region including the carotid artery and neighboring tissue.Carotid artery and tissue time activity curves and three venous samples wereused to generate spillover and partial volume-corrected input functions andto calculate the parametric images of the cerebral metabolic rate for glucose(CMRgl). Different from a blood-sampling-free ICA approach, the results fromour ICA approach are numerically well matched to those based on the arterialblood sampled input function. In fact, the ICA-derived input functions andCMRgl measurements were not only highly correlated (correlation coefficients>0.99) to, but also highly comparable (regression slopes between 0.92 and1.09), with those generated using arterial blood sampling. Moreover, thereliability of the ICA-derived input function remained high despite variationsin the location and size of the cubical region. The ICA procedure makes itpossible to quantify FDG PET images in an objective and reproducible manner.
(Some figures in this article are in colour only in the electronic version)
* Image-derived input function by ICA for FDG-PET.
0031-9155/07/237055+17$30.00 © 2007 IOP Publishing Ltd Printed in the UK 7055

7056 K Chen et al
1. Introduction
In order to transform [18F] 2-fluoro-2-deoxy-D-glucose (FDG) positron emission tomography(PET) images into quantitative measurements of the cerebral metabolic rate for glucose(CMRgl, in units of mg/min/100 g), it is necessary to provide information about radiotracerdelivery to the brain (i.e., the FDG input function), often referred to as the plasma timeactivity curve (PTAC). While the PTAC may be generated using arterial/arterialized bloodsamples, the invasive blood sampling approach is frequently uncomfortable and associatedwith occasional risk, it jeopardizes the ability to enroll and retain persons in research studies(e.g., in longitudinal studies Reiman et al 2001) or clinical trials, it is labor-intensive,and it is not practical in small animal-imaging studies (e.g., in the preclinical screeningof investigational therapies (Huang et al 2004)). We previously developed a non-invasivemethod using dynamically acquired FDG PET images, three venous plasma measurementsand a manually drawn carotid artery region of interest (ROI) to generate the image-derivedinput function (Chen et al 1998). In this paper, we discuss the identification of the carotidartery and surrounding tissue ROI using independent component analysis, making it possibleto quantify FDG PET human brain images with minimal manual, subjective efforts and in avery reproducible way.
The essential step in the generation of the image-derived input function is the localizationof the blood vessel component(s) from which the dynamics of the tracer in the vascular spaceare to be extracted. Entirely or partly manual procedures have been proposed to define vascularROIs, including our previously described method to manually define carotid artery ROI (Chenet al 1998) and a previously described method to manually define venous sinus ROIs (Wahlet al 1999) directly in dynamically acquired FDG PET images. Alternatively, a vascular ROImay be defined on a person’s co-registered high-resolution magnetic resonance image (MRI)(Litton 1997). The choice of the superior sagittal sinus via the simulation of the tomographicimaging process to generate images of different blood vessel and background geometries, andselecting the one that best fits the acquired PET image, is yet another suggested approachfor obtaining a relevant blood vessel ROI (Asselin et al 2004) which avoids both manualdrawing and the need for MRI data. A number of statistical procedures have also beenproposed to identify vascular ROIs in dynamically acquired PET images using temporal tracerkinetic information; these methods include cluster analysis (Liptrot et al 2004), dynamic factoranalysis (Wu et al 1995, 1996) and, of particular interest to the current study, independentcomponent analysis (ICA) (Lee et al 2001, Naganawa et al 2005, Su et al 2005).
ICA was first introduced to human brain imaging researchers in functional MRI (fMRI)studies (McKeown et al 1998). ICA has also been applied to quantitative myocardial perfusionin dynamically acquired oxygen-15 water cardiac PET data (Lee et al 2001). In that O-15water PET study, the ICA-generated input function was found to have a tail with reduced noiseas compared to that obtained by arterial blood sampling, whereas the estimates of myocardialblood flow are comparable. Since the left ventricle is relatively large and clearly separatedfrom the myocardial wall, it did not appear to be necessary to consider potentially confoundingpartial-volume and spillover effects (Lee et al 2001). In contrast, these effects cannot be safelyignored in human brain PET studies since a cerebral blood vessel is small relative to imageresolution. With their special version of ICA, EPICA which incorporates specific propertiesof the human brain FDG-PET data, Naganawa et al used a single arterial blood sample toscale the ICA generated image-derived input function, and they accounted for the effects ofspillover implicitly through the source signal mixing process (Naganawa et al 2005). With thesame consideration in mind and the objective to establish a CMRgl quantification procedurewithout any blood sampling (i.e., blood sampling free FDG-PET CMRgl quantification),
Characterization of the image-derived carotid artery input function using independent component analysis 7057
Su et al adopted the approach proposed in Chen et al (1998) but replaced the later venousblood samples with the extracted local frame-wise maximal activity from the ICA identifiedblood vessel region over the first 30 min interval (Su et al 2005). Below, we refer to this ICA-based frame-wise maximal time activity curve as Imax-ica and their approach as MAX-ICA.Continuing these ICA efforts initiated by Naganawa et al (2005) and Su et al (2005) for thegeneration of the input function for dynamic FDG-PET human brain studies, the current studyhas several aims. (1) We carefully examine the effects of various settings associated withthe ICA procedure. These settings have been routinely determined by visual and subjectiveinspection of the images. (2) We investigate the robustness of the estimated CMRgl valuesto these settings attempting to minimize the effects of the subjective choices for these varioussettings. (3) For the generation of the image-derived input function for dynamic FDG-PETstudies, we introduce the use of a general-purpose ICA computer package, FMRLAB (Duannet al 2002, McKeown et al 1998), with our own adaptation and our voxel-by-voxel CMRglquantification computer program, fully streamlined. (4) We revisit the feasibility of CMRglquantification without any blood sampling. We argue respectfully that an absolute blood-sampling free procedure is yet to be realized. Among the arterial blood input function andthe two ICA based image-derived input functions constructed either via MAX-ICA or viausing few venous blood samples (referred to as VEN-ICA below), we examined the numericalcompatibility of the CMRgl quantified with each of them. This numerical compatibility is incontrast to only examining the closeness of correlation between the CMRgl quantified via oneinput function and the CMRgl via another (Su et al 2005). We argue that close correlationalone, as performed for FDG-PET data from six subjects (Su et al 2005), would not addressthe existence of potential bias and the variability of the bias across study subjects/groups.
Though with different views on some important issues such as the one that the ICAapproach can completely eliminate the need for blood sampling, our current study providesadditional and more solid supporting evidences for the use of ICA to generate the image-derived input function in dynamic FDG-PET human brain studies, consistent with the mainconclusions from previous studies (Naganawa et al 2005, Su et al 2005). In doing so,we also validated the ready-to-use package, FMRLAB (http://www.sccn.ucsd.edu/fmrlab/)together with some needed adaptations, the optimized settings of FMRLAB and settings inour adaptation. In addition, we used data from more research subjects who had arterial bloodsampling to empirically validate the accuracy of our virtually streamlined method for thequantification of CMRgl and to demonstrate the general applicability of the ICA procedure.
2. Method
2.1. Data
This study used the PET images and arterial blood data previously acquired for the studyin which we introduced our non-invasive method for quantifying FDG PET images usingmanually defined carotid-artery ROI (Chen et al 1998). Dynamic FDG PET scan wasperformed in 22 healthy research subjects using the 951/31 ECAT scanner (Siemens,Knoxville, TN). Following the performance of a transmission scan and the subsequentintravenous administration of 10 mCi FDG (Chen et al 1998, and Reiman et al 2001), eachsubject had a 60 min dynamic sequence of emission scans, resulting in one 12 s, eight 2 s,two 10 s, one 12 s, one 30 s, two 1.0 min, two 1.5 min, one 3.5 min, two 5 min, one 10.0 minand one 30 min reconstructed frames. PET images were reconstructed using a filtered back-projection method with a Hanning filter of 0.4 cycles per pixel cutoff frequency, and measuredcorrection for radiation attenuation and scatter. For use in our non-invasive quantitation

7058 K Chen et al
method, the subjects also had five venous blood samples drawn at the mid-time points of thelast five frames. For the purpose of validating our non-invasive method by comparing it tothe input functions derived from arterial blood samples, sequential arterial blood sampleswere drawn every 5 s for the first minute, every 10 s for the second minute, every 30 s forthe next two minutes, and then at 5, 6, 8, 10, 12, 15, 20, 25, 30, 40, 50 and 60 min, yieldinga discrete representation of the blood sampled function. Note that the arterial blood samplesare only used here for the purpose of validating VEN-ICA. Its routine use only requires a fewvenous samples acquired towards the end of the scanning session, and assumes the previouslyestablished compatibility between venous and arterial blood samples (Chen et al 1998). ForCMRgl quantification, the blood glucose levels were needed and measured via blood samplingat the first and the last of the five blood samples. The setup for measuring the blood glucoselevel was then simply used for other venous blood samples. Thus, there is actually no addedextra-burden on the PET acquisition procedure or on the patient. To our knowledge, themost practical and adequate procedure for measuring the blood glucose level is still via bloodsampling. This fact, articulated more in the discussion, and the observed variability of theCMRgl estimated bias via the use of Imax-ica (the MAX-ICA approach), as presented in theresults section, are the primary reasons questioning the feasibility of the CMRgl quantificationwithout any blood sampling.
2.2. ICA procedure
Denote the dynamic series of PET data as Fi(i = 1, 2, . . . , n), where n is the number of timeframes. Each Fi corresponds to three-dimensional PET data over the brain volume acquiredat time ti and consistently rearranged as a row vector with length N (the number of voxels).The entire dynamic PET dataset X is given by
X =
F1
F2
· · ·Fn
.
Note that it is usually the case that the N � n, a main reason cited in favor of spatialICA (Duann et al 2002, McKeown et al 1998). The spatial ICA is to construct a set ofJ (� min(n,N)) independent spatial components from n frames, for which the jth of thesecomponents is a linear combination of these n frames: yj = ∑
n
i=1 wj
i Fi (j = 1, 2, . . . , J )
and yi and yk (i �= k) are statistically independent. Note that the component yj is associatedwith a temporal weight vector, w
j
1wj
2 . . . wjn, (one weight per frame) and a spatial pattern
y1j y
2j . . . yN
j , the realization of the random variable yj . It is also worth noting that principalcomponent analysis has been routinely performed, and was the case in our use of FMRLAB,prior to the ICA procedure for reducing the dataset dimension and for de-correlating the data.
The ICA optimization procedure adopted in FMRLAB is infomax, which is based on themaximization of network entropy for the construction of the independent components. Aspreviously suggested (Duann et al 2002, McKeown et al 1998) for fMRI, we believe alsothat infomax is appropriate for the determination of the vascular ROI in dynamic PET studiesbecause the independent components for the blood vessel should have relatively small regionsof non-negligible weight values. Moreover, the results of our current study provide strongempirical support for the use of the infomax algorithm (see the results section).
Though the ICA core of the FMRLAB was un-touched, some code modifications weremade for our study. These modifications made to FMRLAB include (a) data file input/outputto directly read in ECAT6 or ECAT7 formatted PET data as well as Analyze or NIFTI file;
Characterization of the image-derived carotid artery input function using independent component analysis 7059
(b) pre-assignment of various settings, originally provided by the user via graphic user interfaceat the run-time, so that the program can be run in the batch mode for testing purposes;(c) extraction of dynamic PET counts over the carotid region and its surrounding tissue region;(d) reformatting of image displays at the raw image-thresholding stage so that the thresholdedearly summed image (for carotid artery identification) can be superimposed on the top of thelast frame (for the identification of brain volume).
2.3. ICA procedure for image-derived input function and related FMRLAB settings
In contrast to the use of ICA in fMRI studies, neither spatial normalization nor smoothing wasapplied to the dynamic PET data prior to the ICA procedure. Similar to other ICA studies forthe generation of the image derived input function, we first determined the spatial componentwhose spatial weight vector, denoted as yb, has non-negligible weight only over the bloodvessel regions (carotid artery, especially for this study). There were two different approachesto construct the input function once the corresponding component is determined. One wasthe use of the corresponding time series, wb, proposed in Naganawa et al (2005), as therepresentation of the input function for which the spillover from surrounding tissue regionswas considered in the context of the unmixing matrix. Alternatively, a blood vessel regionmay be defined as a collection of voxels whose yb value is higher than a given threshold (Leeet al 2001, Su et al 2005). From this blood vessel ROI, the frame-by-frame PET data canthen be extracted. In this current study, we adopted this latter approach to extract the dynamicdata, but with an extensive test for the robustness of thresholds and the existence of an optimalsubject-independent threshold. The extracted data, however, still subjected to the subsequentand separate partial volume and/or spillover correction via either MAX-ICA or VEN-ICA.The extracted and corrected data set yields the image-derived input function. Proceduresrelated to the use of ICA together with venous blood samples or Imax-ica are described belowand depicted as a flowchart in figure 1.
(1) Define the volume containing the carotid artery. This is an easy and quick data preparationstep priori to the FMRLAB ICA procedure. A cubical volume containing the carotid arteryis defined first (otherwise, the whole image can be used). To define this cubical volume,early frames from time 0 up to 48 s are summed. The range of the slices over which thecarotid arteries are present is determined visually (three to five slices in the lower portionof the brain). A rectangle is then manually defined over the middle slice by two mouse-clicks, one at the upper-left corner and another at the lower-right corner of the rectangle.This rectangle is then copied to the selected slices, thus generating a cubical region in the3D space that contains the carotid artery and neighboring brain tissue regions. See thethree boxes on the top of the flowchart in figure 1. The effects of the size and location ofthis cubical volume on the ICA-generated input function will be examined.
(2) Exclude the non-brain region. The brain tissue region within this cubical volume is visibleover the last PET frame and so is the carotid artery over the summed image of the earlyframes. Both structures are displayed, one on top of the other, and inspected. Voxelswhose intensities over the last frame are lower than a visually determined threshold, Inb,indicating non-brain voxels without meaningful FDG uptakes, were excluded from thesubsequent ICA procedure. This exclusion further reduces the size of the data set forICA processing. More importantly, it allows adequate definition of brain tissue ROIssurrounding the carotid artery which are required for extracting the tissue tracer dynamicsused in correcting tissue-to-blood spillover. This threshold guaranteed that the tissue ROIwould contain no voxels outside the brain volume. See the single box in row 2 of theflowchart in figure 1. Note that, in contrast to the two additional thresholds defined below,

7060 K Chen et al
Figure 1. Flowchart of the ICA procedure for the generation of the image-derived input functionand the generation of the CMRgl parametric images. See steps 1–5 detailed in the text.
this threshold is for the raw PET image data. We will examine the robustness of theimage-derived input function to the variation of the Inb values.
(3) Determine the threshold for definition of the carotid artery. Next, the ICA is applied to thepre-processed dynamic data resulting from steps 1 and 2. Each independent componentis first converted to a z-score (using voxel-wise mean and standard deviation) and visuallyexamined by superimposing on top of the image summed over the first 48 s time interval.The spatial component overlap with the carotid artery (having non-negligible weightsover the carotid artery ROI) was visually determined. The time activity curves (TAC) ofthe blood vessel are then generated by averaging data over voxels whose correspondingz-scores are greater than a threshold Zb. We will evaluate a range of z-score thresholdvalues, Zb, of this blood vessel component in terms of the spatial extent of the mapoverlapping with the blood vessel, and in terms of the consistency between the recoveredimage-derived input function and the blood sampled input function. As in Su et al (2005),we extracted Imax-ica, the TAC of the maximum pixel value within the ICA identified carotidartery and re-evaluated its use to approximate the true input function for the first 30 minso as to correct for the partial volume effect together with the effects of tissue-to-bloodspillover.
(4) Establish the threshold for the definition of the surrounding tissue region. To correct forthe potential spillover from the surrounding tissue to the carotid artery ROI, the tissue TACover a tissue ROI adjacent to the carotid artery ROI is needed. We attempt to streamlinethis procedure by including voxels within the region delineated in steps 1 and 2 that havea z-score threshold, Zt, that is lower than the carotid threshold Zb. For both steps 3 and 4,see the three boxes in row 3 of the flowchart in figure 1. We will need to demonstrate therobustness of the choice of Zt.
(5) Correct partial volume and tissue-to-blood spillover and CMRgl parametric imagegeneration. The effects of partial volume and tissue-to-blood spillover are corrected

Characterization of the image-derived carotid artery input function using independent component analysis 7061
using our previously described method (Chen et al 1998). The two correction procedures,MAX-ICA and VEN-ICA, were both performed and compared against each other. TheVEN-ICA is via venous blood samples. As mentioned earlier, venous blood samples arecollected at time points as close as possible to the mid-time points of the last five frames.Though three venous blood samples are sufficient, the extra two blood samples ensurethat at least three high quality blood samples are available for the simultaneous estimationof two parameters: the recovery coefficient (for correcting partial volume effect) andthe tissue-to-blood spillover coefficient. The working equation for this estimation iscICAp (t) = rc × cp(t) + mtb × ct (t) where cICA
p (t) is the extracted dynamic PET seriesfrom the internal carotid artery region obtained by ICA at time t, rc is the recoverycoefficient, cp(t) is the venous blood sample interpolated to the mid-time point t of theclosest frame, mtb is the tissue-to-blood spillover coefficient and ct(t) is the tissue TACfrom the surrounding tissue ROI. The method of non-negative linear least squares isemployed to estimate rc and mtb. The second approach, MAX-ICA, is the same as VEN-ICA but with cp(t) replaced with Imax-ica over the first 30 min. The implementation ofthis correction procedure is for our re-evaluation of the proposed method in Su et al(2005). Finally, the CMRgl parametric images were generated using the graphical Patlakapproach, as in Chen et al (1998), and the input function (image derived or arterial bloodsample based). See the two boxes in row 4 of the flowchart in figure 1.
The settings discussed above are specific to our use of ICA for image-derived input functiongeneration of dynamic PET studies and some of them are additional to those associated withthe FMRLAB package (the number of PCA components set to 5). Other FMRLAB settingsare set at their default values, including the number of iterations.
2.4. Validation schemes
The sizes and locations of the cubical volumes containing the carotid artery were variedfrom the whole image-size to one that contained only the carotid artery and its immediatenon-vessel regions. Based on initial testing using data from two subjects and to examine theeffects of various thresholds, we varied Inb in the range of 5% to 50% of the maximum voxelintensity value (increment of 5%), Zb from 1.4 to 3.0 (increment of 0.2) and Zt from 1.0 to 2.0(increment of 0.1), the latter two as z-scores. For each of all possible combinations of thesethreshold settings, FMRLAB was run (in batch mode) using the criteria discussed below tofind the optimal setting combination over all subjects. With the effects of the cubical volume’ssize, location and the robustness of the CMRgl to various threshold settings investigated anddetermined, the VEN-ICA procedure was re-run by two independent operators for all subjectsto examine inter-rater variability. One of the two operators ran the procedure twice for 10 ofthe 22 subjects to examine the intra-rater variability.
2.5. Validation criteria
Several criteria were used to identify the optimal, subject-independent threshold combinationto evaluate the robustness of the ICA for extracting the input function with respect tothe thresholds and to examine the difference between VEN-ICA and MAX-ICA. First, wecompared the image-derived input function generated using VEN-ICA or MAX-ICA to thearterial blood samples, from the same subjects in terms of the shape and magnitude of theresulting time activity curves. Second, we separately compared, via voxel-by-voxel regression,the CMRgl parametric image estimated using the Patlak graphical method and one of the twoimage-derived input functions (via VEN-ICA or MAX-ICA) to the CMRgl parametric image
7062 K Chen et al
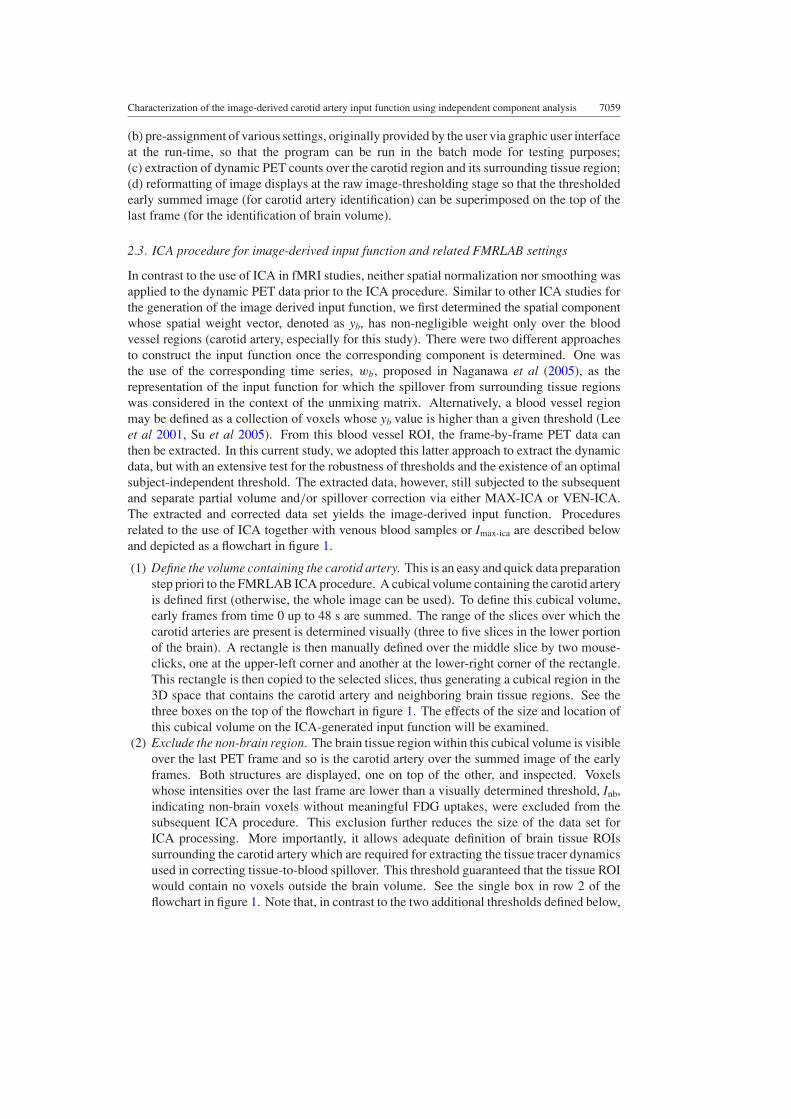
Figure 2. Robustness of the C-slope to the variation of Inb (left panel) and the variation of Zt andZb (right panel).
estimated using the Patlak graphical method and the arterial blood sample input function. Thenumerical compatibility of the CMRgl values by the ICA based image-derived input functionto the CMRgl values by the blood-sampled input function was evaluated by the closenessof the regression slope to one (1.0), intercept to zero (0.0) and the highest possible squaredcorrelation coefficients (closeness to 1.0). Below, we will simply refer the regression slope,regression intercept and squared correlation coefficient as C-slope, C-intercept and C–R2
(C for compatibility).
3. Results
3.1. Determination of a subject-independent threshold
The ability to streamline the generation of the image-derived input function depends onthe existence of subject-independent thresholds (which, however, may be scanner and/oracquisition protocol dependent). Our extensive examination of various setting combinationsrevealed a very stable and satisfactorily accurate estimate of CMRgl via VEN-ICA over arelatively wide range of the thresholds.
As illustrated in the left panel in figure 2, the C-slope varied little as the Inb valueschanged from 0.05 to 0.3. We discarded testing results for Inb values higher �35% as thesehigh Inb values aborted the tissue-to-blood spillover and partial volume correction or generatederroneous estimation for three subjects. For these subjects, the corresponding brain tissueregion defined with the cut-off threshold, when visually inspected, can be easily concludedas not accurate. Thus, the common optimal setting search region for Inb is limited the rangeof 0.05 to 0.3. In addition to C-slope results as shown in figure 2, the C-intercept is in theneighborhood of zero (mean = 0.015 and std = 0.0026 over all threshold combinations), andthe C-correlation is very close to 1 (mean = 0.9996 and std = 0.000 13 over all thresholdcombinations).
In addition to the C-slope robustness to a large range of Inb values depicted in the leftpanel of figure 2, the right panel of figure 2 shows that the C-slope numerical value changedonly narrowly, from 1.018 to 1.023, for the tested ranges of Zb and Zt. The result displayedis for Inb = 0.10. Similar results are observed for other Inb values. Note that, from theright panel of figure 2, the C-slope has value closest to 1 in the neighborhood of Zb = 2 andZt = 1.5. In addition, the C-intercept has a mean of 0.0143 with std = 0.0029 and theC-correlation a mean of 0.9995 with std = 0.000 092.
Characterization of the image-derived carotid artery input function using independent component analysis 7063
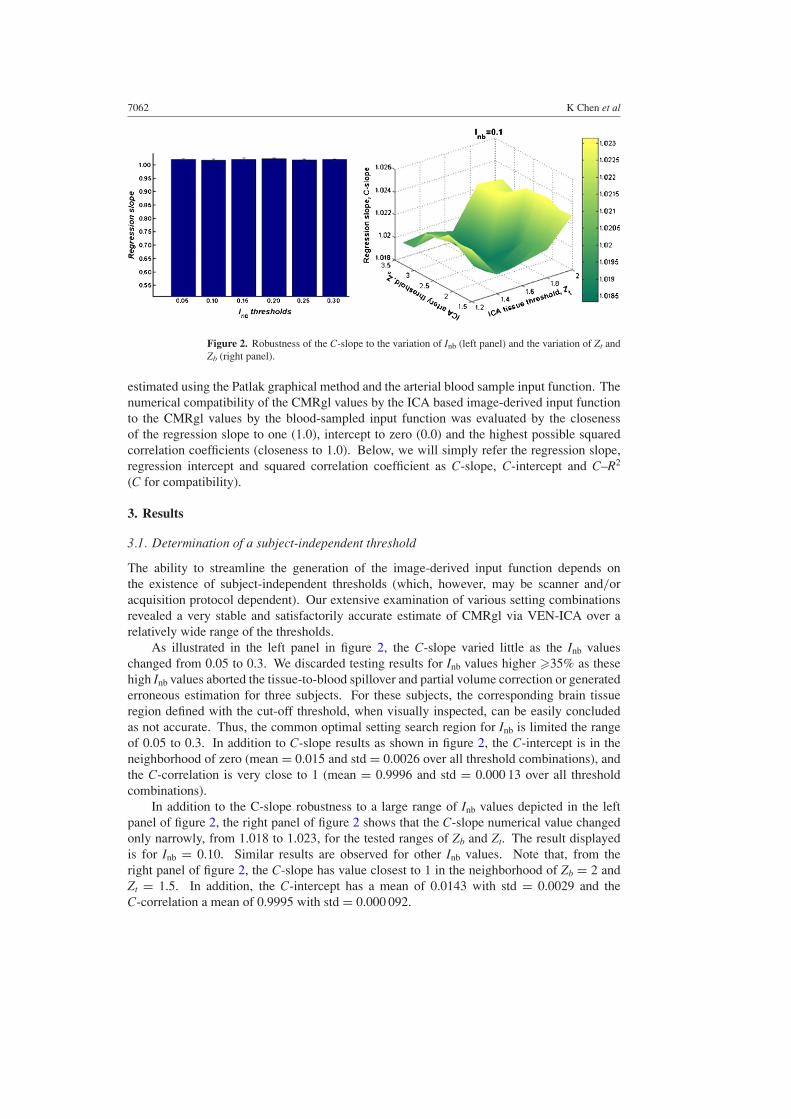
Figure 3. CMRgl parametric images generated using the arterial input function (left) the VEN-ICAinput function (middle) and the MAX-ICA input function (right, for the discussion on MAX-ICA,see below the subsection ‘The feasibility of using of Imax-ica for the generation of the image-derivedinput function’). The images displayed are horizontal in the mid-level of the brain (slice 16).
Examining the threshold testing results, robustness to a wide range of Inb, Zb and Zt, wedetermined that Zb = 2, Zt = 1.5 and Inb = 0.075×Mx (where Mx is the maximal voxel intensityvalues of the summed image) were appropriate for all subjects. In fact and as described above,the variation of the Inb values had insignificant impacts on the image-derived input functioncurves and the CMRgl parametric images. Thus, the only required manual involvement is thesimple and straightforward definition of the cubical ROI, the variability of which has almostno effect on the quantification results, as seen below.
3.2. Quantitative CMRgl comparison under the common threshold settingswith the use of VEN-ICA
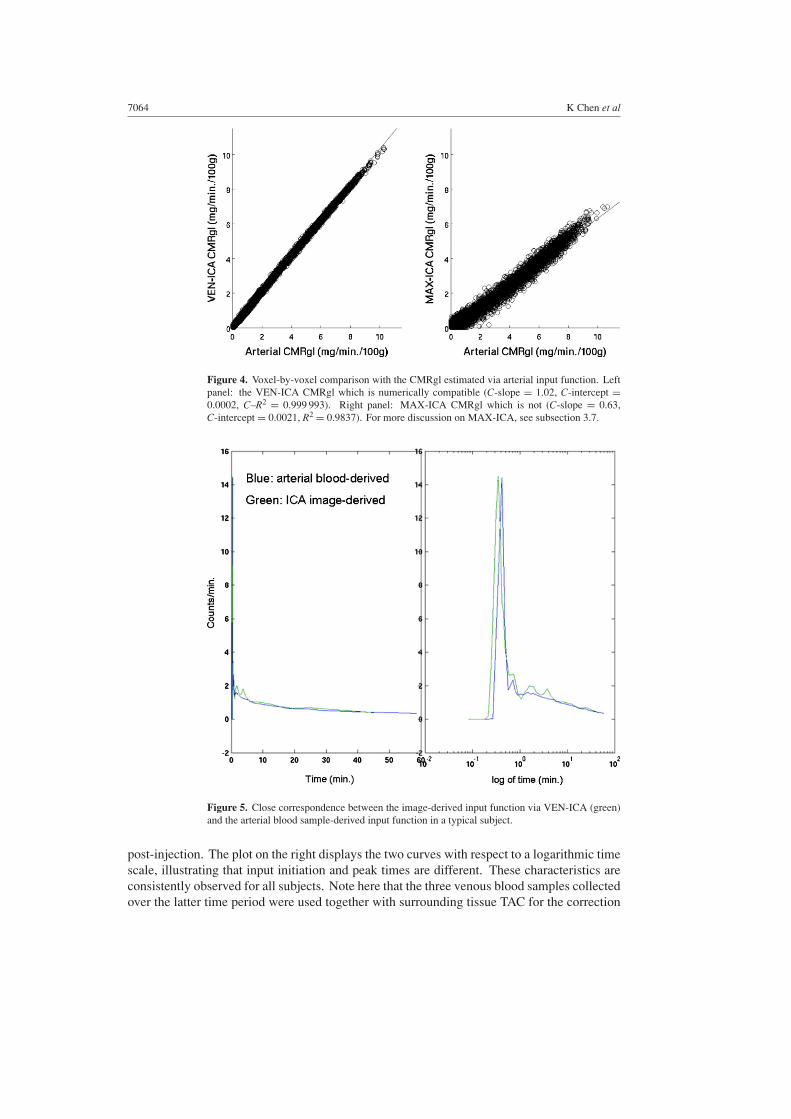
As shown in the left and middle panels of figure 3 using one subject data as an example, thetwo CMRgl parametric images generated separately with the use of arterial blood samples(left panel) or the image-derived input functions corrected via VEN-ICA (middle panel) arevisually indistinguishable. Moreover, as shown in the left panel of figure 4, voxel-by-voxelcomparison of this parametric image pair, via linear regression, resulted in the C-slope = 1.02,C-intercept = 0.0002, and squared correlation coefficient C–R2 = 0.999 993. This highlyconsistent pattern was observed in all 22 subjects comparing VEN-ICA to the arterialinput function (see table 1). We also compared the whole brain CMRgl obtained withthe two different input functions, the arterial and VEN-ICA. For our method validationpurposes, the whole brain CMRgl, a single measure for each subject and for each of thethree input functions, was calculated using spm global.m sub-routine in the SPM package(http://www.fil.ion.ucl.ac.uk/spm/) from the CMRgl parametric images. This sub-routinecomputes the whole brain CMRgl as the mean over all voxels whose CMRgl values are greaterthan one-eighth of the image-wise mean. Linear regression of the whole brain CMRgl viathe arterial input against the one via VEN-ICA among all 22 subjects was performed. Theregression slope estimate was 1.040, intercept −0.0640 with R2 = 0.918 (see the last twocolumns of table 1).
3.3. Comparison of the image-derived input function via VEN-ICAto the arterial blood samples
Visual inspection of the image derived input function via VEN-ICA confirms its compatibilitywith the blood sample generated input function, as exemplified for a single patient in figure 5.The green curve is the VEN-ICA generated image-derived input function. The blue curve isthe blood sample input function and agrees well over the time period starting at about 9 min
7064 K Chen et al
Figure 4. Voxel-by-voxel comparison with the CMRgl estimated via arterial input function. Leftpanel: the VEN-ICA CMRgl which is numerically compatible (C-slope = 1.02, C-intercept =0.0002, C–R2 = 0.999 993). Right panel: MAX-ICA CMRgl which is not (C-slope = 0.63,C-intercept = 0.0021, R2 = 0.9837). For more discussion on MAX-ICA, see subsection 3.7.
Figure 5. Close correspondence between the image-derived input function via VEN-ICA (green)and the arterial blood sample-derived input function in a typical subject.
post-injection. The plot on the right displays the two curves with respect to a logarithmic timescale, illustrating that input initiation and peak times are different. These characteristics areconsistently observed for all subjects. Note here that the three venous blood samples collectedover the latter time period were used together with surrounding tissue TAC for the correction

Characterization of the image-derived carotid artery input function using independent component analysis 7065
Table 1. Voxel-wise comparisons between the CMRgl parametric images generated using theimage-derived input function corrected for partial-volume effect via three late venous samples(VEN-ICA) and the arterial-sampled input function.
Patient Arterial-derived VEN-ICA image-derivednumber C-slope C-intercept C–R2 whole brain CMRgl whole brain CMRgl
1 1.02 0.00015 1.0000 2.1451 2.18452 1.02 0.000238 1.0000 2.9153 2.98573 0.996 −0.00295 1.0000 3.1904 3.16724 0.98 0.0077 0.9996 2.1752 1.98875 1.09 0.0063 1.0000 2.571 2.77996 0.933 0.0193 0.9994 2.6813 2.55267 0.935 0.0748 0.9930 2.6045 2.57158 1.09 −0.0243 0.9958 2.2785 2.44009 1.01 0.0148 1.0000 3.6846 3.8055
10 0.993 −0.0371 0.9983 2.3022 2.260811 0.9242 0.014 0.9996 2.6197 2.407612 1.04 0.0251 0.9994 2.528 2.660813 1.02 0.0198 0.9989 3.0501 3.176614 0.999 −0.000641 1.0000 4.1276 4.120815 1.0613 0.0087 0.9947 3.177 3.024216 1.0313 0.0041 0.9999 2.4139 2.720217 0.969 0.0284 0.9983 3.4224 3.25618 1.01 0.00577 1.0000 3.1572 3.189919 1.045 0.0014 1.0000 2.9569 3.275320 1.0245 0.0054 0.9999 3.8084 4.205621 1.04 −0.000903 1.0000 3.0128 3.120822 0.977 0.0278 0.9982 2.8544 2.8727
The C-slope, C-intercept and C–R2 are for the voxel-wise regression between the two CMRgl images. The last twocolumns list the global CMRgl estimated with either of the two input curves.
of partial volume and tissue-to-blood spillover effects and were not used to substitute theextracted image data from the carotid artery for the later portion of the image-derived inputcurve. Whereas discrepancies between the peak heights of the two curves can be observedfor some subjects, the widths of the bell-shaped portion of the input curve match well for allsubjects. This is consistent with earlier observations (Chen et al 1998), and, as discussed thereand as also shown again in table 1, has little impact on the estimated CMRgl.
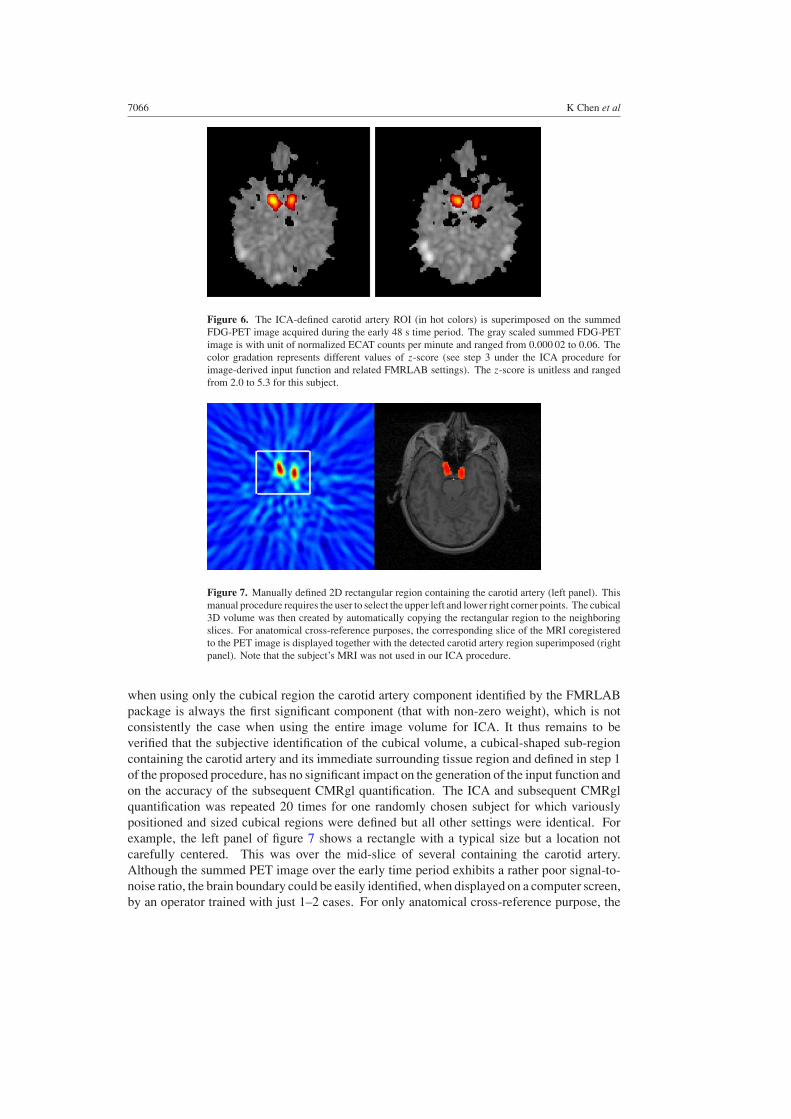
3.4. Accuracy of the ICA-derived carotid-artery ROI
As illustrated in figure 6, in which the ICA-derived carotid artery ROI is superimposed on theearly summed FDG PET images (two adjacent horizontal sections corresponding to inferiorbrain regions in which the carotid artery can be observed), the carotid artery was accuratelyidentified in all of the subjects.
3.5. Impact of the size and location of the manually defined cubical volume containing thecarotid artery and inter/intra-rater variability
There is a dramatic gain in computational speed when running ICA over only a small cubicalregion containing the carotid artery. For example, in one case the time to run the FMRLABICA program dropped from about 3 min (when the whole brain volume is used) to less than 8s for the cubical region (figure 7) manually defined with only additional 10–15 s. Moreover,
7066 K Chen et al
Figure 6. The ICA-defined carotid artery ROI (in hot colors) is superimposed on the summedFDG-PET image acquired during the early 48 s time period. The gray scaled summed FDG-PETimage is with unit of normalized ECAT counts per minute and ranged from 0.000 02 to 0.06. Thecolor gradation represents different values of z-score (see step 3 under the ICA procedure forimage-derived input function and related FMRLAB settings). The z-score is unitless and rangedfrom 2.0 to 5.3 for this subject.
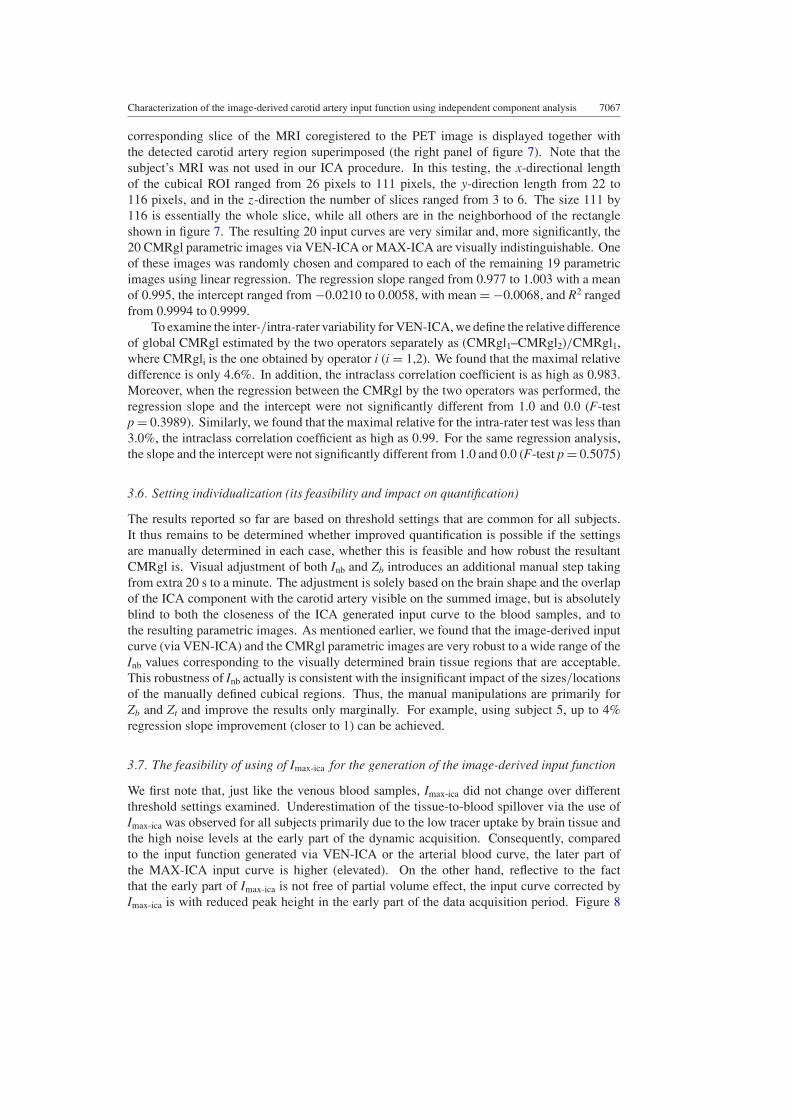
Figure 7. Manually defined 2D rectangular region containing the carotid artery (left panel). Thismanual procedure requires the user to select the upper left and lower right corner points. The cubical3D volume was then created by automatically copying the rectangular region to the neighboringslices. For anatomical cross-reference purposes, the corresponding slice of the MRI coregisteredto the PET image is displayed together with the detected carotid artery region superimposed (rightpanel). Note that the subject’s MRI was not used in our ICA procedure.
when using only the cubical region the carotid artery component identified by the FMRLABpackage is always the first significant component (that with non-zero weight), which is notconsistently the case when using the entire image volume for ICA. It thus remains to beverified that the subjective identification of the cubical volume, a cubical-shaped sub-regioncontaining the carotid artery and its immediate surrounding tissue region and defined in step 1of the proposed procedure, has no significant impact on the generation of the input function andon the accuracy of the subsequent CMRgl quantification. The ICA and subsequent CMRglquantification was repeated 20 times for one randomly chosen subject for which variouslypositioned and sized cubical regions were defined but all other settings were identical. Forexample, the left panel of figure 7 shows a rectangle with a typical size but a location notcarefully centered. This was over the mid-slice of several containing the carotid artery.Although the summed PET image over the early time period exhibits a rather poor signal-to-noise ratio, the brain boundary could be easily identified, when displayed on a computer screen,by an operator trained with just 1–2 cases. For only anatomical cross-reference purpose, the
Characterization of the image-derived carotid artery input function using independent component analysis 7067
corresponding slice of the MRI coregistered to the PET image is displayed together withthe detected carotid artery region superimposed (the right panel of figure 7). Note that thesubject’s MRI was not used in our ICA procedure. In this testing, the x-directional lengthof the cubical ROI ranged from 26 pixels to 111 pixels, the y-direction length from 22 to116 pixels, and in the z-direction the number of slices ranged from 3 to 6. The size 111 by116 is essentially the whole slice, while all others are in the neighborhood of the rectangleshown in figure 7. The resulting 20 input curves are very similar and, more significantly, the20 CMRgl parametric images via VEN-ICA or MAX-ICA are visually indistinguishable. Oneof these images was randomly chosen and compared to each of the remaining 19 parametricimages using linear regression. The regression slope ranged from 0.977 to 1.003 with a meanof 0.995, the intercept ranged from −0.0210 to 0.0058, with mean = −0.0068, and R2 rangedfrom 0.9994 to 0.9999.
To examine the inter-/intra-rater variability for VEN-ICA, we define the relative differenceof global CMRgl estimated by the two operators separately as (CMRgl1–CMRgl2)/CMRgl1,where CMRgli is the one obtained by operator i (i = 1,2). We found that the maximal relativedifference is only 4.6%. In addition, the intraclass correlation coefficient is as high as 0.983.Moreover, when the regression between the CMRgl by the two operators was performed, theregression slope and the intercept were not significantly different from 1.0 and 0.0 (F-testp = 0.3989). Similarly, we found that the maximal relative for the intra-rater test was less than3.0%, the intraclass correlation coefficient as high as 0.99. For the same regression analysis,the slope and the intercept were not significantly different from 1.0 and 0.0 (F-test p = 0.5075)
3.6. Setting individualization (its feasibility and impact on quantification)
The results reported so far are based on threshold settings that are common for all subjects.It thus remains to be determined whether improved quantification is possible if the settingsare manually determined in each case, whether this is feasible and how robust the resultantCMRgl is. Visual adjustment of both Inb and Zb introduces an additional manual step takingfrom extra 20 s to a minute. The adjustment is solely based on the brain shape and the overlapof the ICA component with the carotid artery visible on the summed image, but is absolutelyblind to both the closeness of the ICA generated input curve to the blood samples, and tothe resulting parametric images. As mentioned earlier, we found that the image-derived inputcurve (via VEN-ICA) and the CMRgl parametric images are very robust to a wide range of theInb values corresponding to the visually determined brain tissue regions that are acceptable.This robustness of Inb actually is consistent with the insignificant impact of the sizes/locationsof the manually defined cubical regions. Thus, the manual manipulations are primarily forZb and Zt and improve the results only marginally. For example, using subject 5, up to 4%regression slope improvement (closer to 1) can be achieved.
3.7. The feasibility of using of Imax-ica for the generation of the image-derived input function
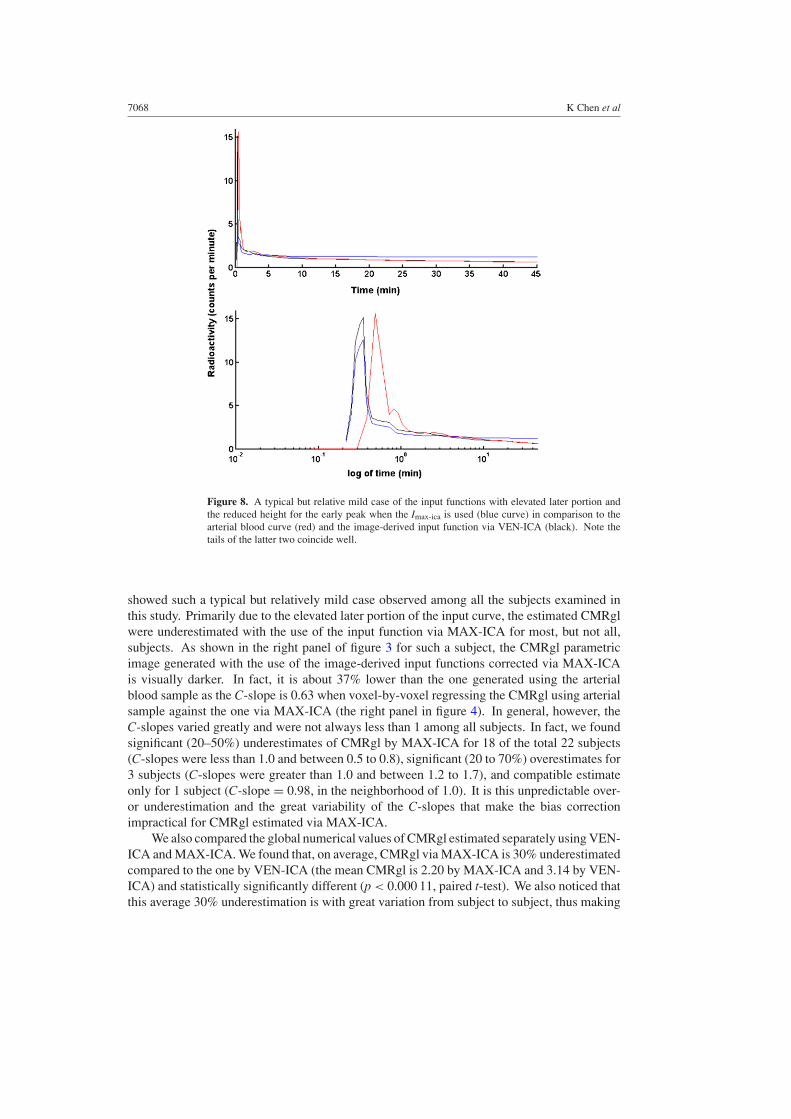
We first note that, just like the venous blood samples, Imax-ica did not change over differentthreshold settings examined. Underestimation of the tissue-to-blood spillover via the use ofImax-ica was observed for all subjects primarily due to the low tracer uptake by brain tissue andthe high noise levels at the early part of the dynamic acquisition. Consequently, comparedto the input function generated via VEN-ICA or the arterial blood curve, the later part ofthe MAX-ICA input curve is higher (elevated). On the other hand, reflective to the factthat the early part of Imax-ica is not free of partial volume effect, the input curve corrected byImax-ica is with reduced peak height in the early part of the data acquisition period. Figure 8
7068 K Chen et al
Figure 8. A typical but relative mild case of the input functions with elevated later portion andthe reduced height for the early peak when the Imax-ica is used (blue curve) in comparison to thearterial blood curve (red) and the image-derived input function via VEN-ICA (black). Note thetails of the latter two coincide well.
showed such a typical but relatively mild case observed among all the subjects examined inthis study. Primarily due to the elevated later portion of the input curve, the estimated CMRglwere underestimated with the use of the input function via MAX-ICA for most, but not all,subjects. As shown in the right panel of figure 3 for such a subject, the CMRgl parametricimage generated with the use of the image-derived input functions corrected via MAX-ICAis visually darker. In fact, it is about 37% lower than the one generated using the arterialblood sample as the C-slope is 0.63 when voxel-by-voxel regressing the CMRgl using arterialsample against the one via MAX-ICA (the right panel in figure 4). In general, however, theC-slopes varied greatly and were not always less than 1 among all subjects. In fact, we foundsignificant (20–50%) underestimates of CMRgl by MAX-ICA for 18 of the total 22 subjects(C-slopes were less than 1.0 and between 0.5 to 0.8), significant (20 to 70%) overestimates for3 subjects (C-slopes were greater than 1.0 and between 1.2 to 1.7), and compatible estimateonly for 1 subject (C-slope = 0.98, in the neighborhood of 1.0). It is this unpredictable over-or underestimation and the great variability of the C-slopes that make the bias correctionimpractical for CMRgl estimated via MAX-ICA.
We also compared the global numerical values of CMRgl estimated separately using VEN-ICA and MAX-ICA. We found that, on average, CMRgl via MAX-ICA is 30% underestimatedcompared to the one by VEN-ICA (the mean CMRgl is 2.20 by MAX-ICA and 3.14 by VEN-ICA) and statistically significantly different (p < 0.000 11, paired t-test). We also noticed thatthis average 30% underestimation is with great variation from subject to subject, thus making

Characterization of the image-derived carotid artery input function using independent component analysis 7069
subject-independent bias correction impossible. For example, for one subject the MAX-ICACMRgl = 0.78 while the VEN-ICA CMRgl = 2.66 (70% underestimation). For anothersubject, MAX-ICA CMRgl = 5.18 while the VEN-ICA CMRgl = 3.17 (63% overestimation).
4. Discussion
In this study, we introduce the use of the VEN-ICA to identify carotid-artery and surroundingtissue ROIs, reducing the potential variability of the image-derived input function that isassociated with subjective definition of the carotid-artery region and surrounding brain tissueROIs. We believe that the VEN-ICA based image-derived input function makes it possibleto quantify CMRgl estimates routinely and objectively with subject-independent commonthresholds, the existence of which might be due to the temporal TAC signal difference betweenthe carotid artery region and its surrounding tissue, relative stable cross multi-subjects asdetermined by the ICA procedure. We suggest that this technique may be especially relevantin research and clinical studies in which there are alterations in whole brain CMRgl, potentiallyconfounding non-quantitative FDG PET studies which typically normalize regional data forthe variation in whole brain measurements. For instance, we have shown the FDG PEThas greater power to track the brain changes associated with the course of Alzheimer’sdementia using absolute quantitative measurements of CMRgl than using non-quantitativeFDG PET images which are normalized for the variation in whole brain measurements,since there are time-dependent reductions in whole brain CMRgl itself. Thus, quantitativeFDG PET measurements may offer significantly greater power than non-quantitative FDGPET measurements in clinical trials which evaluate the efficacy of putative disease-slowingtreatments to attenuate these declines (Alexander et al 2002). In addition to the parameterCMRgl, the individual rate constants (K1, k2 and k3) in the FDG compartmental modelingare potentially more sensitive indices for tracking the disease progression and/or treatmenteffects. Additional studies are under way for evaluating the use of the image-derived inputfunction for the estimation of these rate constants and will be reported separately.
Blood samples, especially arterial blood samples, have been considered the gold standardfor measuring the input function in dynamic FDG-PET studies. In addition to the invasivenature of this procedure, blood sampling has several other potential disadvantages. The bloodsamples are characterized by a time-lag between radiotracer delivery to the brain and thatto radial artery blood samples (see Guo et al (2007), however, for its insignificant effect),dispersion and non-avoidable measurement noise. Although an image-derived input may becontaminated by its own sources of error, such as the tissue-to-blood spillover and effects ofpartial volume, it is free of delay and dispersion artifacts, and presents a signal-to-noise ratiowhich is more comparable to that contaminating the tissue time activity curves. Because of thedifferent sources of error in the blood samples and image derived input curves; it is unrealisticto judge the quantification for 100% consistency. While arterial blood sampling was used asthe ‘gold standard’ by which to evaluate our image-derived input function, it is possible thatour non-invasive measurement provides a more accurate measurement.
Different from MAX-ICA (Su et al 2005) in which Imax-ica was treated as the unobservedtrue input function for the correction of the partial volume and the tissue-to-blood spillovereffects, VEN-ICA required the availability of the later three venous blood samples, making itis impossible to estimate CMRgl for retrospective PET studies which did not have the limitedvenous blood data. Our results obtained with the use of Imax-ica for our images reconstructedvia filtered back projection reflected the need for further investigations for its representationof the true and un-observed input function in terms of its magnitude (free of partial volumeeffects) and its relative lower signal-to-noise ratio for early short frames. Among various
7070 K Chen et al
possible causes, we believe the relatively low image resolution of our data prevented us fromusing this local maxima series in place of the few blood samples. It also reflected the need tosystematically examine the use of the local maxima time series for images reconstructed byiterative algorithms. In addition, we noted and illustrated that the use of only the correlationcoefficient without considering especially the variation of the regression slope from subjectto subject, an indication of the CMRgl bias variability over subjects, may be inconclusivein terms of the adequacy of ICA for the generation of the image-derived input function forCMRgl quantification.
In line with our suggested use of a few venous blood samples for the correction of thepartial volume effect in generating the image-derived input function via ICA (VEN-ICA),we also noted that CMRgl quantification actually requires the measurement of blood glucoselevels which is currently best obtained via blood sampling. The procedure and equipmentsetup for blood glucose sampling can easily be used for the additional few venous bloodsampling required by this approach, without added pain/discomfort to patients. This line ofthinking together with the results of our current study, the unpredictable CMRgl bias withthe use of Imax-ica, speaks in favor of the practice of generation of the image-derived inputfunction via VEN-ICA. However, the potential use of Imax-ica for data reconstructed by otheralgorithms, acquired from scanners with higher resolution, and with alternative settings, is yetto be addressed with additional studies.
Although the use of the ICA approach for the generation of the input function in dynamicPET studies was previously suggested for other applications, the current study demonstratesthe feasibility of using the commonly available ICA computer package FMRLAB for thequantification of FDG PET images (the version of the FMRLAB package slightly revised byus is available upon request). We also believe a separate spillover and partial volume correctionstep is necessary for accurate and reliable construction of the input function using ICA. Withsuch a need in mind, we have emphasized the role that ICA can play in objective and relativestraightforward identification of cerebrovascular and neighboring brain tissue ROI, making itpossible to quantify FDG PET images in an objective and efficient way.
As numerical procedures, we noted that both MAX-ICA and VEN-ICA are potentiallycapable of identifying other blood vessels and constructing image-derived input functionsubsequently, which need some additional but relative straightforward validations. Our interestin the (carotid) arteries is primarily to contrast our current more objective approach, validateddirectly with the arterial sampled input function, with our previously proposed subjectivecarotid artery definition. The identification of only carotid-artery was the primary reason forthe additional manually defined cubical ROI.
In summary, the ICA procedure in the widely available computer package FMRLABcan be used to accurately identify carotid-artery and neighboring brain-tissue ROIs, makingit possible to quantify dynamically FDG PET images in a reliable way. Its applications toother PET radiotracers (together with a practical way to correct for the blood metabolite whenneeded, e.g., Lopresti et al (2005)), for the quantification of PET measurements in otherhuman organs and in small animal PET studies (with least possible blood samples) remain tobe determined.
Acknowledgments
This study is supported by NIH grants AG024904, AG19610, MH157899, EB 2553301 andthe State of Arizona. X Chen is currently at Parametric Technology Cooperation, ArdenHills, MN, USA. The authors wish to thank Mihai Vintilescu, Wendy Lee, Alisa Domb,Oded Smilovici, Cole Reschke, Debbie Intorcia, Sandy Goodwin, Les Mullen, Pat Aguilar,

Characterization of the image-derived carotid artery input function using independent component analysis 7071
Vickie Lawrence, Hoai-Huong Tran and Barbara Knight for their support and assistance, andDr Guoliang Zeng for his encouragement.
References
Alexander G E, Chen K, Pietrini P, Rapoport S I and Reiman E M 2002 Longitudinal PET evaluation of cerebralmetabolic decline in dementia: a potential outcome measure in Alzheimer’s disease treatment studies Am. J.Psychiatry 159 738–45
Asselin M C, Cunningham V J, Amano S, Gunn R N and Nahmias C 2004 Parametrically defined cerebral bloodvessels as non-invasive blood input functions for brain PET studies Phys. Med. Biol. 49 1033–54
Chen K, Bandy D, Reiman E, Huang S C, Lawson M, Feng D, Yun L and Palant 1998 Non-invasive quantification ofthe cerebral metabolic rate for glucose using positron emission tomography, 18F-fluorodexyglucose, the Patlakmethod, and an image-derived input function J. Cereb. Blood Flow Metab. 238 716–23
Duann J R, Jung T P, Kuo W J, Yeh T C, Makeig S, Hsieh J C and Sejnowski T J 2002 Single-trial variability inevent-related BOLD signals Neuroimage 15 823–35
Guo H, Renaut R and Chen K 2007 An input function estimation method for FDG-PET human brain studies Nucl.Med. Biol. 34 483–92
Huang S C, Wu H M, Shoghi-Jadid K, Stout D B, Chatziioannou A, Schelbert H R and Barrio J R 2004 Investigationof a new input function validation approach for dynamic mouse microPET studies Mol. Imaging Biol. 6 34–46
Lee J S, Lee D S, Ahn J Y, Cheon G J, Kim S K, Yeo J S, Seo K, Park K S, Chung J K and Lee M C 2001 Blindseparation of cardiac components and extraction of input function from H(2)(15) O dynamic myocardial PETusing independent component analysis J. Nucl. Med. 42 938–43
Liptrot M, Adams K H, Martiny L, Pinborg L H, Lonsdale M N, Olsen N V, Holm S, Svarer C and Knudsen G M2004 Cluster analysis in kinetic modeling of the brain: a noninvasive alternative to arterial samplingNeuroimage 21 483–93
Litton J E 1997 Input function in PET brain studies using MR-defined arteries J. Comput. Assist. Tomogr. 21 907–9Lopresti B et al 2005 Simplified quantification of pittsburgh compound b amyloid imaging pet studies: a comparative
analysis J. Nucl. Med. 46 1959–72McKeown M J, Makeig S, Brown G G, Jung T P, Kindermann S S, Bell A J and Sejnowski T J 1998 Analysis of
fMRI data by blind separation into independent spatial components Hum. Brain Mapp. 6 160–88McKeown M J and Sejnowski T J 1998 Independent component analysis of fMRI data: examining the assumptions
Hum. Brain Mapp. 6 368–72Naganawa M, Kimura Y, Ishii K, Oda K, Ishiwata K and Matani A 2005 Extraction of a plasma time-activity curve from
dynamic brain PET images based on independent component analysis IEEE Trans. Biomed. Eng. 52 201–10Reiman E M, Caselli R J, Chen K, Alexander G E, Bandy D and Frost J 2001 Declining brain activity in cognitively
normal apolipoprotein E epsilon 4 heterozygotes: a foundation for using positron emission tomography toefficiently test treatments to prevent Alzheimer’s disease Proc. Natl Acad. Sci. USA 98 3334–9
Su K H, Wu L C, Liu R S, Wang S J and Chen J C 2005 Quantification method in [18F] fluorodeoxyglucose brainpositron emission tomography using independent component analysis Nucl. Med. Commun. 26 995–1004
Wahl L M, Asselin M C and Nahmias C 1999 Regions of interest in the venous sinuses as input functions forquantitative PET J. Nucl. Med. 40 1666–75
Wu H M, Hoh C K, Choi Y, Schelbert H R, Hawkins R A, Phelps M E and Huang S C 1995 Factor analysis forextraction of blood time-activity curves in dynamic FDG-PET studies J. Nucl. Med. 36 1714–22
Wu H M, Huang S C, Allada V, Wolfenden P J, Schelbert H R, Phelps M E and Hoh C K 1996 Derivation of inputfunction from FDG-PET studies in small hearts J. Nucl. Med. 37 1717–22