Characterization of the Centrifugal Mill by Lumped Kinetic Math Model and Discrete Element Model T....
32
Characterization of the Centrifugal Mill by Lumped Kinetic Math Model and Discrete Element Model T. Inoue and K. Okaya Department of Earth System Engineering, University of Tokyo
-
Upload
noel-gallagher -
Category
Documents
-
view
215 -
download
1
Transcript of Characterization of the Centrifugal Mill by Lumped Kinetic Math Model and Discrete Element Model T....
Characterization of the Centrifugal Mill
by Lumped Kinetic Math Model and Discrete Element Model
T. Inoue and K. Okaya
Department of Earth System Engineering,University of Tokyo

Centrifugal Mill
Eccentricity:
Acceleration Coefficient:
5.01.0/ DG
5.01.0 z

Force balance in centrifugal mill (Bradley et al.)

Theoretical Model (Bradley et al.)
sin)()/()1()24/(
sin)()2/)(2/(2/32/15.2
2/32/1
zgLDGDJJ
zgGHmP
m

Upper limit of phase angle (theoretical)
cos/sin
0 . 1 9 5 . 7 1 0 . 0 5 0
0 . 3 1 0 6 . 7 3 . 4 8 0
0 . 5 1 1 6 . 6 2 . 2 3 6
0 . 7 1 2 5 . 0 1 . 7 4 4
0 . 9 1 3 2 . 0 1 . 4 9 5
1 . 0 1 3 5 . 0 1 . 4 1 4

Mill Solver - A 2-D DEM Model -1

Mill Solver - A 2-D DEM Model -2

Mill Solver - A 2-D DEM Model -3

Effect of mill diameter (D) on mill power, determined by DEM simulation.
0.1
1
10
0.1 1
Mill diameter [m]
Ene
rgy
fact
or
[-]

Effect of ball density on mill power, determined by DEM simulation
0.1
1
1000 10000
Ball density [kg/ m3]
Ener
gy fac
tor
[-]

Effect of centrifugal coefficient (z) on mill power and energy consist,determined by DEM simulation -1
0.1
1
10
1 10 100
Centrifugal coefficient [-]
Ene
rgy
fact
or h
(z)
[-]
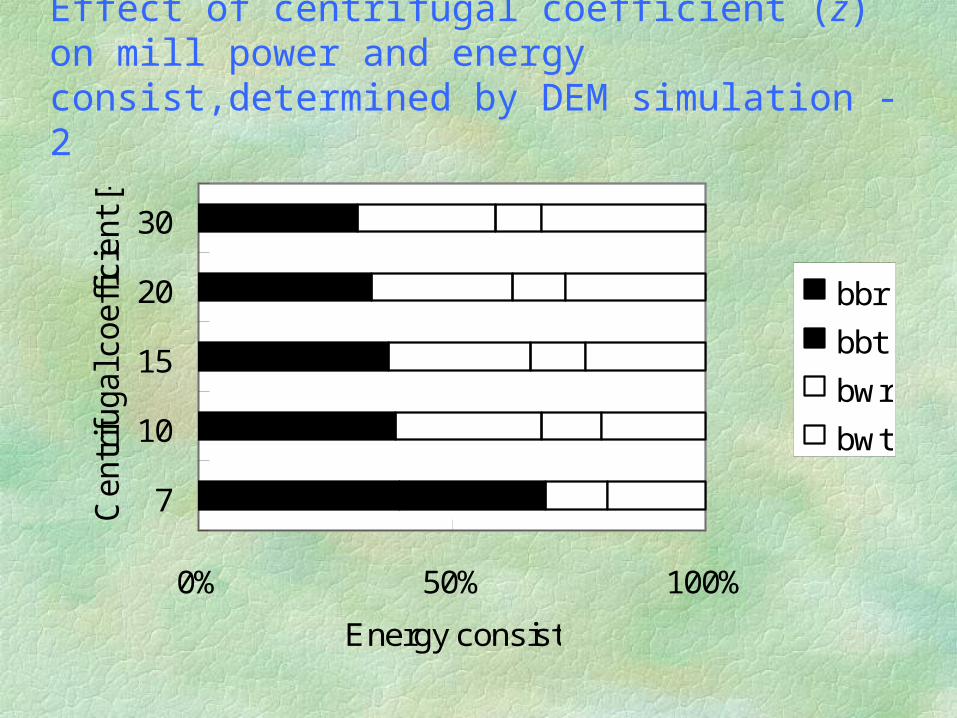
Effect of centrifugal coefficient (z) on mill power and energy consist,determined by DEM simulation -2
0% 50% 100%
7
10
15
20
30
Centr
ifugal c
oeffic
ient [-
]
Energy consist
bbr
bbt
bwr
bwt

Effect of eccentricity (G/D) on mill power, determined by DEM simulation
0.01
0.1
1
10
0.01 0.1 1
Eccentricity G/D [-]
Ene
rgy
fact
or
g(G
/D)
[-]

Effect of ball filling (J) on power draft, determined by DEM simulation
0
0.2
0.4
0.6
0.8
1
1.2
0 0.2 0.4 0.6 0.8 1Ball filling [- ]
Ener
gy fac
tor
f(J
) [-]

0% 20% 40% 60% 80% 100%
0.03
0.05
0.07
0.1
0.2
0.3
0.4
0.5Ec
cent
ricity
G/D
[-] bbr
bbtbwrbwt
Effect of eccentricity (G/D) on energy dissipation pattern
Energy Consist
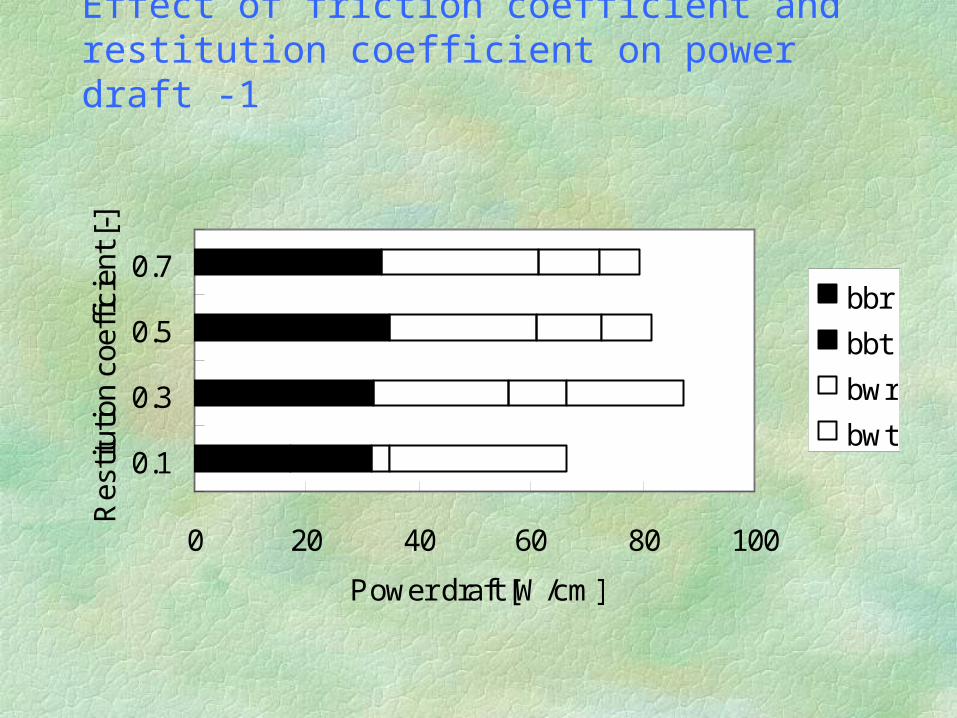
Effect of friction coefficient and restitution coefficient on power draft -1
0 20 40 60 80 100
0.1
0.3
0.5
0.7
Res
titut
ion
coef
ficie
nt [-
]
Power draft [W/cm]
bbr
bbt
bwr
bwt
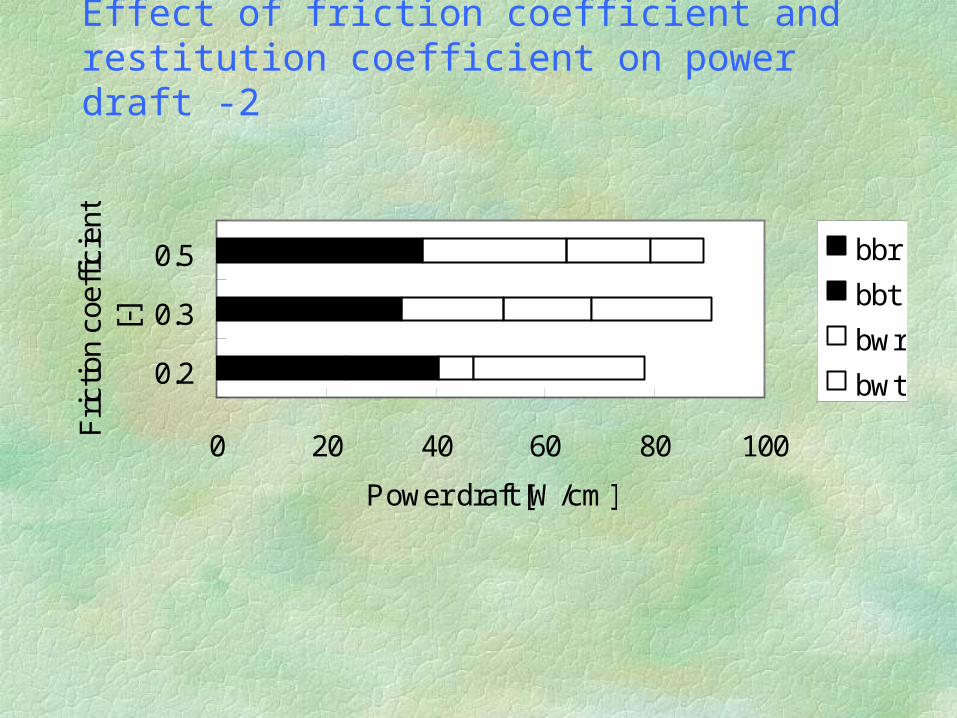
Effect of friction coefficient and restitution coefficient on power draft -2
0 20 40 60 80 100
0.2
0.3
0.5
Fric
tion
coef
ficie
nt[-
]
Power draft [W/cm]
bbr
bbt
bwr
bwt
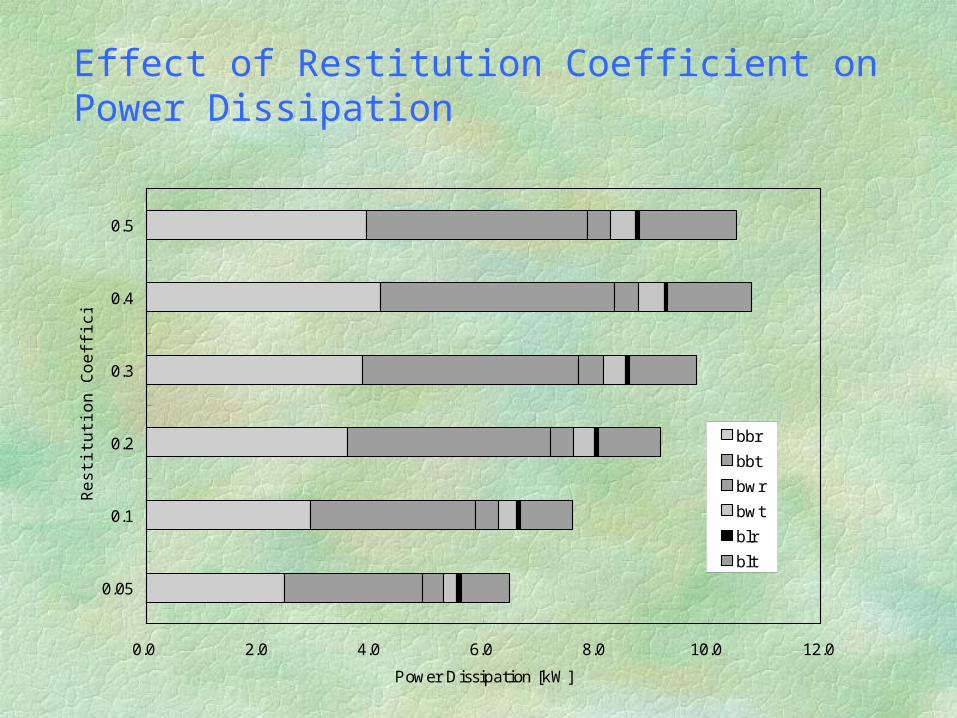
Effect of Restitution Coefficient on Power Dissipation
0.0 2.0 4.0 6.0 8.0 10.0 12.0
0.05
0.1
0.2
0.3
0.4
0.5
Rest
itu
tion
Coeffi
cien
t [-
]
Power Dissipation [kW]
bbr
bbt
bwr
bwt
blr
blt
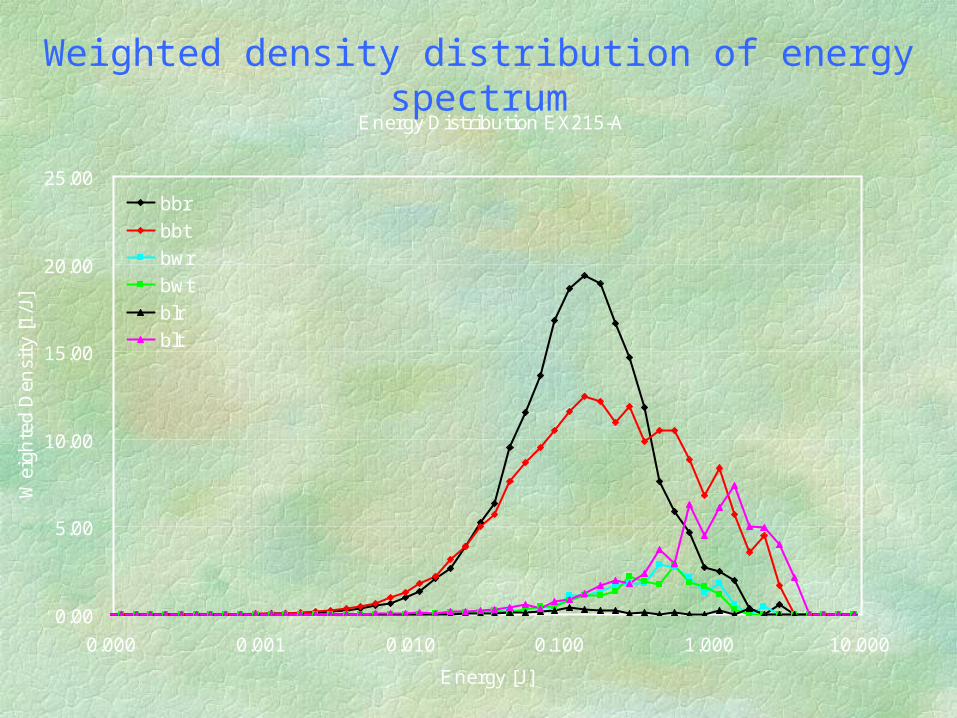
Energy Distribution EX215-A
0.00
5.00
10.00
15.00
20.00
25.00
0.000 0.001 0.010 0.100 1.000 10.000
Energy [J ]
Wei
ghte
d D
ensi
ty [1
/J]
bbrbbtbwrbwtblrblt
Weighted density distribution of energy spectrum

)()/()(08165.0 67.2 zhDGgJfLDP
sin)()/()1()24/(
sin)()2/)(2/(2/32/15.2
2/32/1
zgLDGDJJ
zgGHmP
m
Theoretical (Bradley et al.) :
DEM simulation (Inoue-Okaya) :

Specification of prototype X-Mill
Type Double cylinder self-balancing centrifugal mill
Mill Operation Batch or continuosDimension of 150 mm dia.Mill cylinders 300 mm lengthEccentricity (G/D) 0.2Grinding media 17 kg (for steel balls)Equipment size 762 (W) * 935 (H) *
1190 (L) mmMotor 7.5 kW

X-Mill
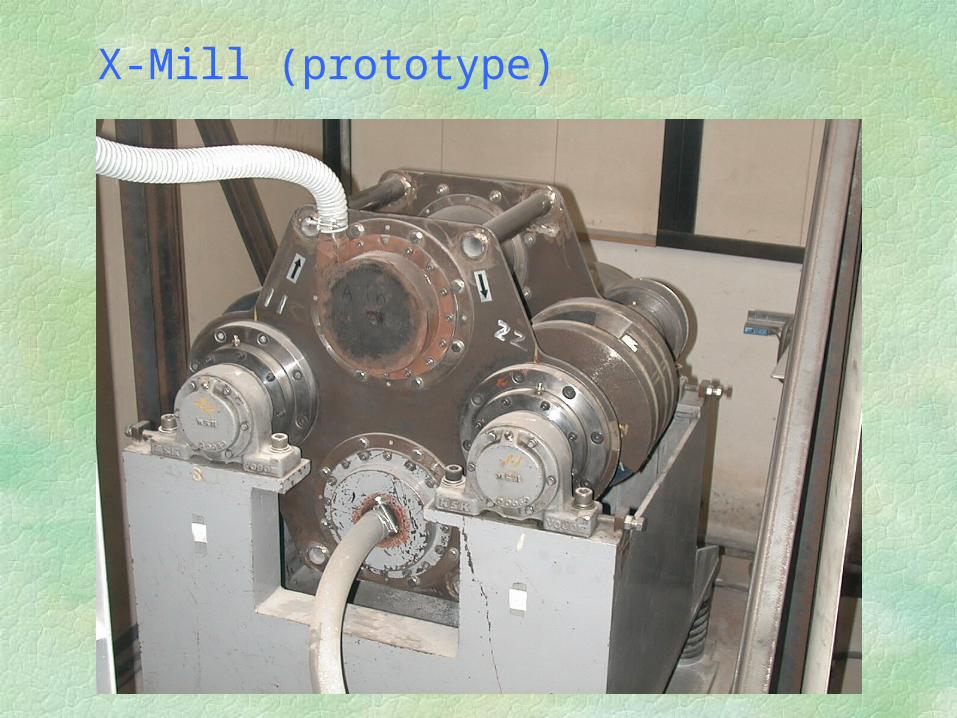
X-Mill (prototype)
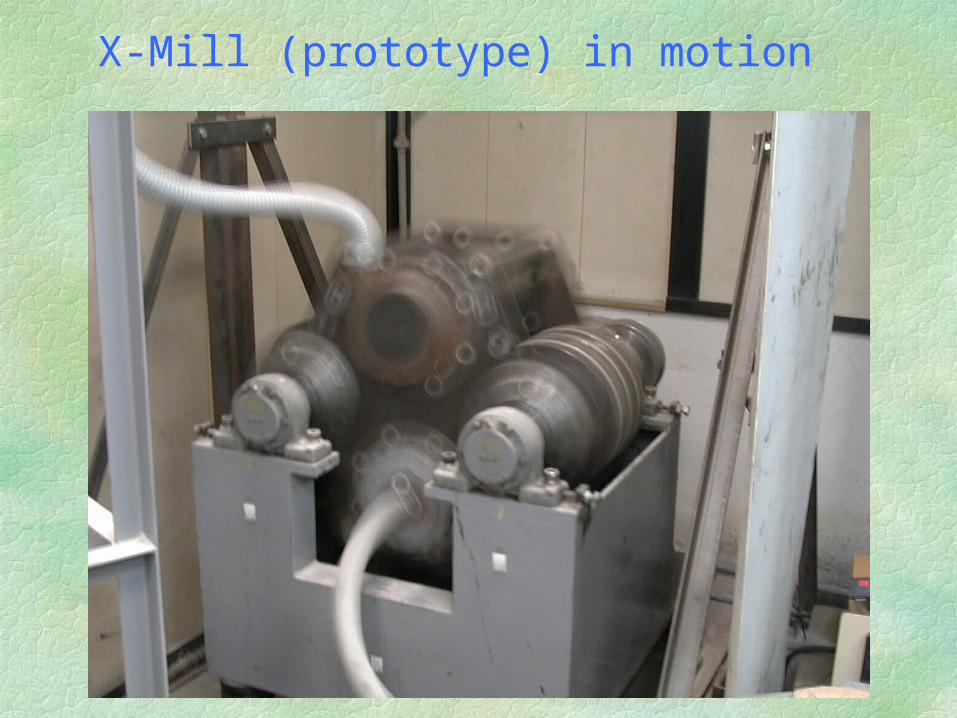
X-Mill (prototype) in motion
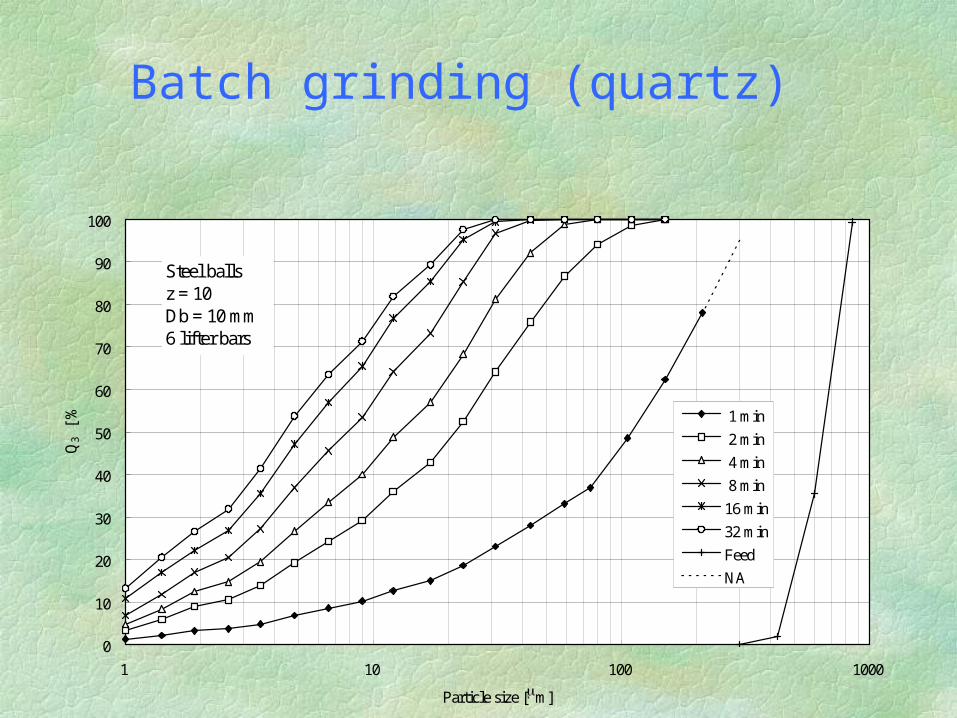
Batch grinding (quartz)
0
10
20
30
40
50
60
70
80
90
100
1 10 100 1000
Particle size [m]
Q3
[%] 1 min
2 min
4 min
8 min
16 min
32 min
Feed
NA
Steel ballsz = 10Db = 10 mm6 lifter bars

Continuous grinding (quartz)
0
10
20
30
40
50
60
70
80
90
100
1 10 100 1000 10000
Particle Size [m]
Q [
%] LDC-1
LDC-2LDC-3LDC-4LDC-5LDC-6LDC-7Feed

Autogenous grinding (limestone)
0
10
20
30
40
50
60
70
80
90
100
0.1 1 10 100 1000 10000 100000
Particle Size [m]
Q3
[%]
Coarse FeedFine FeedMixed FeedC1000 -150C1000 Total

Figure 2. Phase angle of the centrifugal mill estimated from math model.

Figure 3. Net power draft of the centrifugal mill estimated from math model
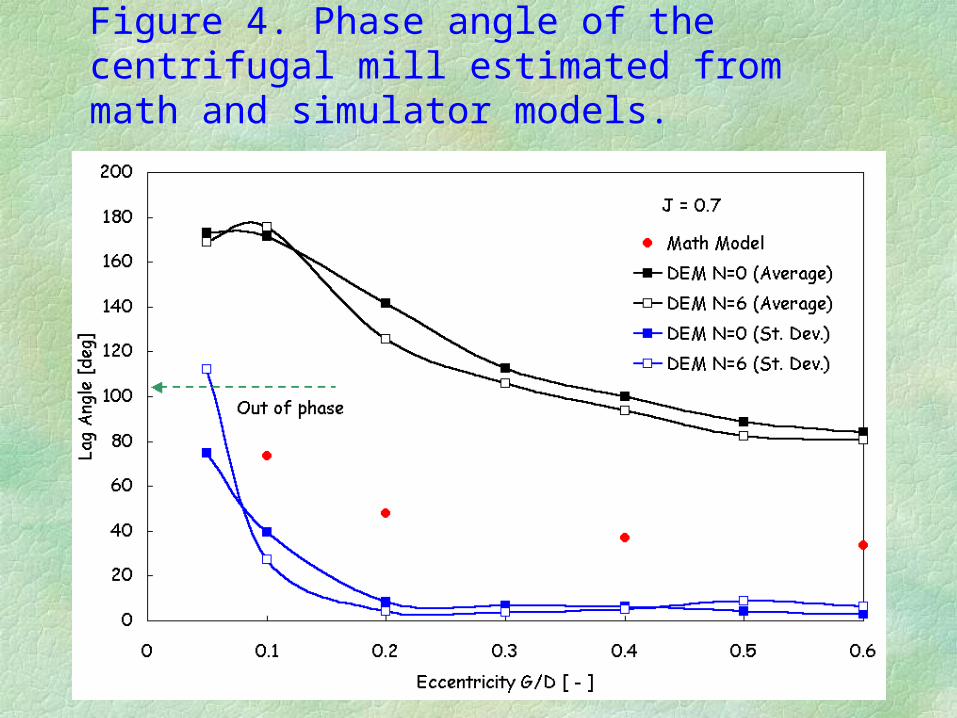
Figure 4. Phase angle of the centrifugal mill estimated from math and simulator models.

Figure5. Net power draft of the centrifugal mill estimated from math and simulator models.

Conclusion
§Theoretical model can present
approximate
but clear view of the equipment property
in the form of a simple equation§DEM simulation can present a more
realistic
vision of the equipment and its
performance§DEM simulation can present the property
of the possible mill design under less
restriction and less expenses§DEM simulation gives a microscopic view
of
the comminution events together with
their integral effects in realistic figures