Chapter 15 Oscillatory Motion EXAMPLES. Chapter 15 Oscillatory Motion: EXAMPLES.
Upload
metehan-agacaCategory
view
213download
1description
K.E. Herold, W.E. Bentley, and J. Vossoughi (Eds.): SBEC 2010, IFMBE Proceedings 32, pp. 380–384, 2010. www.springerlink.com
Characterization of Material Properties of Aorta from Oscillatory Pressure Tests
V.V. Romanov, K. Darvish, and S. Assari
Biomechanics Laboratory, Temple University, Philadelphia, USA
Abstract— Traumatic Aorta Rupture (TAR), also known as Traumatic Rupture of Thoracic Aorta (TRA), is one of the major causes of fatalities in motor vehicle accidents. This issue has been studied in the past; however, the results of the sug-gested mechanisms are speculative and inconclusive. One cause for these speculations is an incomplete understanding of the material properties of aorta. Therefore, the goal of this experiment was to characterize the dynamic structural re-sponse of the aorta to a biaxial loading. Seven samples were subjected to a pressure oscillation input ranging from 7kPa to 76kPA at a frequency ranging from .5Hz to 5Hz. The results were presented in the form of pressure versus volumetric strain which showed an increase in both phase and magnitude of the linear modulus. Initial modeling was completed utilizing hyperelastic constitutive equations. The results of this study will be used to determine a viscoelastic constitutive model and a finite element model for the aorta material.
Keywords— traumatic aorta rupture, dynamic aorta test,
material properties of aorta, viscoelasticity, hyperelasticity.
I. INTRODUCTION
Traumatic Aorta Rupture (TAR), also known as Trau-matic Rupture of Thoracic Aorta (TRA), is a major cause of deaths in motor vehicle collisions. According recent studies, TAR was diagnosed in 12% to 29% of autopsied fatally injured occupants. [1] Furthermore, when people experience such trauma, only 9% (7500-8000 victims in US and Cana-da) survive from the scene of the accident and the overall mortality rate is 98%. [2] In 94% of the cases, the shearing forces of high speed impacts have been associated with transverse tears at the peri-isthmic region which is subjected to the greatest strain. [3]
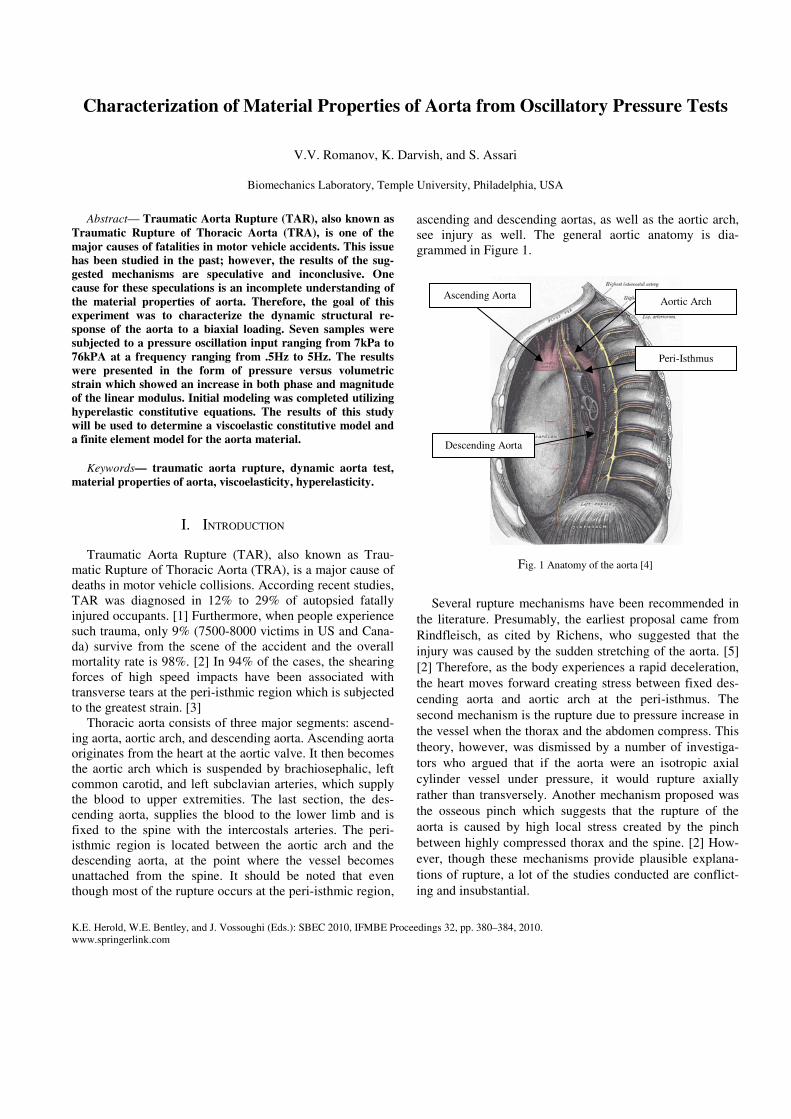
Thoracic aorta consists of three major segments: ascend-ing aorta, aortic arch, and descending aorta. Ascending aorta originates from the heart at the aortic valve. It then becomes the aortic arch which is suspended by brachiosephalic, left common carotid, and left subclavian arteries, which supply the blood to upper extremities. The last section, the des-cending aorta, supplies the blood to the lower limb and is fixed to the spine with the intercostals arteries. The peri-isthmic region is located between the aortic arch and the descending aorta, at the point where the vessel becomes unattached from the spine. It should be noted that even though most of the rupture occurs at the peri-isthmic region,
ascending and descending aortas, as well as the aortic arch, see injury as well. The general aortic anatomy is dia-grammed in Figure 1.
Fig. 1 Anatomy of the aorta [4]
Several rupture mechanisms have been recommended in
the literature. Presumably, the earliest proposal came from Rindfleisch, as cited by Richens, who suggested that the injury was caused by the sudden stretching of the aorta. [5] [2] Therefore, as the body experiences a rapid deceleration, the heart moves forward creating stress between fixed des-cending aorta and aortic arch at the peri-isthmus. The second mechanism is the rupture due to pressure increase in the vessel when the thorax and the abdomen compress. This theory, however, was dismissed by a number of investiga-tors who argued that if the aorta were an isotropic axial cylinder vessel under pressure, it would rupture axially rather than transversely. Another mechanism proposed was the osseous pinch which suggests that the rupture of the aorta is caused by high local stress created by the pinch between highly compressed thorax and the spine. [2] How-ever, though these mechanisms provide plausible explana-tions of rupture, a lot of the studies conducted are conflict-ing and insubstantial.
Ascending Aorta
Descending Aorta
Aortic Arch
Peri-Isthmus

Characterization of Material Properties of Aorta fr
This study is one of the series with a comto determine the most feasible cause of aortspecific aim of this research is to understanmaterial properties of the aorta through the ption tests. A noncontact experiment was deveunderstand the structural properties of the aoing it intact.
II. MATERIALS AND METHOD
A. Experimental Procedure
For the experiments, seven samples frompigs were acquired from the local slaughter aorta was chosen because it has been widely in the cardiovascular related research as a human aorta due to their similarities. [6] Fuman samples would have been difficult towould have been highly unlikely that the have been healthy.
To have all of the samples tested under ttions, aortas were ordered attached to the hceived from the slaughter house, the samplesaline solution at 5 ºC until the beginning of Though out the test, the aorta was kept hydrasolution but at the room temperature (25 °C).
Preparation work for each sample went thfollowing procedure. The descending aorta wafrom the aortic valve. The excessive fatty tissufrom the aorta. Careful attention had to be pprocedure in order to avoid cutting off the intat the base. Once the tissue was removed, intwere tied off at the base to prevent pressure lo
To keep track of the geometrical chanmeasurement sensors (Sonometrics Corp., Ca40-NB) were utilized. Each of the sensors sives a pulse every 31ns to 2ms. Based on the in the medium and the time of travel, Sonomdetermined the distance between the two saccuracy of 30µm. Six sensors were suture tia, the outside layer of the aorta.
The sensors were attached in pairs, on eiaorta. First pair of sensors was placed at 31medge. Second and third pair of sensors was 22mm and 30mm, respectively, from the pThis position of the sensors allowed trackintransverse changes of the vessel. This pocalculating volumetric strain, one of the parathe study. It is defined as the ratio of the chato the initial volume of the aorta.
It should be noted that volumetric strainproperty rather than material property of the suitable for the purpose of this study.
rom Oscillatory Pressure Tests
IFMBE Proceedings Vol. 32
mmon final goal tic rupture. The nd the dynamic pressure oscilla-eloped to better
orta while keep-
DS
m 6 month-old house. Porcine used in the past substitute for a urthermore, hu-o obtain and it samples would
the same condi-heart. Once re-es were kept in the experiment.
ated in the same
hrough the same as cut at 152mm ue was removed paid during this tercostal arteries tercostal arteries ss.
nges, ultrasonic anada, 2R-34C-sends and rece-speed of sound
metrics software sensors with an
to the adventi-
ther side of the mm from the cut
then sutured at preceding pair.
ng the axial and osition allowed ameters used in ange of volume
n is a structural aorta but is still
Fig. 2 Sensor Position
To determine the pressure insid
pressure sensors (FISO TechnologMIV) were used. With a pressure asensors are designed around Fabry-use fiber optic cables to send the placed at both ends of the vesselphotograph of the sensor position.
Fig. 3 Sensor Po
Aorta was then attached to two
sealed, while the other had a connsupply tank. Next, aorta was placed
Displacement Senso
Pressure Sensors
381
Diagram
de the vessel fiber optic gies Inc., Canada, FOP-accuracy of 0.1kPa, these -Perot interferometer and
signal. One sensor was . Figure 3 below is the
osition
tubes, one of which was nection available for the d inside the display case
ors
Descending Aorta

382
and coupled to the supply tank. Saline was pthe system, and then poured into the displaying the aorta. Figure 4 gives an example of thset up.
The pressure was supplied through the air(Control Air Inc, USA, 550X). The regulator0 psig to 30 psig (0kPA to 206.8kPa) which ponded to a current input 0mA to 20mAaccuracy of the regulator was 2.07kPa. Thapplied in the form of a sinusoidal wave w7kPa to 76kPa and a frequency range of .5Hspecific pressure range was chosen to finproperties that account for the maximum sfailure pressures.
LabView program was used to control thand to record pressure output from the prSonometrics software was used to record thchange of the vessel. To insure that the twoorded at the same time, a trigger was used tothe programs. The entire experiment was using a high speed camera capable record(Vision Research, USA). The movie clips wetrack of the experiment.
Fig. 4 Experimental Set Up
B. Hyperelasticity
Biological tissues have complex structureble of undergoing large deformations. Fustress-strain relationship of the tissue is in near. If the slope, or Young’s Modulus, ofcurve is to be calculated one would see that ing the modulus is lower than at high loading
Another characteristic of the biological tisteresis that would occur between the loading
V.V. Romanov
IFMBE Proceedings Vol. 32
purged through y case submerg-he experimental
r regulator from r had a range of linearly corres-
A. Repeatability he pressure was with a range of
Hz to 5Hz. This nd the material ystolic and the
he current input ressure sensors. he deformation
o programs rec-o active both of
also recorded ding at 2200fps ere used to keep
es and are capa-urthermore, the
general nonli-f a stress-strain with low load-
g. [7] ssue is the hys-
g and unloading
paths. This hysteresis represents thand it is almost independent of the decades of the strain rate variation.
This independency of the tissueserve as the basis for the simplificahavior for the initial modeling procstrain relationship is truly indepenthen the material can be treated aknown as hyperelastic or pseudoelas
One of the more accepted waystrain relationship of a hyperelastic exponential form of the strain energing. [8]
2 exp 2
The constants C (with units of stressionless) are the material constantscorresponding to a pair of stresses the offset of the dynamic oscillation
The strains are calculated as defin
12 1 ;
where , are the stretch ratios ocircumferential and axial directions.
For this research, the radial stresligible comparing to the stresses inrential directions. [8, 9] Thereforeconsidered as a two-dimensional , , which are defined as follow
Stresses , can be found using tthe displacement sensors and utilizing
III. RESULTS AND D
A. Initial Result Analysis
As shown in Figure 5, where thfrequencies are shown, a hysteresis pressure-volumetric strain graphs. Tthe graph is proportional to the energtive of the internal friction (dampin
v, K. Darvish, and S. Assari
he energy loss per cycle strain rate within several [7] e to the strain rate, can ation of the material be-
cess. That is if the stress-ndent of the strain rate, as nonlinear elastic, also stic. [7] s to describe the stress- material is to utilize the
gy function as the follow-
(1)
ss) and , , (dimen-s. , are the strains , chosen to the be ns. ned by Green: 12 1 (2)
of the blood vessel in the . s can be considered neg-
n the axial and circumfe-e, the arterial wall was body subjected only to ws
(3)
(4)
the deformation data from g Lame’s theory. [10]
DISCUSSION
he results for two sample behavior was seen in the
The change of area inside gy loss and is representa-
ng effect) of the material.

Characterization of Material Properties of Aorta from Oscillatory Pressure Tests 383
IFMBE Proceedings Vol. 32
The material also exhibits frequency dependency, as can be seen by the change of slope in the graph from low to high frequency. These are the characteristics of the viscoelastic material. [11]
Fig. 5 Volumertic Strain versus Pressure
The change in average strain that can be seen from the .5
Hz frequency to the 5 Hz can be attributed to the relaxation of the material. [11] Preconditioning procedure for the test only included preconditioning the material once before the entire experiment. However, it is possible that the time spent between changing frequencies was sufficient for the material to re-set back to its original state and required pre-conditioning once again. For future experiments, precondi-tioning protocol will be changed.
To study the frequency dependency of the material prop-erties, Fast Fourier Transform (FFT) was used in LabView to extract the fundamental amplitude and phase for both pressure and volumetric strain. A linear modulus has been defined as the ratio of the pressure amplitude to the ampli-tude of volumetric strain at each frequency. The results showed an increase in linear modulus and phase shift as the frequency increased (Figures 6 and 7). This stiffening beha-vior confirmed the viscoelastic assumption.
The results of this study will be used to optimize and va-lidate a finite element model that is being developed in parallel to this research.
Fig. 6 Linear Modulus versus Frequency
Fig. 7 Phase Shift versus Frequency
B. Hyperelastic Modeling
The hyperelastic constitutive model was successful in modeling stress in both axial and circumferential directions at low frequencies, where the phase shifts between the stress and the strain were small. (Figure 7 and 8) The constants used for a sample hyperelastic model shown below are listed in Table 1.
Table 1 Constants of sample hyperelastic model
Frequency C
.5 1.87E+01 5.7284 2.14E-05 4.8635
As mentioned above, however, with higher strain rate
phase shift increases, a condition that could not be predicted with the hyperelastic model alone. For future work, a quasi-linear viscoelastic constitutive model will be utilized to model aorta to account for the phase shift in addition to the nonlinear elastic response.
0
10
20
30
40
50
60
70
80
1.5 1.7 1.9 2.1 2.3 2.5 2.7
Pres
sure
(kP
a)
Volumetric Strain
0.5 Hz 4 Hz
10
15
20
25
30
35
40
0.1 1 10
Lin
ear
Mod
ulus
Frequency (Hz)
Linear Modulus
0
5
10
15
20
25
30
35
0.00 1.00 2.00 3.00 4.00 5.00 6.00
Phas
e Sh
ift (
deg)
Frequency (Hz)
Phase Shift

384 V.V. Romanov, K. Darvish, and S. Assari
IFMBE Proceedings Vol. 32
Fig. 8 Circumferential Stress
Fig. 9 Axial Stress
ACKNOWLEDGEMENT
The support for this study was provided by the NHLBI under Grant Numbers K25HL08651201A2 and Temple University College of Engineering.
REFERENCES
1. Bertrand S, Cuny S, Petit P, Trosseille X, Page Y, Guillemot H, Dra-zetic P. (2008), Traumatic Rupture of Thoracic Aorta in Real-World Motor Vehicle Crashes. Traffic Injury, Vol. 9, pp. 153-161.
2. Richens D, Field M, Neale M, Oakley N (2002), The Mechanism of Injury in Blunt Traumatic Rupture of the Aorta. European Journal of Cardio-Thoracic Surgery, pp. 288-293.
3. Katyal, D., McLellan, B., Brenneman, F., Boulanger, Bernard R. Sharkey, P., Waddell, J., (1997) Lateral Impact Motor Vehicle Collision: Significant Cause of Blunt Traumatic Rupture of the Thoracic Aorta. The Journal of Trauma; Injury, Infection, and Critical Care, Vol. 42, pp. 769-772.
4. “The Descending Aorta”, Yahoo! Education,Yahoo! Inc, n.d., Web, 23 April, 2010
5. Rindfleisch, E. (1893), Zur Entstehung und Heilung des Aneurysma Dissecans Aortae. Virschows Arch Pathol Anat, Vol. 131, pp. 374-378.
6. Crick S., Sheppard M., Ho S., Genstein L., Anderson R., (1998), Anatomy of the Pig Heart: Comparison with Normal Human Cardiac Structure. Journal of Anatomy, Vol. 193, pp. 105-119.
7. Fung, Yuan-Cheng., (1975) On Mathematical Models of Stress-Strain Relationships for Living Soft Tissues. Riga : Plenum Publishing Corporation, UDC 611.08:539.4.
8. Fung, Y.C., Fronek, K., Patitucci P., (1979) Pseudoelasticity of Arteries and the Choice of its Mathematical Expression. American Journal of Physiology, 1979, Vol. 237.
9. Bass, C.R., Darvish K, Bush B, Crandall JR, Srinivasan SC, Tribble C, Fiser S, Tourret L, Evans JC, Patrie J, Wang C. (2001) Material Properties for Modeling Traumatic Aortic Rupture.: Stapp Car Crash Journal. Vol. 45.
10. Singh D.K., (2008) Strength of Materials, Boca Raton: CRC Press, ISBN-10: 1 42006 916 0
11. Fung, Yuan-Cheng., (1993) Biomechanics, Mechanical Properties of Living Tissue. New York: Sringer-Verlag New York, ISBN 0-387-97947-6
Author: Kurosh Darvish Institute: Temple University Street: 1947 North 12th Street City: Philadelphia Country: USA Email: [email protected]
0
50
100
150
200
250
0 2 4 6 8
Stre
ss (
kPa)
Time (sec)
Sth 1 Sth 1 (model)
R2=0.910619
0
20
40
60
80
100
120
140
160
0 2 4 6 8
Stre
ss (
kPa)
Time (sec)
Sz 1 Sz 1 (model)
R2=0.915655