Characterization of Hypervelocity Impact Debris from … · hypervelocity impact tests in order to...
18
Characterization of Hypervelocity Impact Debris from the DebriSat Tests Paul M. Adams, Patti M. Sheaffer, Zachary Lingley and Gouri Radhakrishnan The Aerospace Corporation, 2310 East El Segundo Blvd., El Segundo, CA 90245 ABSTRACT The DebriSat program consisted of 3 hypervelocity impact tests conducted in 2 Torr of air with 7 km/s, 600 g aluminum projectiles. In the first test, Pre Preshot, the target consisted of multiple layers of fiberglass, stainless steel and Kevlar fabric. No soft catch foam was used. The subsequent two tests, DebrisLV and DebriSat, were designed to simulate hypervelocity impacts with a launch vehicle upper stage and a modern LEO satellite, respectively. The interior of the chamber was lined with soft catch foam to trap break-up fragments. In all three tests, witness plates were placed near the target to sample impact debris and determine its reflectance, composition and spectral properties. Reflectance measurements are important for calculating the size of orbital hypervelocity impact fragments. The debris from the Pre Preshot test consisted of a two-phase mixture formed from solidified molten silicate and steel droplets. Individual droplets ranged from 100 μm to 10 nm. The reflectance of witness plates dropped from 95% to 20-30% as a result of the debris. Debris collected on witness plates in the DebrisLV and DebriSat tests consisted of μm to nm-sized solidified molten metallic droplets in a matrix of condensed vaporized soft catch. Disordered graphitic carbon was also detected. The reflectance of debris-covered witness plates dropped from 95% to 5%. The dramatic decrease in reflectance for hypervelocity impact debris is attributed to the effect of scattering from μm to nm sized solidified molten metallic droplets and the presence of graphitic carbon, when organics are present. The presence of soft catch in the later tests and the high organic content with graphitic carbon in the debris appear to be responsible for this much lower post-test reflectance. Understanding orbital debris reflectance is critical for estimating size and determining debris detectability. 1. INTRODUCTION The size of debris tracked by the U. S. Space Surveillance Network is determined by radar cross section (RCS). However, the lower size limits of objects that can be tracked and their size inferred by RCS are on the order of 10 cm for LEO and 1 m in GEO [1]. The primary causes of orbital debris breakups are explosions and impacts. In order to obtain data on the physical properties of impact generated fragments smaller than 10 cm a series of laboratory- based impact experiments were conducted by NASA and the Department of Defense (DoD) in the early 1990s. The Satellite Orbital-Debris Characterization Impact Test 4 (SOCIT-4) [2-5] involved a Navy Transit satellite bus and produced the dataset that was used to develop the current NASA/DoD satellite breakup models [6]. In 2007 China successfully tested an antisatellite weapon on the FY-1C weather satellite and in 2009 there was a collision between the Iridium 33 and Cosmos 2251 satellites. The current NASA breakup model was relatively successful in predicting the impact debris fragments of Cosmos 2251, which was an older satellite. It was significantly less effective in describing the impact fragment distributions of FY-1C and Iridium 33, which are of much more recent construction using materials not used in Transit or Cosmos 2251 [1]. As a result, the DebriSat tests were conducted to better understand the distribution of fragments generated from a hypervelocity impact with a modern satellite constructed from current materials [1]. The DebriSat series of tests (Pre Preshot, DebrisLV, and DebriSat) were a NASA program with support/collaboration from the Air Force Space and Missile Systems Center, University of Florida and the Aerospace Corporation. Tests were conducted in 2014 in nominally 2 Torr of air at the Arnold Engineering Development Complex (AEDC) Range G Two-Stage Light Gas Gun Facility which utilizes a 3 m diameter vacuum chamber [7, 8]. All three tests used a 580 gram, 8.6 cm diameter x 10.3 cm long, hollow aluminum cylinder with a Nylon sleeve as the projectile with a nominal velocity of 6.8 km/sec. [7]. For the DebrisLV and DebriSat tests the chamber was lined with specially redesigned “soft catch” foam panels which were used to trap the impact fragments for size distribution analysis [9]. Copyright © 2017 Advanced Maui Optical and Space Surveillance Technologies Conference (AMOS) – www.amostech.com
Transcript of Characterization of Hypervelocity Impact Debris from … · hypervelocity impact tests in order to...

Characterization of Hypervelocity Impact Debris from the DebriSat Tests
Paul M. Adams, Patti M. Sheaffer, Zachary Lingley and Gouri Radhakrishnan
The Aerospace Corporation, 2310 East El Segundo Blvd., El Segundo, CA 90245
ABSTRACT
The DebriSat program consisted of 3 hypervelocity impact tests conducted in 2 Torr of air with 7 km/s, 600
g aluminum projectiles. In the first test, Pre Preshot, the target consisted of multiple layers of fiberglass, stainless
steel and Kevlar fabric. No soft catch foam was used. The subsequent two tests, DebrisLV and DebriSat, were
designed to simulate hypervelocity impacts with a launch vehicle upper stage and a modern LEO satellite, respectively.
The interior of the chamber was lined with soft catch foam to trap break-up fragments. In all three tests, witness plates
were placed near the target to sample impact debris and determine its reflectance, composition and spectral properties.
Reflectance measurements are important for calculating the size of orbital hypervelocity impact fragments.
The debris from the Pre Preshot test consisted of a two-phase mixture formed from solidified molten silicate
and steel droplets. Individual droplets ranged from 100 μm to 10 nm. The reflectance of witness plates dropped from
95% to 20-30% as a result of the debris. Debris collected on witness plates in the DebrisLV and DebriSat tests
consisted of μm to nm-sized solidified molten metallic droplets in a matrix of condensed vaporized soft catch.
Disordered graphitic carbon was also detected. The reflectance of debris-covered witness plates dropped from 95%
to 5%. The dramatic decrease in reflectance for hypervelocity impact debris is attributed to the effect of scattering
from μm to nm sized solidified molten metallic droplets and the presence of graphitic carbon, when organics are
present. The presence of soft catch in the later tests and the high organic content with graphitic carbon in the debris
appear to be responsible for this much lower post-test reflectance. Understanding orbital debris reflectance is critical
for estimating size and determining debris detectability.
1. INTRODUCTION
The size of debris tracked by the U. S. Space Surveillance Network is determined by radar cross section
(RCS). However, the lower size limits of objects that can be tracked and their size inferred by RCS are on the order
of 10 cm for LEO and 1 m in GEO [1]. The primary causes of orbital debris breakups are explosions and impacts. In
order to obtain data on the physical properties of impact generated fragments smaller than 10 cm a series of laboratory-
based impact experiments were conducted by NASA and the Department of Defense (DoD) in the early 1990s. The
Satellite Orbital-Debris Characterization Impact Test 4 (SOCIT-4) [2-5] involved a Navy Transit satellite bus and
produced the dataset that was used to develop the current NASA/DoD satellite breakup models [6]. In 2007 China
successfully tested an antisatellite weapon on the FY-1C weather satellite and in 2009 there was a collision between
the Iridium 33 and Cosmos 2251 satellites. The current NASA breakup model was relatively successful in predicting
the impact debris fragments of Cosmos 2251, which was an older satellite. It was significantly less effective in
describing the impact fragment distributions of FY-1C and Iridium 33, which are of much more recent construction
using materials not used in Transit or Cosmos 2251 [1]. As a result, the DebriSat tests were conducted to better
understand the distribution of fragments generated from a hypervelocity impact with a modern satellite constructed
from current materials [1].
The DebriSat series of tests (Pre Preshot, DebrisLV, and DebriSat) were a NASA program with
support/collaboration from the Air Force Space and Missile Systems Center, University of Florida and the Aerospace
Corporation. Tests were conducted in 2014 in nominally 2 Torr of air at the Arnold Engineering Development
Complex (AEDC) Range G Two-Stage Light Gas Gun Facility which utilizes a 3 m diameter vacuum chamber [7, 8].
All three tests used a 580 gram, 8.6 cm diameter x 10.3 cm long, hollow aluminum cylinder with a Nylon sleeve as
the projectile with a nominal velocity of 6.8 km/sec. [7]. For the DebrisLV and DebriSat tests the chamber was lined
with specially redesigned “soft catch” foam panels which were used to trap the impact fragments for size distribution
analysis [9].
Copyright © 2017 Advanced Maui Optical and Space Surveillance Technologies Conference (AMOS) – www.amostech.com

A combination of radar and optical telescope photometry data has been used to determine the trackable
orbital debris population. From extremely short arc optical observations of an object an angular velocity can be
obtained. Assuming a circular orbit the range can be calculated, which combined with the apparent brightness and
solar phase function the object size can be calculated, if an albedo is assumed [10]. Conversely if the object size can
be determined from its RCS the albedo can be calculated. Assumptions about an object’s shape and composition
can affect RCS estimates and albedo variations within a population can introduce large random errors in albedo
calculations. To compensate for these errors a large number of observations are made in order to obtain a
statistically significant sampling from which a more accurate estimate of an average albedo can be obtained. A wide
range of albedos have been published [10-17] (Table 1) for a variety of orbital debris, some of which are
contradictory and counterintuitive. As a result of some of these studies it has been concluded that “more research is
required” into determining a global albedo value [10] which ultimately determines the lower size limit of an object
that can be determined from its RCS.
There is limited laboratory evidence that impact debris have a thin coating of soot from the breakdown of
plastics in circuit boards [11]. While there has been documentation of the size distribution of fragments generated
in the SOCIT-4 test there has been little to no description of the appearance of fragments [2-4]. The only mention
was that soot consisting of particles < 50 µm was present [3]. Early measurements of the average albedo of satellite
debris range from 0.042-0.196 for various fragmentation scenarios with a value of 0.065 for hypervelocity impacts
(Table 1) [11]. It has also been suggested that the albedo of orbital debris may be used to determine the method of
breakup (explosion vs. impact) [11]. To address these issues we fielded witness plates in all three DebriSat
hypervelocity impact tests in order to collect microscopic debris coatings and to determine their physical
characteristics (particle size distribution, chemistry and optical properties). This will help us better understand how
these coatings form and let us obtain direct albedo measurements from hypervelocity impact debris for comparison
with reported global values derived from radar cross section and apparent brightness..
Table 1. Summary of Orbital Debris Albedo Estimates
Albedo Object(s) Cause Comments
Ref. [11] 0.196
0.103
0.087
0.065
0.042
Ariane 3rd stage
Landsat 1
Cosmos 1275
Solwind
Landsat 3
Unknown
Propellant explosion
Unknown
Hypervelocity impact
Propellant explosion
Ref. [12] 0.08 Global mean Global/undetermined
Ref. [13] 0.01-0.18 13 satellites Undetermined IR photometry
Ref. [14] 0.09 (median)
0.24 (median)
7 breakups
Spot1/Viking
Mixed
Undetermined
Ref. [16] 0.13 Fragmentation only Fragmentation only global
Ref. [17] 0.175 (0.185) Fragmentation only Fragmentation only Global, reprocessed 2007 data
Ref. [10] 0.145/0.209/0.275
0.095/ 0.142
Fragmentation only
Non-fragmentation
Fragmentation only
Non-fragmentation
Mean / Average/ Bias corrected
Mean, Average,
2. LABORATORY EXPERIMENTAL
For the DebrisLV and DebriSat tests approximately twenty four 1 cm diameter aluminum pin-mount scanning
electron microscope (SEM) stubs were inserted into the surface of the soft catch prior to the test. Those in the DebriSat
tests had a sheet of tantalum on the surface to help distinguish Al from the target/projectile from the SEM stub. The
stubs were arranged both up-range and down-range of the targets at four azimuthal locations. Post-test selected stubs
were examined in a JEOL 7600F field emission SEM equipped with an Oxford X-Max SDD energy dispersive
spectrometer (EDS). Specimens were prepared for transmission electron microscopy (TEM) by wiping the surface of
witness plates with ultra-carbon coated lacey-carbon TEM grids. They were examined in a JEOL model 3100
TEM/STEM equipped with an Oxford INCA x-sight EDS. TEM imaging was performed at 300 kV in bright field
phase contrast mode. Raman spectroscopy of impact deposits was performed with a Renishaw inVia spectrometer
using a 514 nm Ar-ion laser. Fourier transform infrared (FTIR) spectroscopy (2.5-25 μm) was performed with a
Copyright © 2017 Advanced Maui Optical and Space Surveillance Technologies Conference (AMOS) – www.amostech.com

Thermo Nicolet model 6700 spectrometer equipped with DTGS and MCT-A detectors. Qualitative biconical and
quantitative hemispherical diffuse reflectance measurements were made with a Harrick Scientific Praying Mantis
accessory and a Labsphere 3” diameter Au integrating sphere, respectively. Labsphere Infragold was used as the
background reference for both reflectance measurements. An Agilent Technologies model 4100 Exoscan portable
FTIR was used to obtain in situ diffuse reflectance spectra from the surfaces of various materials used to construct
DebrisLV and DebriSat prior to, and immediately after the tests [18].
3. PRE PRESHOT TEST
In preparation for the DebriSat hypervelocity impact test a Pre Preshot was conducted to validate the
performance of the specially designed aluminum projectile to meet the velocity goal of ~7 km/s and confirm
operational status of the test chamber and facility. The target was a 5X-scale multi-shock shield supplied by NASA
that was designed to fragment and catch the projectile. It consisted of seven bumper shields consisting of fiberglass
(E-glass, #1, 2, 4, 5), stainless steel mesh (#3) and Kevlar (#6, 7) (Fig. 1) [19]. The target was 2.63 meters long and
weighed about 700 lbs. The fiberglass bumpers were constructed from 22 layers of 26 oz./ft2 FG-3784 satin weave
E-glass fabric per bumper. The 304 stainless steel bumper was constructed from seven sheets of 304 stainless steel
(SS) mesh. In contrast to the DebriSat and DebrisLV impact tests, no “soft catch “ panels were installed. The materials
used to fabricate the target are not representative of those on satellites or launch vehicle upper stages and the fact that
it was designed to ”catch” the projectile implies it may not be representative of a true hypervelocity impact.
A witness plate assembly was provided by Aerospace in order to collect debris for laboratory analysis, to
identify materials produced by the impact and measure the albedo of debris (Fig. 2L). The witness plate assembly
was located on the side of the chamber between the 3rd and 4th bumper shields (Fig. 3L). In the test the first four
bumper shields were perforated by the projectile, the fifth was partially perforated and the frame was dislocated from
the frame (Fig. 3R). The sixth shield (Kevlar) was deformed but was still intact [19]. We were not able to examine
the remains of the target and debris in the chamber after the test. The witness plate assembly was shipped to Aerospace
for analysis.
Exposed surfaces of the witness plate assembly were covered with a matte gray coating and fine debris (Fig.
2R). Larger deposits tended to be concentrated toward the down range side of the plate. The witness coupons located
under the Whipple plates were relatively clean and uncoated compared to those which were uncovered (Fig. 4). This
implies a highly directional nature to the impact deposits. Some of the material consists of loose micron- to nano-
sized solidified molten droplets of an (Fe-Cr-Ni)-rich phase and an oxide/silicate phase (Fig 5L). The surface can be
seen to be covered with small (< 1 μm) solidified molten droplets of the (Fe-Cr-Ni)-rich phase and larger droplets (to
100 μm) of the oxide/silicate (Fig. 5R). A loose flake of this material was potted in epoxy and sectioned and polished
(Fig. 6). The material collected on the witness plate formed a thin continuous layer about 10-20 μm thick, solidified
from molten droplets of the two phases that have a complex intermixed flow structure. The material consists of a
crystalline (Fe-Cr-Ni)-rich phase and amorphous oxide/silicate phases [20].
The relative Fe-Cr-Ni proportions in the (Fe-Cr-Ni)-rich phase are not significantly different from the
stainless steel bumper though it also contains significant amounts of Al and Si [20] (Fig. 7). The Al and Si contents
are about equal in early arriving Fe-Cr-Ni while the later arriving Fe-Cr-Ni is Si rich and Al is low to absent. In the
later droplets there is less flow structure and individual droplets tend to retain their shape implying they were already
semi-solidified when deposited. The oxide phases have a range of compositions. The early oxide phase, mixed with
(Fe-Cr-Ni)-rich phase in complex flow patterns, is primarily Al-Ca oxide with no Si (Fig. 7). The flow structures
were produced by material which landed in a liquid form and then solidified. Later oxide droplets present on the
surface are larger (to 200 μm) and show less flow structure but some gas bubbles. Later oxide droplets have significant
Si and many have compositions similar to E-glass. The integrated (Ca-Al-Si) composition of the early phases with the
complex flow patterns is significantly enriched in Al with respect to E-glass implying much of the Al (to 18%) came
from the aluminum projectile. Aluminum has the lowest melting point of the starting materials. The first three bumpers
that were perforated were fiberglass (1, 2) and stainless steel (3). Molten droplets consisting of Fe- Cr –Ni and Al-Ca
oxide may have condensed from a mixed vapor phase formed from the bumpers and the projectile. Si and Al from the
E-glass dissolved in the Fe-Cr-Ni leaving Al and Ca in an oxide phase. Additional Al came from the Al projectile. All
Si may have dissolved in the (Fe-Cr-Ni)-rich phase possibly leaving no Si for the Al-Ca oxide. These droplets arrived
first in a very fluid state and physically mixed and flowed together in complex patterns. The fourth and last bumper
to be perforated by the decelerated projectile was E-glass. Molten droplets from this bumper arrived latter and some
Copyright © 2017 Advanced Maui Optical and Space Surveillance Technologies Conference (AMOS) – www.amostech.com

Fig. 1. Pre Preshot target with seven bumper shields being loaded into the AEDC test chamber.
Projectile entry was from left to right.
Fig. 2. Pretest witness plate assembly consisting of two sets of three 1” diameter fused quartz windows held down
with stainless steel strips. One set of samples was fully exposed and the second set was protected under three steel
Whipple plates (Left). Witness plate assembly post-test (Right).
Copyright © 2017 Advanced Maui Optical and Space Surveillance Technologies Conference (AMOS) – www.amostech.com

Fig. 3. Pre Preshot target hanging in AEDC vacuum chamber looking down range. Witness plate assembly was
mounted on the side of the chamber facing the target (Left). Target post-test looking down range. The fifth bumper
shield is lying on the floor of the chamber (Right). Images by AEDC.
Fig. 4. Post-test witness samples. Coupons protected under Whipple plates; three 1” fused silica windows and
Kapton multilayer insulation (MLI) (Left). Exposed coupons; center window has been broken and coating has
flaked off lower hold-down strip and MLI (Right).
Fig. 5. Backscatter SEM image of loose solidified molten droplets removed from the surface of the
witness plate by a tape lift (Left). Backscatter SEM image of surface of witness plate showing large solidified
molten droplets of oxide/silicate and small droplets of a (Fe-Cr-Ni)-rich phase (Right).
Copyright © 2017 Advanced Maui Optical and Space Surveillance Technologies Conference (AMOS) – www.amostech.com

Fig. 6. Backscatter SEM images of polished cross section of solidified debris flake from the witness plate. Bottom
of cross section was in contact with witness plate. The cross section preserves the time sequence of deposition. The
bright areas are a (Fe-Cr-Ni)-rich phase – the dark areas are a Al-Ca oxide/silicate.
Fig. 7. EDS analyses of solidified molten deposits. Numbers in top row of table refer to analysis areas in image.
E-glass composition is given for reference. Additional analyses presented in [20].
were less fluid and show less flow structure. The droplet size was larger (to 200 μm) and the composition was more
consistent with E-glass. The later droplets show little to no mixing and the late Fe-Cr-Ni droplets retain their shape.
This implies they were cooler and partially solidified when deposited.
There was a drop in FTIR reflectance from 90-95% for unexposed surfaces to 20-25%, for exposed
surfaces as a result of impact (Fig. 8L). The deposition on the witness plate assembly appears to be line of sight
since the underside of the Whipple shield showed much less of a change (67-85%). FTIR spectral features from the
Copyright © 2017 Advanced Maui Optical and Space Surveillance Technologies Conference (AMOS) – www.amostech.com

deposited material are related to silicate (1080 cm-1) and borate (1400 cm-1) from the E-glass bumpers that were
penetrated (Fig. 8R). The silicate feature shifted as a result of a change in composition.
Fig. 8. Hemispherical FTIR reflectance spectra of witness plate surfaces (left). Attenuated total reflectance FTIR
spectra of witness plate surface compare with E-glass and borosilicate glass (right).
3. DEBRISLV TEST
The 15 kg DebrisLV target was constructed from materials representative of a launch vehicle (LV) upper
stage [21]. It consisted of two tanks, the larger being constructed from 5154-aluminum and filled with 15 psi Xe, and
the smaller from titanium, which was part of a nutation control thruster assembly, and contained 65 psi He [22].
Additional materials included: an external 6061-aluminum skin, 304 stainless steel and copper longerons, stainless
steel tubing and two small strap-on aluminum tanks (Fig. 9). The impact chamber was lined with soft catch foam in
order to trap impact fragments for size distribution and trajectory analysis [5, 7, 9] (Fig. 9L). Additional witness
plates were placed in the chamber in order to capture impact debris for analysis to determine the cause of debris
darkening. The witness plate assembly (Fig. 10L) was similar to that in Pre Preshot, but included aluminum and NaCl
disks in addition to fused silica, and was placed 3 meters up range from the target in order to not interfere with the
soft catch foam system (Fig. 10R). Twenty-four SEM stub witness plates were also placed on the surface of the soft
catch panels [23] (Fig. 9L).
The test was conducted April 1, 2014. Large fragments were returned to Aerospace for examination while
the soft catch panels have been stored by the University of Florida. After impact the majority of the DebrisLV main
tank remained in one piece and the interior was coated with a thin layer (50-100 µm) of solidified molten material
consisting primarily of crystalline aluminum (Fig. 11). The layer was loosely adhered and tended to flake off in large
pieces which are an unexpected source of untrackable orbital debris [22, 23]. The surface of the tank was coated with
a thin dark deposit consisting of disordered graphitic carbon and solidified nano droplets of Al, Fe and Cu. SEM
witness stubs, witness plate asembly and DebrisLV fragments were black in color and were contaminated with < 1mm
soft catch foam fragments (Fig. 12). The majority of the SEM stubs were dislodged from the soft catch during the
impact. Those that remained intact were uprange of the target. The SEM stubs also had a thin film of condensed soft
catch vapor based on FTIR analyses of stubs that had loose soft catch fragments removed by rinsing with isopropyl
alcohol (Fig. 13). The FTIR spectra of the stubs were very similar to condensate of soft catch heated to 1000 oC in a
tube furnace. In high speed camera video it can be seen that the high temperature plasma flash produced by the
impact completely fills the chamber contacting the soft catch [21]. In contrast, the black deposits on the large tank
fragment showed little soft catch condensate. Deposits on SEM stubs and witness plates are predominantly carbon
(Table 2) and consist of agglomerates of micro to nano-sized carbonaceous material with a moss-like appearance that
was derived from the soft catch (Figs. 14, 15). Disordered graphitic carbon is also present based on Raman spectra
(Fig. 13R) and distorted transmission electron microscope (TEM) lattice fringe images (Fig. 16R). Nano droplets of
Copyright © 2017 Advanced Maui Optical and Space Surveillance Technologies Conference (AMOS) – www.amostech.com

Fig. 9. DebrisLV target in vacuum chamber lined with soft catch foam. View looking down range. SEM stubs
(circle) were placed in the soft catch foam (Left). View of target looking uprange showing nutation control thruster
assembly (Right).
Fig. 10. Witness plate assembly – pretest (Left). Location of witness plate assembly with respect to DebrisLV
target. Flash lamps and debris dams are uprange of the target (top and bottom) (Right).
Copyright © 2017 Advanced Maui Optical and Space Surveillance Technologies Conference (AMOS) – www.amostech.com
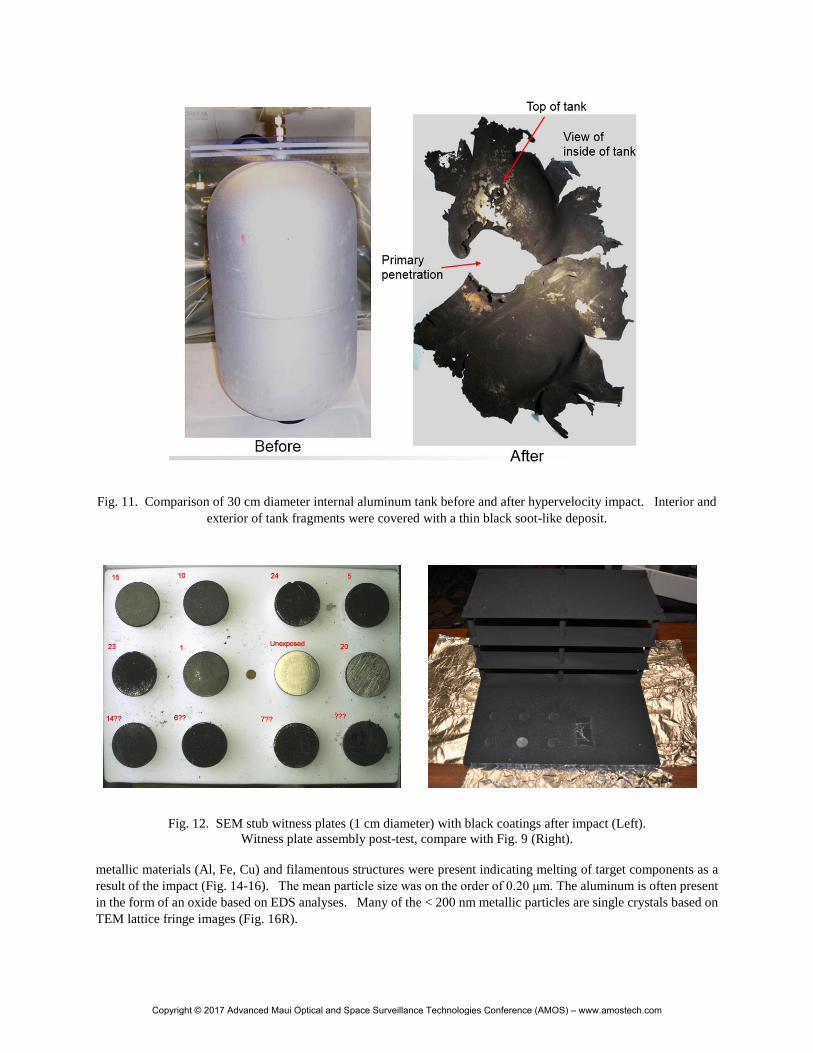
Fig. 11. Comparison of 30 cm diameter internal aluminum tank before and after hypervelocity impact. Interior and
exterior of tank fragments were covered with a thin black soot-like deposit.
Fig. 12. SEM stub witness plates (1 cm diameter) with black coatings after impact (Left).
Witness plate assembly post-test, compare with Fig. 9 (Right).
metallic materials (Al, Fe, Cu) and filamentous structures were present indicating melting of target components as a
result of the impact (Fig. 14-16). The mean particle size was on the order of 0.20 μm. The aluminum is often present
in the form of an oxide based on EDS analyses. Many of the < 200 nm metallic particles are single crystals based on
TEM lattice fringe images (Fig. 16R).
Copyright © 2017 Advanced Maui Optical and Space Surveillance Technologies Conference (AMOS) – www.amostech.com
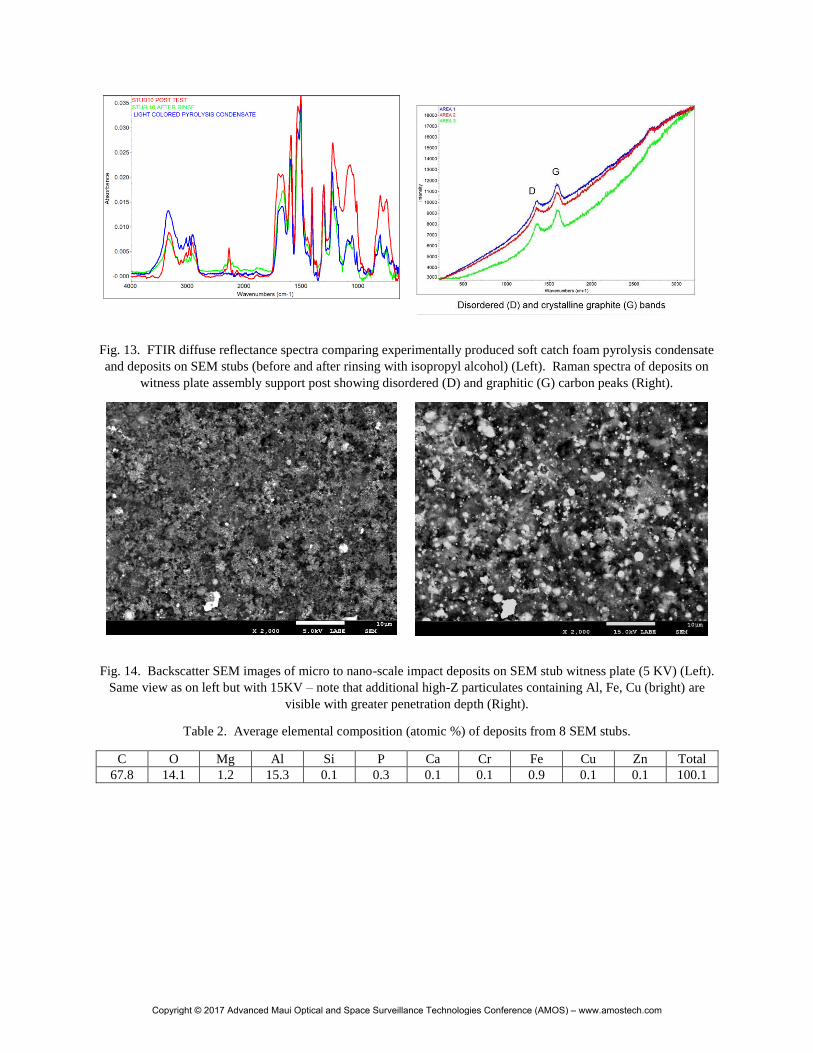
Fig. 13. FTIR diffuse reflectance spectra comparing experimentally produced soft catch foam pyrolysis condensate
and deposits on SEM stubs (before and after rinsing with isopropyl alcohol) (Left). Raman spectra of deposits on
witness plate assembly support post showing disordered (D) and graphitic (G) carbon peaks (Right).
Fig. 14. Backscatter SEM images of micro to nano-scale impact deposits on SEM stub witness plate (5 KV) (Left).
Same view as on left but with 15KV – note that additional high-Z particulates containing Al, Fe, Cu (bright) are
visible with greater penetration depth (Right).
Table 2. Average elemental composition (atomic %) of deposits from 8 SEM stubs.
C O Mg Al Si P Ca Cr Fe Cu Zn Total
67.8 14.1 1.2 15.3 0.1 0.3 0.1 0.1 0.9 0.1 0.1 100.1
Copyright © 2017 Advanced Maui Optical and Space Surveillance Technologies Conference (AMOS) – www.amostech.com

Fig. 15. Secondary SEM images of nano-scale impact deposits on SEM stub witness plate. Note solidified spherical
droplets and filamentous structures.
Fig. 16. TEM images of nano-sized filaments and particulates from SEM stub witness plate on lacey carbon support
(Left). High resolution TEM image of particulate and filament showing lattice fringes (Right).
Witness plates and tank fragments show a significant decrease in reflectance (from 95% to 6%) (Fig. 17L).
Soft catch contamination was seen in FTIR reflectance spectra of SEM stubs and witness plates. As a result, it was
not possible to get a clean spectrum of the debris generated by the hypervelocity impact. An additional band at 800
cm-1, probably from an aluminum oxide, was seen on some of the samples [18] (Fig. 17R). The location of this feature
does not correspond to normal stoichiometric aluminum oxide but does resemble non-stoichiometric Al-oxide nano-
clusters produced by sputtering [24]. The only source of the oxygen in the test was residual air in the chamber (~2
Torr) and would not be expected on orbit. This has been confirmed by recent laboratory laser ablation simulations of
hypervelocity impacts with aluminum which produced debris coatings very similar to those observed in the DebrisLV
and DebriSat tests [25, 26].
Copyright © 2017 Advanced Maui Optical and Space Surveillance Technologies Conference (AMOS) – www.amostech.com
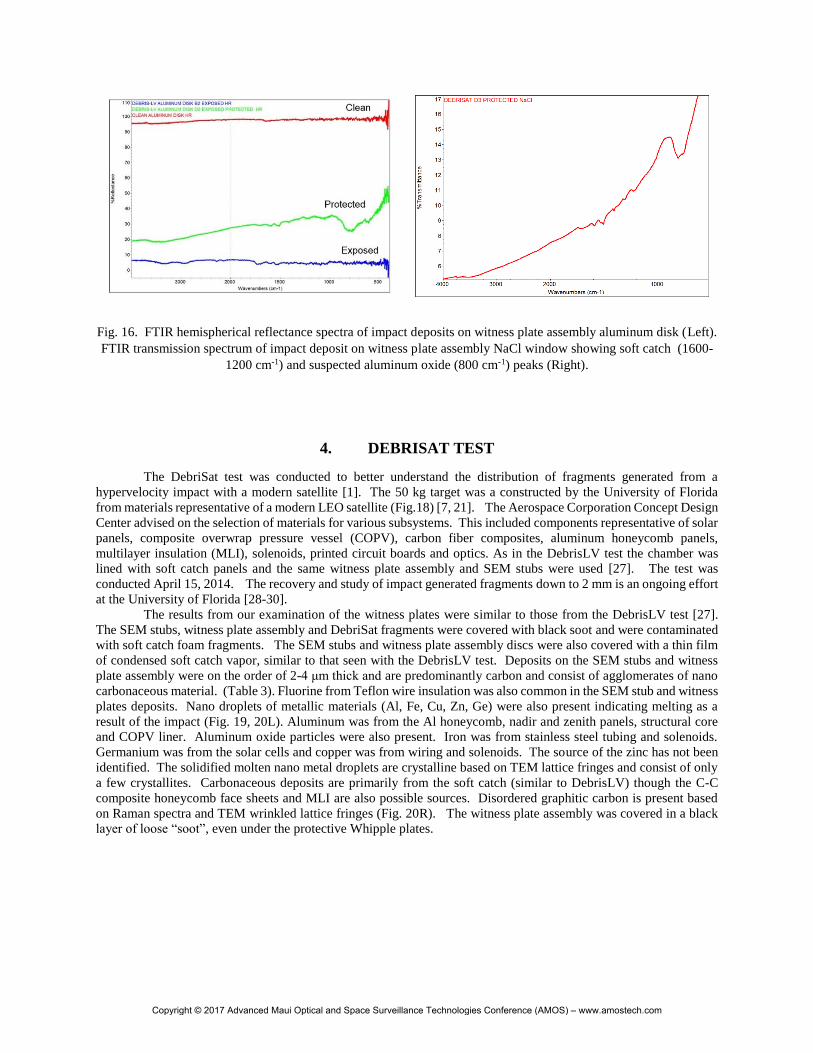
Fig. 16. FTIR hemispherical reflectance spectra of impact deposits on witness plate assembly aluminum disk (Left).
FTIR transmission spectrum of impact deposit on witness plate assembly NaCl window showing soft catch (1600-
1200 cm-1) and suspected aluminum oxide (800 cm-1) peaks (Right).
4. DEBRISAT TEST
The DebriSat test was conducted to better understand the distribution of fragments generated from a
hypervelocity impact with a modern satellite [1]. The 50 kg target was a constructed by the University of Florida
from materials representative of a modern LEO satellite (Fig.18) [7, 21]. The Aerospace Corporation Concept Design
Center advised on the selection of materials for various subsystems. This included components representative of solar
panels, composite overwrap pressure vessel (COPV), carbon fiber composites, aluminum honeycomb panels,
multilayer insulation (MLI), solenoids, printed circuit boards and optics. As in the DebrisLV test the chamber was
lined with soft catch panels and the same witness plate assembly and SEM stubs were used [27]. The test was
conducted April 15, 2014. The recovery and study of impact generated fragments down to 2 mm is an ongoing effort
at the University of Florida [28-30].
The results from our examination of the witness plates were similar to those from the DebrisLV test [27].
The SEM stubs, witness plate assembly and DebriSat fragments were covered with black soot and were contaminated
with soft catch foam fragments. The SEM stubs and witness plate assembly discs were also covered with a thin film
of condensed soft catch vapor, similar to that seen with the DebrisLV test. Deposits on the SEM stubs and witness
plate assembly were on the order of 2-4 μm thick and are predominantly carbon and consist of agglomerates of nano
carbonaceous material. (Table 3). Fluorine from Teflon wire insulation was also common in the SEM stub and witness
plates deposits. Nano droplets of metallic materials (Al, Fe, Cu, Zn, Ge) were also present indicating melting as a
result of the impact (Fig. 19, 20L). Aluminum was from the Al honeycomb, nadir and zenith panels, structural core
and COPV liner. Aluminum oxide particles were also present. Iron was from stainless steel tubing and solenoids.
Germanium was from the solar cells and copper was from wiring and solenoids. The source of the zinc has not been
identified. The solidified molten nano metal droplets are crystalline based on TEM lattice fringes and consist of only
a few crystallites. Carbonaceous deposits are primarily from the soft catch (similar to DebrisLV) though the C-C
composite honeycomb face sheets and MLI are also possible sources. Disordered graphitic carbon is present based
on Raman spectra and TEM wrinkled lattice fringes (Fig. 20R). The witness plate assembly was covered in a black
layer of loose “soot”, even under the protective Whipple plates.
Copyright © 2017 Advanced Maui Optical and Space Surveillance Technologies Conference (AMOS) – www.amostech.com
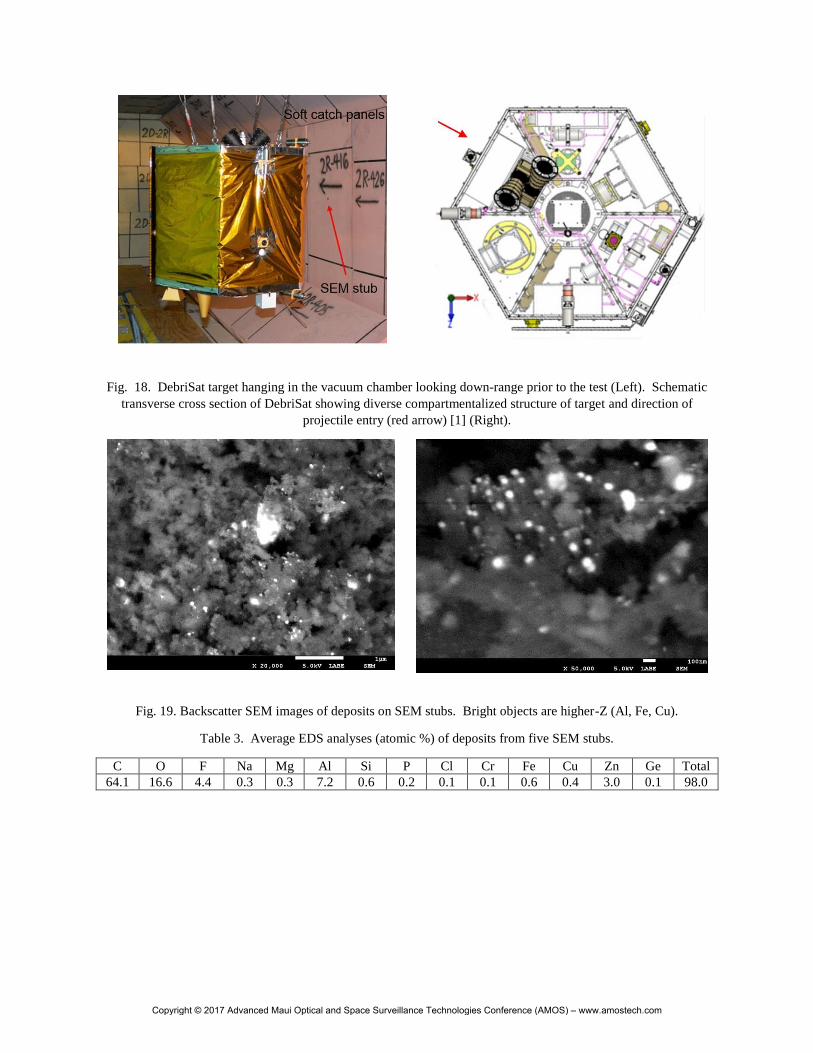
Fig. 18. DebriSat target hanging in the vacuum chamber looking down-range prior to the test (Left). Schematic
transverse cross section of DebriSat showing diverse compartmentalized structure of target and direction of
projectile entry (red arrow) [1] (Right).
Fig. 19. Backscatter SEM images of deposits on SEM stubs. Bright objects are higher-Z (Al, Fe, Cu).
Table 3. Average EDS analyses (atomic %) of deposits from five SEM stubs.
C O F Na Mg Al Si P Cl Cr Fe Cu Zn Ge Total
64.1 16.6 4.4 0.3 0.3 7.2 0.6 0.2 0.1 0.1 0.6 0.4 3.0 0.1 98.0
Copyright © 2017 Advanced Maui Optical and Space Surveillance Technologies Conference (AMOS) – www.amostech.com

Fig. 20. TEM images of nano-deposits consisting of crystalline Al, Al-Oxide and disordered graphitic carbon.
The witness plates show a significant decrease in FTIR hemispherical reflectance from 95% to 6% (Fig. 21). Soft
catch contamination was seen in the FTIR reflectance spectra of DebriSat fragments, SEM stubs and witness plate.
As a result, it was not possible to get a clean spectrum of the debris generated by the hypervelocity impact. An
additional “oxide” band, which may be from a form of aluminum oxide, was seen on some samples (Fig. 21R).
Fig. 21. FTIR hemispherical reflectance spectra of witness plate deposits (Left). Qualitative biconical FTIR
reflectance spectra of witness plate showing soft catch (1800-1000 cm-1) and possible aluminum oxide (800 cm-1)
absorption bands (Right).
Copyright © 2017 Advanced Maui Optical and Space Surveillance Technologies Conference (AMOS) – www.amostech.com
5. SUMMARY AND CONCLUSIONS
The main objectives of this study were to collect microscopic debris coatings from hypervelocity impacts
for analysis in the laboratory to determine their physical characteristics (particle size distribution, chemistry and
optical properties) and make direct albedo measurements. While soft catch contamination from the DebrisLV and
DebriSat tests prevented clean observations of the hypervelocity impact debris it was still possible to obtain valuable
information related to the observed impact deposits under low-vacuum conditions.
In all three tests the witness plates, and in many cases target fragments, were coated with thin coatings (2-
20 μm) of impact debris. While not representing a large volume they had a significant influence on the
reflectance/albedo of the surfaces they covered. The debris from the Pre Preshot test consisted of a two-phase
mixture formed from solidified molten silicate and steel droplets. Individual droplets ranged from 100 μm to 10
nm. The reflectance of witness plates dropped from 95% to 20-30% as a result of the debris. Debris collected on
witness plates in the DebrisLV and DebriSat tests consisted of μm to nm-sized solidified molten metallic and oxide
droplets in a matrix of condensed vaporized soft catch. Disordered graphitic carbon was also detected. The
reflectance of debris-covered witness plates dropped from 95% to 5%. The dramatic decrease in reflectance for
hypervelocity impact debris is attributed to the effect of scattering from μm to nm-sized solidified molten metallic
droplets and the presence of graphitic carbon, when organics are present. The presence of soft catch in the later tests
and the high organic content with graphitic carbon in the debris appear to be responsible for this much lower post-
test reflectance. While soft catch foam is not present in satellites, other organic materials such as MLI blankets,
carbon-fiber reinforced composites, printed circuit boards and wire insulation may similarly produce disordered
graphitic carbon in hypervelocity impacts resulting in very low albedos. These results confirm those in [11] (Table
1) where very low albedos (~ 0.05) were measured from orbital debris, though they qualified their results as possibly
being low by a factor of 2X. The presence of micro to nano-sized particulates produced by these hypervelocity
impacts tests confirms them as a source for micro debris wakes [31].
A suspected aluminum oxide band was observed on some witness plates from the DebrisLV and DebriSat
tests and was corroborated by EDS analyses of some particulates. This may have resulted from residual oxygen (air)
in the vacuum chamber and would not be expected on-orbit. The presence of residual air in the chamber and Xe in
the main DebrisLV tank may have also contributed to the formation of nano-particulates through collisional cooling
of the vapor phase produced by the impact. Recent laboratory laser ablation simulations of hypervelocity impacts
with aluminum have produced debris coatings very similar to those observed in the DebrisLV and DebriSat tests
[25, 36] and have demonstrated that aluminum oxide forms under vacuum conditions (~2 Torr air) comparable to
DebrisLV/DebriSat and that it does not form under high vacuum equivalent to LEO.
6. ACKNOWLEDGEMENTS
We thank the DebriSat team members for their support during the tests: J.-C. Liou (NASA Space Debris Program
Office, NASA JSC), Norman Fitz-Coy (U. of Florida); Heather Cowardin and John Opiela (ESCG/Jacobs); the AEDC
Range G Light Gas Gun Staff and Charles Griffice and Marlon Sorge (Aerospace). Financial support was provided
by: Charles Griffice (Aerospace) and Thomas Huynh (SMC/EN). V. Sather is thanked for reviewing an early version
of this paper.
Copyright © 2017 Advanced Maui Optical and Space Surveillance Technologies Conference (AMOS) – www.amostech.com
7. REFERENCES
1. Liou, J.-C., Clark, S., Fitz-Coy, N., Huynh, T., Opiela, J., Polk, M., Roebuck, B., Rushing, R., Sorge, M. and
Werremeyer, M., DebriSat – A planned laboratory-based satellite impact experiment for breakup fragment
characterization, Proc. 6th Europe. Conf. Space Debris, Darmstadt, Germany, 2013.
2. Hogg, D.M, Cunningham, T.M, Isbell, W.M, Final report on the SOCIT series of hypervelocity impact tests.
Wright Laboratory WL-TR-93-7025, General Research Corporation, Santa Barbara, CA, USA, 1993.
3. McKnight, D. S., Johnson, N. L., Fudge, M. L. and Maclay, T. D., Satellite orbital debris characterization impact
test (SOCIT) series data collection report, Kaman Sciences Corporation, Contract No. NA 9-19215, 1995.
4. Krisko, P. H., Horstman, M. and Fudge, M. L., SOCIT4 collisional-breakup test data analysis: With shape and
materials characterization, Advances in Space Research 41, 1138–1146, 2008.
5. Ausay. E., Cornejo, A., Horn, A., Palma, K., Sato, T., Blake, B., Pistella, F., Boyle, C., Todd, N., Zimmerman,
J., Fitz-Coy, N., Liou, J.-C., Sorge, M., Huynh, T., Opiela, J., Krisko, P. and Cowardin, H., A comparison of the
SOCIT and DebriSat experiments, 7th Europe. Conf. Space Debris, Darmstadt, Germany, 2017.
6. Johnson, N. L., Krisko, P., Liou, J.-C. and Anz-Meador, P. D., NASA’s new breakup model of EVOLVE 4.0,
Adv. Space Res., 28, 1377-1385, 2001.
7. Polk, M., Woods, D., Roebuck, B., Opiela, J., Sheaffer, P and Liou, J.-C., Orbital Debris Assessment Testing in
the AEDC Range G, Procedia Engineering, 103, 490 – 498, 2015.
8. Polk, E. M. and Roebuck, B. E., DebriSat Hypervelocity Impact Test , Arnold Engineering Development Center
AEDC-TR-15-S-2, 2015, www.dtic.mil/get-tr-doc/pdf?AD=ADA625195
9. DebriSat Soft-Catch Panel Impact Test, NASA Orbital Debris Quarterly News, Vol. 18(1), 4-5, 2014.
10. Mulrooney, M. K., Matney, M. J., Hejduk, M. D. and Barker, E. S., An Investigation of Global Albedo Values,
Proceedings 2008 AMOS Technical Conference, Wailea, HI, 719-728, 2008.
11. Potter, A. E., Henize, K. G. and Talent, D. L., Albedo estimates for debris, in Orbital debris from upper-stage
breakup (ed. J. P. Loftus, Jr.) Progress in Astronautics and Aeronautics, 121, 147-156, 1989.
12. Henize, K. G. and Stanley, J. F., Optical observations of space debris, AIAA/NASA/DOD Orbital Debris
Conference: Technical Issues & Future Directions, Baltimore, MD, AIAA-90-134O, 1990.
13. Lebofsky, L. A. and Vilas, F., Thermal models applicable for visual and infrared studies of orbital debris, Adv.
Space Res., 10, 377-380, 1990.
14. Henize, K. G., O’Neill, C. A., Mulrooney, M. K, and Anz-Meador, P., Optical properties of orbital debris, J.
Spacecraft Rockets, 31, 671-677, 1994.
15. Kessler, D. J. and Jarvis, K. S., Obtaining the properly weighted average albedo of orbital debris from optical and
radar data, Advances in Space Research, 34, 1006-1012, 2004.
16. Mulrooney M. and Matney, M., Derivation and Application of a Global Albedo Yielding an Optical Brightness
to Physical Size Transformation Free of Systematic Errors, Proceedings 2007 AMOS Technical Conference,
Kihei, HI, 719-728, 2007.
17. Mulrooney, M., Matney, M. and Barker, E. A New Bond Albedo for Performing Orbital Debris Brightness to
Size Transformations., 2008 International Astronautical Congress, Glasgow, Scotland, 2008.
18. Adams, P. M., Sheaffer, P. M. and Radhakrishnan, G., FTIR Analyses of Hypervelocity Impact Deposits:
DebriSat Tests, Aerospace Report No. TOR-2015-00941, 2015, http://www.dtic.mil/get-tr-
doc/pdf?AD=ADA627320
19. Christiansen, E., A. Davis, A., Miller, J. and Lear, D., Hypervelocity Impact Test with Large Mass Projectile,
NASA Orbital Debris Quarterly News, Vol. 18(2), 6-7, 2014.
20. Adams, P. M. and Sheaffer, P. M., DebriSat Pre Preshot Laboratory Analyses, Aerospace Report No. TOR- TOR-2014-03083, 2014, http://www.dtic.mil/get-tr-doc/pdf?AD=ADA627557
21. Liou, J.-C., Opiela, J., Cowardin, H., Huynh, T., Sorge, M., Griffice, C., Sheaffer, P., Fitz-Coy, N., Wilson, M.,
Rushing, R., Hoff, B., Nolen, M., Polk, M., Roebuck, B and Woods, D. Successful Hypervelocity Impacts of
DebrisLV and DebriSat, NASA Orbital Debris Quarterly News, Vol. 18(3), 3-5, 2014.
22. Sheaffer, P. M. and Adams, P. M., DebrisLV Hypervelocity Impact Post-Shot Physical Results Summary,
Aerospace Report No. TOR- 2014-03577, 2015, http://www.dtic.mil/get-tr-doc/pdf?AD=ADA625015
23. Adams, P. M., Sheaffer, P. M., Lingley, Z. and Radhakrishnan, G., Debris-LV Laboratory Analyses, Aerospace
Report No. TOR-2015-00928, 2015.
Copyright © 2017 Advanced Maui Optical and Space Surveillance Technologies Conference (AMOS) – www.amostech.com
24. Polonskyi, O., Kylián, O., Kousal, J., Solař, P., Artemenko, A., Choukourov, A., Slavínská, D. and Biederman,
H., Aluminium oxide clusters and their nanocomposites with plasma polymers prepared by a gas aggregation
cluster source and plasma polymerization, 19th International Symposium of Plasma Chemistry, Bochum,
Germany, 2009.
25. Radhakrishnan, G., Adams, P. M., Panetta, C. J. and Alaan, D. R., Laboratory Comparisons to Hypervelocity
Impact and Debris Darkening, Procedia Engineering, (in press), 2017.
26. Radhakrishnan, G., Adams, P. M., Alaan, D. R and Panetta, C. J., Debris Albedo from Laser Ablation in Low
and High Vacuum: Comparisons to Hypervelocity Impact, 2017 AMOS Technical Conference Proceedings,
Maui, HI, in preparation for this conference.,2017.
27. Adams, P. M., Lingley, Z., Presser, N. and Radhakrishnan. G, DebriSat Laboratory Analyses, Aerospace Report
No. TOR-2015-00876, 2015, http://www.dtic.mil/get-tr-doc/pdf?AD=ADA625039
28. Rivero, M., Kleespies, J., Patankar , K., Fitz-Coy, N., Liou, J.-C., Sorge, M., Huynh, T., Opiela, J., Krisko, P.
and Cowardin, H., Characterization of debris from the DebriSat hypervelocity test, Proceedings 66th
International Astronautical Congress, Jerusalem, Israel, IAC-15-A6.29x30343, 2015.
29. Rivero, M., Shiotani, B., Carraasquilla, M., Fitz-Coy, N., Liou, J.-C., Sorge, M., Huynh, T., Opiela, J., Krisko, P.
and Cowardin, H., DebriSat fragment characterization system and processing status, Proceedings 67th
International Astronautical Congress, Guadalajara, Mexico, 2016.
30. Cowardin, H., Liou, J.-C., Anz-Meador, P., Sorge, M., Opiela, J., Fitz-Coy, N., Huynh, T. and Krisko, P.,
Characterization of orbital debris via hyper-velocity laboratory based tests, 7th Europe. Conf. Space Debris,
Darmstadt, Germany, 2017.
31. Maclay, T. D. and McKnight, D., The contribution of debris wakes from resident space objects to the orbital
debris environment, IAA.6.4-94-692.
,
Copyright © 2017 Advanced Maui Optical and Space Surveillance Technologies Conference (AMOS) – www.amostech.com

Copyright © 2017 Advanced Maui Optical and Space Surveillance Technologies Conference (AMOS) – www.amostech.com