CHARACTERIZATION OF GROUNDWATER FROM RICE COUNTY, MINNESOTAbhaileab/Geochemistry/FinalPaper.pdf ·...
39
1 CHARACTERIZATION OF GROUNDWATER FROM RICE COUNTY, MINNESOTA Lila Battis, Laura Bazzetta, James Bethune, Sophie Hines, Lauren Howell, Sam Kanner, Ray McGaughey, Alissa Morson, Jake Reznick Nate Ryan, and Allison Vitkus Bereket Haileab, Advisor March 2010 ABSTRACT A report on the quality of well water was compiled for Rice County, Minnesota, using data from the Minnesota Department of Natural Resources (DNR), the Minnesota Pollution Control Agency (MPCA), the Minnesota Nitrate Volunteer Monitoring Network (VNMN), and data collected by the authors of this study. The Minnesota County Well Index (CWI) was used to find wells with a variety of depths, geologic units, and distances to nearest feedlots. A variety of well uses was sought, but wells in Rice County are primarily domestic, and this is reflected in our dataset. After linking the datasets together, the most comprehensive data set was on nitrate. There was also data on other ions such as, iron, sodium, calcium, potassium, arsenic, and lead. Field data was also collected by the authors of this study and the DNR for pH, conductivity, salinity, and temperature. Generally, the eastern part of the county has a higher elevation, more farmland, higher nitrate levels, and lower pH levels. Throughout the county all reliable measurements of nitrate and trace metals were below the maximum contaminant level. INTRODUCTION Over one million Minnesotans get their drinking water from private wells, an estimated 23% of the state (Lewandowski et al., 2008). Rice County alone has an estimated number of 16,000 of private wells (Wei-Hsin Fu, personal communication). Within the county, high oxidation levels in the Prairie du Chien, Jordan and Franconia aquifers make the drinking water
Transcript of CHARACTERIZATION OF GROUNDWATER FROM RICE COUNTY, MINNESOTAbhaileab/Geochemistry/FinalPaper.pdf ·...

1
CHARACTERIZATION OF GROUNDWATER FROM RICE COUNTY, MINNESOTA
Lila Battis, Laura Bazzetta, James Bethune, Sophie Hines, Lauren Howell, Sam Kanner, Ray McGaughey, Alissa Morson, Jake Reznick Nate Ryan, and Allison Vitkus
Bereket Haileab, Advisor
March 2010
ABSTRACT
A report on the quality of well water was compiled for Rice County, Minnesota, using
data from the Minnesota Department of Natural Resources (DNR), the Minnesota Pollution
Control Agency (MPCA), the Minnesota Nitrate Volunteer Monitoring Network (VNMN), and
data collected by the authors of this study. The Minnesota County Well Index (CWI) was used to
find wells with a variety of depths, geologic units, and distances to nearest feedlots. A variety of
well uses was sought, but wells in Rice County are primarily domestic, and this is reflected in
our dataset. After linking the datasets together, the most comprehensive data set was on nitrate.
There was also data on other ions such as, iron, sodium, calcium, potassium, arsenic, and lead.
Field data was also collected by the authors of this study and the DNR for pH, conductivity,
salinity, and temperature. Generally, the eastern part of the county has a higher elevation, more
farmland, higher nitrate levels, and lower pH levels. Throughout the county all reliable
measurements of nitrate and trace metals were below the maximum contaminant level.
INTRODUCTION
Over one million Minnesotans get their drinking water from private wells, an estimated
23% of the state (Lewandowski et al., 2008). Rice County alone has an estimated number of
16,000 of private wells (Wei-Hsin Fu, personal communication). Within the county, high
oxidation levels in the Prairie du Chien, Jordan and Franconia aquifers make the drinking water

2
particularly contaminated by chemicals such as nitrate and lead (MPCA, 1999). Furthermore,
because of the county’s agriculturally dominated landscape, local groundwater systems are more
likely to be contaminated by animal waste, fertilizer runoff, and chemical pollutants used in
large-scale farming operations, all of which are linked to higher levels of nitrates and phosphates.
Located in south-central Minnesota, Rice County has an area of 496 square miles and
varies in elevation from about 270 meters to 390 meters above sea level (Fig. 1; DNR, 1995).
The total population of the county is 63,034 residents, predominately concentrated around the
two largest cities, Faribault and Northfield. Much of the land in Rice County land is used for
agricultural purposes (Fig. 2; DNR, 1995) and there are 1640 feedlots evenly distributed
throughout the county (Fig. 3; DNR, 1995).
In order to keep local residents informed and better characterize the hydrogeology of the
region, the Carleton College Geochemistry of Natural Waters class conducted a ten-week study
on groundwater quality in Rice County, Minnesota. The main focus of the study is the spatial
analysis of groundwater trends in the county, through the use of a combination of data sampled
by the geochemistry class and well water data from government agencies and other non-profit
organizations.
GEOLOGIC SETTING
The bedrock below Rice County is primarily comprised of sandstone, limestone, and
shale. These sedimentary formations are the result of deposition during alternating periods of
transgression and regression in Cambrian and Ordovician epieric seas. Major rock formations
represented in Rice County include the Franconia Formation, the St. Lawrence Sandstone, the
Jordan Sandstone, the Prairie Du Chien Group, the Platteville Limestone, the Decorah Shale, the

3
Galena Limestone, and the St. Peter Sandstone (Fig. 4; Berg, 1954; Smith et al., 1993; Runkel,
1994).
The major hydrologic unit in our study area is the Cambian-Ordovician Aquifer system
(Olcott, 1992). This aquifer complex consists of the St. Peter Aquifer and the Prairie du Chien-
Jordan Aquifer (Ruhl and Wolf, 1983b). It is bounded below by the St. Lawrence Formation,
which is largely composed of dolomite and dolomitic siltstone, and above by the Maquoketa
confining unit, which consists of the Galena Limestone, Decorah Shale, Platteville Limestone,
and Glenwood Shale, among other units (Fig. 5; Olcott, 1992). The St. Peter and Prairie du
Chien-Jordan Aquifers are separated by the St. Peter confining bed, a layer of siltstone and shale
at the base of the St. Peter Sandstone (Ruhl and Wolf, 1983a). The County Well Index
differentiates between the Prairie du Chien and Jordan aquifers; however, there are no confining
features separating the two stratigraphic units (Fig. 6; Ruhl and Wolf, 1983a), meaning that
water is able to flow between them. Therefore, we claim that the Prairie du Chien and Jordan
aquifers should be thought of as one larger aquifer.
Aside from the Cambrian-Ordovician Aquifer system, the only other aquifer that we
sampled from was the Quaternary Buried Artesian Aquifer (“Buried Confined” aquifer in
western Rice County in Fig. 7). The Quaternary Buried Artesian Aquifer is the uppermost
aquifer, and consists of lenses of fine- to coarse-grained sand and gravel confined and separated
from other units by till and clay (Ruhl and Wolf, 1983a).
4
PREVIOUS WORK
The Minnesota Department of Natural Resources (1995), the Southeast Minnesota
Volunteer Nitrate Monitoring Network (Network, 2009) and the Minnesota Pollution Control
Agency (1999) have all conducted recent studies on the groundwater of Rice County (Fig. 8).
Similar studies on groundwater in Dakota County have been conducted by the University
of Minnesota, in conjunction with the Minnesota Department of Agriculture (Lewandowski et al.,
2008). The results of this survey were published in the spring of 2008 and were primarily geared
towards evaluating the cost of water treatment amongst Minnesotan well owners, particularly
those whose aquifers show nitrate contamination. Dakota County itself produced the Dakota
County Ambient Groundwater Quality Study, which was geared towards analyzing the chemical
components of the region’s groundwater in order to establish a baseline and potentially
reevaluate environmental policy in the area (County, 2006). The study was conducted over the
course of five years, and primarily concentrated on well water drawn from aquifers located in the
Prairie du Chien Group and the Jordan Sandstone. The final study consulted for this paper is the
2004 Carleton College Geochemistry of Natural Waters class survey conducted on 19 private
wells throughout Rice County (Haileab et al., 2004).
The Environmental Protection Agency maximum contamination level of nitrate in
drinking water is 10 mg/L, due to the health effects that can occur in infants with a higher level
(EPA, 2009). In the 2004 Geochemistry of Natural Waters class study, 14 out of 19 well water
samples possessed nitrate levels above the drinking standard in Rice County (Haileab et al.,
2004). The Dakota County study showed that 30% of private wells tested had an elevated level
of nitrate and/or pesticides, while 18% of wells showed no signs of nitrates in the groundwater
(County, 2006). Lewandowski et al. (2008) found approximately one-third of wells surveyed to

5
be vulnerable to contamination for a myriad of reasons, and though the majority of wells did not
show elevated levels of nitrate, the risk of nitrate contamination was increased if the well was in
close proximity to a predominantly agricultural area.
In order to start building a database of Rice county groundwater, the 2004 Geochemistry
of Natural Waters class also analyzed each well water sample for ion content, stable isotope
ratios, and CFC concentrations. Bromide and phosphate were not found to be present in the
groundwater, while chloride, fluoride, and sulfate were found to be present, but in amounts
within the concentration guidelines set by the Minnesota Department of Health. Cation levels in
Rice County groundwater do not exceed any of the drinking water concentration standards set up
by the Minnesota Department of Health. The CFC concentrations that were analyzed in Rice
County indicate that surface to groundwater percolation times range from several months to 50
years (Haileab et al., 2004). The stable isotope ratios agree with the CFC concentration dates and
suggest a local or regional recharge area in the Rice County groundwater (Haileab et al., 2004).
METHODS
Field Methods
Data was used from an ArcGIS database of well and boring records for Rice County from
the Minnesota Department of Health. The six aquifers which supply water for the most wells
were selected for study: the Jordan (CJDN), Prairie du Chien (OPDC), St Peter (OSTP),
Quaternary Buried Artesian Aquifer (QBAA), Prairie du Chien-Jordan (OPCJ), and St Lawrence
(CSTL). Using GIS, 365 of these wells were selected by location to ensure a wide distribution
across the county. Well owners and addresses were found by spatially joining the selected wells
to a parcel dataset provided by the county. A letter explaining the project and requesting
6
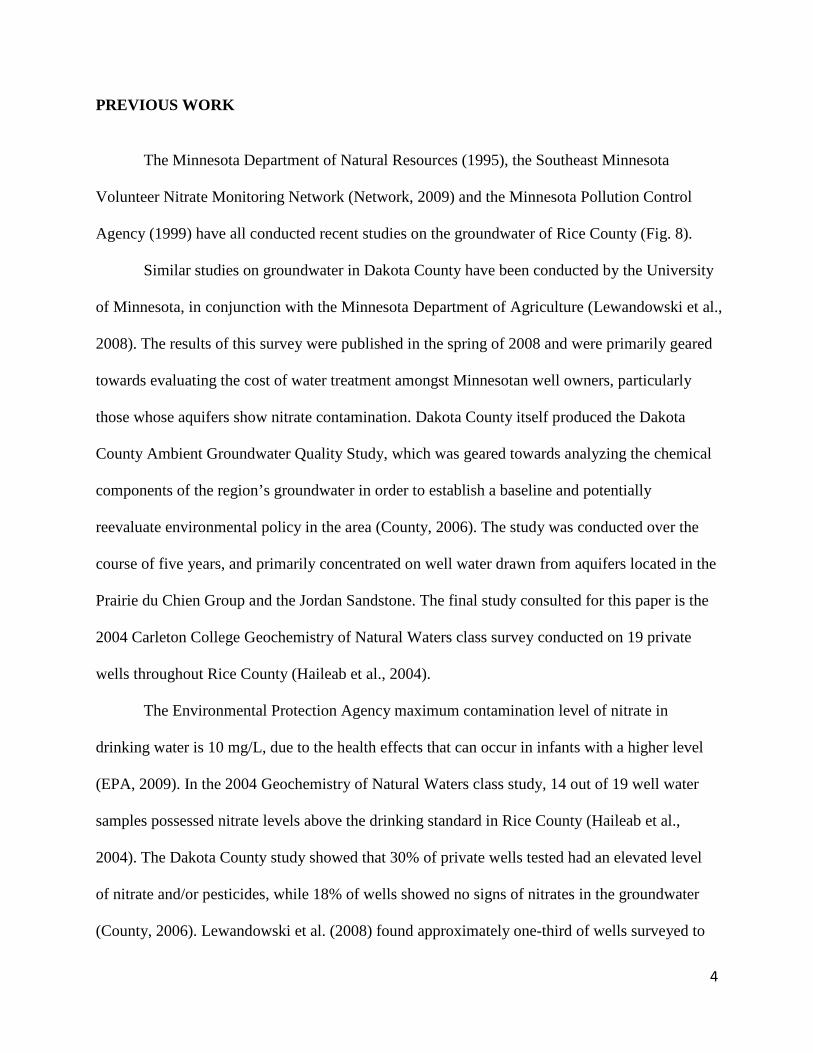
permission to sample residents’ water was sent to each household (Appendix 1). One week later,
residents were called for permission and to schedule a time for sampling. We were given
permission by 108 residents, and we visited 70 sites.
Teams of two to three students drove to approved sites and sampled water from the
closest available tap to the well (before the water had gone through softeners). At each site, two
125 ml (4 oz) Boston round clear glass sample bottles were filled and capped using size 22-400
white plastic caps with an aluminum foil liner. On site, YSI Meter Model 60s were used to
measure pH and YSI Meter Model 30s were used to measure water conductivity (µS), salinity
(ppt), and water temperature (°C). At 11 sites, 1 L Pyrex bottles samples were filled for Tritium
samples. In 9 cases, three 125ml sampling bottles were filled without trapped air to allow for
future CFC sampling. Due to time constraints, CFC and Tritium were not taken into account in
this study. In total, 61 wells were visited and sampled.
Laboratory Methods
Tests for Ca, Na, K, and Fe were performed with a Perkin-Elmer 1100B Atomic
Absorption Spectrometer (AA) using Perkin-Elmer Intensitron (for Ca, Na, K) and VWR
Scientific Inc. (for Fe) Hollow Cathode Lamps. Sets of standards were made for each element
using Ultra Scientific Analytical Solutions concentrated stock standards so that each set fell
within the linear range of absorbance vs. concentration, and spanned the sample data set evenly.
These standards were used to calibrate the AA to measure concentration in milligrams per liter.
A portion of each of the water samples for each metal to be tested was removed and diluted
based on the expected concentrations so that the resulting concentration would fall within the
linear range of absorption vs. concentration for that particular metal. Because the particulate
7
matter that had settled to the bottom of many of the collected samples was suspected to contain
iron, these samples had to be treated with nitric acid before being run through the AA. The
samples were agitated to create a homogeneous mixture, and a portion was extracted. One
percent by volume concentrated nitric acid was added (15.7 M) to dissolve the precipitated iron,
and the resulting solution was diluted to an appropriate concentration (see above). Nitrate tests
were performed with a Nexsens WQ Nitrate ISO Probe. No dilution was necessary for nitrate
tests; the probe was inserted directly into the sample.
GIS Analytical Methods
GIS software was used to compare the data collected and analyzed by the authors of this
study with previous work by the Minnesota Department of Natural Resources (MNDR) and the
Minnesota Department of Health. The County Well Index (CWI), run by the Minnesota
Department of Health, stores a plethora of data on every registered well in Minnesota. In the
CWI data file, every well has a unique identification number. This number is used by multiple
agencies within Minnesota to correlate their own data. Some well owners visited by the authors
of this study had multiple wells on their property, which led to confusion when classifying the
correct well identification number. Such an issue should not have a large impact on the results
because multiple wells on the same property are close together and therefore likely to be drilled
into the same aquifer.
Using the CWI unique identification numbers, we joined the data collected for this study
to data from the MDNR, MPCA, and the VNMN. In the CWI data file, each well was classified
by the aquifer from which the well draws. Point-based well chemistry data was interpolated

8
across Rice County using an ordinary kriging algorithm. The values in each of the resulting
concentration surfaces were classified into five geometric intervals.
The feedlots and well layers were spatially joined to calculate the minimum distance
from well to feedlot. This operation was performed multiple times, once for all feedlots, once for
cow and swine feedlots, and once for feedlots with more than one animal. Scatter plots of
feedlots vs. nitrate concentrations were generated from the resulting attribute tables. In order to
determine the correlation between the quantity of feedlots and nitrate concentration of a well a
distance to point function was run using two buffer distances of 0.5 miles and 1.0 mile. The
results were exported to a spreadsheet, and summarized in MATLAB.
RESULTS
Field Data
Temperature values ranged from 4.0 to 18.0 °C, with one outlier of 28.6 °C. The mean
temperature was 9.60 °C and the standard deviation was 3.75 °C (Table 1). In most cases, both
low and high conductivity values were collected at each well; rarely, only high values were
recorded. Most low conductivity values fell between 400 and 700 µS, with a mean of 504 µS and
a standard deviation of 175 µS. High conductivity values ranged from 370 to 1045 µS, with one
outlier of 15 µS. The mean high conductivity was 693 µS and the standard deviation was 181
µS. Wells sampled varied relatively evenly between 7.0 and 9.7 pH, with a mean value of 8.0 pH
and a standard deviation of 0.8 pH.

9
Laboratory Data
Sodium
Within our sampled wells, Na concentration exhibits low variability, with a minimum
value of 0.1 mg/L and a maximum value of 1.7 mg/L. Most values fall between 0.2 and 0.8
mg/L. The mean concentration is 0.4 mg/L and the standard deviation is 0.4 mg/L (Table 2).
Potassium
The concentration of K measured within the sampled wells was marked by relatively low
variation, with an evenly distributed range between 0.0 and 1.0 mg/L. The mean of K
concentration is 0.4 mg/L and the standard deviation is 0.2 mg/L (Table 2).
Calcium
Marked by slightly higher values, the concentration of Ca in the sampled wells ranges
from 0.1 to 3.5 mg/L, with most falling between 1.0 and 2.5 mg/L and one large outlier of 4.5
mg/L. The mean concentration is 1.8 mg/L and the standard deviation is 0.8 mg/L (Table 2).
There is a potential source of error in the calcium data due to a known atomic absorption
chemical interference between calcium and phosphate. Phosphate can bind to calcium ions and
make them unable to be atomized by the flame in the Atomic Absorption Spectrometer. This
results in a measured concentration of calcium that is less than the actual concentration. Due to
the fact that most of the water samples were taken from agricultural land, it is likely that they
contain phosphates, and for this reason, it is possible that the reported calcium concentrations are
lower than the actual concentrations in the water.
Due to these errors, the Calcium map was interpolated from DNR well data, which
yielded results ranging from 1.0 to 62.5 mg/L (Fig. 6). The pattern observed in this map features
10
generally high calcium values concentrated in the northwestern half of the county and lower
values in the south-central and northeastern parts of the county.
Nitrates
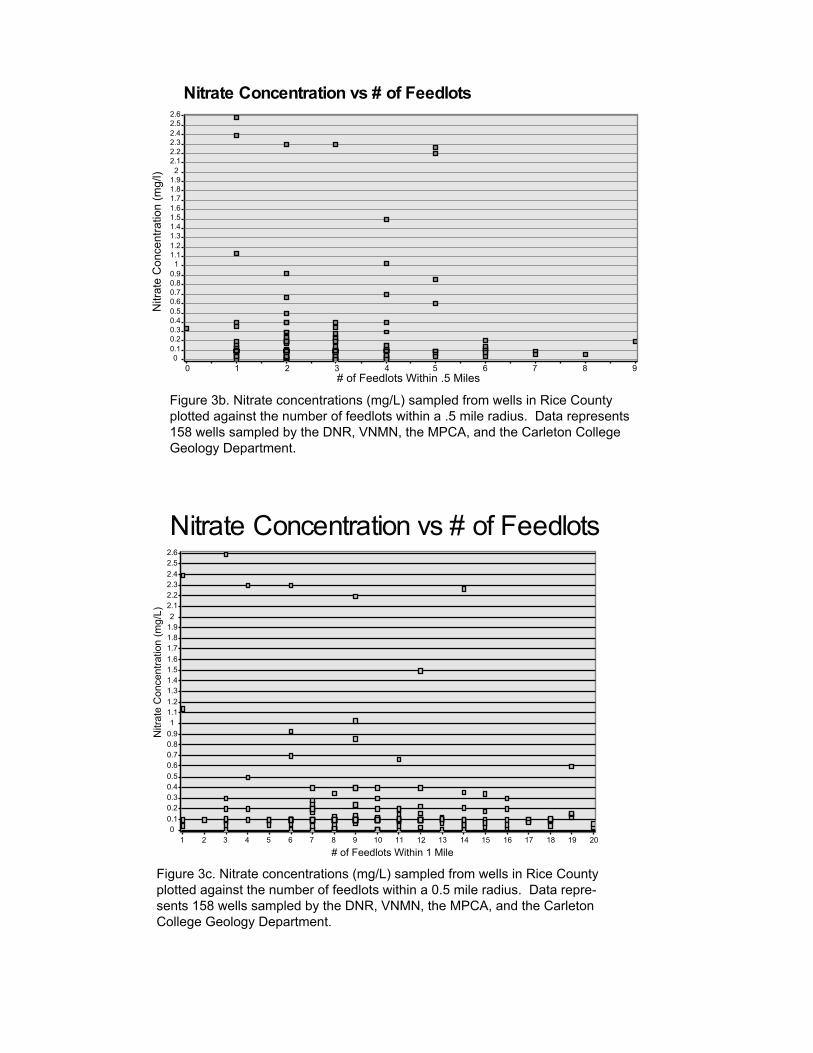
The analysis of nitrate concentrations in this study included data from the DNR, VNMN,
the MPCA, and our sampled wells for a total 158 sampled wells. This data yielded a range of
results from 0.01 to 2.59 mg/L (Table 2). The relationships between concentration and spatial
variables of aquifer, depth to bedrock, land use, distance from a feedlot, and direction of
groundwater flow. The concentration of Nitrate did not show a significant relationship to
distance from a feedlot at distances of 0.5 miles and 1.0 mile (Fig. 3b,c), nor did the mean
concentration show a significant relationship to type of land cover.
The interpolated nitrate concentration surface shows higher nitrate levels in the eastern
half of Rice County. The nitrate concentrations generally increase in the direction of
groundwater flow, with the highest concentrations at the intersection of ground and surface water.
Iron
Within our sampled wells, Fe concentration exhibits high variability, with a minimum
value of 0.0 mg/L and a maximum value of 13.6 mg/L. The mean concentration found is 3.3
mg/L and the standard deviation is 3.3 mg/L (Table 2).
Arsenic and Lead
Samples were not tested for lead and arsenic as Carleton does not own sophisticated
enough technology to analyze in the parts per billion.
11
DISCUSSION
Sodium and Potassium
Sodium and potassium in well water present no health risk and were dropped from our
investigation.
Calcium
Calcium (Ca+2) is a common cation in natural waters. It, along with magnesium (Mg+2), is
a main contributor to water hardness. Elevated levels of calcium in water may precipitate as
calcium carbonate and cause scaling of pipes, although there are currently no known health risks
associated with calcium and magnesium (Ohio Department of Natural Resources, 1997).
Calcium is abundant in many rocks and soils, particularly limestones and dolostones, and
dissolves as water passes through these rocks. Calcium carbonate disassociates (1) and interacts
with water and carbon dioxide (2) in the following reactions (Minnesota Pollution Control
Agency, 1999b):
CaCO3(s) ↔ Ca(aq )2+ + CO3
2− (1)
CO2(g ) + H2O ↔ H2CO3(aq )
H2CO3(aq ) ↔ H+ + HCO3−
(aq )
HCO3−
(aq ) ↔ H+ + CO32−
(aq )
(2)
Figure 9 shows average calcium concentration by aquifer. Figure 10 displays the
relationship between carbonate content in aquifer geology and Ca2+ concentration in that
aquifer’s contained groundwater. The three aquifers with the highest concentration of calcium
are all part of the same hydrogeological unit, the Prarie du Chien-Jordan aquifer (Fig 9). As
shown in Figure 10, the Prarie du Chien-Jordan aquifer has high carbonate levels since the Prarie
du Chein group is largely composed of dolomite. The dissolution of this dolostone has created
karst conditions in Rice County and the rest of southeastern Minnesota. This creates increased

12
aquifer permeability, allowing contaminants to quickly pass unfiltered into the aquifer system.
Low calcium concentrations in the St. Peter sandstone can be explained by low carbonate content
in the rock (Fig. 10). The low concentrations in the Decorah Shale and Franconia Formation can
be explained in the same way. In the Quaternary Buried Artesian Aquifer does not really follow
the expected trends, but since the aquifer is so shallow, it is less influenced by geology than by
surface contaminants. Calcium is found in many construction materials and household products,
which when dissolved into rainwater could explain the elevated calcium levels in the Quaternary
Buried Artesian Aquifer.
Nitrate
The lack of a relationship between nitrate concentration and distance of the well from a
feedlot could be due to several factors. One possibility is that the infiltration time of the aquifers
we sampled was longer than some of the feedlots have been in operation, and therefore the
concentrations have not yet been reflected in-situ at the well site. Unfortunately, controlling for
infiltration time is difficult because it depends on many variables, elevation, aquifer depth, and
permeability of overriding strata. Another possible explanation is that the nitrate is extremely
mobile, and rather than accumulate in the areas that are sourcing the nitrate, it accumulates in
areas where ground and surface water are concentrating. This second explanation fits better with
our results also not showing a correlation to type of land cover, as most of the farms have been in
operation for the length of the aquifer infiltration times. In this case, the highest concentrations
of nitrate correspond to the locations of the cannon and straight rivers, which is the destination of
the potentiometric surface (and ultimately most of the ground water) in Rice County (Fig. 11).
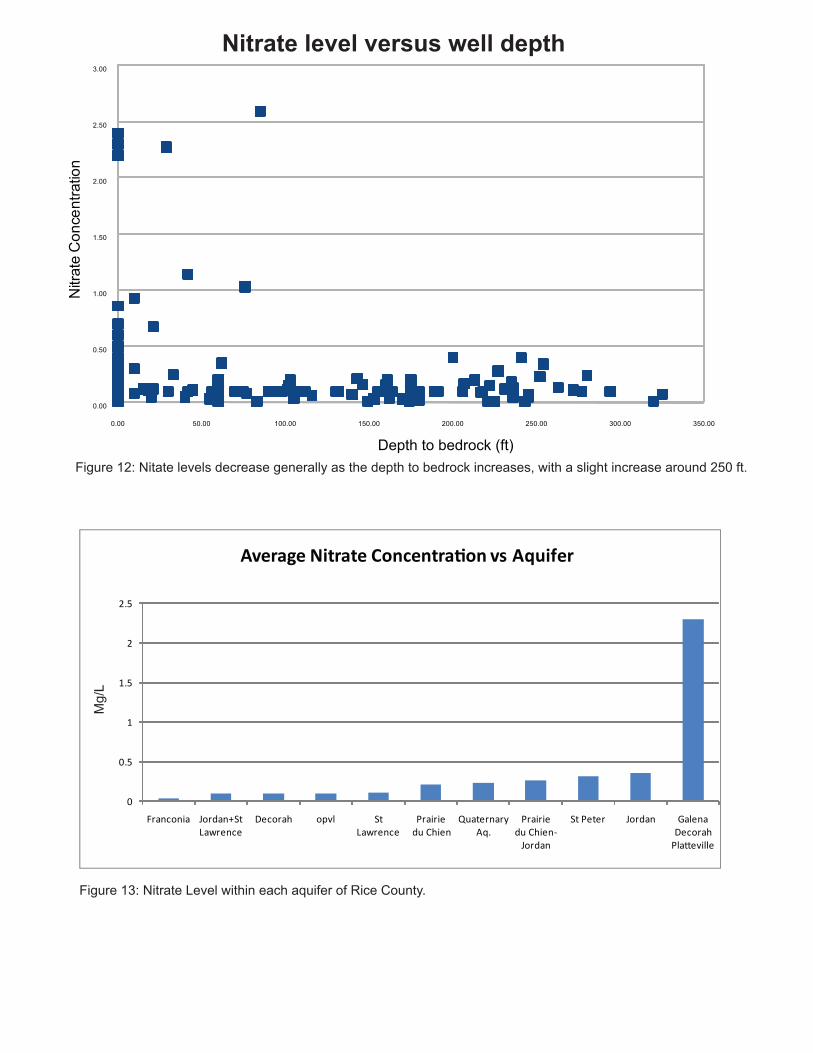
Previous studies have shown nitrate does not accumulate in aquifers that are below more
than 70 feet of sediment (MPCA, 1999). Our own results show only a single well above .5 mg/L

13
nitrate with more than 85 feet of overlaying strata (Fig. 12), though the general correlation
between nitrate concentration and depth to bedrock is extremely weak (r = .03).
The MPCA found the range of nitrate concentrations to be small within any given
aquifer, implying that the mobility of nitrates within aquifers is high (Fig. 13; MPCA, 1999). The
highest average concentrations of nitrate were found in the Galena-Decorah formation, in a well,
but only one well was tested. The second highest concentrations from our data were found in the
Jordan Aquifer. This agrees well with results from the MPCA showing the highest
concentrations of nitrate in the Jordan. In both studies, however, average nitrate concentrations in
the Jordan were still significantly below the health standard.
Our interpolation map agrees with the results of the 1999 MPCA study showing higher
concentrations in the east of the county (Fig. 14). The MPCA was not able to detect any
significant nitrate (values were less than 0.5 mg) in wells in the western two thirds of the county.
pH
Water pH is primarily controlled by a series of equilibrium reactions between water and
carbon dioxide, (see equations 3). These reactions show that the pH of water is positively
correlated to the amount of carbon dioxide the water is exposed to. An increase in CO2 increases
the concentration of H2CO3, which disassociates to form H+ ions (lowering the pH).
−+−
−+
+↔
+↔
↔+
233
332
3222
COHHCO
HCOHCOH
COHCOOH
(3)
The well water data shows a high pH in the northwest part of the county and a low pH in
the southeast part (Fig. 15). This is most likely due to interactions between the ground water and

14
the surface water through the large number of lakes in the western part of the county. These lakes
would be alkaline for two reasons. During the summer, there would be decreased concentrations
of CO2 due to plant productivity (i.e. photosynthesis), and in accord with Equation 3 this would
decrease the concentration of H+, and raise the pH. In the winter, this pH would remain high
because although plants are no longer consuming CO2, the water does not interact with the
atmosphere (an interaction that would decrease pH) because the surface is frozen (Bereket
Haileab, personal communication). Since the majority of the wells on the western part of the
county are shallow, they most likely have more interaction with the lakes at the surface, which
would explain their higher pH.
Iron
Iron is a naturally occurring element widely present in groundwater. It is gradually
released from soil and rocks, causing older aquifers to tend to have higher concentrations of iron
than younger aquifers. Iron concentrations are higher in igneous rocks, and lower in limestone
and dolomite (Minnesota Pollution Control Agency, 1999a). Iron concentrations in Rice County
were highest in the St. Peter and Prairie du Chien-Jordan aquifers. The Jordan formation has high
amounts of the iron-containing mineral glauconite, which could explain these elevated levels. In
the St. Peter, since iron concentrations are low (Odom, 1975), we believe higher concentrations
could be a result of anthropogenic sources. Common sources are the dissolution of ferrous well
pump components. There is no known health risk to dissolved iron in drinking water.
Arsenic and Lead
Lead is extremely immobile in soil and therefore has a low average concentration in
groundwater of less than 0.5 μg/L in southeast Minnesota (MPCA, 1999). All of the data
collected by the MPCA in Rice County was below the EPA health standard. The spatial

15
distribution of MPCA and DNR data throughout the county does not show a distinct pattern (Fig.
16). Arsenic occurs naturally in groundwater and concentrations are especially high in areas of
glacial clay deposit—a feature that characterizes western Minnesota much more than eastern
Minnesota (Minnesota DNR, 1995). As with lead, all of the Rice county wells analyzed by the
MPCA in their 2004 baseline study were below the standard for arsenic. The Spatial distribution
of MPCA and DNR arsenic data show the concentration of high values on the western margin of
the county, and an otherwise flat distribution of moderate value in the rest of the county with the
exception of a few low values in the center (Fig. 17).
CONCLUSIONS AND INTERPRETATIONS
The concentrations of various ionic species in the wells sampled were dependent on three
main factors: the direction of groundwater flow, the elemental composition of the aquifer, and
the depth of well casing. The direction of groundwater flow primarily influenced the
concentration of nitrate in the water. Nitrate is extremely mobile, and rather than accumulate in
the areas that are sourcing nitrate, it accumulates in areas where ground and surface water are
concentrating. The highest concentrations of nitrate correspond to the locations of the Cannon
and Straight Rivers, which are where the majority the groundwater in Rice County flows towards
(Fig. 11).
The concentration of calcium in the groundwater was directly affected by the carbonate
content of each aquifer. This explains why there is a higher calcium ion concentration in the
Prairie du Chien-Jordan Aquifer, since the Prairie du Chien is a carbonate unit. The calcium
concentrations measured in the other aquifers studied follow this trend as well. An exception is
the Quaternary Buried Artesian Aquifer, but this can be explained by the fact that these wells are

16
generally shallower and ground water in them is more likely to be affected by surface conditions
than by the composition of the aquifer.
The concentration of sodium and the pH of the groundwater deviated from our original
hypotheses, so we concluded that the well water was more influenced by interactions with the
surface than by other factors. For both pH and sodium, we expected higher levels in the southeast
but found higher levels in the west and northwest parts of the county. Because the wells in the
western part of the county are primarily shallow (Fig. 18), we believe the surface conditions
there were magnified, negating any contrary trends.
FUTURE WORK
The number of wells sampled for this study was restricted by time constraints. Aquifers
are unequally represented in this study. The aquifer with the largest sample pool, the Priaire du
Chien-Jordan aquifer (PDCJ) provided us with 21 wells, but most of the aquifers were
represented by only a few samples. Fewer wells were sampled in southeast corner of Rice
County than other areas. Sampling of additional wells would create a clearer picture of overall
groundwater trends in Rice County. Geochemistry data from aquifers poorly represented in this
study would further the understanding of the character of those aquifers. Conductivity and pH
data were not collected in the field at all sites, due to either human or machine error. Future
studies could include conductivity and pH data from more wells.
Chemical interference between calcium and phosphate could have affected the calcium
ion concentration data collected with the atomic absorption spectrometer. Future work on
calcium ion concentrations in Rice County well water should add lanthanum chloride solution to
the standard solutions to prevent the interference of phosphates from altering the data. Eleven
17
water samples were collected with the intent of conducting tritium analysis and nine well water
samples were collected for CFC analysis. Tritium and CFC tests on these samples could be run
because of time restraints. These tests could be conducted in the future in order to determine the
amount of exposure that people in Rice County have to tritium (which is radioactive) from their
drinking water, and to better constrain the recharge age of the groundwater in this region.
ACKNOWLEDGEMENTS
This project would not have been possible without the help of the Rice County residents
who allowed us to visit their homes and sample their well water. We would like to thank all
residents who gave us permission to sample water from their property, including those residents
who we did not have time to visit.
Funding for this project was provided by the Carleton College Geology Department. Rice
county well data was provided to us by the following groups: the Minnesota Pollution Control
Agency, the Minnesota Department of Natural Resources and the Southeast Minnesota Volunteer
Nitrate Monitoring Network project. A template for an introductory letter to mail to residents
was provided to us by Bruce Montgomery from the Minnesota Department of
Agriculture. Finally, we would like to thank Wei-Hsin Fu whose help with GIS was invaluable to
this project, as well as Tim Vick and Tsegaye Nega.

Rice County Elevation
High : 387.518 m
Low : 270.73 m
Figure 1: Elevation of Rice County. Note the visible drainage pattern of the Cannon river running from sounth west to north east. Also note the generally higher elelvation in the south east corner of the state. Modified from USGS national elevation dataset.

0 7 143.5
Kilometers
Land Usage in Rice County
Undeveloped
Farmland
Open Water
Developed
Figure 2. Land use cover within Rice County. Undeveloped land includes woods, prairie, and grass land. Farmland includes agricultural land and pasture lands. Developed land used for residential and comercial purposes or roadway. Open water includes lakes, streas, and rivers.

# Feedlots
Wells Sampled
Rice County Feed Lots
Figure 3: Cow, pig, poultry and other feed lots in Rice County.
9876543210
2.62.52.42.32.22.1
21.91.81.71.61.51.41.31.21.1
10.90.80.70.60.50.40.30.20.10
Nitrate Concentration vs # of Feedlots
# of Feedlots Within .5 Miles
Nitr
ate
Con
cent
ratio
n (m
g/l)
Figure 3b. Nitrate concentrations (mg/L) sampled from wells in Rice County plotted against the number of feedlots within a .5 mile radius. Data represents 158 wells sampled by the DNR, VNMN, the MPCA, and the Carleton College Geology Department.
2019181716151413121110987654321
2.62.52.42.32.22.12
1.91.81.71.61.51.41.31.21.11
0.90.80.70.60.50.40.30.20.10
Nitrate Concentration vs # of Feedlots
# of Feedlots Within 1 Mile
Nitr
ate
Con
cent
ratio
n (m
g/L)
Figure 3c. Nitrate concentrations (mg/L) sampled from wells in Rice County plotted against the number of feedlots within a 0.5 mile radius. Data repre-sents 158 wells sampled by the DNR, VNMN, the MPCA, and the Carleton College Geology Department.

Decorah - PlattevilleSt. Peter
St. LawrenceFranconia
Prairie du ChienJordan
Rock Unit:Galena
Surficial Geology of Rice County
Figure 4. Surfical geology of Rice County.

Figure 5. Diagram showing the stratigraphy of Southeastern Minnesota in during the Cambrian and Ordovician systems. The hydrologic units associated with these strata are also displayed next to the stratigraphy units (Adapted from Olcott, 1992)(Adolphson et al., 1981).
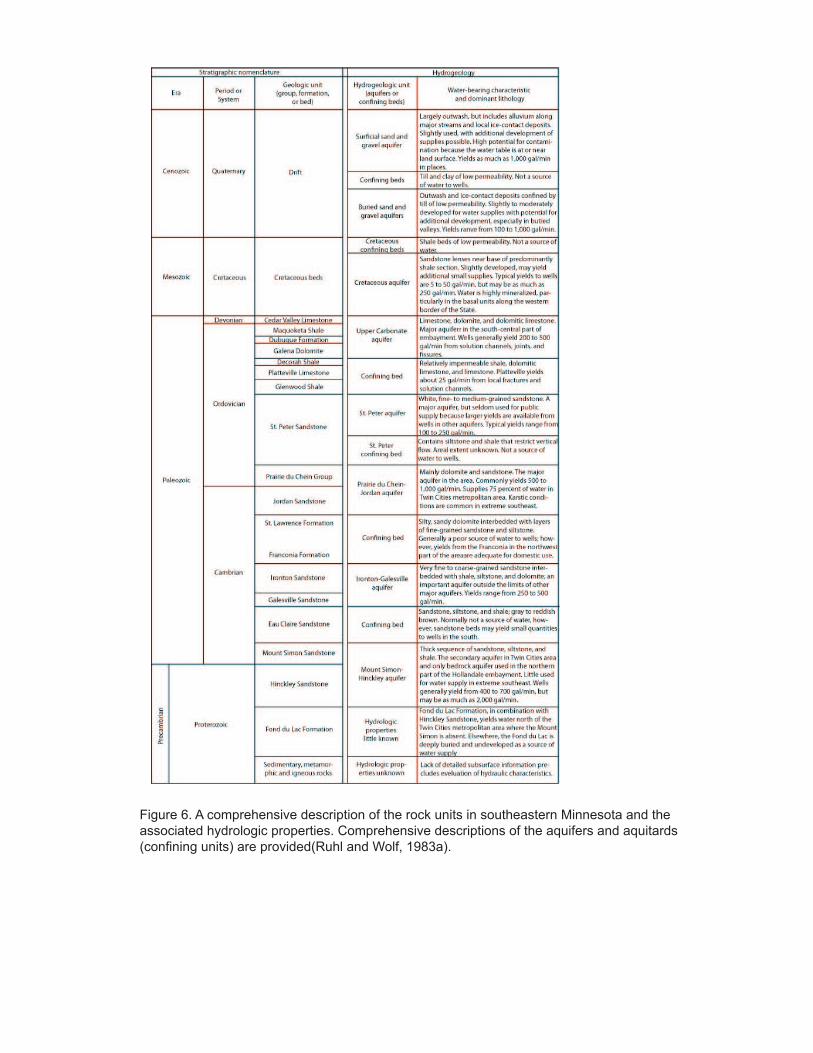
Figure 6. A comprehensive description of the rock units in southeastern Minnesota and the associated hydrologic properties. Comprehensive descriptions of the aquifers and aquitards (confining units) are provided(Ruhl and Wolf, 1983a).

Figure 6. An overview of the relevant aquifer systems and their associated depths in western and eastern Rice County. The stratigraphy of southeastern Minnesota is shown again for reference (Adapted from Olcott, 1992)(Olcott, 1992).

MN Pollution Control Agency DataMN Department of Natural Resources DataVolunteer Nitrate Monitoring Network Data2004 Carleton Well Survey Data
Galena Decorah PlattevilleSt. Peter
St. LawrenceFranconiaAny Quaternary Aq.
Prairie du ChienJordan
Previous Research Data: Aquifer:
Previous Research Data Sites
N
Figure 4. The map displays the locations for wells previously sampled in other research, with surficial bedrock geology mapped as well. Symbols designate the study which sampled the specific well, while colors designate the aquifer that the well draws water from.

Variable Mean Range Standard Deviation
Temp (C) 9.60 4.0 - 18 3.75
Conductivity (High) (µS) 693 370- 1045 181 Conductivity (Low) (µS) 504 400 - 700 175
pH 8.0 7.0 – 9.7 0.8
Ion Mean Range Standard Deviation
Health Risk Standard
Sodium .4 mg/L .1-1.7 mg/L .4 mg/L -- Calcium 1.8 mg/L .1-4.5 mg/L 0.8 mg/L -- Potassium .4 mg/L 0-1 mg/L .2 mg/L --
Iron 3.3 mg/L 0-13.6 mg/L 3.3 mg/L -- Nitrate .22 mg/L .02-2.24 mg/L .35 mg/L 10 mg/L
Table 1: Field Data Results
Table 2: Atomic Absorption Results

0.00
5.00
10.00
15.00
20.00
25.00
30.00
35.00
40.00
Franconia St. Peter Decorah Quaternary Prairie duChein
Prairie duChein /
Jordan
Jodan
Ave
rage
Ca
Conc
entr
ation
s (m
g/L)
Aquifer Code
Calcium Concentration by Aquifer
Figure 9: Calcium concentration (mg/L) within sampled aquifers in Rice County.

Figure 10. Stratigraphic column of Rice County with carbonate content and corresponding hydrological unit.

C’
C E
E’
Modified from MN DNR - Geologic Atlas of Rice County, MN
Potentiometric Surface, Groundwater Flow, and Aquifer
Thickness in Rice CountyScale 1:100 000
Contour Interval 50 feetDatum is mean sea level
5 km
0.00
0.50
1.00
1.50
2.00
2.50
3.00
0.00 50.00 100.00 150.00 200.00 250.00 300.00 350.00
Nitr
ate
Con
cent
ratio
n
Depth to bedrock (ft)
Nitrate level versus well depth
Figure 12: Nitate levels decrease generally as the depth to bedrock increases, with a slight increase around 250 ft.
Figure 13: Nitrate Level within each aquifer of Rice County.
0
0.5
1
1.5
2
2.5
Franconia Jordan+St Lawrence
Decorah opvl St Lawrence
Prairie du Chien
Quaternary Aq.
Prairie du Chien -
Jordan
St Peter Jordan Galena Decorah
Platteville
Average Nitrate Concentration vs Aquifer
Mg/
L

0.01 - 0.0888
0.0888 - 0.104
0.104 - 0.183
0.183 - 0.581
0.581 - 2.59
Predicted NitrateConcentrations (mg/L)
RMS Standardized Error: 1.176
Samples: 158
Figure 14. Interpolated groundwater nitrate concentration (mg/L) map of Rice County. Data represents 158 wells sampled by the DNR, VNMN, the MPCA, and the Carleton College Geology Department.
Nitrate ConcentrationMap

Figure 15. Interpolated groundwater pH map of Rice County. Results were classified with a quantile scheme. Data represents 158 wells sampled by the DNR, the MPCA, and the Carleton College Geology Department.
6.2 - 7.14
7.14 - 7.24
7.24 - 7.38
7.38 - 7.73
7.73 - 9.7
Predicted pH values
RMS Standardized Error: 0.9905
Samples: 106
pH Map

0.09 - 10.3
10.3 - 15.27
15.27 - 25.48
25.48 - 46.45
46.45 - 89.5
Predicted Pb Concentrations (ug/L)
RMS Standardized Error: 1.145
Samples: 58
Figure 16. Interpolated groundwater Pb concentration (ug/L) map of Rice County. Points represent sample locations. Data from the DNR and MPCA.
Lead Concentration Map

0.08 - 5.84
5.84 - 8.52
8.52 - 14.3
14.3 - 26.6
26.6 - 53.2
Predicted AsConcentrations (ug/L)
Figure 17. Interpolated groundwater As concentration (ug/L) map of Rice County. Points represent sample locations. Data from the DNR and MPCA.
RMS Standardized Error: 1.12
Samples: 58
Arsenic ConcentrationMap

Well Casing Depth0.00 - 35.0035.01 - 135.00135.01 - 270.00270.01 - 400.00400.01 - 1200.00
Rice County well casing depth
Figure 18. Well Casing depth of all wells within Rice County. Data is from the Minnesota County Well Index.

APPENDIX 1. Rice County Letter
Dear Rice County resident,
We need your help on an important project regarding your drinking water. In conjunction with the Geology Department at Carleton College, students in the Geochemistry of Natural Waters course taught by Dr. Haileab are conducting research in order to better understand the groundwater chemistry of Rice County.
Your participation will consist of granting Carleton students access to your well water in order for them to collect a few small samples. The information will be used in conjunction with data from other wells located throughout the county to draw conclusions about the state of groundwater in the region, which will finally be compiled in a report for the class. Rest assured that none of your personal information (name, address, etc.) will be included in this report. In return for allowing us access to your well, we promise to get back to you promptly with the results of our analysis of your groundwater, as well as our general findings for the county.
We will be calling you shortly after you receive this letter and, with your permission, figure out an appropriate time to stop by your property and briefly conduct our research.
Thank you very much for your assistance with our study. If you have any questions please feel free to contact us using the phone number or e‐mail address provided below.
Sincerely,
Students of the Geochemistry of Natural Waters class and Dr. Bereket Haileab
507‐222‐5746

18
REFERENCES CITED
Berg, R. R., 1954, Franconia Formation of Minnesota and Wisconsin: Geological Society of America Bulletin, v. 65, p. 857-&.
County, D., 2006, Dakota County Ambient Groundwater Quality Study.
DNR, M., 1995, Rice County Geologic Atlas: Minnesota Department of Natural Resources.
EPA, U. S., 2009, Drinking Water Contaminants U.S. Environmental Protection Agency.
Haileab, B., James, K., Knudson, K., Murphy, B., Ruthenburg, T., Schmitt, A., and Stalker, K., 2004, Characterizaton of Groundwater from Rice County, Minnesota, using CFC dating, Hydrogen and Oxygen Isotope Analysis, and Iron Concentrations: Northfield, Carleton College, p. 1-14.
Lewandowski, A. M., Montgomery, B. R., Rosen, C. J., and Moncrief, J. F., 2008, Groundwater nitrate contamination costs; a survey of private well owners: Journal of Soil and Water Conservation, v. 63, p. 153-161.
Minnesota Pollution Control Agency, E. O. D., 1999a, Iron in Minnesota’s Ground Water, in Minnesota Pollution Control Agency, E. O. D., ed.: Saint Paul, p. 2.
Minnesota Pollution Control Agency, E. O. D., Groundwater Monitoring & Assessment Program, 1999b, Barium, Beryllium, Calcium, Magnesium and Strontium in Minnesota's Ground Water, in Minnesota Pollution Control Agency, E. O. D., ed.: St. Paul, Minnesota Pollution Control Agency, p. 1-2.
MPCA, 1999, Baseline Water Quality of Minnesota’s Principal Aquifers - Region 5, Southeast Minnesota: Minnesota Pollution Control Agency.
Network, N. C. M., 2009, Southeast Minnesota Volunteer Nitrate Monitoring Network project - 2009 Report.
Odom, I. E., 1975, Feldspar-grain size relations in Cambrian arenites, upper Mississippi Valley: Journal of Sedimentary Petrology, v. 45, p. 636-650.
Ohio Department of Natural Resources, D. o. W., Water Resources Program, 1997, Ground Water Quality, in Ohio Department of Natural Resources, D. o. W., Water Resources Program, ed.: Division of Water Fact Sheet: Columbus, Ohio Department of Natural Resources, Division of Water Fact Sheet, p. 1-3.
Olcott, P. G., 1992, Ground Water Atlas of the United States: Iowa, Michigan, Minnesota, Wisconsin: HA 730-J, U.S. Geological Survey.
Ruhl, J., and Wolf, R., 1983a, Hydrogeologic and water-quality characteristics of the Prairie du Chein-Jordan aquifer, southeast Minnesota: U.S. Geological Survey Water-Resources Investigations Report 83-4045, U.S. Geological Survey.

19
-, 1983b, Hydrogeologic and water-quality characteristics of the St. Peter aquifer, southeast Minnesota: U.S. Geological Survey Water-Resources investigations report 83-4200, U.S. Geological Survey.
Runkel, A. C., 1994, Deposition of the Uppermost Cambrian (Croixan) Jordan Sandstone, and the nature of the Cambrian-Ordovician boundary in the Upper Mississippi Valley: Geological Society of America Bulletin, v. 106, p. 492-506.
Smith, G. L., Byers, C. W., and Dott, R. H., Jr., 1993, Sequence stratigraphy of the Lower Ordovician Prairie du Chien Group on the Wisconsin Arch and in the Michigan Basin: AAPG Bulletin, v. 77, p. 49-67.


![[PPT]PowerPoint Presentation - Groundwater - University of … 09.1... · Web viewGroundwater Fundamentals Module 9.1 Groundwater Groundwater Flow… Groundwater as a “slow” reservoir](https://static.fdocuments.us/doc/165x107/5af9fc2b7f8b9a44658e7b0a/pptpowerpoint-presentation-groundwater-university-of-091web-viewgroundwater.jpg)