Characterization - etec.energy.gov · Rocketdyne Environment, Health and Safety Organization ........
188
A4CM-AN4003 Rev. A March 30, 1994 Characterization anta Susana ield Laboratory Area I\( Rocketdyne Division Rockwell Intern tional Corporation
Transcript of Characterization - etec.energy.gov · Rocketdyne Environment, Health and Safety Organization ........

A4CM-AN4003 Rev. A
March 3 0 , 1994
Characterization
anta Susana ield Laboratory Area I\(
Rocketdyne Division Rockwell Intern tional Corporation


ENERGY TECHNOLOGY ENGINEERING CENTER No. A4CM-AN-0003 Rev. A
Page 1 of 180
Operated for the U. S. Department of Energy Orig. Date 10/05/93
Rocketdyne Division, Rockwell international Rev. Date
TITLE: Radiological Characterization PIan, Santa Susana Field Laboratory Area IV
1 /
Incorporate responses to corrtrncnts on Rev. NC. Updates survey block size and data analysis plan. Other minor changes.
Form 735-A-6 Rev 6-88 C/l\ieO
ApprovalIDate Rev. Revision
NC Initial issue. Issues as a separate document the radiological part of the Area IV Characterization Plan, ER-AN-0008, dated March 17, 1993. Incorporates responses to DOE comments on ER-AN-0008. Other minor changes.
On File

CONTENTS
1 . INTRODUCTION .................................................... 1.1 PURPOSE AND SCOPE ......................................... 1.2 PROJECTGOALS .............................................. 1.3 COMPLIANCE OBJECTIVES .................................... 1.4 PLANORGANIZATION ......................................... 1.5 REFERENCES .................................................
2 . SITE BACKGROUND AND SETTING . . . . . . . . . . . . . . . . . . . . . . . . . . . . . . . . . . 2.1 SITE DESCRIPTION . . . . . . . . . . . . . . . . . . . . . . . . . . . . . . . . . . . . . . . . . . . .
. . . . . . . . . . . . . . . . . . . . . . . . . . . . . . . . . . . . . . . . . . . . . . . . 2.1.1 Location
2.1.2 History of Operations in SSFL Area IV ........................ .................................. 2.1.2.1 Nuclear Reactors
2.1.2.2 Criticality Tests . . . . . . . . . . . . . . . . . . . . . . . . . . . . . . . . . . . . . . . . . . . . . . . . . . 2.1.2.3 Radioactive Material Handling Facilities
. . . . . . . . . . . . . . . . . . . . . . . . . . . . . . . . . . . 2.1.2.4 Other Locations
2.1.3 Water Disposal Systems . . . . . . . . . . . . . . . . . . . . . . . . . . . . . . . . . . . . 2.1.3.1 Sanitary Sewage System . . . . . . . . . . . . . . . . . . . . . . . . . . . . 2.1.3.2 Stonn Drainage System .............................
. . . . . . . . . . . . . . . . . . . . . . . . . . . . . . . . . . 2.1.4 Current Area IV Activities
. . . . . . . . . . . . . . . . . . . . 2.1.5 Interactions With Locations Outside Area IV
2.1.6 Applicable Orders and Regulations ........................... 2.2 PHYSICALSETI'ING ...........................................
2.2.1 Topography . . . . . . . . . . . . . . . . . . . . . . . . . . . . . . . . . . . . . . . . . . . . . . 2.2.2 Geoiogical Formations ..................................... 2.2.3 Hydrogeology . . . . . . . . . . . . . . . . . . . . . . . . . . . . . . . . . . . . . . . . . . . . 2.2.4 Area IV Hydrogeology .....................................
. . . . . . . . . . . . . . . . . . . . . . . . . . . . . . . . . . . . . . . . . . . . . . . . . 2.2.5 Climate
2.3 ENVIRONMENTAL RESOURCES . . . . . . . . . . . . . . . . . . . . . . . . . . . . . . . . 2.3.1 Flora . . . . . . . . . . . . . . . . . . . . . . . . . . . . . . . . . . . . . . . . . . . . . . . . . . . 2.3.2 Fauna . . . . . . . . . . . . . . . . . . . . . . . . . . . . . . . . . . . . . . . . . . . . . . . . . . .
. . . . . . . . . . . . . . . . . . . . 2.3.3 Critical Habitat and Sensitive Environments
2.3.4 LandUse ..........:..................................... 2.3.5 Human Resources ......................................... 2.3.6 Demographics . . . . . . . . . . . . . . . . . . . . . . . . . . . . . . . . . . . . . . . . . . . .
. . . . . . . . . . . . . . . . . . . . . . . . . . . . . . . . . . . 2.3.7 Archaeological Resources
....................................... 2.3.8 Historical Resources
2.4 RADIOLOGICAL SCREENING AREAS ............................ 2.4.1 SRE Drains . . . . . . . . . . . . . . . . . . . . . . . . . . . . . . . . . . . . . . . . . . . . . .

CONTENTS
................................ 2.4.2 Inactive Sanitary Leachfields .......... 2.4.3 Areas Surrounding the Former Sodium Disposal Facility
........................................ 2.4.4 Drainage Channels ........................................... 2.4.5 Building Areas
......................... 2.4.6 Drop Area of Depleted Uranium Slugs 2.4.7 SREPond ...............................................
2.5 REFERENCES . . . . . . . . . . . . . . . . . . . . . . . . . . . . . . . . . . . . . . . . . . . . . . . . . 3 . PLANRATIONALE . . . . . . . . . . . . . . . . . . . . . . . . . . . . . . . . . . . . . . . . . . . . . . . . .
. . . . . . . . . . . . . . . . . . . . . . . . . . . . . . . . . . . 3.1 DATA QUALITY OBJECTIVES ......................................... 3.2 CONCEPTUAL MODEL
3.3 REFERENCES ................................................. . . . . . . . . . . . . . . . . . . . . . . . . . . . . . . . . . . . . . . . . 4 . SUPPORTING INFORMATION
......................................... 4.1 PRIOR STUDIES . . . . . . . . . . . . . . . . . . . . . . . . . . . . . . . . 4.1.1 Area IV Radiological Survey
.................... 4.1.2 Soil and Shallow Groundwater Investigation .................................. 3.1.3 Pond Sediment Assessment
4.1.4 Decontamination and Decommissioning Closeout Surveys ......... . . . . . . . . . . . . . . . . . . . . . . . . . . . . . . . . . . . . . 4.1.5 Routine Soil Sampling . . . . . . . . . . . . . . . . . . . . . . . . . . . . . . . . . . . . . 4.1.6 Soil Sampling at RIHL
................................. 4.1.7 Soil Sampling at the NMDF 4.1.8 Naturally Occurring Radionuclides in Rock, Soils, and
Groundwater ............................................. 4.2 RELATEDACTIVITIES . . . . . . . . . . . . . . . . . . . . . . . . . . . . . . . . . . . . . . . . .
................ 4.2.1 Decontamination and Decommissioning Program ................................... 4.2.2 Remedial Action Program
. . . . . . . . . . . . . 4.2.3 SSFL Groundwater Characterization and Monitoring ...................... 4.2.4 Brandeis-Bardin Institute Sampling Study
........................... 4.2.4.1 Background Investigations ............................... 4.2.4.2 Ravine Investigations
4.3 REFERENCES ................................................. ......................................... 5 . CHARACTERIZATION PLAN
5.1 FIELDACTIVITIES ............................................ ................................ 5.1.1 Measurements and Sampling
................................... 5.1.1.1 Area IV Survey
................................... 5.1.1.2 Screening Areas ................................. . 5.1 1.3 Quality Assurance
5.1.2 Methodology ............................................. .................................... 5.1 -2.1 Field Locations
CONTENTS
. . . . . . . . 5.1.2.2 Ambient am& Radiation Survey Measurements ................................... 5.1.2.3 Radiation Scans
.................. 5.1.2.4 In Situ Soil Radiation Measurements ............................... 5.1.2.5 Surface Soil Samples
......................... 5.1.2.6 Subsurface Soil Samples .. ................................... 5.1.2.7 Water Sampling
................................ 5.1.2.8 Sediment Sampling ............................... 5.1.2.9 Geophysical Surveys
.......................... 5.1.2.10 Field Measurements of Soil ............................................ 5.2 SAMPLE ANALYSIS
5.3 DATAVALIDATION . . . . . . . . . . . . . . . . . . . . . . . . . . . . . . . . . . . . . . . . . . . . ........................... 5.3.1 Radiation Measurements Validation .......................... 5.3.2 Laboratory Analysis Data Validation
................................... 5.3.3 Validation Documentation
5.4 DATAMANAGEMENT .......................................... 5.5 DATAEVALUATION . . . . . . . . . . . . . . . . . . . . . . . . . . . . . . . . . . . . . . . . . . .
....................................... 5.5.1 Analytical Evaluation ........................................ 5.5.1.1 Data Sets
. . . . . . . . . . . . . . . . . . . . . . . . . . . . . . . . 5.5.1.2 Evaluation Methods . . . . . . . . . . . . . . . . . . . . . . . . . . 5.5.2 Nature and Extent of Contamination
5.6 REFERENCES .................................................. 6 . PROJECTMANAGEMENT . . . . . . . . . . . . . . . . . . . . . . . . . . . . . . . . . . . . . . . . . . .
6.1 S ITEWAGEMENT . . . . . . . . . . . . . . . . . . . . . . . . . . . . . . . . . . . . . . . . . . 6.2 PLANREVISIONS ............................................. 6.3 DOCUMENTMION . . . . . . . . . . . . . . . . . . . . . . . . . . . . . . . . . . . . . . . . . . . . .
. . . . . . . . . . . . . . . . . . . . . . . . . . . . . . . . . . . . . 6.3.1 Health and Safety Plan ............................... 6.3.2 Quality Assurance Project Plan
....................................... 6.3.3 Field Sampling Plan ............................... 6.3.4 Standard Operating Procedures
6.4 PROGRAMPLANNING . . . . . . . . . . . . . . . . . . . . . . . . . . . . . . . . . . . . . . . . . ................................... 6.5 REPORTING REQUIREMENTS
6.6 PROJECT SCHEDU .......................................... ........... APPENDIX A-SUMMARY OF KEY ORDERS AND REGULATIONS


FIGURES
2.10 . SSFL Site-Centered Demography to 16 krn. Showing Number of Persons .......................................... Living in Each Grid Area
2.11 . SSFL Site-Centered Demography to 80 krn, Showing Number of Persons Living in Each Grid Area (heavily populated areas are shown by shading) .... Locations of Inactive Sanitary Leachfields . . . . . . . . . . . . . . . . . . . . . . . . . . . . . Drop Zone for Depleted Uranium Slugs . . . . . . . . . . . . . . . . . . . . . . . . . . . . . . . DQOThree-Stageprocess . . . . . . . . . . . . . . . . . . . . . . . . . . . . . . . . . . . . . . . . .
. . . . . . . . . . . . . . . . . . . . . . . . . . . . . . . . . . . Conceptual Model Block Diagram
Aerial Photograph of SSFL and Surrounding Water Courses . . . . . . . . . . . . . . . Surface Water Pathways . Former Sodium Disposal Facility and ESADA Chemical Storage Yard . . . . . . . . . . . . . . . . . . . . . . . . . . . . . . . . . . . . . . . . . . . . Surface Water Pathways Building 056 Landfill . . . . . . . . . . . . . . . . . . . . . . . . . Surface Water Pathways . Northwest SNAP Area . . . . . . . . . . . . . . . . . . . . . . . Surface Water Pathways . RMDF . . . . . . . . . . . . . . . . . . . . . . . . . . . . . . . . . . . . Photograph Showing the Surface Water Drainage Courses from the
. . . . . . . . . . . . . . . . . . . . . . . Building 059 Area and RMDF Area North Slopes
Surface Water Pathways . SRE . . . . . . . . . . . . . . . . . . . . . . . . . . . . . . . . . . . . . . Surface Water Pathways . Old Conservation Yard . . . . . . . . . . . . . . . . . . . . . . . SRE Pond Sump Pump Discharge Flow Path (Pond to Discharge
. . . . . . . . . . . . . . . . . . . . . . . . . . . . . . . . . . . . . . . . . . . . . . . . . . . Piping Outlet)
SRE Pond Sump Pump Discharge Flow Path (Discharge Piping Outlet to SilvernalePond) ................................................. Surface Water Pathways . Southeast Section of Area IV (West) ............ Surface Water Pathways . Southeast Section of Area IV (East) . . . . . . . . . . . . .
. . . . . . . . . . . . . . . . . . . . . . . . . . . Surface Water Pathways . Southeast Area IV
Ambient Gamma Dose Rates at the Rocketdyne Barrel Storage Yard ........ Ambient Gamma Dose Rates in Building 064 Storage Yard ...............
............................... Soil Sampling Locations . Building 005
Soil Sampling Locations . Building 030 . . . . . . . . . . . . . . . . . . . . . . . . . . . . . . . . . . . . . . . . . . . . . . . . . . . . . . Soil Sampling Locations . Old Conservation Yard
. . . . . . . . . . . . . . . . . . . . . . . . . . Soil Sampling Locations . RMDF Leachfield
Soil and Shallow Groundwater Sampling Locations . Old Conservation Yard . . . . . . . . . . . . . . . . . . . . . . . . . . . . . . . . . . . . . . . . . . . . . . . . . . . . . . . . . . . Soil and Shallow Groundwater Sampling Locations . Hazardous Waste
. . . . . . . . . . . . . . . . . . . . . . . . . . . . . . . . . . . . . . . . . . . . . . . . TreatmentFacility . . . . . . . . . . . . . . . . . . . . . . . . . . . . Sediment Sampling Locations . SRE Pond
SRE Facilities Regions for Decontamination and Decommissioning ......... Sanitary and Storm Sewer Sample Locations . . . . . . . . . . . . . . . . . . . . . . . . . . .
. . . . . . . . . . . . . . . . . . . . . Routine Soil Sampling Locations in Area I11 and IV
vii -U

FIGURES
Sampling Locations for Investigation of Naturally Occurring Radionuclides . . Locations of Background Sampling Areas .........................
................................. RMDF Watershed Sample Locations ............................. Building 059 Watershed Sample Locations
Former Sodium Disposal Facility Watershed Sample Locations . . . . . . . . . . . . ................................... SRE Watershed Sample Locations
................................. Areas Characterized by Other Studies
. . . . . . . . . . . . . . . . . . . . . . . Example of Division of Area IV into Survey Cells
Sampling Locations . Inactive Sanitary Leachfield (Bldg 009) . . . . . . . . . . . . . Sampling Locations . Areas Surrounding the Former Sodium Disposal Facility .........................................................
. . . . . . . . . . . . . . . . . . . . . Sampling Locations - SRE Pond Drainage Channel
Sampling Locations - Old Conservation Yard Drainage (North) ............ Sampling Locations - Old Conservation Yard Drainage Channels (South) . . . .
. . . . . . . . . . . . . . . . . . . . . Sampling Locations - 17th Street Drainage Channel
..................... Sampling Locations - Southeast Drainage Channels
............................. Derivation of Cumulative Probability Plot
Contour Point Map Illustrating Radiation Field Surrounding the Radioactive .......................................... Material Disposal Facility
. . . . . . . . . . . . . . . . . . . . . . . . Rockwell International/Rocketdyne Organization
Energy Technology Engineering Center Organization .................... Rocketdyne Environment, Health and Safety Organization ................
. . . . . . . . . . . . . . . . . . . . . . . . . . SSFL Area IV Site Characterization Schedule
A4CM-AN-0003 viii

1. INTRODUCTION
1.1 PURPOSE AND SCOPE
In March 1987, the Department of Energy (DOE) established a nationwide Environmental
Restoration (EII) program to address environmental cleanup requirements at its facilities. Energy
Technology Engineering Center (ETEC) and other facilities in Area IV of the Rockwell
International Santa Susana Field Laboratory (SSFL) have been operated for DOE by Rockwell
International and are subject to DOE'S ER program. There has been an extensive environmental
monitoring program for Area IV since nuclear-related activities were begun at the site in the 1950s,
and an active cleanup program has been ongoing at the site since the 1970s. These programs have
addressed known sources of radioactive contamination. As an important step in the ER program, a
more comprehensive determination of the Area IV radiological contamination status must be
performed.
The purpose of this document is to define the plan for completing radiological characterization
cf Area IV. Data previously obtained during Area IV radi~logical studies are summarized. Related
programs that will provide additional radiological characterization information are described. The
measurement and sampling plan is provided for areas where radiological characterization will not be
completed by the related activities.
The scope of the plan defined.in this document is described below.
e Type of characterization. ThispIan addresses radiological contamination only. Chemical characterization is being addressed separately as part of the Resource Conservation and Recovery Act (RCRA) regulatory process for all areas of SSFL, under the regulatory authority of the California Environmental Protec- tion Agency (Cal-EPA), Department of Toxic Substance Control.
e Specific areas included. Specific areas with the potential for radiological con- tamination on the basis of past activities are covered by this plan if they are not covered by another program. Most facilities that would otherwise be included in this plan have been (or are in the process of being) remediated and shown to be clean as part of the decontamination and decommissioning (D&D) program. Some areas will be covered in the remedial action progr-am. These related pro- grams are described in Section 4.2. The remaining specific areas covered by this plan are described in Section 2.4.
e Supplemental investigation. The scope of this plan includes a systematic survey of Area IV to ensure that any migration of radiological materials from specific facilities will be detected. Areas that have been covered by a prior or planned systematic survey will not be included in this plan. Prior surveys are described in Section 4.1. Surveys planned outside the scope of this plan are described in Section 4.2.

e Environmental media. The scope of this plan includes investigation of surface and near-surface soil, standing water, and ambient gamma radiation. Other media (ground water and surface effluent) are covered by related programs described in Section 4.2.
1.2 PROJECT GOALS
The goal of this plan is to support the Iong-tern1 goals for restoring the environment in Area IV.
The goals concerning radioactivity were stated in the DOE 5-year plan (Ref. 1-1) as follows:
o Remove radioactive contan~ination from the site as necessary to satisfy limits on radiation dose to the public.
Discontinue use of radioactive materials (with the exception of nondestructive examination sources) in planned future activities.
The following goals were set to be accomplished by 1997:
e Decommission all radioactive facilities at SSFL except Building 024.
0 Complete corrective activities and maintain compliance.
These goals will be supported by characterization of radioactivity in Area 1V in accordance with
the plan. This information is intended to verify that no above-limit contamination exists in Area IV
that is not scheduled for remediation, or to identify such contamination if present. to support plan-
ning for remediation.
1.3 COMPLIANCE OBJECTIVES
This plan is intended to locate and characterize areas of elevated radioactivity to guide com-
pliance with requirements for environmental monitoring and remediation. The DOE environmental
monitoring program for DOE facilities, defined in DOE 5400.1 (General Environmental Protection
Program), requires establishment of a baseline of environmental quality as provided by this plan.
Areas of elevated radioactivity identified by this plan will provide the basis for a remediation study.
Coordination of Area IV information with interested regulatory agencies (and with the local
community) is provided through Rocketdyne participation in the SSFL Work Group, an ad hoc affili-
ation of federal, state, and local regulatory agencies having regulatory jurisdiction or oversight
responsibilities for the SSFL site, along with representatives of neighboring communities. Only
DOE has responsibility for this plan, but it is provided tomembers of the SSFL Work Group to permit
community review. The SSFL Work Group meets regularly to share information regarding
environmental issues related to the SSFL, although it is neither adecision-making body nor an advi-
sory committee. Membership in the SSFL Work Group does not affect any agency's regulatory

jurisdiction or responsibiIities, nor does i t extend the regulatory or decision-making authority of any
member. The regulatory agencies represented on the SSFL Work Group include:
1. Cal-EPA, Department of Toxic Substances Control
2. California Department of Health Services
3. California Regional Water Quality Control Board, Los Angeles Region
5. U. S. DOE, Oakland Operations Office
6. U. S. Environmental Protection Agency, Region IX.
1.4 PLAN ORGANIZATION
The plan is divided into six sections:
0 Section 1.0, Introduction, provides the purpose, scope, and objectives of the plan.
o Section 2.0, Site Background and Setting, provides a description of Area IV and activities conducted there, its physical setting, and environmental consider- ations. This section includes a description of areas categorized as screening areas.
0 Section 3.0, Plan Rationale, describes data quality objectives and conceptual models of the water flowpaths through which contaminants could be trans- ported.
Section 4.0, Supporting Information, summarizes the results of previous stud- ies, which have provided information about the radiological status of Area IV. It also describes other programs related to this plan and help to define its scope.
o Section 5.0, Characterization Plan, defines the activities by which Area IV char- acterization will be accomplished. It covers the activities for measurements and sampling in the field, sample analysis, data validation, data management, and data evaluation.
o Section 6.0, Project Management, provides details on project management of the plan.
1.5 REFERENCES
1-1. FYP DOEJS-0089, "Environmental Restoration and Waste Management, Five-Year Plan, Fiscal Years 1993- 1997" (August 199 1 )

This page intentionally left blank.
2. SITE BACKGROUND AND SETTING
2.1 SITE DESCRIPTION
2.1.1 Location
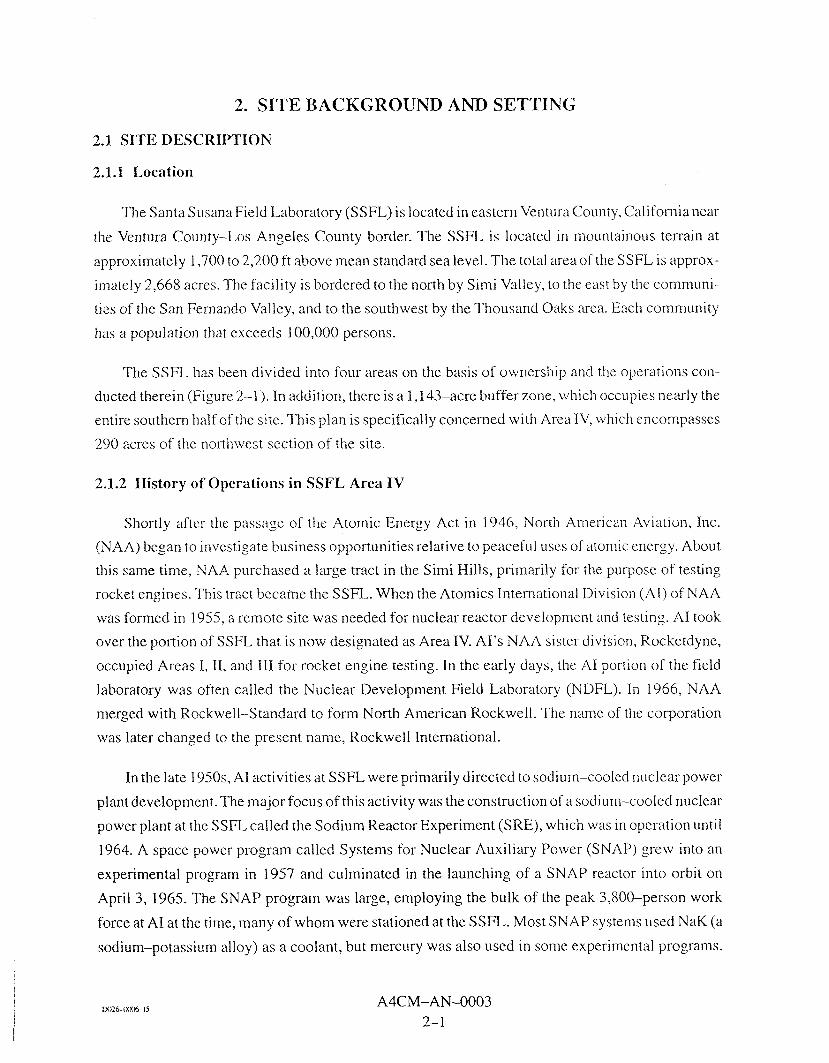
The Santa Susana Field Laboratory (SSFL) is located in eastern Ventura County, California near
the Ventura County-Los Angeles County border. The SSFL is located in mountainous terrain at
approximately 1,700 to 2,200 ft above mean standard sea level. The total area of the SSFL is approx-
imately 2,668 acres. The facility is bordered to the north by Simi Valley, to the east by the communi-
ties of the San Fernando Valley, and to the southwest by the Thousand Oaks area. Each community
has a population that exceeds 1 00,000 persons.
The SSFL has been divided into four areas on the basis of ownership and the operations con-
ducted therein (Figure 2-1). In addition, there is a 1,143-acre buffer zone, which occupies nearly the
entire southern half of the site. This plan is specifically concerned with Area IV, which encompasses
290 acres of the northwest section of the site.
2.1.2 History of Operations in SSFL Area IV
Shortly after the passage of the Atomic Energy Act in 1946, North American Aviation, Inc.
(NAA) began to investigate business opportunities relative to peaceful uses of atomic energy. About
this same time, NAA purchased a large tract in the Simi Hills, primarily for the purpose of testing
rocket engines. This tract became the SSFL. When the Atomics International Division (AI) of NAA
was formed in 1955, a remote site was needed for nuclear reactor development and testing. A1 took
over the portion of SSFL that is now designated as Area IV. AI's NAA sister division, Rocketdyne,
occupied Areas I, 11, and I11 for rocket engine testing. In the early days, the A1 portion of the field
laboratory was often called the Nuclear Development Field Laboratory (NDFL). In 1966, NAA
merged with Rockwell-Standard to form North American Rockwell. The name of the corporation
was later changed to the present name, Rockwell International.
In the late 1950s, A1 activities at S S m were primarily directed to sodium-cooled nuclear power
plant development. The major focus of this activity was the construction of a sodium-cooled nucIear
power plant at the SSFL called the Sodium Reactor Experiment (SRE), which was in operation untiI
1964. A space power program called Systems for Nuclear Auxiliary Power (SNAP) grew into an
experimental program in 1957 and culminated in the launching of a SNAP reactor into orbit on
April 3, 1965. The SNAP program was large, employing the bulk of the peak 3,800-person work
force at A1 at the time, many of whom were stationed at the SSFL. Most SNAP systems used NaK (a
sodium-potassium alloy) as a coolant, but mercury was also used in some experimental programs.

After the launch, the SNAP program rapidly decreased in scope, and the labor force in Area IV
underwent a corresponding decrease in size.
In 1966, part of Area IV was organized as the Liquid Metal Engineering Center (LMEC) by the
Atomic Energy Commission (AEC) to perform developmental work with liquid metals (primarily
sodium) as heat transfer media for advanced nuclear reactors. The LMEC was operated by A1 for
AEC. The LMEC developmental work consisted of nonnuclear testing of components. All nuclear
operations and special-purpose SNAP facilities were retained by AI, although much of the nuclear
work had already been phased out. In 1978, as liquid metal nuclear power development activities
declined, the charter of the LMEC was expanded to cover general energy-related technology (e.g.,
solar and geothermal energy) and it was renamed the Energy Technology Engineering Center
(ETEC). About the same time, A1 was reorganized and renamed the Energy Systems Group (ESG).
In 1984, ESG (including ETEC) was merged into the Rocketdyne Division of Rockwell Internation-
al. Since then, Rocketdyne has operated all parts of SSFL.
By the mid-1 WOs, operations had ended at all nuclear reactors and most other nuclear facilities;
LMEC nonnuclear work then dominated Area IV. The first integrated nuclear facilities D&D plan
for Area IV was released in January 1975. The plan covered eight facilities, primarily the SRE and
associated facilities. and old facilities associated with the by-then-discontinued SNAP programs.
As environmental concerns developed, tasks to treat and dispose of nonradioactive contaminants
were added to the remediation plan. D&D activities have continued to the present. Over 90% of the
facilities have been cleaned, with over 99% of the radioactivity removed (Ref. 2-1).
The AEC was the federal agency responsible for both development and regulation of nuclear
programs until 1975, when these two responsibilities were separated. Nuclear development became
the responsibility of the Energy Research and Development Administration (ERDA), while the reg-
ulatory responsibility was given to the Nuclear Regulatory Commission (NRC). In 1977, ERDA was
included in the Department of Energy (DOE) when that department was formed. Since then, DOE
and NRC have operated in parallel. Both organizations continue to be involved in the ongoing opera-
tions in Area IV; NRC as regulator for the one remaining NRC-licensed facility (Rockwell Interna-
tional Hot Laboratory [RIHL]), and DOE as owner of most of the Area IV facilities. The San
Francisco field office of DOE now has oversight responsibility for ETEC and other DOE facilities at
SSFL.
The last nuclear fuel materials were shipped from the site in May 1989. In October 1989, the
NRC Special Nuclear Materials License was amended to permit only a minor amount of nuclear

\
VENTURA COUNTY LOS ANGELES
AREA IV
NORTHRIDGE
WEST HILLS
- - - - - - - - - - -
# @ WESTLAKE
/
,/'
ANTA AIONICA
6786-1
PACIFIC OCEAN Santa Susana Field 1,aboratories
This page intentionally left blank.

material for research purposes. Since then, the license has been further amended to permit only
decommissioning operations.
Operations in Area IV were in or associated with many facilities and areas. The locations of faci-
lities and areas of radiological interest are shown in Figure 2-2. The subsections below describe
those locations covered by the decontamination and decon~missioning (D&D) and the remedial
action programs. This information is provided principally as background information. The plan does
not address these locations themselves, but in some cases includes investigation of areas associated
with them (e.g.. sanitary leachfields and areas surrounding buildings). The screening areas covered
by this plan are identified in Figure 2-2 and are described in Section 2.4.
2.1.2.1 Nuclear Reactors
In the early 1960s, with the activation of several SNAP facilities and experimental facilities in
support of power plant programs, A1 had the following operating reactor facilities in Area IV:
Sodium Reactor Experiment (SRE) - Building 143
SNAP-8 Developmental Reactor (S8DR) - Building 059
Kinetics Experiment Water Boiler Reactor (KEWB) - Building 073
L-85 (AE-6) Research Reactor - Building 093
SNAP Experimental Reactor (SER), later replaced by the SNAP-8 Experimen- tal Reactor (S8ER) - Building 01 0
SNAP-2 Developmental Reactor (S2DR) and the SNAP-] 0 Flight Simulation Reactor (S IOFSR) - Building 024
e Shield Test Reactor (STR), later modified to become the Shield Test and Irradi- ation Reactor (STIR) - Building 028.
Operations of the earliest of these reactors (KEWB) began in 1956. Operations of all had ended
by 1972, except for intermittent low-power operation of the L-85 through 1780. A further
description and operating history is given in Reference 2-1.
2.1.2.2 Criticality Tests
Various critical assembly tests (self-sustaining neutron chain reactions, but with no heat genera-
tion) were conducted in Buildings 009, 012, 019, 100, and 373. Operation of the earliest of these
critical assemblies (Bldg 373) began in 1957. Operation of all ended by 1974. A further description
and operating history is given in Reference 2-1.

2.1.2.3 Radioactive Material Handling Facilities
The other facilities where nuclear materials were handled are the following:
e Rockwell International Hot Laboratory (RIHL) - Building 020. This was pri- marily a remote handling facility for examination of highly radioactive material; it is now undergoing D&D.
e Radioactive Materials Disposal Facility (RMDF) - Buildings 021, 022, 075, 621, and 688. This is a facility for receipt, storage, and disposal of radioactive materials. It is still in operation for processing materials from DSLD operations in Area IV.
e Engineering Test Building (ETB) - Building 003. This was a facility for devel- opmental tests of reactor components in support of the SRE. It included a remote handling facility for research on reprocessing used reactor fuel. D&D was com- pleted in 1982.
e Nuclear Materials Development Facility (NMDF) - Building 055. This was a facility for developmental work on fabrication of reactor fuel assenlblies con- taining plutonium. Operations ended in 1979. D&D was completed in 1986.
e Uranium Carbide Fuel Fabrication - Building 005. A uranium carbide fuel manufacturing pilot plant was operated in this building during 1967. D&D is complete except for a drain line adjacent to the building.
e Nuclear Storage Vault - Building 064. This facility was used to receive, store, and ship nuclear materials used in Area IV operations. There are no longer such operations, and the facility is no longer in service. D&D has been completed.
e Reactive Metals Storage Facility - Building 029. This facility is the storage area for the Hazardous Waste Management Facility and does not have radioactive materials. Previously, however, the building was the Radiation Measurements Facility, in which radioactive sources were stored and used to calibrate radiation detection instruments. D&D was completed after termination of this use.
A more detailed description of these facilities can be found in Reference 2-1.
2.1.2.4 Other Locations
2.1.2.4.1 Building 030
Building 030 is a 2,300-ft2 building constructed in 1958 as a particle accelerator facility. A Van
deGraaf accelerator was in the particle accelerator rooms of the building from 1960 through 1964.
The accelerator was removed after 1966. Contamination from the accelerator tritium target was
removed, and the facility was cleared for other uses.

Santa Susana Field Laboratory Area IV Engineering Test Building (003) @)@) @
Categories of Facilities and Areas
a Nuclesr Reactors
@ Criticaltty Tests
@) Radioactive Material Handling Facilities
@ iI SNAP Critical Facility (373) @ @ @
Deployed
Hot Laboratory (020)@@ @
Laboratory (363) @ @
Figure 2-2. Areas of Ra Interest in Area IV
@ Other Locations
* 8 SRE Drains
* @ Buildings Formerly Served by Sanitary Leachfields
* @ Areas :Surrounding Former Sodium Disposal Facility
* @ Draina,ie Channels
@ Draina~e Channels
* @ Buildinijs in which Radioactive Materials were used
* @ Test Area
* @ SRE P,md
*Screening Areas

This page intentionally left blank.

2.1.2.4.2 Old Conservation Yard
The Old Conservation Yard is an approximately 300-ft by 400-ft area located in the northeast
section of Area 1V. It was used from 1952 until 1977 as an impound area for excess salvageable ma-
terials pending reuse at the site or disposal to a salvage contractor. In 1977, materials remaining in the
yard were relocated to the New Conservation Yard. The Old Conservation Yard is now clear of
debsis.
A spill of mixed-fission-product-contaminated liquid occurred in the Rocketdyne Barrel Stor-
age Yard section of the Old Conservation Yard. Contamination of a small area in the southwest cor-
ner of the lot was indicated by detection during the Area IV radiological survey (described in Section
4.1.1) of an above-ambient gamma radiation background level. Contaminated soil was removed and
the area was resurveyed to verify that the remaining contamination was within limits.
2.1.3 \Vater Disposal Systems
2.1.3.1 Sanitary S e l ~ q y System
The SSFL is located in an unsewered area of Ventura County, and therefore provides its own
sanitary sewage system. Originally, the system was leachfields near facilities. In 1960, a sewage
treatment plant was installed in SSFL Area 111, and a piping system instaIIed to collect Area IV sani-
tary savage and transport it to the treatment plant. The Area IV sewage system is shown in Fig-
ure 2-3. All Area IV facilities were designed to collect and dispose of potentially radioactive wastes
separately from sanitary sewage.
2.1.3.2 Storm Drainage System
The natural terrain of the SSFL directs about 10% of storm waters north into Simi Valley. All
other storm waters are directed into lined and unlined channels, which drain into collection ponds.
By policy and design, all industrial waters are discharged to the south through the SSFL system of
culverts and open drainage channels. Surface waters flowing from Area IV to the south are collected
in the ponds, for reuse or release into Bell Canyon. Surface water discharges from S S E are under the
jurisdiction of the Los Angeles Regional Water Qilality Board. The Area IV storm drainage system is
shown in Figure 2-4.

This page intent ional ly left blank.

6650-3
Figure 2-3. A

This page intentionally left blank.

. Area IV Stor Drain System

This page intentionally left blank.

2.1.4 Current Area IV Activities
The only Area IV activities involving radioactivity are D&D activities, principally at the former
Sodium Disposal Facility, the RIHL, and Building 059, and operation of the RMDF for processing of
radioactive waste for shipment. Most current activities in Area IV are nonnuclear component testing
being conducted by ETEC. The major current nonnuclear program is steam generator testing at the
Sodium Components Test Installation (SCTI). SCTI and its associated cogeneration facilities (Pow-
er Pak and the Kalina Cycle Demonstration Plant) have been operating most of the year, with only a
short shutdown in the winter months for modifications and maintenance. Power is provided by two
35-MWt natural gas-fired heaters.
There are no n~lclear programs operating or planned for the future.
2.1.5 Interactions With Locations Outside Area IV
There is no evidence that any radiological contamination within Area IV has mi~rated to other
areas within the SSFL boundaries. The stonn drainage system previously described does roctte sur-
face water to the collection ponds in Area 111. but no nonnatural radiological contamination has been
found in the ponds. Groundwater in the rock (Chatsworth formation) underlying Area IV east and
south of the groundwater divide (Figure 2-5) also flows toward Area 111. The absence of nonnatural
radiological contan~ination in the deep wells in that groundwater flowpath is indication that contami-
nation from Area IV is not moving toward Area 111.
Surface water and groundwater north\vest of the divide in Area IV (Figures 2-5 and 2-6) flow
off-site across the Area IV boundary. Tritium has been detected in deep wells at the northwest
boundary of Area IV. The concentrations are low, but above background. The occurrence of tritium
is attributed to its production by absorption by lithium (impurity in concrete) of neutrons from nu-
clear facilities (Ref. 2-3). No other nonnatural radiological contamination has been detected in
water flowing across the northwest boundary.
2.1.6 Applicable Orders and Regulations
The orders and regulations that govern environmental activities in Area IV are summarized in
Appendix A.

This page intentionally left blank.

Explanation
Fault. Fracture. or Joint
e RD-1, HAR-1 Chatsworth Formation Wells
p ' 0s-3 Offsite Water Source
a WS-5 Water Supply Well (1 390.45) Water level elevation , feet MSL.
measured March 1992
----. Contour of equal water level elevation in feet MSL. Chatsworth Formation
Approximate direction of lateral groundwater movement
I Approximate location of groundwater divide
(Chatsworth Formation Grourldwater System) (March 1992)

This page intentionally left blank.
Figure 2-6. Surface

This page intentionally left blank.

2.2 PHYSICAL SETTING
2.2.1 Topography
The topography of SSFL is characterized by a series of branching canyons in the eastern and
central postion and by the extended level area in the western portion (Area IV). The general topogra-
phy, including the above surface drainage features, is shown in Figure 2-6.
Most of SSFL is located within the Bell Creek drainage system, a tributary of the Los Angeles
River. Surface water runoff and treated sewage effluent is discharged to Bell Creek from two collec-
tion ponds, both of which are covered by a National Pollutant Discharge Elimination System
(NPDES) discharge permit.
A small portion of storm water from Area IV drains toward Meier and Runkle Creeks to the
nor-thwest of the SSFL. These creeks are a part of the Santa ClaraRiver basin. Rainfall runoff to then?
from SSFL during storm conditions is also monitored in accordance with NPDES requirements.
2.2.2 Geological Formations
A geological map of SSFL is presented in Figure 2-7, which shows topography as well as the
known faults and fractures. The Simi Hills. in which SSFL is located, are mainly exposures of the
Chatsworth formation, which is a marine formation composed primarily of sandstone with
interbedded shales and minor lens-shaped conglomerates. Exposures of the formation are
characterized by massive sandstone beds. which dip to the northwest at approximately 20 to 30 deg.
The Chatsworth formation has well-developed fractures and joints in portions of the SSFL, and is
overlain in some areas by a thin layer of discontinuous Quarternary alluvium, primarily in Area IV
and along the ephemeral drainages. The alluvium in some areas may be as much as 20 ft thick. It
consists of unconsolidated sand, silt, and clay.
The Tertiary Martinez formation overlies the Chatsworth formation northwest of the SSFL
boundary and south of the Burro Flats Fault. It is composed of bedded marine sandstones and shtiles
with a basal conglomerate. North of SSFL, the Martinez formation dips to the northwest at approxi-
mately 30 to 35 deg. The Tertiary Topanga formation is exposed southwest of the facility boundary. It
is composed of bedded marine sandstone with a basal conglomerate. Both theTopanga and Martinez
formations weather to form slopes, while the Chatsworth fommtion is a very resistant unit that
erodes along fracture or fault traces.
The water-bearing formations under the SSFL are cliaracterized by a shallow, discontinuous
zone in the surficial alluviun~ and a deeper groundwater system in the fractured Chatsworth forma-
tion. Water supply wells were drilled into the Chatsworth formation in the 1950s to provide indus-
trial water for site use. When chemical contamination was found in this water in the 1980s, an exten-
sive characterization and monitoring program was begun. At the end of 1993,92 shallow zone wells,
85 deep zone wells, 13 water supply wells, and 16 off-site wells and springs are periodically moni-
tored for water quality and to provide hydrogeological data. An additional 22 wells ar-e approved and
being installed. Also, a groundwater reclamation system has been in operation since 1987; approxi-
mately 827-million gal had been treated through the end of 1993, primarily from wells in Areas I, 11,
and 111 of SSFL.
2.2.4 Area IV Hydrogeology
Thirty-four wells have been drilled in and adjacent to Area IV to monitor groundwater. There
are also six off-site water sources (wells and springs) in the vicinity of Area IV. Well locations are
shown in Figure 2-8. Nine shallow zone monitoring wells have been drilled in Area IV. Only four of
these wells (RS-1 I , RS-I 8, RS-28, and ES-3 1 ) have yielded useful data. Wells RS-1 I and ES-31
are located adjacent to a main unlined drainage channel in the south central section of Area IV and
groundwater is always present; however, no radiological contamination has been detected. Well
RS-18 is located in the surface water drainage path from the former Sodium Disposal Facility and
also contains no rediological contamination. Well RS-28 is located near the RMDF leachfield and is
not radiologically contaminated. The other five shallow zone wells in Area IV are consistently dry.
There are cu~rently 19 Chatsworth formation wells within Area IV and six wells (two 3-well
clusters) immediately adjacent off-site to the northwest. During pumping tests, the low yield of
these wells, compared to those in other areas of the SSFL, suggests that the density and width-open-
ing of fractures are low. The groundwater appears to occur under confined conditions, as evidenced
by the fact that static water levels are typically in excess of 100 ft higher than the initial depth at
which the first groundwater was encountered during drilling operations. Static water-level eleva-
tions suggest that a groundwater divide occurs along the central section of Area IV, as depicted in
Figure 2-5.
Groundwater flow in the Chatsworth formation is controlled by fracture patterns. The
peneability of unfractured Chatsworth formation rock appears to be sufficiently low as to be
considered "virtuaIIy impermeable." Permeabilities determined from recently collected rock cores
ranged from 1 o - ~ to I o - ~ crntsec for the coarsest grained sandstone cores. Finer grained cores

Explanation
~ua~ternary Fl Quaternary Alluvium Unconsolidated mixture of sand. silt, and clay
Unconformity
Topanga Formation Bedded marine sandstone and conglomerate
Tertiary I] Martinez Formation Fossiliferous marine sandstones and siltstones
Unconfonnity Chatswqrth Formation
~retaceous Fl Marine sandstone with interbedded siltstones and claystone and minor conglomeritic beds
Fracture, Fault. or Joint
i = ~ t - ~ rum Shear Zone . . - -- Contact 28 Strike and Dip of Beds
SFL Geologic
This page intentionally left blank.

0s Off-S~te Well ES Extraction Well
Figure 2-8. Location of Wells in and Adjacent to Area IV

exhibited permeabilities of lop8 to cmlsec. For comparison, a permeabiIity of c d s e c
would be sufficiently low to function as a hazardous waste impoundment liner.
Based on hydraulic considerations, groundwater can be expected to flow in a general northwest
direction across the northwest AreaIV site boundary and in a southeast direction across the boundary
with Area 111. The water elevation profile and associated groundwater divide (Figure 2-5) are the
basis of that prediction; however, no prediction of rate or specific direction of flow is possible with-
out detailed knowledge of the local fracture density and fault pattem. It is possible (and examples
exist in the wells already drilled) for wells drilled within a few feet of one another to be hydraulically
isoIated while others may be hydraulically connected even though separated by 100 ft or more. This .
the modeling of contaminant migration into and through the Chatswortli formation groundwater
would be very difficult.
The climate of SSFI, falls within the Mediterranean subclassification of a subtropica!-type cli-
mate. Monthly mean temperature ranges from 50°F during winter months to 7 0 ° F during summer
months. The annual mean precipitation is 18 in., with 9570 of the total falling between November and
April. Precipitation is normally in the form of rain, although snow has fallen during winter months.
From April through October, a consistent landward wind pattern develops from the unequal heating
of the land mass and adjacent ocean. These northwest daily winds range from 5 to 10 knots and occur
between noon and sunset. From November to March, this wind pattern is interrupted by the passage
~f weather fronts.
The presence of shallow groundwater is determined by seasonally variable precipitation,
infiltration rates, and evapotranspiration. Removal by transpiration is typically sufficient to deplete
the shallow zone groundwater system and causes shallow zone wells to be dry much of the year. The
Chatsworth formation groundwater system also shows seasonal water-level variations indicative of
recharging from the winter/spring rains. After a major rainfall event in February 1992, substantial
increases in water-level elevations were observed in virtually all Area IV deep wells except those
with initial water levels of 200 ft or more below grade.

2.3 ENVIRONMENTAL RESOURCES
2-3.1 Flora
The primary natural vegetation at and surrounding the SSFL is chaparral. This plant community
forms a very dense vegetation of broad-leafed evergreen sclerophyll shrubs. It is dominated by ei-
ther charnise or manzanita and California lilac. Numerous other- shrub species are subdon~inant.
A vegetation survey of this area was conducted by the U. S. Department of Agriculture in 193 1.
It indicated that much of the area now occupied by the SSFL was semibarren, with the remaining
upland areas covered by chaparral dominated by chaniise or coastal sagebrush. Open grasslands oc-
curred primarily on the lower southeast slopes, and oak woodland appeared only in the canyons near
ephemeral streams.
A survey conducted by NRC in 1976 found that the area was dominated by an oak woodland
with undergrowth of grass and sage. Canyon vegetation was dominated by shrub willow, California
bay and broom. Apparently much of the chamise chaparral had been replaced by oak woodland since
193 1. The most likely explanation for this observation is that fire suppression activities in the mean-
time allowed the fire-tolerant chaparral vegetation to be replaced by the less fire-tolerant oaks and
sages.
There are three plant species classified as endangered that might occur in the SSFL region.
These species are listed in Table 2-1.
In addition to the endangered plant species that might be found in SSFL, live oak trees and
tarplant, which are known to occur in Area IV, are designated as "protected species" and will not be
disturbed during implementation of this plan.
Table 2-1. Endangered Plant Species That Might Occur in Area IV
Family, Genus, Species, Subspecies
1. Crassulaceae-Dudley cymosa spp. marescens
Habitat and Geography
Chaparral zone; Santa Susana Mountains
I 2. Fumaraceae-Dicentra ochroleuca (Papaveraceae)
Dry disturbed places below 3,000 f t in chaparral I
I 3. Polygonaceae-Eriogonum crocatum Rocky slopes at about 500 ft, coastal sage shrub I

2.3.2 Fauna
There are abundant wildlife in the Santa Susana Mountains. These include the mule deer
(Odocoileus hemionus), gray fox (Urocyon cinereoargenteus), bobcat (Lynx rufus), western gray
squirrel (Sciurus griscus), brush rabbit (Sylvilagus bachmanni), coyote (Canis latrans),
dusky-footed woodrat (Neotoma fuscipes), nimble kangaroo rat (Dipodomys agilis), desert wood
rat (Neotoma lepida), California mouse (Peromyscus californicus), brush mouse (P. boylii),
California pocket mouse (Perognathus californicus), California quail (Lophortyx californicus),
mountain quail (Oreortyx pictus), acorn woodpecker (Melanerpes formicivorus), scrub jay
(Aphelocoma coerulescens), Costa's hummingbird (Calypte costae), cactus wren
(Campylorhynchus brunneicapillum), Lazuli bunting (Passerina amoena), wrentit (Chamaea
fasciata), plain titmouse (Parus inomatus), common bushtit (Psaltriparus minimus), poor-will
(Phalaenoptilus nuttallii), Bewick's wren (Thryomanes bewickii), black-headed grosbeak
(Pheucticus melanocephalus), California thrasher (Toxostoma redivivum), rufous-sided towhee
(Pipilo erythrophthaimus), oranze-crowned warbler (Vermivora celata). sage sparrow (Amphispiza
belli). rufous-crowned sparrow (Aimophila suficeps), western fence lizard (Sceloporus
occidentalis), southern alligator lizard (Gerrhonotus multicarinatus), coast horned lizard
(Phrynosoma coronatum). skinks (Eumeces skiltonianus, E. gilberti), striped racer (Masticophis
lateralis), western rattlesnake (Crotalus viridis), and red rattlesnake (C. rubes). In addition, there is a
resident population of small catfish in the Building 056 pit. The water in the pit was tested for
radioactivity; none was detected. Workers at the site care for a few domestic cats, and occasionally a
dog will stray onto the property. Occasional roadkills have been analyzed for radioactive
contamination. None has ever been found. None of the above species are on the endangered species
list.
2.3.3 Critical Habitat and Sensitive Environments
There are no known wildlife habitats affected by operations in Area IV. If, during implementa-
tion of this plan, a wildlife habitat is discovered that might be disturbed during the survey, the plan
will be modified to prevent disturbing of the habitat.
2.3.4 Land Use
Located entirely within Ventura County, SSFL operates under the public jurisdiction of various
regulatory bodies of that county. Although not within city limits, i t is designated to be within the
"sphere of influence" of the City of Simi Valley. The Ventura County Planning Commission
administers zoning laws and ordinances that regulate the use of buildings, structures, and land. To
assure conformance, all plans and specifications are subjected to review before issuance of building

permits. SSFL, is zoned Rural-Agricultural Five Acres (R-A-SAC). A conditional use permit covers
the industrial activities carried out on site.
Area IV is bordered on the east by Area 111, to the north by Brandeis-Bardin Institute (BBI), to
the west by a cattle ranch, and to the south by the buffer zone, separating SSFL from Bell Canyon, a
residential development. Neighboring lands to the north and west of Area IV have been zoned
R-A-SAC. The areas immediately south of the Rockweil buffer zone have been zoned
Rural-Exclusive One Acre (R-E-I Ac).
For the foreseeable future, ETEC will continue to support DOE and other program objectives
for near- and long-term energy development. Current projections do not foresee major expansion to
existing ETEC facilities. There are no plans to install any new waste treatment facilities or any waste
disposal facilities in Area IV. In the near term, facility and land use requirements will be similar to
those presently existin: in Area IV.
2.3.5 Human Resources
The current Area IV work force is less than 200. Most of this work force is con~prised of ETEC
employees, which now number approximately 150. Approximately 75% of the staff consists of
degreed PI-ofessionals in a variety of engineering and scientific disciplines. The remainder are most-
ly mechanics, technicians, and administrative support pessonnel.
2.3,6 Demographics
The demographics of the area surrounding SSFL are illustrated in Figures 2-9,2-10, and 2-1 1 .
These figures show local population distribution estimates determined from the 1990 federal census.
2.3.7 Archaeological Resources
There are no known sites of archaeological interest in Area IV. Located on adjacent land within
SSFL, however, is a rock shelter of the Chumash Indians that has been registered as an archaeologi-
cal site of historic interest.
2.3.8 Historical Resources
According to the National Register of Historical Places, there are no national monuments or his-
torical sites to preserve in Area IV, nor are there areas of unique natural beauty or of historical or
scientific interest. No lawns, landscaping, athletic fields, woodlands, or timber stands that could be
considered resources of value exist.

-----
7 8 Kilometers
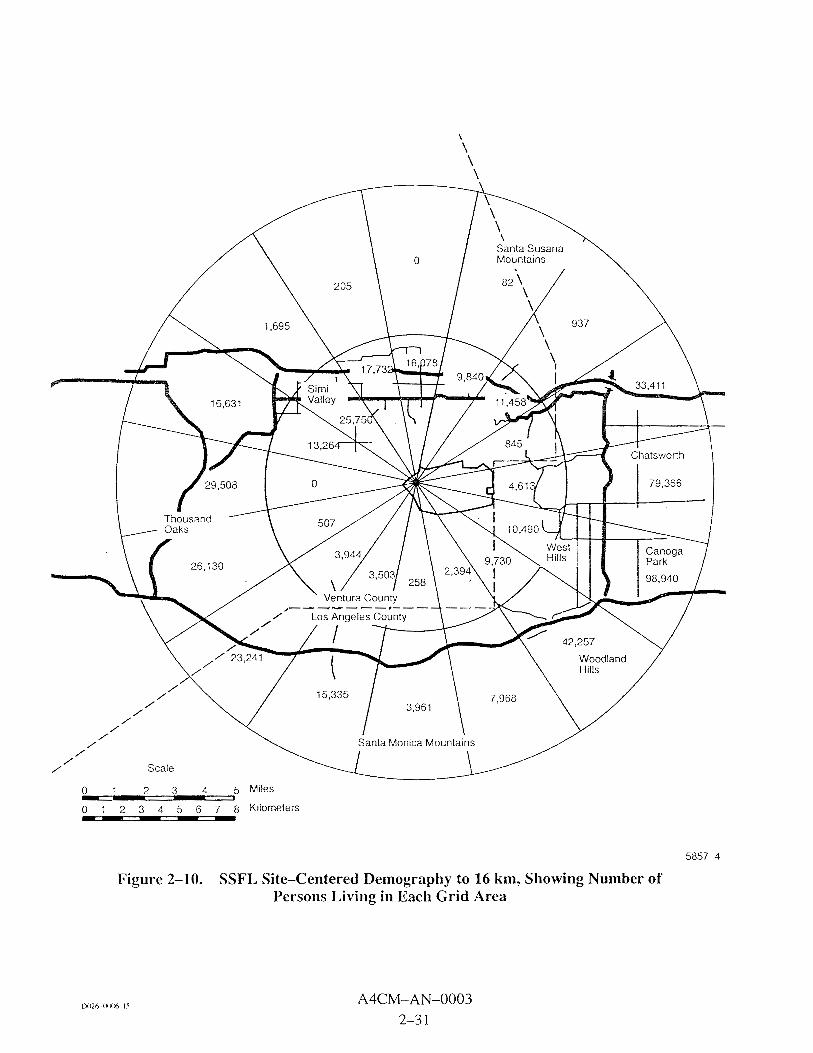
Figure 2-9. SSFL Site-Centered Demography to 8 km, Showing Number of Persons Living in Each Grid Area
(Numbers within SSFL boundary indicate daytime employment.)
/ /
/ /
/ / Scale
Figure 2-10. SSFL Site-Centered Demography to 16 km, Showing Number of Persons Living in Each Grid Area
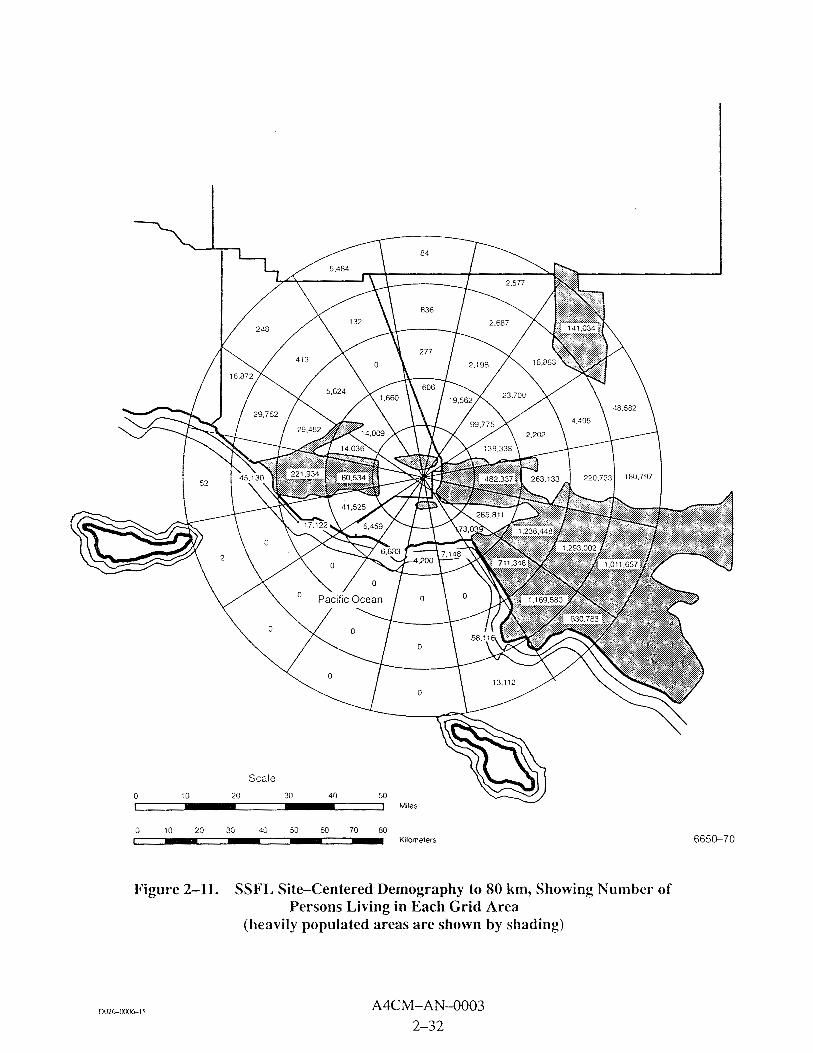
Figure 2-11. SSFL Sitecentered Demography to 80 km, Showing Number of Persons Living in Each Grid Area
(heavily populated areas are shown by shading)
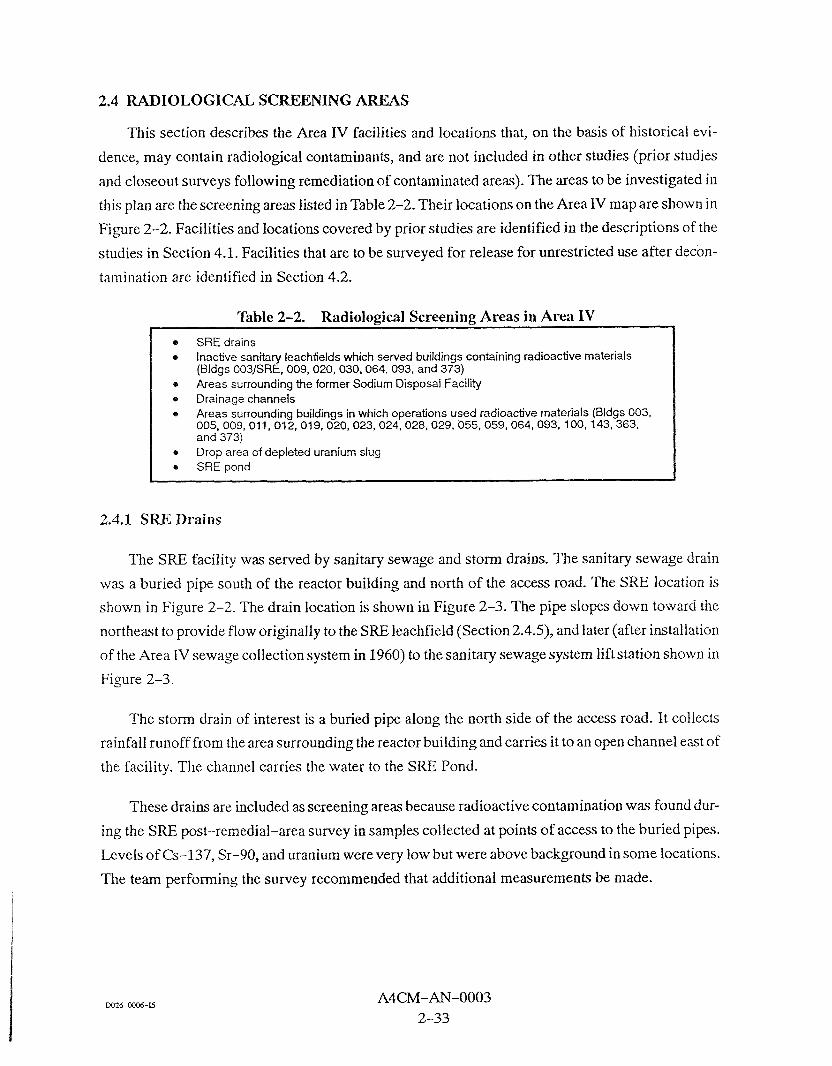
2.4 RADIOLOGICAL SCREENING AREAS
This section describes the Area IV facilities and locations that, on the basis of historical evi-
dence, may contain radiological contaminants, and are not included in other studies (prior studies
and closeout surveys following remediation of contaminated areas). The areas to be investigated in
this plan are the screening areas listed in Table 2-2. Their locations on the Area IV map are shown in
Figure 2-2. Facilities and locations covered by prior studies are identified in the descriptions of the
studies in Section 4.1. Facilities that are to be surveyed for release for unrestricted use after decon-
tamination are identified in Section 4.2.
Table 2-2. Radiological Screening Areas in Area IV
S R E drains Inactive sanitary leachfields which served buildings containing radioactive materials (Bldgs 003/SRE, 009,020,030,064,093, and 373) Areas surrounding the former Sodium Disposal Facility Drainage channels Areas surrounding buildings in which operations used radioactive materials (Bldgs 003, 005, 009, 011,012, 019,020,023, 024,028,029,055, 059, 064,093, 100, 143,363, and 373) Drop area of depleted uraniuni slug S R E pond
2.4.1 SRE Drains
The SRE facility was served by sanitary sewage and stonn drains. The sanitary sewage drain
was a buried pipe south of the reactor building and north of the access road. The SRE location is
shown in Figure 2-2. The drain location is shown in Figure 2-3. The pipe slopes down towzrd the
northeast to provide flow originally to the SRE leachfield (Section 2.4.5), and later (after installation
of the Area JY sewage collection system in 1960) to the sanitary sewage system lift station shown in
Figure 2-3.
The storm drain of interest is a buried pipe along the north side of the access road. It collects
rainfall runoff from the area surrounding the reactor building and carries it to an open channel east of
the facility. The channel carries the water to the SRE Pond.
These drains are included as screening areas because radioactive contamination was found dur-
ing the SRE post-remedial-area survey in samples collected at points of access to the buried pipes.
Levels of Cs-137, Sr-90, and uranium were very low but were above background in some locations.
The team performing the survey recommended that additional measurements be made.

2.4.2 Inactive Sanitary Leachfields
In the early development of Area IV, leachfields were used for disposal of sanitary wastes. Such
leachfields were located in several locations to serve buildings locally. Leachfields were provided
for Buildings 003/SRE, 005/006,009,010,011,020,021 (RMDF), 030,064,093,353,373, and 383
(building now removed). Their locations are shown in Figure 2-15. Use of leachfields was discon-
tinued in 1960 when their function was taken over by the Area 1V central sanitary sewer system,
which collects the wastes and treats them in the Sewage Treatment Plant in Area 111. The leachfield
for Building 010 was removed in the construction of Building 012. The Ieachfield for the RMDF
(Bldg 021) is included in the RMDF D&D program (Section 4.2.1). Buildings 005/006, 01 I , 353,
and 383 did not contain radioactive materials during the time of use of the leachfields. The other
IeachfieIds are considered screening areas.
Facilities were designed to segregate sanitary and industrial wastes. There was an accidental
diversion of radioactive liquid into the RMDF sanitary waste leachfield about 1962; however, there
have been no known releases of radioactive materials to leachfields covered by this plan. Screening
will be done to verify that there is no contamination.
2.4.3 Areas Surrounding the Former Sodium Disposal Facility
The former Sodium Disposal Facility area is a now-inactive facility comprising about one acre
in the western part of Area IV. It was used for disposal of sodium and NaK by exothermic reaction
with water or steam. Some of the materials disposed of in the faciIity were contaminated with radio-
activity. Areas adjacent to the facility were sometimes used as temporary storage areas. There is also
evidence of former use of a 20-ft by 150-ft earth pit near to and south of the access road as a disposal
site.
A remediation program for the former Sodium Disposal Facility has been nearly completed.
Contaminated soil has been removed and a closeout survey is planned. The extent of the closeout
survey is defined on the south by the access road, and on the east and west by rock outcroppings, and
on the north by the Area IV boundary. The surrounding areas (ravines to the east and west and the
slope south of the access road) are considered screening areas.
2.4.4 Drainage Channels
Surface water runoff from Area 1V is through open drainage channels, which are asphalt coated
in the developed areas and natural water courses in other areas. Surface water is principally from
rainfall, but has sometimes been water used for industrial purposes. The drainage channels are


screening areas for investigation of possiblecontamination from waste liquid flow or by transport of
contaminants by rain water runoff. Surface water features, including drainage paths and retention
ponds, are described further in Section 3.2,
2.4.5 Building Areas
The buildings and facilities described below are those in which activities involving radioactive
materials have occurred. Each of the facilities has been, is being, or will be decontaminated and sur-
veyed as part of the D&D program (Sections 4.1.4 and 4.2.1). The areas around these buildings are
identified as screening areas to verify that no radiological contamination resulted from activities at
the facilities.
I. Building003. This building was one of the earliest constructed in Area IV. It was used for assembly of fuel elements for the SRE. There was a small hot cell in the building that was completely decontaminated in 1975. Sodium systems were operated in the building in the late 1950s. In recent years, the building has been used for storage of nonhazardous materials.
2. Building 005. This building was built in the late 1950s for testing thermodynam- ic characteristics of proposed coolants for organic moderated reactors. During the mid-1960s, the facility was converted for fabrication of enriched uranium carbide fuel for the Heavy Water Organic Cooled Reactor. After completion of this program in 1967, equipment was removed and surfaces were decontami- nated to permit other use of the building. Since 1972 the building has been used as the Molten Salt Test Facility (MSTF). It contains offices and control rooms used for the Process Development Unit (PDU), which was located in the adjacent equipment yard. Neither of these recent projects involve radioactive materials.
3. Building 009. This building was built in the late 1950s to house the Organic Moderated Reactor and Sodium Graphite Reactor Critical Facilities. Reactor physics experiments continued until 1964. The building has since been used for several projects. None have involved radioactive materials except for the contin- uing use of contaminated inservice inspection equipment in the building. D&D of the facilities, including removal of radioactive waste holdup tanks and trans- fer lines external to the building, has been completed, although a reverification survey will be needed when inservice inspection equipment is no longer used in the building.
4. Building 011. This building was built in the initial development of Area IV. It once housed the administrative offices for Area IV. It contained the machine shop supporting Area 1V programs for almost 30 years. The shop was later con- solidated with the Rocketdyne SSFLshop and moved to Area I. The building is now utilized by Quality Assurance (QA) and as an Instrument Calibration Labo- ratory by Radiation Protection and Health Physics Services (RP&HPS). The lat- ter activity involves using radioactive sources. There have been no known con- tamination incidents.
5. Building 012. This building was used for SNAP criticality tests from 1961 to 1971. D&D has been completed. The building is used only as a structural support for the Power Pak Facility.
6. Building019. This facility was built in 1962 as the SNAP System Nuclear Quali- fication Test Facility. It was used for criticality tests of flight systems before they were moved to Building 024 for power tests. All nuclear or radioactive materials handled were fully encapsulated. No contamination incidents are known to have occurred.
When the SNAP program was terminated in 1970, SNAP components were removed and dispositioned. The facility was redesignated the ETEC Construction Staging and Computer Facility and has since been used for these purposes.
7. Building 020 (Rockwell International Hot Laboratory or RIHL). This source area is a 16,000-ft2 facility containing hot cells with remote manipulators and cranes for remote operations on high-radioactivity materials. Operations in- cluded decladding and examination of fuel from nuclear reactors. Operations began in 1959 and were ended in 1989. D&D of the RIHL began in late 1989 and is continuing.
The following wastes have been managed in the RIHL without releases to the environment. Radioactive material disposal is through the RMDF. Outdoor storage of waste boxes resulted in some soil and asphalt contamination which has been removed.
Nuclear reactor fuel processing resulted in contamination of the hot cells with all the radionuclide constituents characteristic of spent fuel, such as transuranics (Pu-239, -240, -241, Am-241, and Cf-252) and fission products ((25-137 and Sr-90). This contamination is being removed as part of the facility D&D.
Fission gases (xenon and krypton) released during fuel assembly declad- ding were held in underground tanks while their radioactivity decayed and the gases were no longer contaminants.
Radioactively contaminated rinse water drained from the hot cells was collected in a holding tank and periodically transported to the RMDF for solidification and disposal.
Mixed wastes from RIHL activities include lead, paint from sandblasting, acidic waste, mercury, soil, and rinse water.
In 1971, a fire occurred when approximately 25 gal of radioactive NaK were released into the decontamination cell of the facility. The ventilation system, which includes high-efficiency filters, confined combustion products inside the facility.
8. Building 023. This building is now used as an electrochemistry laboratory and storage area. It contained several NaK loops during the SNAP program, and later housed a sodium test loop used to study the corrosion transport and deposition behavior in flowing sodium of activation products from structural material irra- diation. The corrosion test specimens were irradiated pieces of fuel cladding.

The loop and test specimens have been removed. Decontamination of the build- ing ventilation exhaust system and drains has been completed. A final survey is pending to allow release of the building.
9. Building 024. This facility included two vaults in which SNAP reactors (SZDR and SlOFS3) were operated. The SNAPTRAN (SNAP Reactor Transient Test) criticality tests were also performed in this facility. The reactors and associated equipment have been removed. Approximately 15mCi of confined radioactivity remains in the concrete shielding of the vaults. The radioactivity consists of irradiated isotopes of minor constituents of concrete and steel. These isotopes have relatively short half-lives, so it is planned to maintain surveillance as they decay in place to acceptable levels without conducting demolition and disposal as radioactive waste.
10. Building 028. This building was built for the 50-kWt STR, which was operated from 1961 to 1964. The reactor was then modified to become the 1-MWt STIR, which was operated from 1964 to 1972. The reactor fuel was then removed and the water was drained from the reactor pool. D&D work was performed in 1975 and 1976.
After D&D of the building following operation of the reactors, an investigation of arc-melting of depleted uranium was done in the facility. After these tests, the arc-melting furnace was re~lloved and additional DRrD work was performed, including removal of the aboveground portion of the building.
11. Building 029. Building 029 was initially the Radiation Measurements Facility, which was used for storage and use of radioactive sources to calibrate radiation detection instruments. All sources were removed in 1974; however, some con- tamination in a Ra-226 source storage well remained until final decontamina- tion in 1989. At that time the contaminated well was removed and sampling was conducted to verify that neither the building nor the soil surrounding the well location contained radioactive contamination (Section 4.1.4). In 1974, the building was redesignated the Reactive Metals Storage Facility and continues in this use for storage of nonradioactive, reactive materlais (e.g., sodium metal and lithium hydride).
12. Building 055. This building was the Nuclear Materials Development Facility (NMDF), a plutonium fuel manufacturing facility that incorporated the safety systems and safeguards required for working with plutonium. It was completed in 1967. Operation of the facility continued until 1979 with no incidents of unpermitted radioactivity releases. D&D of the facility was completed in the early 1980s.
13. Building059. This building was a test facility for SNAP reactors from 1962 until 1964 and in 1968 and 1969. (From 1964 through 1968 the building was undergo- ing modifications.) In 1969, the reactor core and control system were removed. Sufficient D&D was completed to make a portion of the facility available for other uses. Further D&D was completed in 1978. D&D of the reactor cell and vacuum system was deferred, however, to allow decay of its radioactivity. The reactor cell was sealed and the vacuum system prepared for storage.

The sealed portion of the facility was inspected periodically during the period of suspension of D&D activities. An inspection in 1983 disclosed that groundwater had leaked into the reactor vault and had become contaminated. (The hole exca- vated for the Building 059 underground levels had been dry during building construction. The detection of water in the reactor vault was the first indication of groundwater at the building level.) The water in the reactor vault was removed, processed, and disposed of. A pumping program was begun both at the Building 059 French drain (water drainage system installed during building construction at the base of the building foundation to channel groundwater to a sump to which a standpipe was extended) and inside the building to ensure that the water level outside the building remained above that inside so that leakage would be into rather than out of the building. The location of the leak was found and sealed.
No radioactivity other than very low levels of tritium has been detected in water collected from the French drain, indicating that no water has leaked from the building. The tritium is thought to have originated during operation of the facil- ity from neutron activation of lithium in the concrete aggregate (Ref. 2-2).
A D&D program was begun to remove the remaining radioactivity after inspec- tion of the facility in 1987 showed a potential for structural deterioration. In Phase 1, completed in 1989, the vacuum suction pipe and its sand shielding were removed. In Phase 2, currently underway, the vacuum chamber and concrete test cell walls have been removed.
14. Building 064. The Nuclear Materials Storage Facility was built in 1958 and enlarged in 1963. It was used primarily for storage of packaged items of source material (natural and depleted uranium, and thorium) and special nuclear material (enriched uranium and U-233). Enriched uranium and source material powders were repackaged in a glovebox in the building.. During shutdown and termination of the SNAP program, an area in the building was used to section Zr-U (enriched uranium) alloy product line material into lengths suitable for packaging for shipment. During the eariy 1960s, drums of scrap containing re- coverable amounts of low-enrichment uranium were stored inside the building, as well as in the yard areas east, north, and west of the building. The drums were shipped to recovery sites in the mid-to-late 1960s and early 1970s.
There is no longer any source or special nuclear materials stored in the building. It has been decontaminated and the final survey has been completed.
In the early 1960s, a spill of contaminated water occurred in the fenced area sur- rounding the building. A shipping cask containing irradiated fuel elements was stored in the area. The cask had apparently not been drained after underwater loading, and the drain plug rusted out during storage. The water, which con- tained mixed fission products, leaked onto the surface of the storage yard. The area was decontaminated in 1963 to then-current requirements by excavation of soil. Additional soil was removed around 1990 to remove additional side-yard contamination to meet current limits.
15. Building 093. This buiIding was built in 1956 to house a low-power reactor transported from its initial location at the NAA Facility in Downey. The reactor was operated to provide a sourceof neutrons for subcritical assemblies on which reactor physics measurements were done, and later for neutron radiography.

Operation of the reactor continued until 1980. D&D was completed and the building was released for unrestricted use in 1987.
Building 100. This building housed a critical assembly used between 1961 and 1974 for reactor physics tests in epithermal and fast neutron spectra. D&D was completed and the building was released for unrestricted use in 1980. It is now used for office space, storage, measurement of radioactivity of environmental samples, and computerized tomography for nondestructive inspection of rocket engine components.
Building 143. This building housed the SRE reactor, control room, and support- ing equipment. Building 143 and associated buildings comprised the SRE Facil- ity. The SRE was a small experimental reactor that operated from 1957 until 1964. It was maintained in a safe shutdown ccndition until 1967, when the fuel was removed and the reactor coolant was drained. D&D began in 1974 and was completed in 1983, when the facility was released for unrestricted use.
Building 363. This building is a research and development (R&D) laboratory building. It was used as a metallurgical laboratory for posttest examination of SRE components. In the late 1960s, there was a small explosion in the building, which resulted in the spread of low-level radioactive contamination throughout one room. The building was decontaminated and returned to normal use.
Building 373. This was the first SNAP critical facility. It was in a building with thick walls and partitions, originally built to manufacture high-energy rocket fuels. Criticality tests were conducted from 1957 to 1963. At the end of these tests, radiation surveys were performed and the facility was released for unre- stricted use. It is currently abandoned.
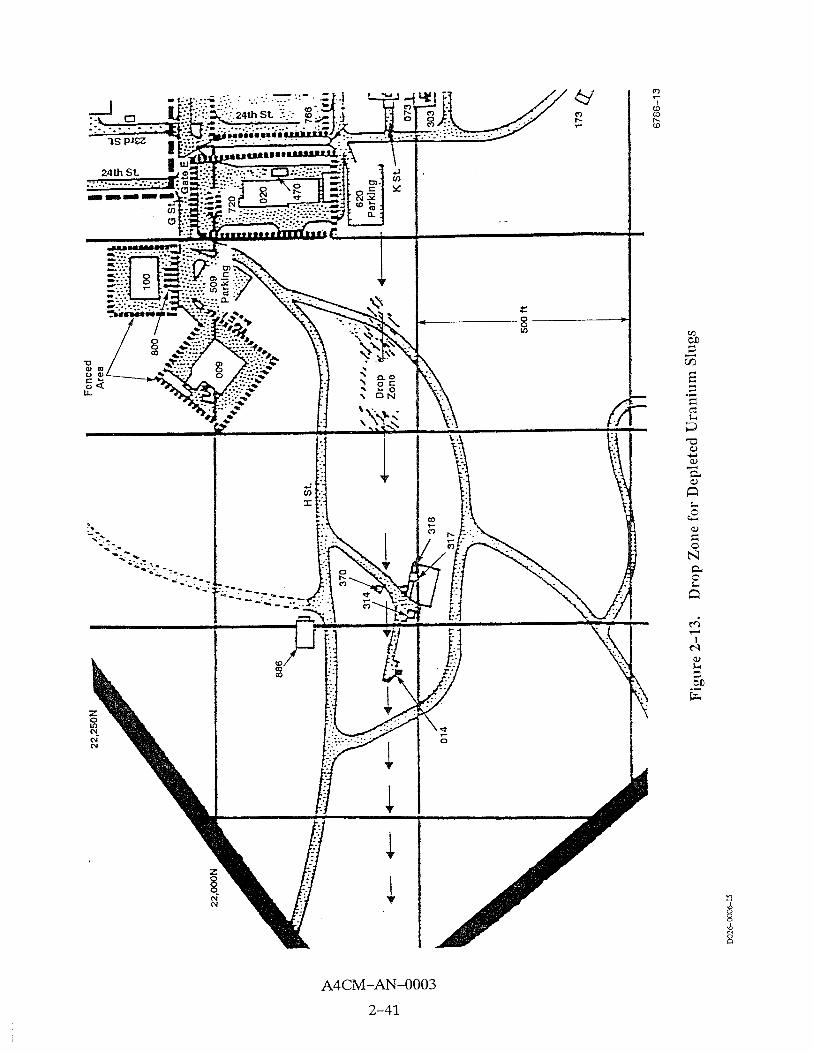
2.4.6 Drop Area of Depleted Uranium Slugs
In the 1960s, during tests to determine the depth to which falling simulated radioisotope heat
sources would penetrate the soil, about 20 1-kg depleted uranium slugs (about 314 in. dia by 8 in.
long on the basis of the uranium density of 18 gm/cm3) were dropped from a helicopter into an area
south of Building 009. The location of the drop area is shown in Figure 2-13. The area is in an unde-
veloped meadow, which in recent years has been the disposal area for brush cleared from SSFL
areas. The brush has been turned under the surface periodically, so the upper layer of soil has been
significantly disturbed.
All but one of the 20 slugs were recovered at depths ranging from 0 to 3 in. Several searches
have been conducted (the first at the time of the test, most recent in 1991). Radiation detectors and a
metal detector have been used without success in finding the remaining slug. Debris such as soft
drink cans was detected, but not the slug.

2.4.7 SRE Pond
A retention pond was maintained during operation of the SRE to collect runoff from the facility
upstream of the Area IV boundary. The pond was created by a dam across the drainage channel.
Water IeveI was controlled by pumping excess water through a pipe to a drainage channel leading to
the Silvernale Pond, which is part of the SSFL water control system, After decontamination and
release for unrestricted use of the SRE area, the gate of the dam was opened to release the impounded
water. The pond was much reduced in size, but still exists as the only year-round body of' standing
surface water in Area IV. (The Building 056 Pit contains water year-round, but the water is ground-
water which is visible because of the depth of the pit.)
2.5 REFERENCES
2-1. Rockwell International Supporting Document N001ER000017, Rev C, Nuclear Operations at Rockwell's Santa Susana Field Laboratory - A Factual Perspective, R. D. Oldenkamp and J. C, Mills (September 6, 1991)
2-2. Roclnvell International Document RI/RD92-186, "Tritium Production and Release to Groundwater at SSFL" (December 1, 1992)

3. PLAN RATIONALE
3.1 DATA QUALITY OBJECTIVES
The data quality objective (DQO) process provides a method for focusing on the objectives of
the plan and assuring that the data are of adequate quality to meet the objectives. The process was
developed by EPA for application to data supporting regulatory activities. While this plan is not a
regulatory activity, the intent of the process is applied to provide guidance for obtaining data of
appropriate quality. The DQO levels defined in the process refer to chemical analysis and are thus
appIicab1e only to the radiochemical analysis of the soil and water samples specified by the plan. The
PARCC (precision, accuracy, representativeness, completeness, and comparability) data quality
indicators are defined for both samples and radiation measurements.
Data quality objectives are qualitative and quantitative statements which specify the quality of
the data required to support decisions during remedial response activities. Due to the variability of
site characteristics, DQOs are unique for each site; however, the DQO process is essentially thesame
for each activity. EPA guidance for the DQO process is given in Reference 3-1.
Data quality objectives are developed using a three-stage process as shown in Figure 3-1:
Stage 1 - Identify decision types
Stage 2 - Identify data uses and needs
Stage 3 - Design data collection program.
Stage 1 - Identify Decision Types
The primary users of the data obtained during implementation of this plan will be those individ-
uals involved in the site characterization and subsequent remediation studies, if applicable, and DOE
personnel involved.
An initial step in the preparation of this plan was an evaluation of all relevant available data for
Area IV operations (Section 2.1.2), prior studies (Section 4.1), and areas covered by related activi-
ties (Section 4.2). In the case of Area IV, gathering of environments1 data has been a continuous ac-
tivity since the 1950s, so that, in many cases, considerable data were already available. There are also
remediation programs that cover several potentially contaminated areas independent of this plan.
Where feasible, conceptual models were developed and applied to areas to be investigated. Con-
ceptual modeling is discussed and presented in Section 3.2.

Stage 1 ldentify Decision Types
* Identify and involve data users
* Evaluate available data * Develop conceptual model
Specify objectives/decisions
Stage 2 Identify Data UsesINeeds t - Iden* data uses
* ldentify data types * ldentify data quality needs * Iden* data quanMy needs - Evaluate sampling/analysis options
Review PARCC parameters
I
Stage 3 Design Data Collection Program Assemble data coHedon components Develop data collection documentdon
Figure 3-1. DQO Three-Stage Process
Objectives identified were to:
e Determine presence or absence of radioactivity above background
e Determine types of radioisotopes present
e Determine concentrations of radioactive materials
o Determine direction of radioactive material transport
e Determine source boundaries.
Stage 2 - Identify Data Uses and Needs
The potential data use categories for this particular plan are:
e Site Characterization. Data will be used to determine the nature and extent of radioactive materials at a site. This category is usually the one that requires the most data collection. Site characterization data are generated through the sam- pling and analysis of contaminant sources and environmental media.
o HeaIth and Safety. Data are typically used to establish the level of protection needed for investigators or workers at a site, and if there should be an immediate concern for the population living within the site vicinity.
Risk Assessment. Data will be available to evaluate the threat posed by a site to public health and the environment. Risk assessment data are generated through the sampling and analysis of environmental and biological media, particularly where the potential for human exposure is great.
Remediation studies. Data will be availabIe to evaluate the need for remediation and to select from among remediation alternatives.
To determine data quality needs, the analytical level appropriate to the data use must be deter-
mined. The five DQO levels and the analysis required for each are defined as follows:
e Level I - field screening or analysis using portable instruments. Results are often not compound-specific and quantitative, but results are available in real-time. It is the least costly of the analytical options.
0 Level I1 - field analyses using more sophisticated portable analytical instru- ments; in some cases, the instruments may be set up in a mobile laboratory on site. There is a wide range in the quality of data that can be generated. It depends on the use of suitable calibration standards, reference materials, and sample preparation equipment; and the training of the operator. Results are available in real-time or within several hours.
e Level I11 - all analyses performed in an off-site analytical laboratory. Level I11 analyses may or may not use Contractor Laboratory Program (CLP) procedures, but do not usually utilize the validation or documentation procedures required of DQO Level IV analysis. The laboratory may or may not be a CLP laboratory.
e Level IV - CLP routine analytical services. All analyses are performed in an off- site analytical laboratory following CLP protocols. Level IV is characterized by rigorous quality assurance/quality control (QNQC) protocols and documenta- tion.
Level V - analysis by nonstandard methods. All analyses are performed in an off-site analytical laboratory, which may or may not be a CLP laboratory. Meth- od development or method modification may be required for specific constitu- ents or detection limits. CLP Special Analytical Services are Level V.
The appropriate analytical levels by data use are shown in Table 3-1. As shown in Table 3-1,
Level I11 analyses are shown to be appropriate for the potential data use categories identified for this
plan. Radiochemical analysis of samples will be in accordance with the definition of Level 111.
The last step in Stage 2 is to review the PARCC parameters, which are indicators of data quality.
The following statements of these parameters are defined to meet the data quality needs of the
plan.
e Precision. The precision will be assessed by the use of duplicate measurements and repIicate samples. The data will be considered acceptable if the difference between two replicate samples is less than two standard deviations.

Table 3-1.
Data Use
Site Characterization
Analytica (Including Level Health and Safety)
Level I1
Level IV
I Other I
Appropriate Analytical Levels - By Data Use
Monitoring During
Engineering Implementation Risk Evaluation of Design of of
Assessment Alternatives Remedial Action Remedial Action
e Accuracy. The accuracy of the radiochemistry analytical methods and their per- formance by the laboratory will be assessed by review of the laboratory perfor- mance in an interlaboratory performance evaluation sample analysis program recognized by the EPAor DOE. The accuracy of radiation measurements will be assessed by periodic calibration and daily performance checks of the radiation detectors.
e Representativeness. Sampling of radiological contamination and radiation lev- els will provide a number of samples sufficient for statistical analysis consider- ing the radiological variability in Area IV. The radiation scan parameters (i-e., movement rates) will be selected to provide coverage of all the applicable sur- face area.
e Completeness. Tne number of valid measurements in each radiological contam- ination or radiation level measurement data set should be at least 90% of the planned nilmber of measurements; however, locations of invalid or missing data will be reviewed to ensure that the data set is still representative. The radiation scan coverage will be 100% of the applicable area.
e Comparability. Data consistency will be provided by using established proce- dures for sampling activities and laboratory analytical methods, frequent checks of equipment functional performance, maintaining detailed records of field acti- vities, and using uniform methods for data analysis and reporting.
Stage 3-Design Data Collection Program
The design of the data collection program is outlined in Section 5.1.1 and will be detailed in the
FSP. Essential elements of the FSP are listed in Section 6.3.3.
3.2 CONCEPTUAL MODEL
The general conceptual model for pathways of Area IV radioactive contamination is shown as a
block diagram in Figure 3-2. The primary pathway identified for potential contaminant migration
from Area IV is pickup and movement of this rnaterial by groundwater and surface water after its

Receptors Potential Primary Contaminant Release
Sources Mechanisms Pathways On-Site Off-Site Personnel Residents
-
deposition in the soil. The groundwater system can transport contaminants through subterranean
pathways. Shallow groundwater can seep through the sides of slopes and become part of the surface
water pathway, with possible return to either the shallow or deep groundwater systems. Other trans-
port pathways (such as air) are of very low probability. The ingestion receptor mechanism is also of
very low probability, since neither ground nor surface water is used as drinking water, and there is no
significant consumption of plants and animals that use the water.
--- Ground Water
The groundwater system and contaminant transport by it are the subject of a separate SSFL
groundwater characterization and monitoring program (Section 4.2.3). Groundwater is outside the
scope of this plan, except for possible return to the surface of contaminants transported by shallow
-,
Ingestion
Dermal ' -
Air
groundwater.
Ingestion
--- Direct Contact
6786-2 Figure 3-2. Conceptual Model Block Diagram
inhdaiion -
The surface and shallow groundwater pathways define the primary sampling areas for the char-
acterization of possible migration of contaminants. The silt in the bottom of natural drainage chan-
nels is a primary sampling medium for characterizing contaminant migration, particularly from sur-
face water transport. Similarly, sampling of surface and subsurface soil downstream of slopes will
provide the primary characterization of contaminant migration through shallow groundwater paths.
Areas showing evidence of water pooling, are additionaI locations to be sampled.
Dermal Surface
Inhalation
, - _ Radioactive
Materials - Surface,
M w e a c h into Soil
Water
- -
.
Animals --- - Ingestion
On-Site lT r - Vegetation --- ---- Dermal

An overview perspective of the water courses that are pathways from Area IV is shown in Fig-
ure 3-3. There are two drainage systems which collect water from Area IV, reflecting the surface
water divide which runs northeast/southwest through Area IV. Surface and shallow groundwater
(above bedrock at a depth of 0 to 15 ft) follow the same water courses. Water drainage to the north
and northwest follows several well-defined canyons, all of which flow into Meier Canyon and subse-
quently into the Simi Valley (if not absorbed by the soil in transit). Surface water drainage on the south
side of Area IV generally flows southeast through other SSF'L areas to the R-2 Ponds and is ultimately
reused for SSFL processes or released into Bell Canyon.
Water pathways across the Area 1V northwest boundary from Area IV facilities are shown in
Figures 3-4 through 3-7. These figures show, respectively, the flowpaths from the former Sodium
Disposal Facility, its surrounding area, and the slope to the south; Building 056 Landfill; former
SNAP facilities near the northwest boundary of Area IV, and RMDF. In addition to the northwest
flow, the figures show some southeast flow, which begins near the northwest boundary. Figures 3-4
and 3-7 show catch basins where rainfall runoff is sampled for analysis. Figure 3-7 shows that run-
off from the RMDF is collected in a holdup basin for sampling and analysis for radioactivity. After
being shown to be uncontaminated, the water is pumped into the drain system leading southeast to
collection ponds.
Water runoff northwest from the former SNAP facilities, and seepage through the steep north
boundary slope, feed into two natural drainage channels that mergejust north of the Area IV boundary.
This water course then merges with the drainage from the Building 056 Landfill, which is a short dis-
tance south; however, it does not merge with the water course from the adjacent RMDF until much
further downstream (Figure 3-8).
Water pathways across the Area IV north boundary are shown in Figures 3-9 and 3-10 for the SRE
and Old Conservation Yard, respectively. Figure 3-9 shows a catch basin for sampling of rainfall runoff
from the SRE area. Runoff toward the north from the Old Conservation Yard is from a narrow band in
which only the beginnings of runoff channels occur. Most of the Old Conservation Yard slopes toward
the south.
Water pathways toward the south from the Old and New Conservation Yards are shown in Fig-
ure 3-10. The extension of these pathways to the Silvernale Pond in Area I11 is shown in Figure 3-11.
The pathway west of the New Conservation Yard was part of the SRE Pond water-level system con-
trol during the period of SRE operation. The transfer path between the pond and the drainage channel
is shown in Figure 3-12. A sump pump at the pond drew water from the pond and pumped it through
a 4-in. pipe. The pipe outlet was at a culvert under the main access road to Area IV, at the edge of the


Old Conservation Yard. The drainage channel was asphalt-covered downstream from that point for
a few hundred feet. Further drainage was along the natural channel.
Water pathways toward the east and southwest are shown in Figure 3-13 through 3-15 for
Buildings 020, 100, and the Building 100 Trench, respectively; the same facilities as Figure 3-13,
but extended further east across the Area IV boundary; and the drainage channel from the developed
area along 17th and 20th Streets, extending across the Area IV boundary.
3.3 REFERENCES
3-1. EPA Report EPA/540/G-87/003 (OSWER Directive 9355.0-7B), Data Quality Objectives for Remedial Response Activities - Development Process," March 1987.

6650-6
Figure 3-4. Surface
Chemical Storage Yar

This page intentionally left blank.
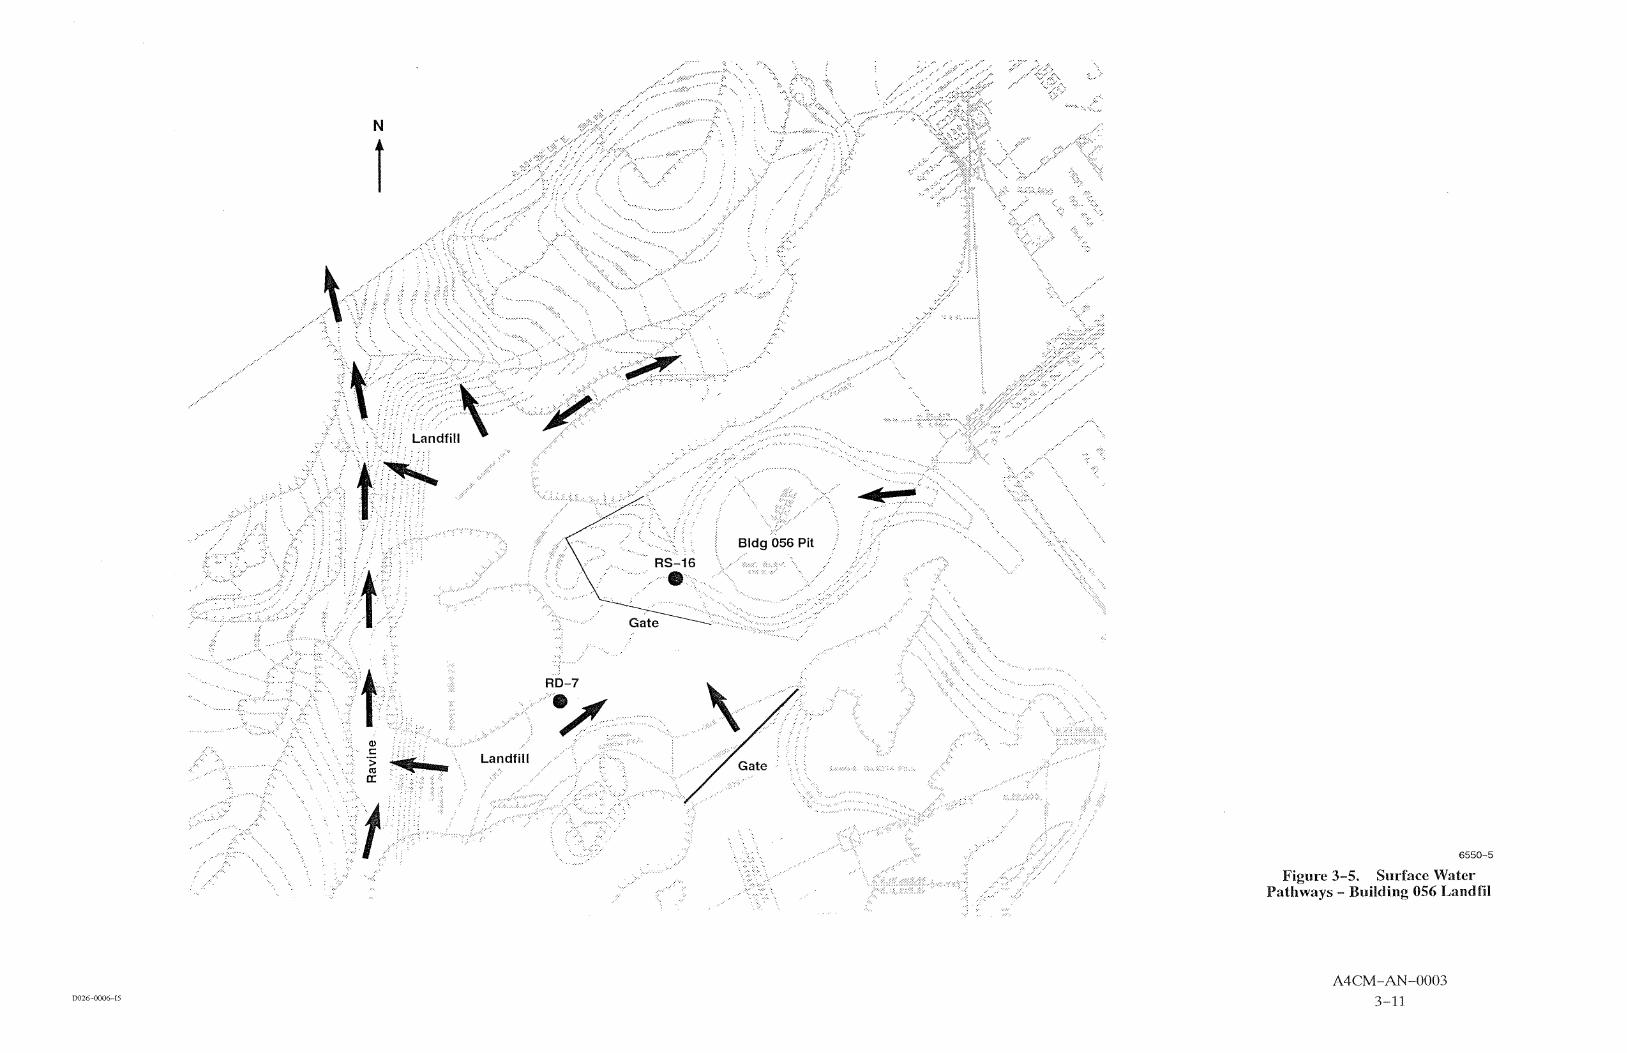
6550-5
Figure 3-5. Surface ilding 056 Landfil

This page intentionally left blank.

6650-24
Figure 3-6. Surface Water athways - Northwest SNAP Area

This page intentionally left blank
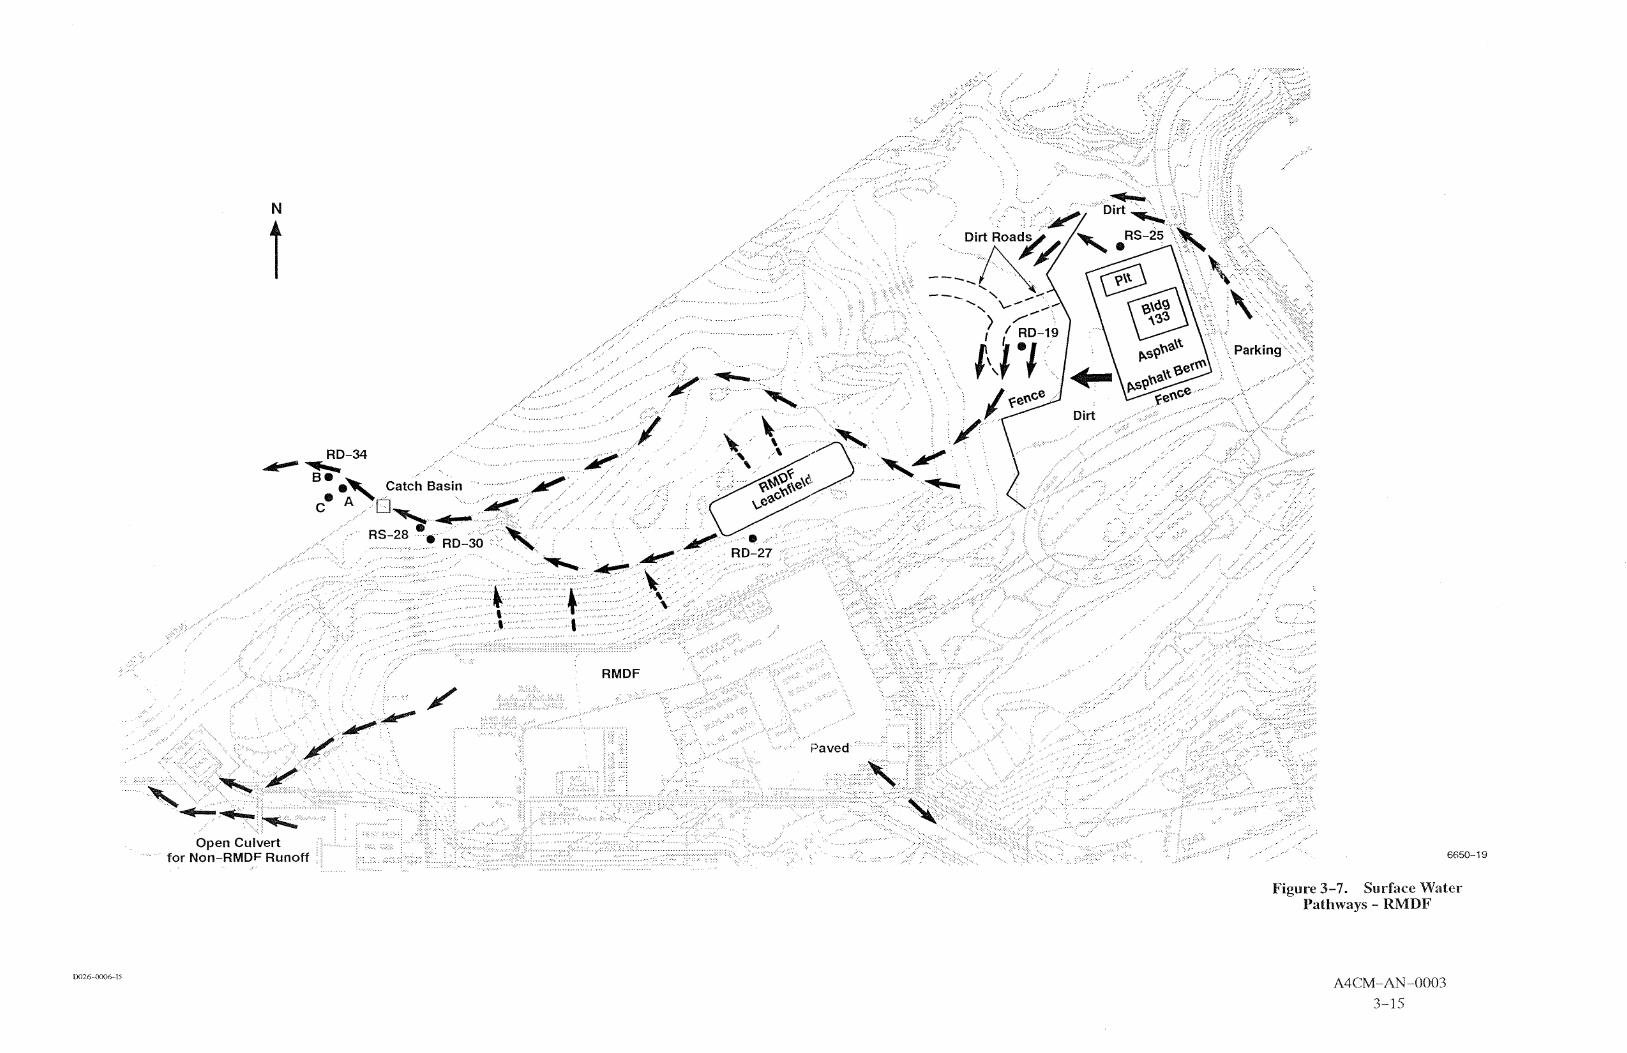
igure 3-7. Surface ways - RMDF

This page intentionally left blank.
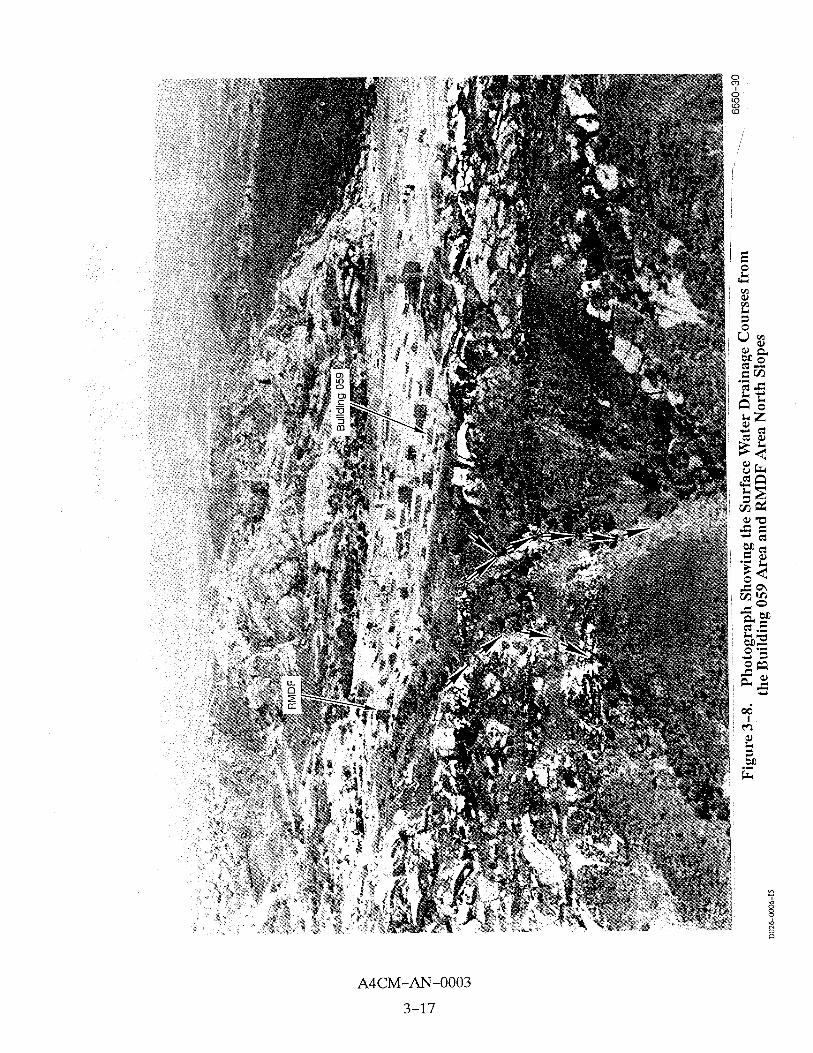

This page intentionally left blank.
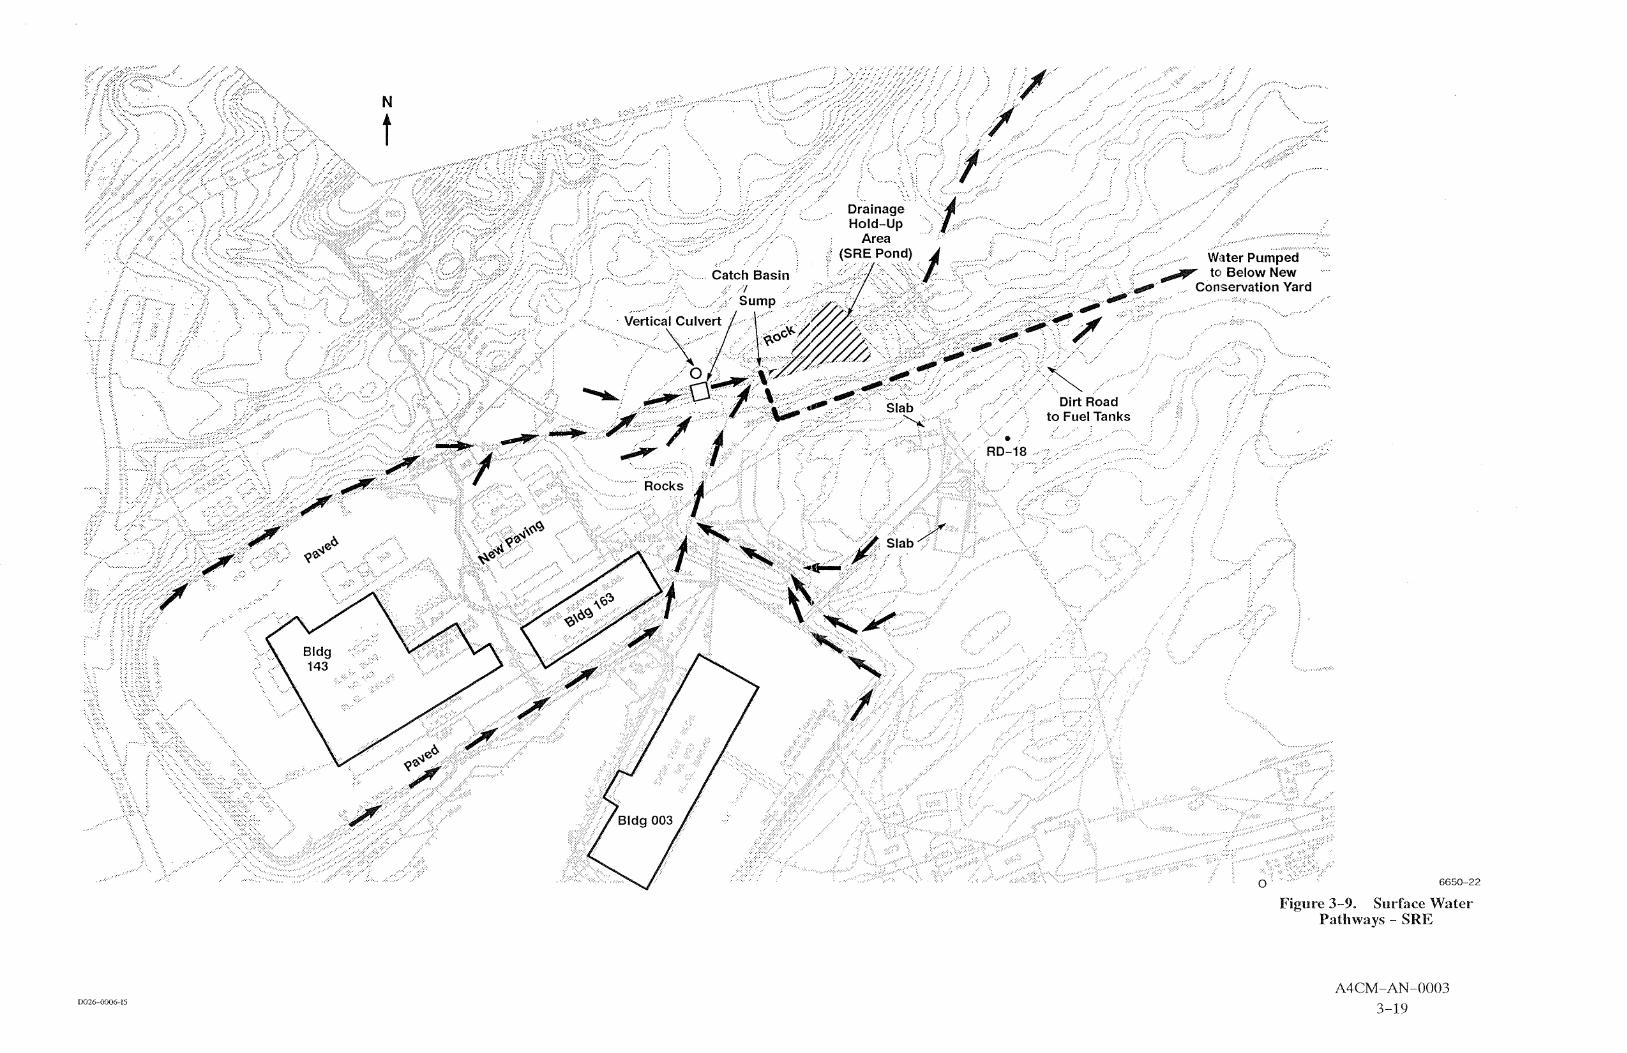
Figure 3-9. Surface Pattlways - SRE
This page intentionally left blank.

Figure 3-10. Surface Water Pathways - Old Conservation Yard

6650-31
~026- OW^-15 Figure 3-11. SRE Pond Sump Pump Discflarge Flow Path (Pond to Discharge Piping Outlet)

Figure 3-12. SRE Pond Sump Pump Discharge Flow Path (Discharge Piping Outlet to Siivernale Pond)

This page intentionally left blank.

i Trench Asp halt 7
Bldg 463
Bldg 462
6650- 1 6
Figure 3-13. Surface Water Path- ways - Southeast Section of
Area IV (West)

This page intentionally left blank.

. . . . . . . . . . . . . : . > . . . . . . . ... . . . . . . . . . . . . . . . . . . . . . . . . . . . From Bldg 100 ~ r e n c h ' ~ r e a . . . . . . . . . :.::.:a .. .......... . . . . . . . . . . . . . . . . . . . . . . . . ... . . . . . . . . . . . . . . .
G Street
Bldg 055
6650-17
Figure 3-14. Surface ways - Southeast Section of
Area IV (East)

This page intentionally left blank.

Figure 3-15. Surface Pathways - Southeast Area IV
This page intentionally left blank.
4. SUPPORTING INFORMATION
4.1 PRIOR STUDIES
Previous investigations have been carried out to characterize the radiological condition of Area
IV. These studies and their results are described in this section. The soil and shallow groundwater
investigation and pond sediment assessment were carried out by Groundwater Resources Consul-
tants, Inc. (GRC) as a consultant to the Rocketdyne Environmental Protection department. Radioac-
tivity monitoring was the responsibility of Rocketdyne Radiation Protection and Health Physics Ser-
vices (RP&HPS).
4.1.1 Area IV Radiological Survey
A comprehensive radiological survey of Area IV was conducted in 1987 and 1988. The survey
covered the areas that had been involved in operations with radioactive materials for DOE (or its
predecessor agencies, ERDA and AEC). Excluded from the survey were facilities which had been
formally licensed by the NRC [Bldgs 020 (RIHL), 055 (NMDF), 093 (L-85), and 1001 or had gre-
viously been surveyed in a D&D activity (Bldgs 010,012,024,028,073, and 143). The survey in-
cluded measurements of both confined (within buildings) and unconfined radioactivity. Confined
contamination is not within the scope of this plan, which is concerned only with unconfined contami-
nation in the environment. Therefore, the building measurements are not addressed here. The D&D
program is a related activity described in Section 4.2.1.
The survey included ambient gamma radiation measurements, soil sampling at a few specified
locations and locations of high gamma measurements, and water sampling from the Building 056
Pit. These measurements and results are described below.
1. Ambient Gamma Radiation. Gamma radiation measurements were made on a grid having a 6-m spacing laid out to cover the area being surveyed. The exact location within each grid was selected by the surveyor as that location which was most likely to have retained contamination. The decision was based on discolor- ation, debris, crevices or cracks in the soil, or the presence of a low spot that would collect surface water runoff.
The measurements were made using a NaI scintillation crystal coupled to a por- table scaler. The detector was positioned using a tripod fixture to be 1 m above the surface. Ambient gamma background radiation was about 10 to 15 pR/h at 1 m from the ground.
The set of ambient gamma radiation values measured at each area was analyzed using the cumulative probability plot statistical method described in Sec- tion 5.5.1. The results are given in Table 4-1. With two exceptions, the radiation levels were consistent with background levels. The exceptions were the Rocket- dyne Barrel Storage Yard section of the Old Conservation Yard and the area
Table 4-1. Ambient Gamma Exposure Rates - Area IV Radiological Survey
Sampling Lot
Exposure limit (above background)
Building 009 outside area
Building 025 storage yard
Building 029
Buildings 030 and 641 outside area
Building 064
0 Fenced storage yard
Surrounding two-acre area
Buildings 373, 374, and 375 outside area
Southwest Drum Storage Yard
Old Conservation Yard
Rocketdyne Barrel Storage Yard
New Conservation Yard
Parking lot 51 3 (between Bldgs 030 and 064)
Old contaminated laundry area
SRE-to-Old Conservation Yard field
SRE-to-RMDF field
KEWB-to-RMDF field
Natural terrain west of Buildings 01 2,013,019, and 059
Building 056 Landfill
Storage yard between 23rd Street and Building 100
Field across G Street from Building 100
No. of Sampling Locations
Background (~r Rlh)
Gamma Exposure Rate (pR/h) Above Background
Average
5
0.0f 0.9
-0.1 f2.1
-0.8 f 1.5
13.2 f 1 .4c
20f 1 4 ~
10.6 f 9.qd
-0.2 It 0.9
NDA
-0.5f 0.7
-1.7f 1.7
-1.7f 1.4
-1.2f0.9
0.05 0.9
-0.1 f 0.6
0.75 1.3
2.2f 0.7
l .9f 3.0
-0.3 f 0.8
-1.7f 1.3
0.5 f 0.9
- Maximum -- Range -
N A
N R
8.0
6.0
6.7
N R
NR
6.0
ND A
6.3
17.0
5.4
3.7
4.4
3.2
6.6
3.9
14.1
5.6
9.1
1.3
Test Statistic
Notes: aAmbient background (median of set of measured exposures). bBackground includes RMDF direct radiation and sky shine contribution. CNo background correction was made. The background was obviously less than natural background measured in stack areas.
dNo background correction was made. The measured exposures were sufficiently variable to indicate contam- ination regardless of the background level.
eThe test statistic would not be meaningful because the data indicate separate gaussian distributions for contaminated and uncontaminated areas.
f Natural background (average of three measurement sets from areas in which no nuclear operations have occurred).
gMeasurements were made 'for indication only.' No detectable activity was found. hDefinitions of acronyms are the following: NA - Not Applicable; NR - Not Reported; NDA - No Detected Activity.

surrounding Building 064. The probability graphs for these areas are shown in Figures 4-1 and 4-2. They both show a set of points (in the case of the yard, a set of one) of a high-radiation level superimposed on a set of background-level measurements.
2. Soil. Soil samples were collected in three locations included in the initial sampling plan and in the two areas of high gamma radiation readings. The locations of preplanned sampling are shown in Figures 4-3 through 4-5. Table 4-2 lists the areas sampled and the results of the analyses. Only the two locations having high gamma radiation levels showed measurable levels of soil radioactivity other than naturally occurring potassium. Those two locations showed elevated gross beta and Cs-137 activities.
3. Surface Water. A water sample was collected from the Building 056 Pit and analyzed for radioactivity by gamma spectrometry. No detectable activity was found other than that of naturally occurring isotopes.
4.1.2 Soil and Shallow Groundwater Investigation
Three Area IV areas were investigated for radioactivity in the Soil and Shallow Groundwater
Study conducted in 1988. The areas were the RMDF leachfield, Old Conservation Yard, and the
Hazardous Waste Treatment Facility (Bldg 133) area.
Gamma Exposure 2.5
Rate ( t ~ m h )
' Outlier Data Point
0 1 10 90 99 100 Cumulative Probability
("w 6650-47
Figure 4-1. Ambient Gamma Dose Rates at the Rocketdyne Barrel Storage Yard

Gamma Exposure
Rate (mR/h)
0 1 10 90 99 100 Cumulative Probability
PA) 66-46
Figure 4-2. Ambient Gamma Dose Rates in Building 064 Storage Yard
Soil sampling and shallow groundwater monitoring well locations are shown in Figures 4-6
through 4-8. Wells were constructed only at areas at which the soil was deep enough to permit the
construction. Sample depths are listed in Table 4-3.
Each of the new wells for this study was dry when initially installed. The well in the Old Conser-
vation Yard was destroyed in 1989 by an excavation. The other wells have been monitored routinely
since installation, with no water having been detected in them.
Soil samples were collected from sampling trenches excavated by backhoe at the Old Conserva-
tion Yard and the Hazardous Waste Treatment Facility. Samples at the RMDF leachfield area were
restricted to surface soils because of the shallow bedrock.
The soil samples were analyzed for gross alpha and gross beta radiation. The results are summa-
rized in Table 4-3. The major results are also shown on Figures 4-6 through 4-8. Radioactivity con-
centrations were elevated in comparison to the gross alpha and beta radiation levels for soil in SSFL
outside Area IV (Section 4.1.8)- The RMDF leachfield values definitely show contamination. In the
other areas, the radiation levels are only slightly elevated and may be within the range of normal
variability.

Controlled/Sampled/Monitored Release From RMDF Pond
N n 14-in. CMP -/W
%in. Surface From Trough Building
TO42
Cooling Tower Sump
x t - - - -OX I /
L I - - - . - - r/ Inactive PDU Gasifier Drains
8 Sample Xk Open Out-Fall (2-ft CMP) Locations: Samphd at $ surface, and at '
bft 1-ft,and 5 Drainage Through 2-ft Depths x Field to R-2A Pond
4
BV Bypass Valve
CMP Convoluted Metal Pipe
DOE Department of Energy
PDU Process Demonstration Unit
RMDF Radioactive Materials Disposal Facility
1 , x- 6650-45
Figure 4-3. Soil Sampling Locations - Building 005


6650-59
Figure 4-5. Soil Sampling Locations - Old Conservation Yard

Tilble 4-2. Soil Radioactivity - Area IV Radiological Survey
Activity Concentration (pCilg)
No. of Sampling -ocatlons
Sampling Location Figures
Gross Alpha Other Gross Beta Sampling Lot Test
Statistic Test
Statistic
50
31.8
N A
N A
N A
N A
N A
Maximum
- Isotope Maximum
Test Statistic Average Maximum Average Average
- U-238 Th-232
Tritium
U-238 Th-232 K-40 CS-1 37
U-238 Th-232 K-40 CS-137
U-238 Th-232 K-40 CS-1 37
Cs-137
N A
0.97 1.043
5 rt 3.03
1.01 f 0.21 l . l g f 0.68 18.78 f 0.93
NDA
0.82 f 0.1 1 O.97f 0.53 17.9f 0.4 81 f 4.5
0.87f 0.99 O.76f 0.26 21.993~ 1.26 0.1 8 f 0.08
2,500
Limit
Runoff water collection and drainage channels for Building 005
Adjacent to Building 030
Old Conservation Yard
Rocketdyne Barrel Storage Yard
SRE Pond drainage channel at conserva- tion yards
Building 064 yard
Notes: asampling locations for Building 005 water course includes five background locations. bDefinitions of acronyms are the following: NA - Not Applicable; NM - Not Measured; NR - Not Reported
CSamples were collected from area of greatest measured gamma radiation exposure rate.

Old Access Road
Bedrock Outcrops Approximate Area of Former Underground Leach Lines
Zone of Elevated
Approximate Extent of Excavation/Grading RMDF Leachfield Area
Approximate Area Excavated During Removal of Leachfield
~26-0006-15 Figure 4-6. Soil Sampling Locations - RMDF Leachfield

\ ----__- Water Line 1
Curb - /-
"o OLDCONS
0 to 0.5 ft Depth i I I -- -
/- --
- - - --
J f f l Concrete Gutter
V
Trench 1
_OLDCONS 5
pH 9.0 I Beta Rad~oactvty 45 0 i 7 0 pCiig I
Figure 4-7. Soil and Shallow Groundwater Sampling Locations - Old Conservation Yard
0.0 ft Depth
Gross Beta 48.7 i 7.3 pCi/g
Figure 4-8. Soil and Shallow Groundwater Sampling Locations - Hazardous Waste Treatment Facility

Table 4-3. Radioactivity in Soil Samples - Soil and Shallow Groundwater Investigation
I Sample
Interval Location / DF
RMDF Leachfield Area
RMDF-1 0.0-0.5 RMDF-2 0.0-0.5 RMDF-3 0.0-0.5 RMDF-4 0.0-0.5 RMDF-5 0.0-0.5 RMDF-6 0.0-0.5
I
Old Conservation Yard
OLD CONS-1 0.0-0.5 OLD CONS-2 0.5-1 .O OLD CONS-3 3.0-3.5 OLD CONS-4 0.0-0.5 OLD CONS-5 0.0-0.5 OLD CONS-6 0.0-0.5
Gross Alpha
I I
Hazardous Waste Treatment Facility (Bldg 133)
8-133-1 2.0 32.3 f 6.5 8-133-2 1.2-1.7 24.8f 11.4 8-1 33-3 0.3-0.8 36.8 5 8.5 8-1 33-4 2.5-3.0 11.5f 6.4 8- 133-5 9.0 30.5f 6.0 8-133-6 0.0 7.4 f 5.8
--
4.1.3 Pond Sediment Assessment
An assessment of SSFL ponds located in drainage paths at the site boundary was made in 1990.
The assessment was made to determine the potential for contamination resulting from use of the
ponds as retention basins for SSFL surface water runoff. The Area IV pond in that category, the SRE
Pond, was included in the study.
After draining the pond, four sediment sampling points were located, two near the pond inflow
area and two near the outflow area. The sampling locations are shown in Figure 4-9. At each point,
sediment samples were collected at 0 to 0.5,l to 1.5,2 to 2.5, and 3 to 3.5-ft depth intervals, or until
sampler refusal. Samples in the inflow consisted of fine sand, and those in the outflow area were
clayey sand.
Sediment samples were analyzed for gross alpha and gross beta radioactivity by EPA Meth-
od 900.0, and for gamma-emitting radionuclides by EPA Method 901.1. The results are given in


Table 4-4. The results are consistent with the expected background radioactivity. The (3-137 con-
centrations reflect atmospheric fallout from nuclear explosions. The lead isotopes are indicative of
the concentrations of the naturally occurring Th-232 and U-238 decay series. These series are the
major source of alpha radioactivity in Area IV soils. K-40 is a naturally occurring radionuclide
found in all soil radioactivity measurements, and is the source of most of the background beta radio-
activity.
4.1.4 Decontamination and Decommissioning Closeout Surveys
Rocketdyne Closeout Surveys
Area IV facilities for nuclear project activities have undergone decontamination and decommis-
sioning (D&D) as the programs they supported have ended. D&D involved surveys of facilities and
affected adjacent areas to assess their radiological status, decontamination of areas found to be radio-
active or contaminated with radioactivity, and closeout surveys following decontamination to verify
that radiation levels and radioactive contamination concentrations were within limits that would al-
low unrestricted use of the facility.
This section describes the D&D surveys made outside buildings, i.e., where contamination
would not be confined. Radiation and radioactive contamination contained within buildings are out-
side the scope of this plan.
The surveys provide Area IV screening information, which supports the selection of specific
potential areas of contamination. They supplement the Area IV Radiological Study in determining
the post-cleanup status of the two contaminated areas found in that study (Old Conservation Yard
and Bldg 064 Storage Yard), providing additional information about areas surveyed in the study, and
providing prior coverage of some, which were then excluded in the later study.
The results of the D&D closeout outside surveys are summarized in Tables 4-5 (for all facilities)
and 4-6 (for the regions for SRE D&D as shown in Figure 4-10). The tables show the types of mea-
surements made and the extent of these surveys. The tables do not include measurements that reflect
a precompletion status. Thus, all areas listed were shown not to contain radioactive contaminants.
The types of measurements made in D&D surveys were removable contamination surveys
(smear surveys), walk-through gamma radiation surveys, surface soil sampling and analysis, bulk
soil sampling and analysis, sampling and analysis of concrete that was left exposed as part of the
environment, and sampling and analysis of water. The sampling and analysis methods for these mea-
surements are described below.

Table 4-4, SRE Pond Sediment Radiation Data
Sample identifier
Date Sampled
Gross Alpha Radioactivity
(pCl/g)
Gross Beta Radioactivity
(pCi/g)
Gamma Radiation (pCl/g)
Pb-212 Pb-214

Table 4-5. Area IV Post-D&D Survey Measurements (Sheet 1 of 3)
Building Sample
Soil from surface of trench after removal of building sanitary sewer line (1 9 samples)
Soil from areas immediately adjacent to removed drain lines to Sodium Graphic Reactor (SGR) radio- active waste holdup tank (1 99 2-lb samples)
Smears of concrete rubble and underground plumb- ing to remain on site (200 samples)
Soil from 10 ft below surface along side of reactor shielding and below primary vault
Concrete from a portion of equipment vault wall
Water collected from sump drain system and vessel pit following rains during dismantling
Airborne particulates on filters in a continuous air sampler in work area during dismantling
Surface soil after backfilling of excavation
Walk-through survey of site prior to paving
Soil collected during and following removal of liquid and gas holdup tanks from yard on east end of building
Shallow groundwater collected during removal of cooling system water waste holdup system
Soil adhering to contaminated source storage well after removal, in the excavated pit, and in the pile of excavated dirt
Analysis
Count for beta radioactivity
Gamma spectrometry
Count alpha and beta radioactivity
Count beta radioactivity
Count beta radioactivity
Count beta radioactivity of residue after evaporating water
Count beta and gamma radioactivity
Count beta radioactivity
Measure gamma radioactivity dose rate
Count beta radioactivity
Count beta radioactivity of residue after evaporating water
Gamma spectrometry of dried samples
Results
Activities in pCi/g: 0.64 f 0.24 (U-238) 0.02 f 0.03 (U-235) 0.97 f 0.36 (Th-232) 15.3 f 5.6 (K-40) Not detected (Co-60, Cs-134, Cs- 137)
No alpha activity c50 dpmIl00 cm2 beta
<50 pCi/g
Normal background activity
Maximum gamma dose rate of 0.01 mradh
Normal background activity
Soil surrounding the storage well free of radioactive contamination
No evidence of contamination trans- fer from the storage well
Table 4-5. Area IV Post-D&D Survey Measurements (Sheet 2 of 3) -- --
Sample
Screening survey of side yard after removal of sur- face soil in contaminated areas to determine wheth- er more should be removed
Radioactivity dose rates at decontaminated areas (within 60 1 -m x 1 -m grids within areas and 18 locations around perimeter of area
Soil collected within decontaminated areas (one sample from each of 60 1 -m x 1 -m grids
Concrete from walls and floor of reactor room (to be buried)
Surface e Core samples (two 314-in. OD x 5 114 in. long)
Concrete dust during removal of activated concrete
Radiation and smear survey of facility after demoli- tion and removal
Walk-through survey 5 in. above soil surface after backfill (on 1 O-ft x 1 O-ft grid)
Soil from
e Open dirt area across driveway from door to reactor room (2 samples)
0 Drainage ditch leading from facility (3 samples)
Analysis
Measure gamma radioactivity dose .ate
Measure gamma radioactivity dose *ate
Samma spectrometry
Count alpha and beta radioactivities
Count alpha and beta radioactivities
Measure gamma radioactivity dose rate
Count alpha and beta radioactivities
Measure gamma radioactivity dose rate
Gamma spectroscopy
Results
Normal background activity
17.7 f 0.9 pR/h (15.21 to 20.27 pR/h range) within decontaminated areas
15.5 pR/h around perimeter of area (background)
4.9 pCi/g Cs-137 (<0.2 to 17.6 pCi/g range)
Total alpha and beta radioactivity derived from results are normal back- ground activities
Normal background activity
Normal background activity
Normal background dose rates
c20 dpm1100 cm2 alpha <1 00 dpm1100 cm2 beta
Normal background dose rates
Activities in pCi/g: 1.36 (U-238) 1.50 (Th-232) 0.20 f 0.1 3 (Cs-137) 23.3 f 1.3 (K-40)
No evidence of radioactivity from facility operation
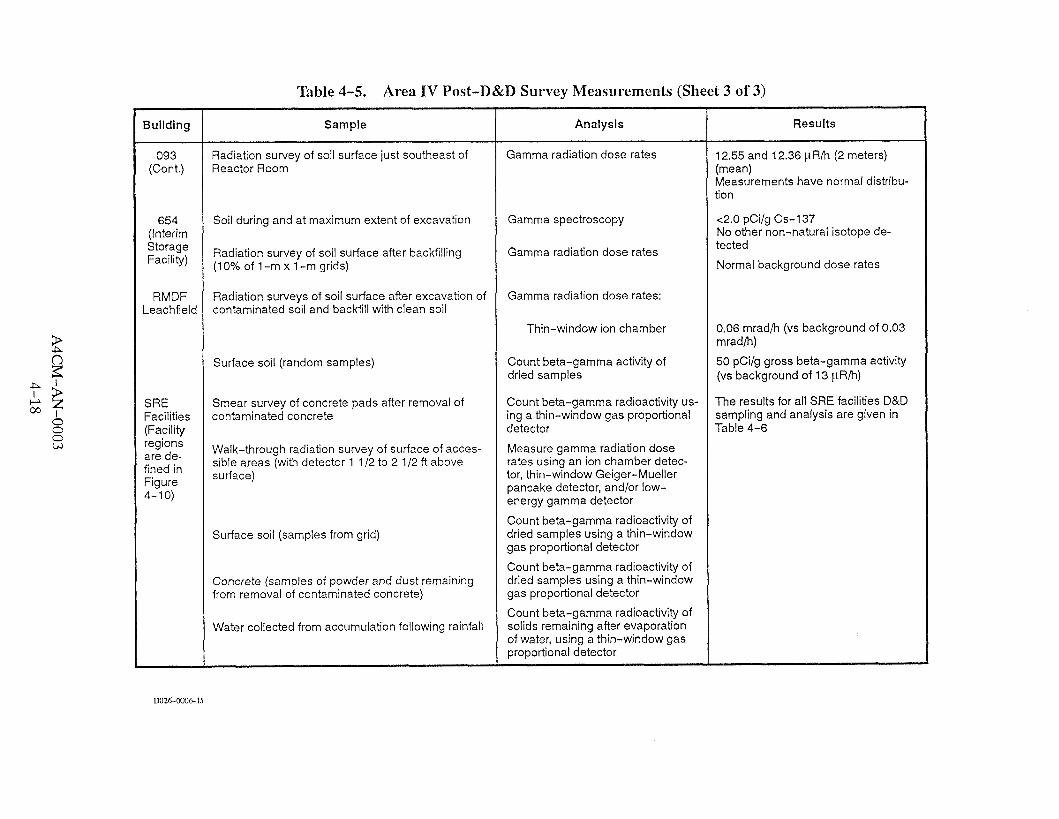
Table 4-5. Area IV Post-D&D Survey Measurements (Sheet 3 of 3)
Building
093 (Cont.)
654 (Interim Storage Facility)
RMDF Leachfield
SRE Facilities (Facility regions are de- fined in Figure 4-10)
Radiation survey of soil surface just southeast of Reactor Room
Soil during and at maximum extent of excavation
Radiation survey of soil surface after backfilling (10% of 1 -m x 1 -m grids)
Radiation surveys of soil surface after excavation of contaminated soil and backfill with clean soil
Surface soil (random samples)
Smear survey of concrete pads after removal of contaminated concrete
Walk-through radiation survey of surface of acces- sible areas (with detector 1 112 to 2 112 ft above surface)
Surface soil (samples from grid)
Concrete (samples of powder and dust remaining from removal of contaminated concrete)
Water collected from accumulation following rainfall
Analysis
Gamma radiation dose rates
Gamma spectroscopy
Gamma radiation dose rates
Gamma radiation dose rates:
Thin-window ion chamber
Count beta-gamma activity of dried samples
Count beta-gamma radioactivity us- ing a thin-window gas proportional detector
Measure gamma radiation dose rates using an ion chamber detec- tor, thin-window Geiger-Mueller pancake detector, andlor low- energy gamma detector
Count beta-gamma radioactivity of dried samples using a thin-window gas proportional detector
Count beta-gamma radioactivity of dried samples using a thin-window gas proportional detector
Count beta-gamma radioactivity of solids remaining after evaporation of water, using a thin-window gas proportional detector
Results
12.55 and 12.36 pR/h (2 meters) (mean) Measurements have normal distribu- tion
<2.0 pCilg Cs-137 No other non-natural isotope de- tected
Normal background dose rates
0.06 mradh (vs background of 0.03 mradh)
50 pCiIg gross beta-gamma activity (vs background of 13 pRh)
The results for all SRE facilities D&D sampling and analysis are given in Table 4-6

Table 4-6. SRE Facilities Post-D&D Survey Measurements
Region See Fiaure 4-10) I
Building 163 (SRE operations
mockup pit)
Building 143 (below grade)
Background
Limit
Removable :ontamination
8 dpm1100 cm2 (45 smears)
100 dpm1100 cn (beta)
Surface Radiation
0.04 mradlh (maximum)
Q times background on G-M detector
0.06 * 0.05 rnradlh (average)
(0.1 mradlh (maximum)
0.04 mradlh (average)
(0.1 mradlh (maximum)
0.7 0-0.1 5 mradlh (near Bldg 041)
0.05 rnradlh (average)
(other areas)
0.08 * 0.05 mradlh (maximum)
~ 6 . 0 5 mradlh
0.04 mradlh (average)
~ 0 . 1 mradlh (maximum)
0.04 mradlh (average)
4 . 1 mradlh (maximum)
10 ~ R l h
0.04 & 0.05 mradlh
0.1 mradlh
Soil Samples
16-45 pCilg (27 samples)
-
-
9.4-80 pCiIg (20-30 pCi/g
average) (34 samples)
6.6-40.2 pCi1g (22 samples)
22 pCi1g (average) 31.6 pCi/g (maximum)
(1 8 samples)
29 pCilg (average) 92 pCi/g
(maximum)
-
33 pCi/g (average) 98 pCi/g
(maximum) (1 08 samples)
25 pCi1g (average) 28 pCilg
(maximum) (25 samples)
430 pCi/g (22 samples)
51 pCi/G (average) 96 pCi1g
(maximum)
20-30 pCilg
-
Concrete Samples
c100 pCiIg 4 samples)
--
Water Samples

Figure 4-10. SRE Facilities Regions for Decontamination and Decommissioning D026-W6-IS

1. Removable Contamination Surveys. Hard surfaces (generally of concrete bh- ried or left exposed on the surface) were sampled for removable contamination by doing a smear survey. Filter papers were swiped around the surface, generally with a grid. The smears were counted for alpha and beta activities on an automat- ic counting system equipped with a thin-window gas proportional detector.
2. Walk-through Gamma Radiation Surveys. The surface gamma radiation lev- els were determined by a walk-through examination of all accessible parts of the regions noted in Table 4-5. The examination consisted of carrying gamma radi- ation detectors through the region while holding a gamma radiation detector about 1 m above the ground.
Two types of instruments were generally used for these surveys. One type was a detector which measured absorbed dose (e.g., Technical Associates Model CP-7 ion chamber detector or a Ludlum Model 12s Micro-R Meter). This type was the source of the dose rates listed in Tables 4-5 and 4-6. The other type was a detector that had a faster response and audible output to aid location of contami- nated areas during the walk-through. The surveys usually used a thin-window Geiger-Mueller pancake detector, sometimes supplemented by a low-energy gamma detector.
Surface Soil Sampling and Analysis. This method consisted of removing sam- ples of undisturbed top soil and counting them for radioactivity. Sampling loca- tions were selected to include locations of probable contamination concentra- tion or to provide a systematic sampling grid. Using the can lid as a scoop, soil from various spots around each sample station was added to a salve can until it was nearly full. The contents were then mixed thoroughly by shaking. Each sam- pie can was then opened and placed on a hot plate to drive off moisture. When dry, a small portion was taken from the can to be sieved. From this, a 1-gm por- tion was transferred onto an aluminum planchette. Alcohol was added and the sample tapped to settle it across the flat surface of the planchette. The sample was then heated to dryness. No chemical binders were added to hold the sample together for counting.
The sample was counted using a thin-window gas proportional detector. A 1-gm prepared KC1 standard source was counted with each group of soil sam- ples. The mass-specific activity of the standard was used to calculate the detec- tor efficiency to account for errors associated with self-absorption, backscatter, and the difference between a 2-pi counter geometry and a 4-pi source geometry.
4. Bulk Soil Sampling and Analysis. Samples of soil were also collected at other than surface locations (e.g., from the surface of trenches in Bldgs 003 and 009, and from the source storage well at Bldg 029). Analysis for beta and gamma ra- dioactivity was performed as described for surface soil samples. Samples for gamma spectroscopy were prepared by drying in an oven and removal of large chunks and rocks. AMarinelli beaker (450-mLvolume) was then filled with the soil sample and counted using a gamma spectrometer (multichannel analyzer coupled to a planar high-purity germanium radiation detector).
5. Concrete Sampling and Analysis. This method used debris or loose concrete powder and dust remaining from removal of contaminated concrete. Samples were placed on a hot plate to drive off water used in dust control. Samples were prepared and counted in the same manner as the surface soil samples.

6. Water Sampling and Analysis. This method was applied to surface water col- lected at a D&D location following rainfall or shallow groundwater encountered during excavation. From each water sample, a measured 500-mL portion was reduced in volume to about 10 mL on a hot plate. Undissolved soIids and the re- maining liquid were transferred to a counting planchette and heated to dryness. The samples were counted using a thin-window gas proportional detector, as described for the soil sample analysis.
Independent Closeout Surveys
Aradiological survey of the SRE was conducted by the Argonne National Laboratory Radiolog-
ical Survey Group to confirm decontamination by the D&D operation. The conclusion was that all
buildings and areas included in the SRE D&D project had been decontaminated to below the limits
required for release to unrestricted use. It was recommended, however, that the sewage and storm
sewers be investigated further to verify that the radioactivity concentrations measured were
representative.
Samples were collected at the accessible sanitary and storm sewer locations shown in Figure
4-11. Their radioactivity concentrations are listed in Table 4-7. The other sample shown in Figure
4-11,lO-ASPHALT-113, contained a high concentration of Cs-137 (786+/-79 pCi/g) in the next-
to-last survey at the SRE. The location was decontaminated before the final survey, but could have
been a source of Cs-137 in the storm drains through transfer by rainfall runoff.
4.1.5 Routine Soil Sampling
Area IV radiological monitoring began when planning for construction of the SRE was initiated
in 1954, to measure any impact of future activities on local radioactivity from naturally occurring
radioactive isotopes and fallout from weapons testing. The monitoring included collection of Sam-
ples of soil and vegetation. Routine sampling continued until after completion of major nuclear oper-
ations in Area IV. After review of the needs and results of the environmental monitoring program in
1986, routine vegetation sampling was terminated, and the frequency of routine soil sampling was
reduced. After a similar analysis in 1989, routine soil sampling was also terminated.
The results of soil sampling were reported in the annual environmental monitoring and facility
effluent reports for Atomics International (later Rocketdyne) facilities.
Routine soil sampling locations are shown in Figure 4-12 and listed in Table 4-8. The table
includes the frequency of sampling at each location. The locations in Area IV were sampled monthly
during the period of major nuclear activity, except for the semiannual sampling at six locations to

Hot Cell
k High Bay Area
0 meters 20
Box Shop Building 163
\
Figure 4-11. Sanitary and Storm Sewer Sample Locations

Table 4-7. SRE Sanitary and Storm Drain Radioactivity Data I
I Concentrations (pCi/g)
1.5 f 0.15
Dissolved Solids
monitor for plutonium release from the NMDF. The monthly sampling was reduced to quarterly in
1986.
Soil samples were collected from the upper 1 cm of undisturbed ground surface for gross radio-
activity analysis. Samples for plutonium analysis included soil to a depth of 5 cm. The samples were
packaged in paper containers and returned to the laboratory for analysis.
Soil sample preparation for gross radioactivity determination consisted of transferring samples
to Pyrex beakers and drying them in a muffle furnace at about 500°C for 8 hours. After cooling, the
soil was sieved to obtain uniform particle size. Two-gram aliquots of the sieved soil were placed in
stainless-steel planchets. The soil was wetted in the planchet with alcohol, evenly distributed to ob-
tain uniform sample thickness, dried, and counted for gross alpha and beta radiation. Gross alpha and
beta measurements were used for screening purposes and to permit a long-term historical record of
radioactivity in the environment. The counting used a low-background gas-flow proportional
counting system which was capable of counting both alpha and beta radiation simultaneously.
Measured sample count rates were adjusted to account for sample self-absorption. Alpha count
rate data conversion to alpha radioactivity concentrations initially used an efficiency factor derived
from a sample with distributed alpha activity and a thickness that is large relative to the alpha particle
range. This provides reported values which closely represent the actual alpha activity existing in the
environment.

Figure 4-12. Routine Soil Sampling Locations in Areas I11 and IV

Table 4-8. Routine Soil Sample Locations
Location Frequency of Sampling
Area lV
Building 143 southeast side SRE Pond Building 064 north parking lot area Building 020 west fence Building 363 east parking lot area Building 093, at reactor building driveway Above SRE Pond Building 028 upper parking lot area Building 886, at former Sodium Disposal Facility gate Building 029, at driveway Drainage channel at 17th and G Streets F and 24th Streets J Street, south of Building 055 exhaust stack Building 353, south of road
Background - SSFL
Silvernale Pond southside SSFL site entrance, Woolsey Canyon R-2A Pond R-2A Pond bottom mud, north side East side of entrance to Test Area CTL IV Pond R-2A northwest side Near SSFL south boundary, Bell Creek Weir, and Well 9
Background - non-SSFL
SSFL access road, at upper mobile home park entrance Simi Valley, southeast corner of Alamo Avenue and Sycamore Road Agoura, Kanan Road, and Ventura Freeway, at Frontage Road Calabasas, Parkway Calabasas and Ventura Freeway at Frontage Road North gate of Chatsworth Reservoir north boundary Bell Creek at Ventura County line Simi Valley, east end of Alamo Avenue
aVegetation and soil were sampled through 1984 at all stations except 57 through 62, at which only soil was sampled. After 1984 and through 1989, only soil was sampled at all stations.
bLocation not sampled after 1988. CLocation 62 replaced Location 54 in 1986. dThe frequency of sampling was changed from monthly (M) to quarterly (Q) in 1986. Other locations were sampled monthly, quarterly, or semiannually (S), as noted.

Beta count rate data conversion to beta radioactivity concentrations used a measured self-
shielding correction curve. Self-absorption standards of different masses (thicknesses) of I(CI were
counted. The natural radioactivity of potassium is known. For each sample the ratio of this activity to
the observed count rate was plotted as a function of sample mass. The correction curve was the
smooth curve drawn through the plotted points.
Quality assurance measures incorporated into the sample analysis included monitoring of
counting system efficiencies using standard sources traceable to the National Institute of Standards
and Technology (NIST), and verification of the overall analysis by participation in the DOE-
sponsored Environmental Measurements Laboratory Quality Assessment Program. In addition to
participation in this program, analyses of split and replicate samples were routinely used to evaluate
the reproducibility of soil sample radioactivity measurements.
Soil analysis for plutonium concentration was performed by a certified independent testing lab-
oratory using a chemically specific method, according to the guidelines specified in NRC Regulato-
ry Guide 4.5 (Measurements of Radionuclides in the Environment - Sampling and Analysis of Plu-
tonium in Soil). This provided a higher detection sensitivity for plutonium than gross alpha
measurements could provide. In this analysis, the individual samples were leached with acid, and the
leachate treated chemically to separate and concentrate any plutonium present. In this way, minute
quantities of plutonium, such as that distributed globally by testing of nuclear weapons, could be
detected and measured quantitatively by alpha spectroscopy.
Results are summarized in Table 4-9 for routine gross alpha and beta radioactivity measure-
ments from 1984 through termination of the program in 1989. These results are typical of those
obtained throughout the program. They indicate no significant source of unnatural radioactive mate-
rial, and show no significant difference between on-site and off-site samples. The table presents the
annually averaged radioactivity concentrations for each sample type within and outside Area IV, and
the maximum concentrations detected for a single sample from the annual set. Limits of error re-
ported are for one standard deviation (la). calculation of the averages included negative values
obtained after correction of measurements for counting background. This non-censored data aver-
aging, recommended by DOE Order 5484.1, afforded a better estimate of the central value and dis-
persion of the data. The maximum concentration of each sample set is reported because of its signifi-
cance in indicating the occurrence of a major episode or an area-wide incident of radioactive
material deposition.
Results are summarized in Table 4-10 for plutonium radioactivity measurements from 1984
through 1989. There is no significant variation in these values during the period.

Year
Area IV
1989
1988
1987
1986
1985
1984
Non-Area IV
I988
1987
1986
1985
1984
Table 4-9. Routine Soil Sampling Radioactivity Data
s I Alpha Radioactivity (pCi1g) Beta Radioactivity (pCilg)
4.1.6 Soil Sampling at N H L
An inspection was conducted by the NRC to evaluate the control of NRC-licensed radioactive
material at the RIHL (Bldg 020) and to establish a set of sample data points in connection with activi-
ties at this facility. The inspection consisted of collection in November 1989 of soil samples at the
eight selected locations listed in Table 4-11. The samples were split (scoop-for-scoop) to provide
duplicate samples for independent analyses by NRC and RP&HPS.
The RP&HPS sample set was prepared and analyzed in the RP&HPS laboratory used for routine
soil and vegetation analyses (Sections 3.1.2.8 and 3.1.2.9). The samples were preprocessed by
oven-drying (in bread pans at 450°C for about 4 hours), ball milling, and sieving (20-mesh screen).
They were then counted in Marinelli beakers for gamma emitters.
The NRC sample set was analyzed in the NRC Region V laboratory by gamma spectroscopy.
There was little or no preprocessing of the samples before the analysis, as indicated by the reporting
of results for "wet7' samples. This reduced the observed mass-specific activity concentrations by the
fraction of sample mass that was water, which could be approximately 20 to 40%.
The results of the sample analyses are given in Table 4-12. The table also gives means and stan-
dard deviations for the values reported (excluding zeroes for the "not reportedhot detected" values)

Table 4-10. Routine Soil Sampling Plutonium Radioactivity Data
Radioactivity (10-3 pCI/g) by Sampling Location (Ref. Table 3.1.2-16)
Date Pu-239 and Pu-240

Table 4-11. RIHL Soil Sampling Locations
Sample Number Sample Location - -
Surface soil at the outside wall of the Building 020 Hot Storage Room
6 in. below the surface of the soil at the outside wall of Building 020 Electrical Equipment Room, from a recently dug excavation pit for the removal of unused fission gas collection tanks
Surface soil from sampling trenches on the east and west sides of the North Loading Dock at Building 020
Surface soil from a run-off drainage area outside the fence on the northeast side of the Building 020 liquid waste facility, along the side of 24th Street
Surface soil from a run-off drainage area outside the fence on the southeast side of the Building 020 liquid waste facility, along the side of 24th Street
Surface soil from a drainage ditch at the southeast side of the intersection of 24th and J Streets, southeast of Building 020
Surface soil at the southwest side of the road in the southwest corner of Area II, near Well No. WS-9A
Surface soil near the Area IV boundary, on the south side of the road and southwest of ihe former Sodium Disposal Facility
and the ratios of U-235 to U-238. The measured radioactivity concentrations are consistent with
expected background levels. There were no apparent identifiers (Am-241) to indicate the presence
of plutonium or other NRC-licensed radioactive material in excess of natural background concen-
trations. The results are discussed in the following steps:
For U-238, U-235, and K-40 (the naturally occurring radioactivities), the observed variations are close to the expected variations based on the reported uncertainties (derived for the RP&HPS analysis by the multichannel analyzer, from the counting statistics). This shows that the concentrations of these isotopes are essentially the same in all samples.
The measured ratios of U-235 to U-238 are consistent with the expected value of 0.046 calculated from the naturally occurring fraction of U-235 in uranium and the ratio of the half-lives of the two isotopes.
For Cs-137, there is a relatively large observed variability relative to the expected variability. (The two variabilities are consistent, however, when the larger uncertainty of the sample concentrations causing the difference is considered). The two samples for which relatively high concentrations were measured were from areas that had been decontaminated to an acceptable level, but not to background levels.
NRC detected Co-60 in one sample (from a drainage ditch), while RP&HPS did not detect this isotope from the split sample from that location.
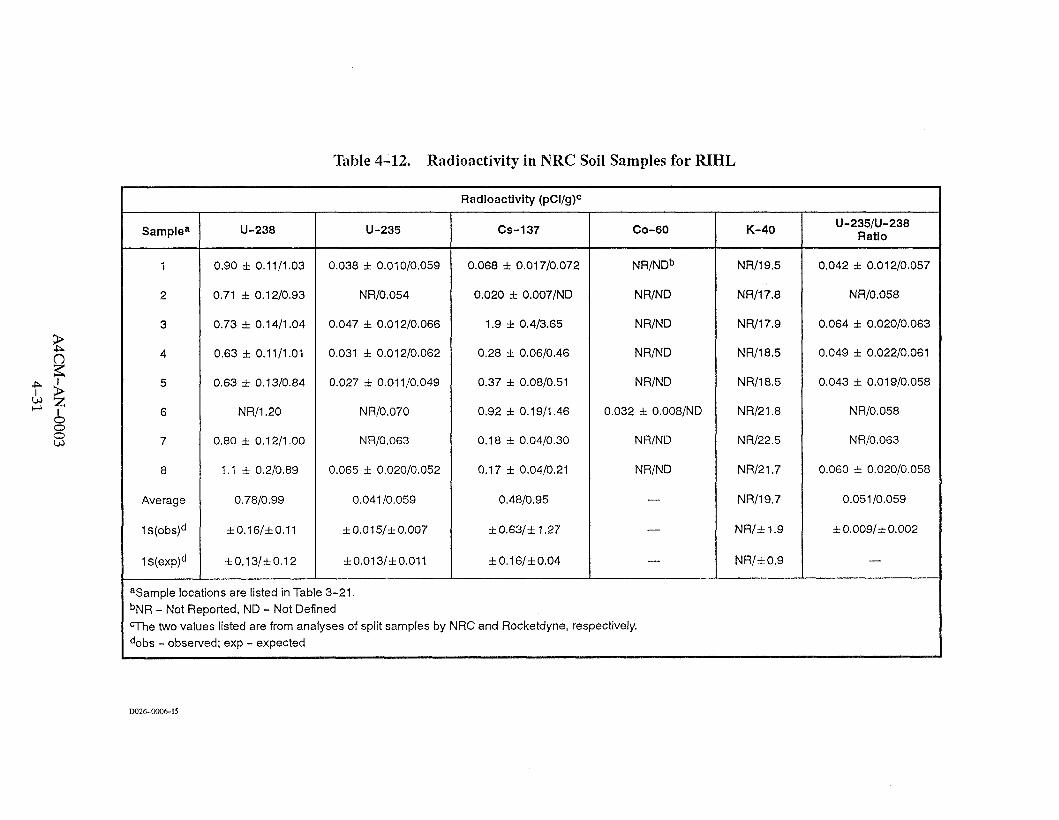
Table 4-12. Radioactivity in NRC Soil Samples for RIHL
1
2
3
4
5
6
7
8
Average
1 ~ ( o b s ) ~
I ~ ( e x p ) ~
Radioactivity (pCi/g)C
CS-1 37
0.068 f 0.01 710.072
0.020 f 0.007/ND
1.9 f 0.413.65
0.28 f 0.0610.46
0.37 f 0.0810.51
0.92 f 0.1911.46
0.18 f 0.0410.30
0.17 f 0.0410.21
0.4810.95
rt 0.631f 1.27
fO.16l f 0.04
NR/NDb
NR/ND
NRIND
NR/ND
NRIND
0.032 f 0.0081ND
NRIND
N R/N D
-
-
-
asample locations are listed in Table 3-21. ~ N R - Not Reported, ND - Not Defined T h e two values listed are from analyses of split samples by NRC and Rocketdyne, respectively, dabs - observed; exp - expected
U-235/U-238 Ratio

4.1.7 Soil Sampling at the NMDF
The Nuclear Materials Development Facility (NMDF [Bldg 0551) has been decommissioned.
Decontamination work to permit decommissioning included removal of drain lines servicing sinks,
showers, and floor drains in the laboratory support area of the facility. The drain lines were below
grade, in soil, and combined into one drain line which exited below the east side of the building. This
drain line then ran south into a pit, where it connected with the receiving tank for the radioactive
liquid holdup system. Only small amounts of plutonium could have been in water in this drain line
since only laboratory cleanup water, floor mop water, etc., ran into these drains. All water and other
liquids that could have been significantly contaminated were solidified in gloveboxes for disposal as
radioactive waste.
Sampling programs were carried out by Rocketdyne and, as a confirmatory activity, by NRC.
These two programs were generally carried out separately and are described separately below.
Rocketdyne. Soil Sampling at NMDF
Soil samples for plutonium analysis were collected from the soil that had surrounded the drain
pipe because of the possibility of leaks in the pipe and accumulation of small amounts of plutonium
in the soil, or possible spillage of sediment from the pipes during removal. Samples consisting of
approximately 0.5 to 1.0 kg each were taken from the bottom and sides of the trenches adjacent to the
drainpipes after complete removal of the pipes. The samples were generally taken near joints and
other possible leak locations. Samples were also taken from excavated soil. The samples were placed
in plastic jars and sent directly to the analysis laboratory.
In addition to the trench excavation samples, four samples of freshly exposed subsoil were taken
as background samples from the excavation for a new facility about 1100-ft upstream and crosswind
from the NMDF.
Soil analysis was done by U.S. Testing Company in Richland, Washington. The analysis used
the acid leach method recommended by NRC Regulatory Guide 4.5 (Measurement of Radionuclides
in the Environment--Sampling and Analysis of Plutonium in Soil). The radioactivity concentra-
tions of Pu-238 and Pu-239 + Pu-240 were determined using alpha spectrometry.
The results are shown in Table 4-13. The listing of samples is in their approximate order in the
flow path, starting with the furthest upstream location and continuing roughly sequentially down to
the holdup tanksystem. The uncertainties shown in the table are one-sigma estimates. While several

Table 4-13. Plutonium Radioactivity in NMDF Drain Trenches
Sample Number
Inside Building - West-to-East 15 14 12 6A* 13 11 20 8 9
10 5A*
104 7 6
Chem. Support Room 1
19 2
18 5
4Af 103
17 16 4 3
Outside Building - EastjWest 1 -A 1 -B 2-A 2-8
1 A* 101 3-A 3-8
Outside Building - North/South 4-A 4-8 5-A
3A* 5-B 6-A
2A* 7 02 6-B 7-A 7-8 8-A 8-8
Background 2 1 22 23 24
7A* 61
June 26
Activity Concentration (pCilg)
"Samples collected by NRC. Other samples were collected by Rocketdyne.

of the samples indicate detectable contamination, none are near the NRC acceptance limit of
25 pCi/g for plutonium in soil.
NRC Soil Sampling at NMDF
Samples for confirmatory analyses were collected from the trenches in 1985 by NRC inspectors
from Region V, Office of Inspection and Enforcement. The samples were analyzed for plutonium by
the Radiological Environmental Service Laboratory of DOE in Idaho Falls. Samples split from sev-
eral of the NRC samples were analyzed by U.S. Testing Company in Richland, Washington. There
were two background samples. One (No. 7A) was a combined portion of the background samples
Nos. 21 through 24 collected by Rocketdyne, and one was a sample (No. 61) which had been col-
lected off-site previously by NRC.
The results are shown in Table 4-13. None of the samples show plutonium activity exceeding
about 6% of the allowable limit of 25 pCi/g for plutonium activity in soil.
4.1.8 Naturally Occurring Radionuclides in Rock, Soils, and Groundwater
An investigation was made of naturally occurring radionuclides in rocks, soils, and groundwa-
ter typical of Area IV, but in areas where no nuclear activities have been conducted and downgradient
of such areas. The sampling locations are shown in Figure 4-13. Groundwater samples were col-
lected from three shallow zone wells (SH-11, RS-5, and RS-28) and five Chatsworth formation
wells (RD-6, RD-14, WS-13,OS-16, and 0s-21). Rock samples included four sandstone samples
(NE-1, NE-5, NE-6, and NE-8) and three siltstone samples (NE-4, NE-7, and NE-7A). Sample
NE-7A was collected adjacent to sample NE-7 to approximate a sample duplicate. Soil samples in-
cluded two sandy silt samples (NE-3 and NE-9) and one sandy clay sample (NE-2).
Samples were analyzed for gross alpha and gross beta radioactivities, gamma-emitting radio-
nuclides, Ra-226, Ra-228, isotopic uranium and thorium, Pb-210, and Po-210. The methods used
are listed in Table 4-14.
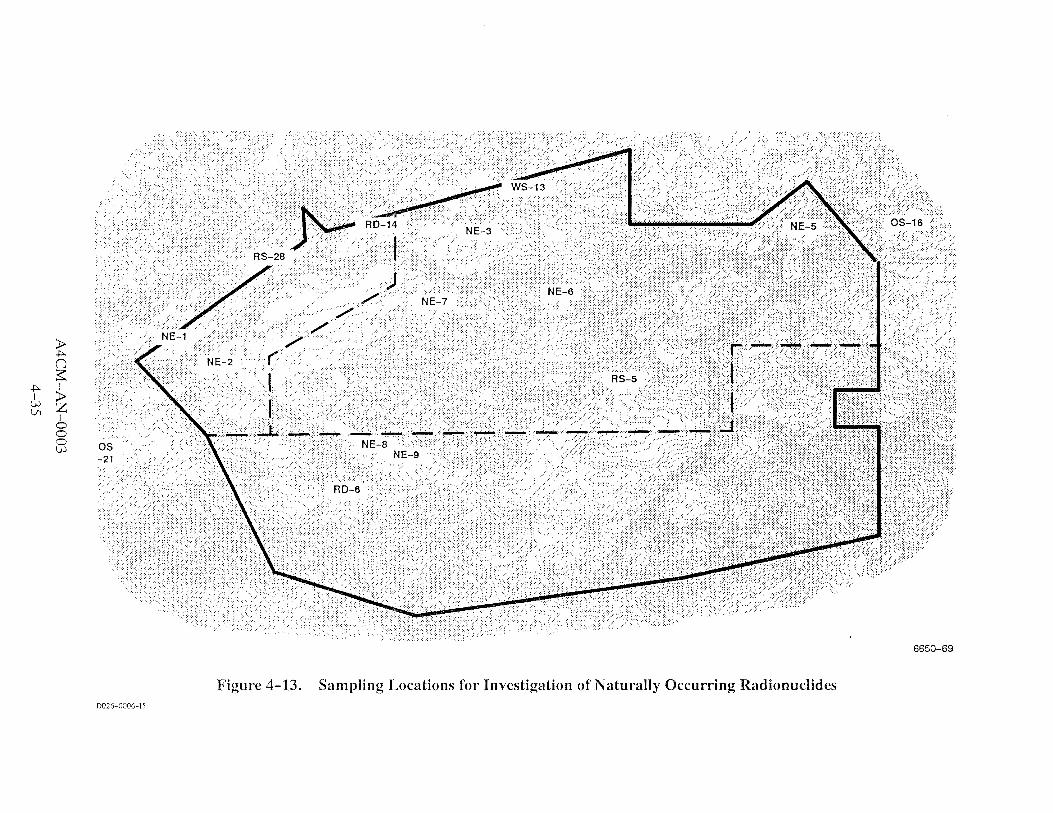
Figure 4-13. Sampling Locations for Investigation of' Naturally Occurring Radionuclides 11026-0006-15

Table 4-14. Analytical Methods for Investigation of Naturally Occurring Radionuclides
I Parameter I Method
I Gross alpha and gross beta radioactivity I I Gamrna-emitting radionuclides
(Analyses for K-40, Cs-137, Pb-212, and Pb-214)
I Uranium isotopes I Thorium isotopes
Po-210
EPA 900.0*
EPA 901 .l*
€PA 900.1 *
EPA 908.0*
Ion exchange separation, alpha count
Spontaneous deposition, alpha count
Beta count of bismuth daughter product Lead-210 I %PA - 60014-80-032, 'Prescribed Procedures, Measurement of Radioactivity in
Drinking Water," US EPA, August 1980
The measured radioactivities are listed in Tables 4-15 (groundwater) and 4-16 (rock and soil).
The predominant natural radionuclides identified in the rocks and soils were potassium, uranium,
and thorium. Of these only uranium is significantly soluble in water. Uranium was the predominant
radioactive material found in the groundwater. Drinking water standards for radioactivity and radio-
nuclide concentrations were not exceeded in any of the groundwater samples collected. Man-made
radionuclides were not detected in any of the samples collected.
4.2 RELATED ACTIVITIES
There are other programs related to the Area IV radiological characterization program defined
by this plan. Four such programs are described in this section: D&D of Area IV facilities, remedial
action in Area IV, SSFL groundwater characterization and monitoring, and sampling programs con-
ducted in the neighboring Brandeis-Bardin Institute (BBI).
4.2.1 Decontamination and Decommissioning Program
Decontamination and decommissioning (D&D) addresses contamination within facilities.
Since this contamination is of limited, well-defined extent (generally confined within structures), it
is not addressed in this plan. The D&D program includes post-cleanup surveys to ensure that no
facility contamination is remaining to pose a threat to the environment.
D&D of Area IV facilities has been proceeding for over 20 years. D&D has been completed for
the facilities and areas listed in Table 4-17. Additional facilities and areas (Table 4-18) have been

le 4-15. Measured Radioactivity for Natural Emitters in Groundwater
Sample Radioactivity ( ~ C i l l ) ~
Gmss Alpha I Gross Beta 1 Po-21 0 Ra-226 Ra-228 Th-232 U-234 U-235
I 1 I Shallow Zone Groundwater (Wells SH-11, RS-5, and RS-28)b I
I
Mean 6.7 3.7 0.086 0.095 0.89 0.017 4.56
Range: Low 4.6 f 2.5 2.4 f 1.6 0.032 f 0.018 0.003 f 0.459 0.68 f 0.54 0.0019 f 0.00E8 3.29 f 0.57
High 9.5 f 5.0 5.3 f 2.8 0.175 i 0.048 0.25 f 0.09 1.16 f 4.87 0.039 f 0.02C 5.81 f 0.83
C h a t s w o ~ Formation Groundwater (Wells RD-6, RD-14, WS-13,C OS-16,C and 0s-211d I I I Mean 1 3.5 1 4.7 1 0.036 0.78 1.52 0.01 9 2.00 0.064
Range: Low 1.0 f 1.5 1.9 f 1.6 0.010 f 0.013 0.48 f 0.15 0.85 f 0.53 0.89 f 0.22 0.014 f 0.050 0.00 f 0.0070
High 5.5 rt 2.7 6.9 f 2.7 0.139 f 0.042 1.09 f 0.23 2.32 f 0.72 2.63 f 0.45 0.131 f 0.088 0.065 f 0.02;
aAnalyses for Cs-137, Pb-210, Po-210, Th-228, and Th-230 showed no radioactivity greater than the overall laboratory error; therefore, results are not listed. bRadioactivity values are for filtered water samples. Two samples from each of the three wells were collected on separate days for gross alpha and gross beta activity analysis. One sample
from each well was analyzed for isotopic content. CDupiicate samples were collected. Analyses results are included in the averages. dRadioactivity values are for filtered water samples. Two gross alpha and gross beta samples were collected on separate days fsr each well primary and duplicate sample, except that only
one sample was collected from Well WS-13 (1 3 samples total). For Cs-137 analysis, 11 samples were analyzed (two each from Wells RD-6, RD-14, WS-13 [duplicate], and 0s-21, and one each from each of the other wells). For Pb-210, seven samples were analyzed (each of the five wells plus a duplicate sample from 0s-16 and a repeat sample from 0s-21). For the other isotopes, six samples were analyzed (each of the five wells plus a duplicate sample from 0s-16).
Table 4-16. Measured Radioactivity for Natural Emitters in Soil and Rock
Radioactivity (pCi/gm)
CS-137
0.115
NDA
0.64 f 0.11
NDA
NDA
0.016 f 0.034
0.068
0.021 f OB37
0.126 f 0.027
Sandstone (Locations NE-1, NE-5, NE-B, and NE-8)
Mean 6.3 30.8 24.2
Range: Low 3.9 f 2.2 28.6 f 4.6 21.4 f 2.9
High 8.6 f 3.2 33.3 f 5.2 26.5 4 2.9
Siltstone (Locations NE4, NE-7, and NE-7 Duplicate Sample)
Mean 7.3 39.2 25.9
Range: Low 4.8 f 2.4 38.2 f 5.6 24.7 f 2.8
High 9.0 It 3.2 39.8 f 5.8 26.6 f 2.8
E-3, and NE-e) I
\IDA = R e s u b less than instrument background count.

This page intentionally left blank,

Table 4-17. Facilities with Completed Decontamination and Decommissioning - --
Name
Organic Moderated Reactor (OMR) and Sodium Graphite Reactor (SGR) Critical Facility (now lnservice Inspections Development)
S8ER Test Facility (building now removed)
Shield Test lrradiation Reactor Facility (above- grade part of building has been removed)
Radiation Measurements Facility (later Old Cali- bration Facility; now Reactive Metals Storage Facility)
Nuclear Material Development Facility (NMDF)
Kinetic Energy Water Boiler Facility (KEWB) (building now dismantled)
AE-6 Facility (later L-85 Facility; now Neutron Radiography)
Advanced Epithermal Thorium Reactor Facility (later Epithermal Critical Experiments Laboratory; then Fast Critical Experiments Laboratory; now Health Physics & Radiation Safety, and Com- puted Tomography)
Sodium Reactor Experiment Complex (Figure 2-23)
Radioactive Materials Disposal Facility (RMDF) leachfield
Old Conservation Yard area east of the Oil Tank Farm
New Conservation Yard
Use
Reactor physics testing; inservice inspection development testing
S8ER SNAP reactor testing
Shield Test Irradiation Reactor operation; U02 melting tests
Radiation detector calibration laboratory; Alkali metal waste storage
Plutonium fuel manufacturing
Water boiler reactor physics reactivity transient experiments
Reactor physics tests and neutron radiography using the water boiler reactor neutron source
Reactor physics experiments for breeder reactors
Operation of a small sodium-cooled, graphite- moderated reactor
Former sanitary leachfield for the RMDF
Storage of excess materials pending reuse or disposal
Storage of excess materials pending reuse or disposal

Table 4-18. Buildings and Areas Shown by Survey Not to be Radioactively Contaminated
Name
SNAP Components Assembly and Components Testing Facility (now Thermal Transient Facility)
SNAP Systems Nuclear Qualification Test Facil- ity (now ETEC Computer Center)
SNAP Remote Mockup Facility (now SCTl Maintenance and Storage)
SNAP Vibration and Shock Laboratory (now Rocketdyne Weld Shop)
Particle Accelerator Facility (now Rocketdyne Traffic and Warehousing)
Space Environment Test Facility (now LMDL-1 Test Facility)
SNAP Shield Casting Facility (now LMFBR Development Testing)
Hydraulic Test Facility Control Center (most recentiy PDU Control Center)
SNAP Critical Facility (facility not now in use)
SNAP Control Rod Assembly (most recently Control Shelter Building)
Shipping and Receiving
Parking Lot 51 3 and adjoining roadway
Old radioactive laundry area (the buildings in the area Pldgs 063, 273, and 2831 for general stor- age, laundry processing, and laundry storage, have been demolished)
Field between KEWB and RMDF
Field between Building 100 and 23rd Street
Building 626 storage area
Area northwest of Buildings 012, 013, 019, and 059
Use
Nonnuclear SNAP support
Criticality testing of SNAP reactors (fuel assem- blies were encapsulated; no radioactivity releases or significant neutron activation occurred)
Nonnuclear SNAP support
Nonnuclear SNAP support
Nuclear physics experiments using a Van deGraaf accelerator
Nonnuclear SNAP support
Nonnuclear SNAP support; depleted uranium experiments
Support for Building 005 activities
Reactor physics testing
Nonnuclear SNAP support
Receiving and shipping of packaged nuclear and nonnuclear materials; storage of non- nuclear. nonradioactive materials
Pathway for transport of nuclear and non- nuclear materials
Processing to laundry vendor clothing used for contamination protection
None (open space between an active and a formerly active facility)
Disposal of construction debris; storage of non- radioactive materials and equipment
Storage of nonnuclear materials
None (area too rugged for any function, but it is adjacent to contaminated buildings)

surveyed (Section 4.1.1) to verify that no D&D is required. Facilities used for contamination-
generating programs became candidates for D&D when the programs were terminated. At the pres-
ent time, more than 99% of the man-made radioactivity generated in Area IV has been removed. It is
estimated that less than 10 Ci of this radioactivity remains in Area IV.
There are nine facilities and one equipment item included in the D&D program. The status and
schedule for completion of D&D activities for each are listed in Table 4-19. D&D for all except two
facilities is expected to be completed during the current year. One of the exceptions is Building 020
(RIHL), for which a multiyear clean-up activity. The other exception is the RMDF, which processes
wastes from cleanup of other facilities and cannot be completed until all other D&D cleanup has
been finished.
4.2.2 Remedial Action Program
The ETEC Environmental Restoration and Waste Management Program five-year plan for
remedial action includes remediation (excavation and removal of contaminated soil) in FY 1995 of
the Building 056 Landfill (including the Building 056 Pit) and the Building 100 Trench. Therefore,
these areas are not included in the scope of the Area IV Radiological Characterization Plan.
4.2.3 SSFL Groundwater Characterization and Monitoring
Groundwater chemical contamination was found at SSFL in 1984. An extensive hydrogeologic
investigation has since been conducted by the Rocketdyne Environmental Protection Department.
The investigation initially concentrated on Areas I, 11, and 111, where volatile organic compounds
resulting from rocket engine testing activities were the initial contaminants discovered. It has since
expanded to include Area IV. The investigation has been conducted largely under the guidance and
direction of several regulatory agencies. Chemical contamination has been the primary interest, but
the groundwater analyses have included radioactivity.
A total of 173 wells, including 9 wells in 3-well clusters, have been constructed within SSFL
and at surrounding locations. Of these wells, 26 are located within Area IV and two 3-well clusters
are located just outside the northwest boundary of Area IV. Additional monitoring wells are planned,
including eight within or adjacent to Area IV. Groundwater from this network of wells is initially
characterized and then periodically sampled and analyzed to monitor contamination levels.
Tritium has been detected in some Area IV wells and off-site wells adjacent to the northwestern
boundary of Area IV. Gross alpha and beta radioactivities and radium isotopes (Ra-226 and Ra-228)
have also been reported at elevated levels from the off-site wells.

Table 4-19. Planned Decontamination and Decommissioning Activities
I Schedule
Complete D&D DOE Release D&D Status
Decontamination and the final radiation survey have been completed.
Removal of remaining radioactivity (contamination in the ventilation system and activation radioactivity in the steel-lined concrete test cell) is to be completed this year.
D&D activities begun in 1989 are continuing. The hot cells and decontamination rooms are being cleaned. This will be followed by cleanup of the service gallery and hall, basement, and building exhaust system.
The radioactive liquid holdup tank and associated piping are to be removed.
The remaining radioactivity is confined in the building concrete. Controlled access and routine surveillance of the building is being maintained as the radioactivity de- cays to levels requiring no further action.
Removal of activated steel and concrete from the reac- tor test cell and surrounding cells is to be completed this year.
Decontamination has been completed. The final radi- ation survey will complete work on this facility.
Completion of contamination removal and the final radi- ation survey are scheduled for FY94.
This equipment is to be decontaminated as a D&D SSFL Work Areas activity.
Near-term activities will be directed to decontamination of outside areas and decontamination of buildings not needed for ongoing use of the RMDF. Final D&D of the RMDF will be the last environmental restoration activity in Area IV since the facility will be needed to handle pro- cess wastes from other cleanup activities. The RMDF completion date will be determined by the schedule for other facilities.

4.2.4 Brandeis-Bardin Institute Sampling Study
Sampling programs have been conducted and are continuing at the Brandeis-Bardin Institute
(BBI), which is adjacent to Area IV on the north and northwest. The earliest was sampling of soil,
vegetation, and artesian well water in 1991 by a consultant to BBI.
1. The soil samples were analyzed for tritium and other radionuclides. Cs-137 was detected at a concentration of 0.671 pCi/g(dry) in a sample from the RMDF drainage channel.
2. Vegetation samples were analyzed for radiation. K-40 was detected in seven of the eight samples at concentrations ranging from 5.92 to 16 pCi/g(wet). In one of three samples analyzed for tritium, a concentration of 0.100 pCi/g(wet), the de- tection limit, was measured. The levels of both of these isotopes were concluded to be within natural background levels.
3. Water samples were analyzed for tritium and gamma-emitting isotopes. The results were below the detection limits of 200 pCi/L for tritium and 4.0 to 5.0 pCi/L for Cs-137.
The other completed sampling program was conducted in March 1992 for Rocketdyne by
McLaren/Hart Environmental Engineering Corporation to assess whether there had been chemical
or radionuclide migration and/or deposition on the two properties adjacent to SSFL on the north. The
program was designed as a screening tool to determine whether chemicals and/or radionuclides from
operations at SSFL were present on the adjacent properties during the period sampled. A followup to
this program is being conducted in March 1994.
Two parts of the 1992 program (background area investigations and sampling of ravines which
carry rainfall runoff from Area IV) are relevant to this plan. Soil sampling and analysis results for
these parts are summarized here. In addition to the results given here, there were split soil samples
analyzed independently by EPA and Department of Health Services (DHS). Also, there were water
samples collected and analyzed in the background areas and the ravines. The results for the split soil
samples and the water samples are given in Reference 4-1.
4.2.4.1 Background Investigations
Background areas were sampled to provide a basis for evaluating the results from samples col-
lected in BBI to distinguish naturally occurring radionuclides from those which might have origi-
nated from Rocketdyne. Six locations were selected on the basis of soil type, surface geology, slope,
exposure, similarity of vegetation, wind direction, accessibility, distance from Rocketdyne, and rec-
ommendations by regulatory agencies and citizen groups. The locations of the background areas are
shown in Figure 4-14 and are described below.
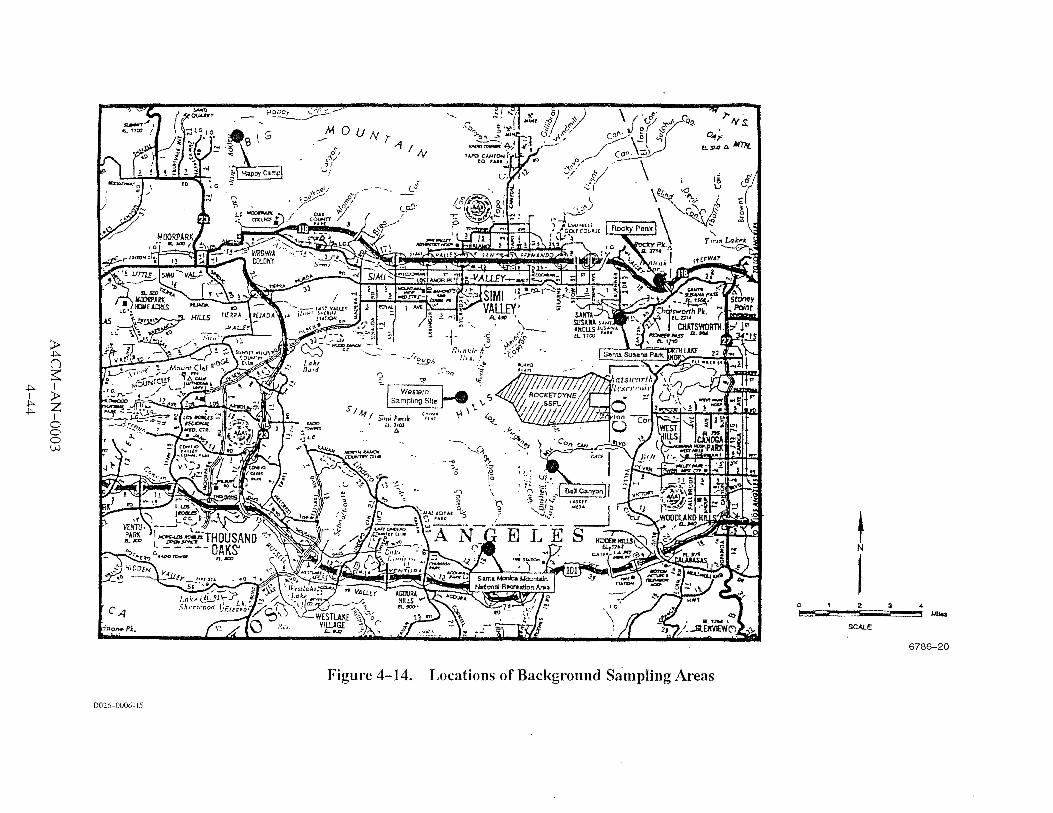
Figure 4-14. Locations of Background Sampling Areas
0 1 2 3 4
I SCNE

Rocky Peak. The Rocky Peak background sample area is approximately 4.9 miles northeast of the SSFL and north of the Route 118 Freeway at the Rocky Peak exit. The sample grid was located along the north side of a fire road directly above the parking area. It was on a steeply sloping area near its northern edge and on a more level area along its southern margin. It was partially covered by grasses with some shrubs. Numerous sandstone outcroppings and boulders were also exposed along theslope. The grid location was selected because the dis- tance and height above the freeway was considered sufficient to avoid most chemical deposition from freeway traffic. (This consideration was important because the study included chemical as well as radiological characterization.) The soil collected was silty sand, dark brown to black, fine to medium grained, poorly graded, plastic, moist, and with organic material and roots.
2. Santa Susana Park. Santa Susana Park is located approximately 2 miles south of the Route 118 Freeway and approximately 3 miles north of the SSFL main gate. The sample grid was located on a plateau south of the main park area. The pla- teau was bounded on the north by a short slope and on the south be a gradual hill leading to a steeper hill. The area was partially devoid of grass or plants except around the perimeter. Several trees were present. A small drainage area, which was dry at the time of sampling, appeared to run from the eastern slope through the center of the sampling area. The soil collected was a brown sand, fine to medium grained, poorly graded, and dry.
3. Bell Canyon. The Bell Canyon location is approximately 6.5 miles south of the Route 118 Freeway and approximately 2.5 miles southwest of the SSFL main gate. The area sampled was near the top of a hillside, which faced northwest. The antenna at the Santa Monica Mountains Conservancy could be seen in the dis- tance at 10 deg west of north. The hill overlooks Bell Canyon Boulevard. Access to the area was by a fire road that continued up the hill beyond the grid location. Approximately two-thirds of the way down the hillside, a 4- to 6-foot ridge was formed that traversed the sampling area, possibly the result of a landslide. The area was covered with grasses and forbs except along the roadway. A few trees were present southeast of the sampling area. The soil collected was a brown sand, fine to medium grained, poorly graded, and dry.
4. Western Location. The Western Location is approximately 4.5 miles south of the Route 118 Freeway and approximately 2 miles west of a Rocketdyne water tank (a landmark visible from the sampling area). The sampling area was part of a southward-facing slope and adjacent to a barbed-wire fence. The slope was covered predominantly by grasses and was used as a cow pasture. The soil col- lected was clayey sand, dark brown, medium to fine grained, moist, and with organic material.
5. Happy Camp. The Happy Camp background area is located in Moorpark, approximately 12.5 miles northwest of the SSFL. The sampling area was a flat area located between two plateaus seemingly created by erosion off the Middle Ridge Fire Road, approximately 1 mile from the main gate. A stream bed (dry during sampling) ran through the center of the Happy Camp area and west of the sampling area. The northeast corner of the sampling grid was located 60 ft west of a large double-trunked oak tree. The area was sparsely covered by grasses and small shrubs. The soil collected was clayey sand, dark brown, medium to fine grained, moist, and with organic material.

6. Santa Monica Mountains National Recreation Area. The Santa Monica Moun- tains National Recreation Area background area is located in Agoura, approxi- mately 2 miles north of Highway 101, and approximately 4.5 miles southwest of the SSFL. The sampling area was 20 ft north of the Los Angeles~Ventura County line, and approximately 1.5 miles north of a Los Angeles County Class 111 Land- fill. The area was adjacent to and west of the dirt access road and east of a dry creek bed. The sampling grid was located on a flat area covered by grasses and forbs. A few trees were located outside the sampling area. The soil collected was silty sand, dark brown to black, fine to medium grained, poorly graded, plastic, moist, and with organic material and roots.
Agrid sampling approach was used. The sampling grids were 100 by 100 ft anddivided into 100
sampling blocks, each 10 by 10 ft. Three sampling blocks were selected at random, and sampling
locations specified within each to the nearest foot using randomly selected X- and Y-coordinates.
Asoil sample was defined as the total of six 6411. soil cores that were collected at each sampling
location. Five cores were collected from 0 to 6 in. in depth within 1 ft of the locations using an
impact-driven hand coring sampler. (The sixth soil sample was collected from a depth of 6 to 12 in.
below the ground surface for volatile organic compound analysis only.) The five samples were ana-
lyzed for chemical constituents and for radionuclides (Sr-90,I-129, isotopic plutonium, tritium, and
gamma-emitting isotopes). Each sample collected for radionuclide analysis was extruded into a
clean resealable plastic bag and mixed for 1 min. After mixing, the bag was sealed for transport to the
analytical laboratory.
Split samples were collected at selected locations for analysis by EPA, DHS, or the BBI consul-
tant for analysis at different laboratories. At the selected locations, additional cores were collected
from within the l-ft sampling radius and mixed for 1 min with the samples described above. After
mixing, the contents were divided among those responsible for the split analysis.
Background radioactivity has two sources: naturally occurring radionuclides such as radon and
uranium, and man-made sources such as fallout from atmospheric testing of nuclear weapons. The
interest in this study was man-made radionuclides that could have originated in Area IV. Cs-137,
Pu-238, Sr-90, and tritium were detected at the background locations in the concentrations given in
Table 4-20. Analyses for 1-129 and Pu-239 did not detect any of these isotopes.
4.2.4.2 Ravine Investigations
Ravines on the slope north and northwest of Area IVY through which rainfall runoff occurs, were
sampled to evaluate whether transport of radioactive or chemical materials had occurred along these
flowpaths. Four ravines were investigated: watersheds of the RMDF, Building 059, former Sodium

Table 4-20. Background Levels of Radionuclides in Soil
Measured Background
Arithmetic Range
~0.04-0.19 0.092 + Standard Deviation
5th to 95th Percentile
Disposal Facility, and the SRE. (A fifth ravine, carrying runoff from SSFLArea 11, was also included
in the study, but is not described here.)
Sediment samples were collected using a purposeful sampling approach. Sample locations were
selected from those areas considered most likely to contain chemicals or radionuclides, rather than
by using a random sampling approach. Locations within the ravines where sediment deposition was
observed were selected for sampling. Four to nine samples, locations approximately 50 to 60 ft apart,
were chosen in each ravine.
The determination of which areas were most likely to contain radionuclides was based on the
expected behavior of radionuclides in the environment, and is somewhat subjective, given variations
in geology and terrain. The cationic radionuclides of concern (Sr-90, Pu-238, Cs-137) generally
bind to soil particles and move in the runoff as suspended sediments. When the rate of water flow
slows, as would be expected at the bottom of a hill or the bend of a stream, the sediments settle out of
the water and are deposited at the bottom of the stream bed or at the inner margin of the bend. Conse-
quently, by sampling at low points in the ravines in areas with deposits of sediments, any residual
accumulation of radionuclides would most likely be detected.
Radionuclides bound to soil particles less tightly (tritium, 1-129) would be expected to move
along with the water with far less attenuation as they pass through the soil. The areas most likely to
contain radionuclides are emergent water and associated stream beds closest to the source, since
their potential for migration once released is great.
Samples for radiochemical analysis were collected using a hand trowel, because the depth of
sediments was too shallow, or the sediments were too saturated, to use a drive sampler.

The sampling locations and the results of analysis are shown on Figures 4-15 through 4-18. The
figures include chemical concentrations as well as the radionuclide concentrations of interest in this
plan. The locations are described below. The results are summarized in the next paragraph.
RMDF watershed (Figure 4-15). The RMDF watershed was sampled approxi- mately 200 ft north of the northwest corner of the RMDF, immediately below the Area IV boundary. Sediment samples were collected in the creek bed directly downstream from Well RD-30, located in Area IVY and cluster Wells RD-34A, RD-34B, and RD-34C, located on BBI property. The sediment was a yellowish sand, fine to very coarse grained with some gravel, well-graded, loose, and wet. The drainage area between RD-30 and the RD-34 wells was not vegetated and appeared to have been disturbed, possibly as a result of bringing heavy equip- ment to construct the RD-34 wells. The ravine downstream from the RD-34 wells was heavily vegetated with woody scrub, trees, and intermittent areas of poison ivy and poison oak. A path was made along the more nearly level south- ern side of the creek bed, with sample points at turns in the stream where sedi- ments had accumulated. The sample labelled OOlA in Figure 4-15 was collected in a small channel that entered the main stream channel about 70 ft west of the RD-34 wells.
2. Building 059 watershed (Figure 4-16). The initial sample location was approxi- mately 200 ft north of Building 059, immediately below the Area IV boundary. There were two arms of drainage in this area. The initial sample was located closest to Building 059, within 20 ft of a sample location in the earlier study in the BBI. Additional samples were not collected here because of heavy growth of poison oak. The second drainage arm originated northeast of Building 059, closer to Building 012. The area downstream of the confluence of the two drain- age arms could not be sampled because of thick vegetation (mostly poison oak) and a steep drop.
3. Former Sodium Disposal Facility watershed (Figure 4-17). The former Sodium Disposal Facility watershed was sampled approximately 200 to 400 ft north/ northeast of the facility. The sampled area was directly downstream of two run- off channels from the facility. The natural drainage slopes away from the facility toward the north (toward the BBI). Any runoff collects in one of the two chan- nels. The first runs from the center of the facility and crosses the Area IV bound- ary approximately 400 ft downgrade toward the northlnortheast. This channel was very narrow, with relatively steep rock outcroppings on either side. The ini- tial sampling location in this channel was approximately 150 ft beyond the Area IV boundary. The second channel collects runoff from the western area of the facility and crosses the boundary approximately 650 ft toward the northeast. It was less narrow than the first channel, but was heavily vegetated with woody scrub, trees, and poison oak. The initial sampling location in this channel was approximately 25 ft beyond the Area IV boundary. At the confluence of the two channels, the area was level and open. Below this point the ravine narrowed again. Sediment in the ravines was a dark yellowish brown sand, fine to medium grained, loose/poorly graded, and moist to wet.
4. SRE watershed (Figure 4-18). The SRE watershed was sampled immediately below the Area IV boundary, directly downstream of the SRE Pond retention dam (now open). The SRE is surrounded on three sides by rock outcroppings. Any surface runoff from the area drains to the northeast. The ravine was heavily vegetated with woody scrub and large areas of poison oak. A path was made

Legend
Sample Locations Brandels-Bardin 0 Surface Water Sample
-.- Drainage
001 McLarenMart RD30 (Water) Sample Location
Trichloroethene 38 ugR * Below Maximum Contaminant Limit
CIS-1.2-Dichlorcethene 13 ugR of 8 pCiR ** Below Maximum
Contaminant Limit of 20,000 pCiR
pCi/L picocurie per liter
ugR microgram per liter
mgkg milligram per kilogram
pCi/g(dry) picocurie per gram dry
\ \ \ \ \
Rocketdyne
Notes: Buildings shown on figure are used as reference points only, and are not intended to identify poten- tial sources. Only results for original McLarenI Hart samples are shown. Values are for soil/sediment sam- ples unless otherwise indicated.
Figure 4-15. RMDF Watershed Sample Locations
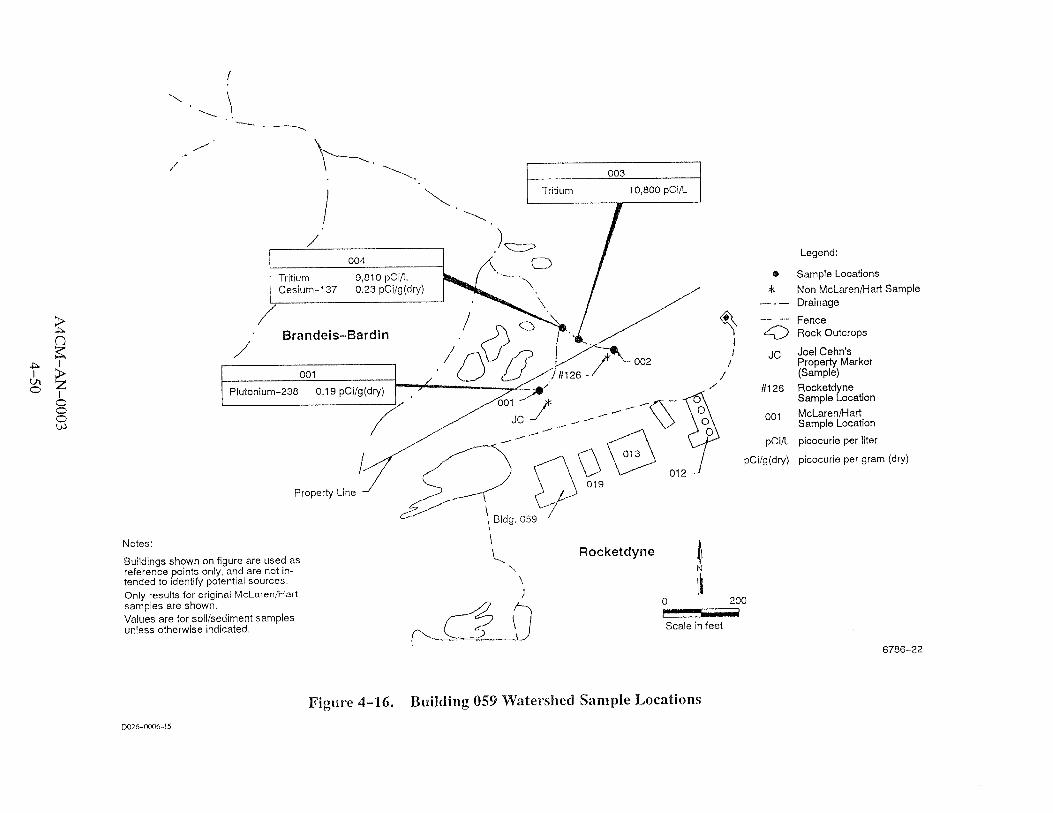
Notes:
Legend:
Buildings shown on figure are used as reference points only, and are not in- tended to identify potential sources. Only results for original McLarenNart samples are shown. Values are for soil/sediment samples unless otherwise indicated.
Sample Locations
Non McLarenMart Sample Drainage
Fence Rock Outcrops
Joel Cehn's Property Marker (Sample) Rocketd ne Sample location
McLarenNart Sample Location
picocurie per liter
picocurie per gram (dry)
\ L Rocketdyne
\ I N
\ I li
0 200 - Scale in feet
Figure 4-16. Building 059 Watershed Sample Locations

Notes: Buildings shown on figure are used as reference points only, and are not intended to identify potential sources. Only results for original McLarenNart samples are shown. Values are for soil/sediment samples unless otherwise indicated.
Brandeis-Bardin
/ \
1 > i
- J --I
/ /
U
Mercury 0.35 mgikg -p' FL
t Property Line-
0030 / \ --I'
/./ ---- Legend:
---- 0 Sample Locations .-I --, -- Drainage
,..------ / - - Fence
/
b' (;) ~ o c k Outcrops
I 001 McLarenflart
Sample Location
0 Surface Water 0 200 rngkg milligramkilograrn
j /" Scale in feet
/ Rocketdyne
I / ! ;
/ _( - -F/ Sodium Burn Pit
I--- J
Figure 4-17. Former Sodium Disposal Facility Watershed Sample Locations W26-0006-15

Notes:
Buildings shown on figure are used as reference points only, and are not intended to identify potential sources. Only results for original McLarenI Hart samples are shown. Values are for soillsediment samples unless otherwise indicated.
z 8
Brandeis-Bardin z i$ h, I
0 0
S
Cesium-? 37 0.24 pCi/g(dry) Strontium-90 0.09 pCi/g(dry) l
\ , ~ r : : ~ ~ ~ ~ water
Legend:
Sample Locations Drainage
Fence Rock Outcrops
McLarenHart Sample Location picocurie/gram(dry)
milligram per kilogram
0 200 r I
Scale in feet
Figure 4-18. SRE Watershed Sample Locations
along the less vegetated western side of the ravine until the property line was reached. A path was cut along the creek bed between the property line and the cliff dropping off toward the BBI. Sample locations relative to the Area IV boundary were only an approximation, since the actual boundary was not easy to ascertain from this area. Sediment from the ravine was a brown to dark brown silty sand, fine grained, poorly graded, and moist to wet.
The measured radioisotope concentrations that exceeded background levels are shown in Fig-
ures 4-1 5 through 4-1 8. Tritium was detected in sediment samples of the RMDF and Building 059
watersheds. Sr-90, Cs-137, and Pu-238 were detected; however, the statistical analysis of the data
showed that the concentrations of these radionuclides could not be distinguished from background.
4.3 REFERENCES
4-1. "Multi-Media Sampling Report for the Brandeis-Bardin Institute and the Santa Monica Mountains Conservancy," March 10, I 993 (Report prepared by McLaredHart Environmen- tal Engineering Corporation for Rockwell International Corporation, Rocketdyne Division).

This page intentionally left blank.
5. CKARACTERIZATION PLAN
5.1 FIELD ACTIVITIES
Ambient radiation data and soil and surface water samples will be collected by Rocketdyne per-
sonnel trained on detailed sampling procedures prepared in accordance with the Field Sampling Plan
([FSP] Section 6.3.3). Sampling equipment, including cleaning requirements and sample contain-
ers, will be defined in detail in the procedures. In areas where above-background radioactivity is
suspected, samples will be screened for radioactivity before packaging. Samples will be docu-
mented in a field logbook and controlled using a chain of custody form. Packaging requirements will
be defined for each type of sample.
5.1.1 Measurements and Sampling
This section describes field activities for characterization of screening areas in Area IV and for
determining the radiological condition of the rest of Area IV. The latter is provided by prior studies
and the Area IV survey, which is included to provide assurance that all areas with elevated radiation
have been identified and that soil radioactivity is at background levels.
Field activities will be integrated as much as possible to provide efficient location and coordina-
tion of sampling locations. Coordination of the sampling will be included in the FSP.
5.1.1.1 Area IV Survey
The Area IV survey will consist of measurements of ambient gamma radiation dose rates at each
intersection of the Area IV grid network, a radiation scan of the entire surface of Area IV not pre-
viously surveyed, sampling and analysis of soil at selected locations, and gamma radiation measure-
ments within the hole (in situ) for each soil sample. The elements of the survey are described in this
section.
The survey will provide data for comparison to background of gamma radiation dose rates and
radionuclide soil concentrations and detection of locations of hot spots.
1. Comparison to background. The ambient gamma radiation dose rate and in situ soil gamma radiation measurements will sample gamma radiation levels above ground and within the soil, respectively. Soil sample collection and analysis will provide radionuclide concentrations at randomly selected locations. Each of these three sets of data will be compared to background by means of statistical evaluation of the data.
2. Detection of hot spots. The radiation scan is the primary method for detection of hot spots. It complements the comparison-to-background measurements by providing more complete coverage of the surface, although the radiation survey

measurements will be analyzed for indications of hot spots as well as for com- parison to background.
Complete coverage of Area IV will be modified by certain characteristics of the site or status of areas. These will be factored into the detailed planning during preparation of the FSP for each cell. The characteristics are the following:
Major rocks. Area IV contains many large rock outcroppings, which are neither potential sources of contamination nor amenable to manned access. These may be excluded from the measurement locations. If inclusion of a rock is conve- nient, however, it may be included in the systematic radiation surveys.
Buildings. The interior of buildings and other structures (tanks, open-sided test stands, etc.) are not considered part of the site needing characterization. The ar- eas surrounding buildings and structures (including areas inside fences if they are not part of the facility for D&D) are included in the survey.
Dense vegetation. There are areas of dense natural vegetation in Area IV. Access for the systematic survey would require extensive clearance of undergrowth and disruption of the native wildlife. Measurements and sampling in these areas will be at selected representative locations to minimize vegetation clearance.
Radiological screening areas. These areas will have their own measurement and sampling requirements, which may supersede survey activities in the areas involved.
Areas characterized by other studies. These include prior studies (Area IV radio- logical survey [Section 4.1.11 and completed D&D closeout surveys [Sec- tion 4.1.41) and related activities (planned D&D closeout surveys [Section 4.2.11 and remedial action [Section 4.2.21). The approximate extent of the areas excluded because of this status are shown in Figure 5-1. The detailed extent will be determined by review during field activity planning of the report of previous studies.
Endangered or protected plant species (Section 2.3.1). Sampling and measure- ment locations will be modified in the field as necessary to protect endangered or protected plant species.
5.1.1.1.1 Grid Network
The grid for field definition of measurement locations will be established by land surveys as described in Section 5.1.2.1. Survey cells, or survey blocks, will be laid out as parts of the grid and investigated in sequence in order'to perform the survey in manageable units. Each cell will be nomi- nally 200 by 200 ft, with its location defined relative to the California Plane Coordinate System. Fig- ure 5-2 gives an example of the division of Area IV into adjacent cells.
Grid locations will be established at the spacings specified for radiation measurements (Sec-
tion 5.1 .l. 1.3). The locations may be changed if necessary to accommodate obstructions

Figure 5-1. Areas Characterized by Other Studies

Figure 5-2. Example of Division of Area IV into Survey Cells

(e.g., rocks), but the actual measurement location and reason for change will be recorded in the field
log book.
The 290 acres of Area IV would have about 315 cells if the shape of the site allowed filling the
area with whole cells. In practice there will be fewer whole cells and a larger total number of whole
and partial cells.
5.1.1.1.2 Analysis Regions
Area IV has been divided into six areas, termed analysis regions, within which natural back-
ground radioactivity is expected to be the same (except for statistical fluctuations). Background
radioactivity is the result of naturally occurring radionuclides, whose concentrations are determined
by local geology and history of use. Regions differing in these characteristics may have different
radionuclide distributions and, thus, different backgrounds.
Radiation measurement and survey soil sampling data for each analysis region will be analyzed
separately to minimize the effects of background variation. This data analysis is described in Sec-
tion 5.5. Soil survey sampling locations (Section 5.1.1.1.5) will be selected to provide a separate
sample set within each analysis region.
The characteristics and general locations of the six analysis regions are described below. The
actual boundaries will be specified in the FSP. In general, the regions consist of non-contiguous
areas having similar characteristics.
1, Developed areas. These areas are dominated by buildings and structures and include the associated paved areas. There is a shallow cover of alluvium inter- mixed with imported construction dirt overlaying the Chatsworth formation bedrock. The region is the areas with buildings shown in Figure 2-2.
2. Rock outcroppings. The areas composing this region are dominated by outcrop- pings of the Chatsworth formation sandstone that underlies most of Area IV. It includes occasional oak woodland patches in seasonal drainage courses of shallow soil within areas of rock outcroppings. Part. of this region are dis- tributed throughout Area IVY except for the hill in the southern section.
3. Wet drainage areas. This region consists of natural flats and catch basins in the natural drainage channels where run-off soil can settle. Thick riparian vegeta- tion grows in wet soil pockets in these areas. The natural channels and flats of this region are mostly in the eastern part of Area IV. There are a few developed channels in the western section, but the developed section is generally too close to the Area IV boundary for channels to be consolidated in that direction. There are no developed channels on the hill in the southern section of Area W.
4. Undisturbed alluvial flats. This region has several feet of undisturbed topsoil above the Chatsworth formation bedrock. There are some remnant stands of native grassland. Fallout isotopes are at or near the surface. The parts of this

region are located mostly in the undeveloped eastern section of Area IV and near the southern boundary.
5. Disturbed alluvial flats. This region has several feet of topsoil that has been turned by plow or earthmover. It is generally covered by invasive annual grasses. Fallout isotopes are mixed below the surface. The region consists of a band of Area IV extending between the eastern and western boundaries and south of the developed area.
6. Martinez---Chaparral area. This region is exposed Martinez formation soil dom- inated by thickly wooded chaparral. It consists of the undeveloped hill south of the disturbed alluvium.
5.1.1.1.3 Radiation Survey Measurements
The gamma radiation dose rate will be measured at each grid intersection within each cell as
described in Section 5.1.2.2. Measured dose rates will be reviewed to detect areas where the pres-
ence of contamination is indicated. The dose rates will be compared with background dose rates as
determined by measurements in off-site locations (Section 5.1.1.1.7) and with other measurements
made in the same analysis region. (Data evaluation will be as described in Section 5.5.) If a measure-
ment location with an elevated radioactivity level is found, its location will be recorded. A soil sam-
ple will be taken at each such area using the method described in Section 5.1.2.5. The samples will be
analyzed to define their radioactivity content using the same methods as for other survey soil sample
analysis (Section 5.1.1.1.5).
5.1.1.1.4 Radiation Scans
A radiation scan will be performed systematically over the surface of each cell (noting the types
of exclusions listed in Section 5.1.1.1) to detect localized contamination ("hot spots"). The scan will
be conducted using the method described in Section 5.1.2.3. Locations of contaminated areas will be
recorded in the field records. A radiation survey measurement and possible follow-up soil sample
(Section 5.1.1.1.3) will be made at the location of the peak gamma activity of each elevated activity
area found during a radiation scan.
5.1.1.1.5 Survey Soil Sampling
Area IV survey soil samples will be collected at specified locations in each analysis region. Aset
of 11 samples will be collected in each region for analysis and comparison to background. The num-
ber of samples per set is specified to be large enough to allow evaluation of the approximation of the
underlying distribution of the data to a Gaussian distribution, while minimizing the number of sam-
ples to use resources most efficiently. The data analysis (Section 5.5) depends on the assumption that
the population distribution underlying the data is a Gaussian distribution. An investigation in sup-
port of the prior Area IV Radiological Survey (Section 4.1.1) used randomly generated artificial data

to determine the effect of sample size. It was found that Gaussian distribution sample sets with more
than 10 samples will consistently show good fits to the derived Gaussian distribution. The contrary
situation is true also; significant deviations from a Gaussian distribution will not be masked by ran-
dom variations if a data set consists of at least 11 samples.
Samples of undisturbed soil will be collected at the surface using the method described in Sec-
tion 5.1.2.5. Samples at a location of disturbed surface soil will be collected at a depth determined to
provide undisturbed soil at that location, using the method described in Section 5.1.2.6.
Sampling locations will be chosen at random. Areas occupied by rocks, buildings and other
structures, paved roads, and concrete pads will be excluded in the selection of soil sampling locations
unless they were potentially an area of contamination prior to being covered. This soil sampling is
independent of soil sampling prompted by high radiation levels in the radiation survey measure-
ments and the radiation scan.
Soil samples will be analyzed for Sr-90, tritium, gamma-emitting isotopes, and isotopes of ura-
nium, plutonium, and thorium, Analysis methods are described in Section 5.2.
5.1.1.1.6 In Situ Soil Radiation Measurements
Local integrated gamma radiation levels within the soil will be measured at all survey soil sam-
pling locations using the method described in Section 5.1.2.4.
5.1.1.1.7 Background
Area IV survey results will be compared with characteristics at the off-site background loca-
tions used for the multimedia sampling at BBI (Section 4.2.4). The background part of that study
(initial and follow-up portions) included collection of soil samples in each of eight areas. Sample
analysis measured the concentrations of gamma-emitting isotopes, Sr-90, tritium, and isotopes of
plutonium (Pu-238 and Pu-239). These results will be used for comparison with analysis results for
survey soil samples. To obtain background concentrations for isotopes of thorium and uranium,
another sample will be collected at the location of each of the multimedia sampling background soil
samples, and analyzed for these isotopes.
Ambient gamma radiation surveys will be made in each of the multimedia sampling back-
ground locations, since they were not included in the earlier study. The survey will be performed
using the method described in Section 5.1.2.2. A 100-f3 by 100-ft cell at each of the background
locations and a 25-ft grid spacing will provide 25 measurements per location.

5.1.1.2 Screening Areas
This section describes the screening by soil and water sampling of areas where on the basis of
the history of Area IV operations, no radioactive materials are expected to be found, but where they
could be present. Soil sampling locations will be specified using the grid system provided for the
radiation measurement surveys.
There are seven screening areas (Table 2-2). Sampling locations at the former earth pit location
in the area surrounding the former Sodium Disposal Facility will be chosen at random. All other
sampling location selection will use a purposeful sampling approach rather than the random
approach. The intent will be to detect evidence of above-background radioactivity. Water and sedi-
ment samples will be collected for the SRE Pond. All other samples will be soil. Sampling of the
areas surrounding the former Sodium Disposal Facility will provide systematic coverage of the
areas. Sampling of drainage channels will be at specified intervals along the channels. Sampling of
the inactive sanitary leachfields will be at specified locations in the region most likely to be contami-
nated. Sampling at buildings will be at selected locations on the ba..is of contamination potential
from past operations. Sampling at the SRE drains will be of materials in the buried piping between
the surface-accessible locations sampled previously. The drop area of the depleted uranium slug will
be investigated by geophysical survey only. Sampling of the SRE Pond will be at representative loca-
tions selected in the field on the basis of pond extent.
Samples will be analyzed for radioactivity: Sr-90, tritium, gamma-emitting isotopes, and iso-
topes of uranium, plutonium, and thorium. Analysis methods are described in Section 5.2.
5.1.1.2.1 SRE Drains
Samples of deposits in the straight sections of the SRE sanitary and storm drains will be sampled
between the accessible points previously sampled (Section 4.1.4). Samples will be analyzed for
gamma-emitting isotopes, Sr-90, tritium, and isotopes of thorium, uranium, and plutonium. Soil
beneath the drain pipes will be sampled if there is evidence of pipe leakage. The drain sampling will
determine whether the previous sampling was an accurate characterization of piping radiological
status.
5.1.1.2.2 Inactive Sanitary Leachfields
The inactive sanitary leachfields which served facilities containing radioactive materials (Sec-
tion 2.4.2) will be investigated by collection and analysis of soil samples. Soil from each of these
leachfields will be sampled to determine concentrations of radioactive materials near the

distribution box, where concentrations are expected to be highest. Typical sampling locations, for
the Building 009 leachfield, are shown in Figure 5-3.
Soil samples will be collected using the method described in Section 5.1.2.6 at a depth just be-
low the depth of the distribution system. This sampling will provide for detection of contaminants at
the point of injection into the soil and as possibly transported by downward flow of effluent and sur-
face groundwater.
5.1.1.2.3 Areas Surrounding the Former Sodium Disposal Facility
The areas surrounding the former Sodium Disposal Facility will be investigated by a geophysi- cal survey and by analysis of soil samples. The geophysical survey will be conducted using the meth- od described in Section 5.1.2.9 to detect subterranean components which may remain from past use of the areas for storage. (Although these areas were not generally used for storage, some components are known to have been placed in neighboring ravines, which were later cleaned.) The areas to be surveyed will be those identified in Figure 5-4 for soil sampling.
Soil samples will be collected across the access road south of the former Sodium Disposal Facil- ity, and in the ravines east andkest of the facility. Sampling locations are shown in Figure 5-4. There have generally been no prior activities in these areas (except possibly at a location across the road from the former Sodium Disposal Facility), but proximity to the former Sodium Disposal Facility, convenient access, and remote location make them suspect locations.
1. Six samples will be collected in the area of the former earth pit at randomly selected locations.
2. Samples will be collected along the access road, both just south of the road and, on the open slope, 50 ft south of those locations.
3. Samples will be collected for approximately 100 ft north of the access road in the ravines and small open areas among the north-south-tending rock outcroppings to the west of the former Sodium Disposal Facility, and in ravines among the similar rock outcroppings to the east of the facility.
Soil will be collected at the surface using the method described in Section 5.1.2.5, at each loca-
tion having undisturbed surface soil. Where the surface has been disturbed, samples will be collected
at a depth of 3 ft using the method of Section 5.1.2.6. The locations within the area of the former
earth pit (identified in Figure 5-4) will also be sampled at the depth of pit debris or a maximum depth
of 6 ft. Soil will be removed for field measurements of gamma radiation at 1-ft increments for depths
up to the 6-ft limit. Samples for laboratory analysis will be collected at the maximum depth using the
method described in Section 5.1.2.6.

Contaminated Waste Hoiduo Tank and Pit
.: .... .. , ..
\ . . . . . . . . . . . Rock :;.:: ,,,; :.. :. . . . . . . . :..,: ..
.' 1:. \ ..".' ( .. ....
.. : , ..
.I:.. ( .... 'i. ..
/ Drainage Ditch
Figure 5-3. Sampling Locations - Inactive Sanitary Leachfield (Bldg 009)

DOIG(XX&I5 Figure 5-4. Sampling Locations - Areas Surrounding the Former Sodium Disposal Facility

5.1.1.2.4 Drainage Channels
Area IV surface water drainage is described in Section 3.2. The drainage channels considered
here are those carrying flow to the southeast (to the R-2 Ponds) and the north (across the SSFL
boundary). Drainage channels leading across the SSFL boundary to the northwest are being investi-
gated as part of the study of other areas (e.g., RMDF, Bldg 056 Landfill, and areas surrounding the
former Sodium Disposal Facility).
Soil samples will be collected along each drainage path at intervals of approximately 50 ft. Sam-
pling will begin at the edge of the developed area and continue until about five locations have been
sampled or the Area IV boundary is reached. Sampling locations will be chosen by walking the chan-
nels to identify locations likely to accumulate sediment and debris.
Soil samples will be collected at the surface of each location using the method described in Sec-
tion 5.1.2.5. In addition, selected locations in the 17th Street channel will be investigated to a depth
of 3 ft, as listed in item 4.
Soil sampling locations are shown in Figures 5-5 through 5-9. Considerations applicable to
each of the drainage channels are given in the following steps:
1. SRE Pond. Soil sampling locations for the SRE Pond drainage channel are given in Figure 5-5.
Old Conservation Yard (north). Sampling locations for runoff channels north to the SSFL boundary in the vicinity of the Old Conservation Yard are shown in Figure 5-6. Note that the map used in the figure predates the Oil Tank Farm. The detailed sampling plan will be based on an updated SSFL map. This area is at the beginning of flowpaths down the slope from SSFL. They have not yet consoli- dated into well-defined channels. Samples will be collected from representative locations to detect contamination if transported in this direction from the Old Conservation Yard.
3. Old Conservation Yard (south). Sampling locations for drainage channels south of the Old Conservation Yard are given in Figure 5-7. Two channels join near the Area IV/Area I11 boundary and flow to the Silvernale Pond. After leaving Area IV, the combined channel returns from Area I11 for a short distance. The return section will not be sampled unless extension of sampling is necessary to pursue the extent of any contamination found in the initial sampling. The west- ern drainage channel will be sampled starting at both G Street (near the outlet of the SRE sump pump discharge pipe) and the end of the asphalt covering of the channel.
4. 17th Street. Soil will be sampled along the natural channel east of G Street at the locations shown in Figure 5-8. In addition to sampling at the beginning of the natural channel, an area further downstream in the field will be sampled. There was apparently a holdup area in the drainage channel, as indicated on the 1966 map used for Figure 5-8. Samples will be collected there to detect any buildup
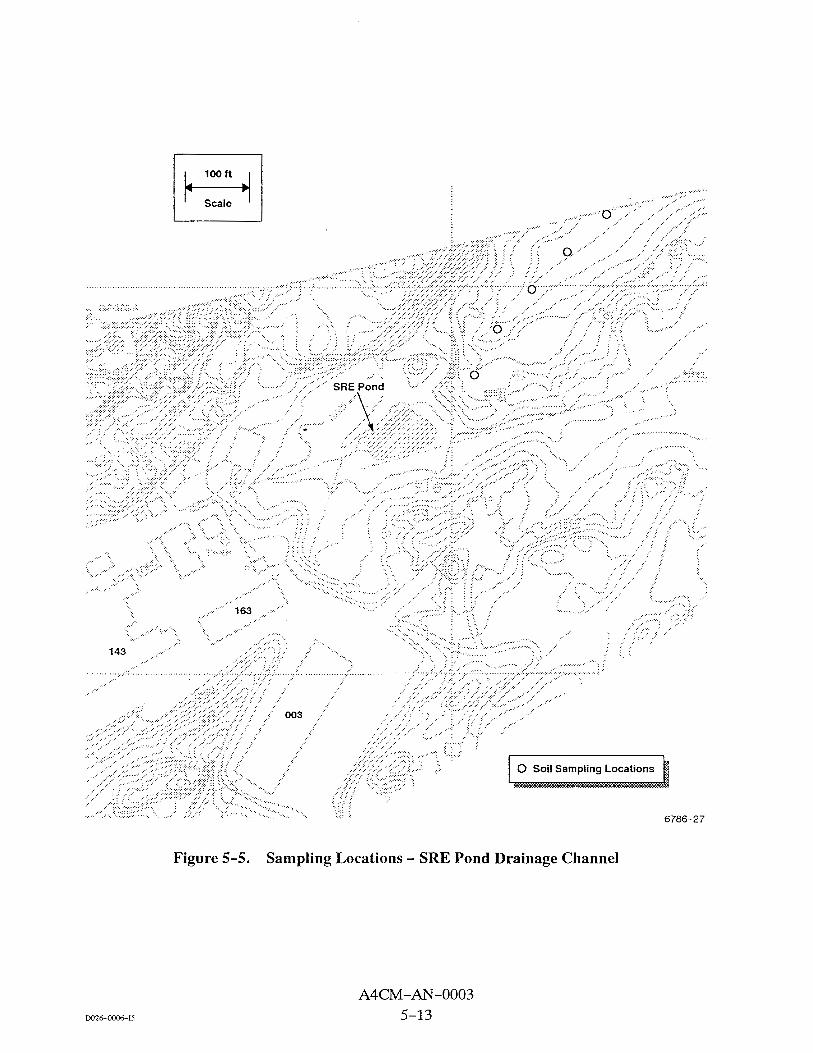
Figure 5-5. Sampling Locations - SRE Pond Drainage Channel

Figure 5-6. Sampling Locations - Old Conservation Yard Drainage (North)

Figure 5-7. Sampling Locations - Old Conservation Yard Drainage Channels (South)

Figure 5-8. Sampling Locations - 17th Street Drainage Channel

~026-m6-15 Figure 5-9. Sampling Locations - Southeast Drainage Channels

of contaminants that could have occurred as a result of occasional standing water. Additional samples will be collected downstream of the indicated holdup area.
In addition to the surface samples at all locations, soil will be investigated to a depth of 3 ft at three locations in areas of temporary standing water, as shown in Figure 3-13. Soil will be removed for field measurements of gamma radioactiv- ity at 1-ft increments to the 3 ft depth. Samples will be collected at that depth using the method described in Section 5.1.2.6 for laboratory analysis.
5. Southeast drainage channels. Sampling locations for drainage channels in the southeast region of Area IV are shown in Figure 5-9. These channels include the natural channels beginning at 20th and G Streets, and at the outlet of the asphalt- coated drainage ditch along the south side of G Street. They also include the un- lined drainage ditches on the north and south sides of J and L Streets. The chan- nels continue beyond the Area N boundary and combine in Area 111 to carry flow to the R-2 Ponds.
5.1.1.2.5 Areas Surrounding Buildings
The areas surrounding buildings in which radioactive materials were used will be reviewed to
identify locations at which contamination is suspected. Soil samples will be collected from locations
identified. The buildings are listed in Table 2-2 and are described in Section 2.4.5. Specific loca-
tions will be defined in the detailed sampling plan on the basis of building design and past activities.
Locations will be selected to detect contamination from these activities. The following criteria will
be used in selecting the locations.
1. Locations likely to have been used for activities needing open-air ventilation
2. Locations at which spills have occurred, unless an adequate prior sampling is documented
3. Coverage of suspect locations by completed or planned D&D activities.
Soil samples will be collected at the surface at each selected location using the method of Sec-
tion 5.1.2.5.
5.1.1.2.6 Drop Area of Depleted Uranium Slugs
The Area IV characterization plan includes another attempt to locate the missing depleted ura- nium slug (Section 2.4.6). The investigation will consist of a geophysical survey of the drop zone shown in Figure 2-16, the area bordering it, and a band along the helicopter path during the drop test. A metal detector examination of at least the drop area has been done without success. The geophysi- cal survey planned for selected areas as part of the characterization will be more sensitive and thus will have a better chance for detection of the slug.

The slug is a source of radioactivity, but the chance of detection is too small to warrant a search by means of radioactivity detection. Any search would be by gamma radiation detection. The gam- ma source is low level and at a low energy, for which attenuation by soil is relatively high. This ap- pears to be the reason for the lack of success in earlier investigations despite using the most sensitive instruments available. The probability of detection would not be any better during the characterization.
5.1.1.2.7 SRE Pond
Investigation of the SRE Pond will consist of water and sediment sampling. Samples will be collected using the method described in Section 5.1.2.7 at two locations chosen to be representative of the pond. 'ItYo samples will be sufficient for adequate representation because of the pond's small volume. Water and sediment samples will not necessarily be collected at the same locations. Water samples will be near-surface water collected as grab samples using the method described in Section 5.1.2.7. Sediment samples will be collected using the method described in Section 5.1.2.8. A reten- tion pond was maintained during operation of the SRE to collect runoff from the facility upstream of the Area IV boundary. The pond was created by a dam across the drainage channel. Water level was controlled by pumping excess water through a pipe to a drainage channel leading to the Silvernale Pond, which is part of the SSFL water control system. After decontamination and release for unre- stricted use of the SRE area, the gate of the dam was opened to release the impounded water. The pond was much reduced in size, but still exists as the only year-round body of standing surface water in Area IV. (The Building 056 Pit contains water year-round, but the water is groundwater which is visible because of the depth of the pit.)
5.1.1.3 Quality Assurance
Field activities will include quality assurance measurements and sampling to support data val- idation (Section 5.1.3).
5.1.1.3.1 Quality Assurance Measurements
The radiation level measurements described in Section 5.1.1.1 will be supported by calibration and functional surveillance activities to allow assessment of data validity. These tests will be used to provide data for field verification of proper instrument operation before proceeding with measure- ments, and for detection of long-term shifts or drift in instrument performance.
1. Calibration. All radiation detection instruments will be maintained on the quar- terly calibration cycle by the RP&HPS Instrument Laboratory. The NaI gamma survey meters will be calibrated against a Cs-137 standard source, and verified against both Am-241 and Ra-226 standard sources.
2. Functional performance checks. The performance of the gamma radiation detection systems will be verified at the beginning of each shift, at mid-shift, at the end of each work shift, and at other times as indicated (following interrup- tions of work, apparent performance changes, etc.). All performance checks will be performed at the same location with the detectors in the same positions. The

counts during a fixed time interval will be recorded both with a Cs-137 calibra- tion source in a repeated position (e.g., at the base of the ambient gamma radi- ation survey fixture) and with the source removed (i.e., only the background gamma radiation present).
5.1.1.3.2 Quality Assurance Sampling
The soil and water sampling described in Sections 5.1.1.1 and 5.1.1.2 will be supported by
collection of quality assurance samples for analysis as described in Section 5.2. Quality assurance
sample data will be compared to data from survey and screening area sampling as part of the data
validation process. The following quality assurance samples (defined in Ref. 5-1) will be collected.
1. Field replicate sample. A field replicate (or duplicate) sample is an independent sample collected as close as possible to the same point in space and time as the field sample being duplicated. The field sample and field duplicate are separate samples taken from the same source, stored in separate containers, and analyzed independently, to document the precision of the sampling process. The field acti- vities of this plan include collection of one field duplicate for each set of up to 20 soil or water field samples.
2. Blind duplicate sample. A blind duplicate (or sp1it)sample is an aliquot of asam- ple taken from the same container and analyzed independently. Comparison of the analysis results for the two split samples provides a measure of the accuracy
. of the analysis process. The field activities of this plan include collection of one blind duplicate sample for each set of up to 20 soil or water field samples. The field sample (or composited sample, if necessary to obtain sufficiently large samples) will be mixed and then split into separate samples.
3. Equipment rinsate sample. An equipment rinsate sample is a sample of the sam- ple of the water that has been used to rinse the sampling equipment after decon- tamination following sampling. A sample of the rinse water will be collected after each set of up to 20 decontaminations of equipment for sampling soil or water. -
4. Field blank sample. A field blank is a sample of deionized water collected at the sampling site and handled and analyzed like the other samples. It is used to docu- ment contamination attributable to field sample collection, handling, and analy- sis procedures. A field blank will be used for the set of water samples, but not for soil samples.
5.1.2 Methodology
This section describes the methodologies specified for use in this plan. Use of the methodolo-
gies is included in the specification of activities for initial evaluation of potential areas of contamina-
tion, and for preliminary and detailed characterization of known source areas.

5.1.2.1 Field Locations
Field locations for measurements and sampling will be defined as points on the California Plane
Coordinate System. This will be accomplished with the following steps:
1. Surveyor's monuments of known coordinates in the California Plane Coordi- nate System are installed at several locations in Area IV.
2. Secondary semipermanent markers will be installed throughout Area IV at 20043 intervals to define 2 0 0 4 by 2 0 0 4 cells within which field activities will be performed. (Deviations from the 20043 intervals will be necessitated in cases where obstructions interfere.) The markers will be installed and their locations defined using the surveyor's monuments by a licensed professional surveyor.
3. Grids will be laid out within a cell using field survey measuring tapes (200 ft length).
The method is that used for surveys in the former Sodium Disposal Facility clean-up program. It
provides permanent traceability to the California Plane Coordinate System with a minimum preci-
sion of the location of each sampling location of f 1 ft. (An alternate method of defining locations
within a cell may be use of equipment that uses the Global Positioning System.)
5.1.2.2 Ambient Gamma Radiation Survey Measurements
The ambient gamma radiation survey consists of systematic measurements of gamma radiation
dose rates within the area surveyed. Measurements to sample the gamma dose rates will be made at
the intersections of a grid with a spacing of 25 ft. The grid will cover all of Area IV except areas
excluded as described in Section 5.1.1.1.
The radiation survey will be made with pairs of NaI gamma radiation detectors. Each detector
will be connected to a scaler/ratemeter. They will be mounted on a fixture to provide consistent
positioning 1 m above the soil surface at each survey location. Survey measurements at each grid
location will consist of timed counts on the scaler for each detector.
Use of paired, duplicate instruments will provide a continuous check on instrument reliability to
detect instrument instability, drift, intermittent excessive noise, or other failures. The availability of
paired data will also provide an improvement in measurement precision by a factor of 1.4. Data
quality will also be ensured by monitoring for any changes in instrument accuracy during the test
using periodic checks of instrument performance using a field check source, and by routine estimates
of detector efficiencies based on their responses.
If a measured gamma dose rate is more than 5 pR/h above background, a soil sample will be
collected for analysis (Section 5.1.2.5).

5.1.2.3 Radiation Scans
Radiation scans will be made to detect localized hot spots (point sources) that might escape de-
tection in the ambient gamma radiation survey. Gamma radiation detectors will be swept over the
surface of the grid in a systematic manner. For the scans, a gamma detector similar to those used in
the radiation survey will be mounted in a fixture so that it can be swung from side to side just above
ground level (or weed level in overgrown areas). The person performing the scan will walk along a
prescribed path at a slow-to-moderate pace while swinging the detectors. Paths will be parallel, with
a spacing specified to provide complete coverage of the surface. While walking, the person perform-
ing the scan will monitor the countrates of the detectors.
If an increase in the radiation activity level is detected, the walking scan will be interrupted to
scan more closely in the suspect area to locate the peak of the activity. The location of the peak activ-
ity will be recorded and marked (e.g., by insertion of a flag into the soil) and the walking scan re-
sumed. A radiation survey measurement (Section 5.1.2.2) will be performed at the location of the
peak activity. Further investigation of the location will follow the guidelines for radiation survey
measurements.
The sensitivity of the radiation scans to a localized hot spot will be dependent on the walking
rate and the detector sweep rate. These parameters will be specified as part of detailed planning. Val-
ues specified previously for a similar scan (walking rate of 2 112 mi/h and detector sweep rate of
4 s/cycle) are typical and would provide a maximum detector distance of about 3 ft from any point.
The increase in sensitivity gained by decreasing this distance from that of the survey will be reduced
somewhat by a decrease in precision of position and counting statistics.
5.1.2.4 In Situ Soil Radiation Measurements
This methodology is for a measurement of the local integrated gamma radiation dose rates in the
soil. At locations of soil samples, soil will be removed to a depth of at least 1 ft. A NaI gamma radi-
ation detector will be inserted into the hole and a timed count taken. The count will be recorded to
document thesoil local dose rate and to determine, by comparison to background levels, the need for
further sampling.
5.1.2.5 Surface Soil Samples
Surface soil samples are defined as samples collected from the first 6 in. of soil. This type of soil
sample will be gathered using a stainless steel or teflon sampler. Care will be used to take the sample
to a full 6 in. depth and to cut the sides of the hole vertically to ensure that equal volumes of soil are

taken over the full 6 in. depth. A 1-kg sample will be collected and placed in acontainer for shipment
to an analysis laboratory.
5.1.2.6 Subsurface Soil Samples
Subsurface soil samples are those collected below the first 6 in. of soil. Such samples are speci-
fied to depths of 5 to 6 ft. To obtain these samples, the material overlying the elevation to be sampled
will be removed (e.g., using a power auger) and the sample will be taken as described in
Section 5.1.2.5 for surface soil samples. Field measurements of gamma radiation levels will be made
at 1-ft increments as the soil is removed (Section 5.1.2.10).
5.1.2.7 Water Sampling
Surface water will be collected as grab samples. The sampling container will be submerged in
the water, removed, and capped. If the water depth is too shallow for collection directly in the sam-
pling container, or prior addition of a preservative has made submersion of the container impractical,
a secondary container (beaker, flask, or other transfer device) will be used to transfer water to the
sampling container.
Water samples except those for tritium analysis will be collected in 1-liter plastic containers
containing IN HNOs to bring the sample pH to less than 2. Samples for tritium analysis will be col-
lected in a 1-liter amber glass container containing no preservative.
Collection of the water sample will be done in a manner to avoid inclusion of non-typical sur-
face debris or surface film. Collection containers will be handled to avoid stirring up sediment, to
avoid contaminating the sample with bottom solids.
Standing water samples will be collected in only the SRE Pond. Representative samples will be
collected to the extent possible.
5.1.2.8 Sediment Sampling
Sediment samples will be collected by scooping material directly from the bottom of the stand-
ing water. A porous collection device will be used to allow most water to drain from the sample be-
fore placing it in the sample container.
5.1.2.9 Geophysical Surveys
Surveys using a magnetometer, conductivity detectors, or ground-penetrating radar will be
conducted where there is a need to determine whether there are subterranean materials. Measure-
ments will be made along parallel traverse lines or at specified locations on a grid covering the area of
interest. Details of the coverage will be determined in consultation with a contractor chosen to per-
form the survey. Near-surface debris will be removed if necessary to probe to the possible depth of
materials. Geophysical surveys will be done to detect subterranean materials in areas surrounding
the former Sodium Disposal Facility (Section 5.1.1.2.3) and to determine the location of the missing
depleted uranium slug (Section 5.1.1.2.6).
5.1.2.10 Field Measurements of Soil
Soil will be sampled at many locations at depths up to several feet. At those locations specified in the evaluation and planning sections, field measurements of gamma radiation levels of removed soil will be made at l-ft increments as soil removal proceeds. The sample will be scanned using a NaI gamma radi- ation detector.
5.2 SAMPLE ANALYSIS
Samples collected as a part of this characterization plan will be analyzed by applicable EPA
methods for radionuclides or equivalent procedures. The EPA methods are written specifically for
aqueous mediums and will be supplemented as required to anaiyze soils. All chemical analyses will
be performed by a chemistry laboratory qualified to perform the applicable methods.
The primary radiological analysis to be performed is gamma spectroscopy, which is conducted
for water samples using EPA Method 901.1 and for soil samples in much the same way. The soil
samples are first dried at 80 to 105 OC in an oven, then placed in a Marinelli beaker and counted, using
a lithium-drifted germanium detector. Detectable radionuclides include naturally occurring K-40,
Pb-212, and Pb-214, as well as fission-produced Cs-137. Some indication of the presence of tho-
rium (Th) and uranium (U) is also probable; natural Th and U, both in secular equilibrium with
daughter nuclides, are found in most SSFL surface soils. All radiological analyses will be performed
by an off-site contractor and will meet the requirements of DQO Level I11 (Section 3.1).
Samples will also be analyzed for Sr-90 (EPAMethod 905.0) and isotopes of thorium, uranium,
and plutonium (EPA Method 907.0). The EPA methods are for water samples and again are similar
for soil samples, except that the radionuclides must first be extracted from the soil. HASL-300,
"DOE Environmental Measurements Laboratory Procedures Manual," provides other relevant pro-
cedural guidance.

5.3 DATA VALIDATION
The data obtained from field activities and laboratory analyses will be reviewed in a validation
process. The process will provide systematic inspection of the data for procedural and instrument
errors and confirmation of expected findings, The resulting validated data will be entered into the
Area IV characterization database (Section 5.4) for use in data evaluation (Section 5.5).
Two types of data will be generated by the characterization activities: sets of radioactivity mea-
surements and sets of radionuclide concentrations. The validation of these data is described in Sec-
tions 5.3.1 and 5.3.2. This is followed by a description of the documentation of the data validation
process and associated information.
5.3.1 Radiation Measurements Validation
Radiation measurements will result in sets of radiation level data for defined areas. These will be
reviewed after completion of measurements in an area to verify the validity of the data, although the
data will also be. reviewed as it is being collected, as part of the field activities. The validation proce-
dure will include the following:
1. Collection and review of data sheets for completeness, clarity, and field notes
2. Verification that instrument calibration was current
3. Analysis of instrument performance check and ambient background response check data, including statistical analysis of distribution of both the data collected during the measurements being validated and the data collected to date, to ensure that no performance shifts or drift occurred.
4. Examination of the data to confirm that the findings are within the expected range.
5.3.2 Laboratory Analysis Data Validation
Sample collection and analysis will generate sets of radionuclide concentrations for samples
collected in a defined area. Formal validation of these data will be for each batch of samples sent to
the laboratory, although documentation will be collected by cell (or group of partial cells). The val-
idation procedure will include the following:
1. Collection and review of field data sheets for completeness, clarity, and field notes
2. Review of laboratory analysis report for completeness, clarity, and conformance to the laboratory request
3. Review of chain-of-custody form for continuity
4. Verification that the reported radionuclide concentrations are consistent with method uncertainties and sensitivity limits
5. Evaluation of results for field duplicate and blind duplicate quality assurance samples
6. Comparison of the data to the expected results.
5.3.3 Validation Documentation
The following documentation supporting data validation will be maintained on file.
1. Completed validation checklist
2. List of validated data
3. Field datasheets
4. Chain-of-custody forms
5. Detailed field procedure reference or redline copy, if applicable
6. Validation worksheets for performance validation or quality assurance sample evaluation.
5.4 DATA MANAGEMENT
Data management for the Area IV characterization program will control both a document and
correspondence file and a database of validated radiation measurements and sample radionuclide
concentrations. The data management process will be defined in a data management plan.
Documentation within the scope of the data management plan will include plans, procedures,
validation reports, data evaluation reports, and progress reports. All technical correspondence
related to the program data will be included.
The database will provide a systematic approach to managing the large quantity of data that will
be generated. It will be the means for recording, storing, and retrieving the data for performing data
analysis and generating reports. Access to the database to make changes will be limited to authorized
data entry operators to maintain the integrity of the data. Access for reviewing or sorting data, or
exporting it to other software formats for analysis will be available to all data analysts.
5.5 DATA EVALUATION
5.5.1 AnaIyticaI Evaluation
Validated data will be evaluated by methods selected as appropriate for each data set. This sec-
tion describes the data sets and the methods that will be used.
5.5.1.1 Data Sets
The data to be obtained in the characterization program can be categorized by type of informa-
tion, size of data set, and scope of sample set. These categories are described below:
Type of information. There will be data sets for concentrations of isotopes in soil or in water and for radiation measurements, both at 1 m above the surface and within soil sampling holes.
Size of data set. The number of values in each data set will range from very few to a large number (i.e., in the set of all data of a particular data type). The smallest data sets expected are the single samples planned to be collected from the SRE drains, water samples from the SRE Pond, and the cases of screening areas (or parts of screening areas that are separated from the main area) in which only a few samples will be collected.
Scope of sample set. The basic data sets for evaluation are the measurements or sample analysis results for single analysis regions or screening areas (or sub- areas, for screening areas like the leachfields, drainage channels, and buildings, where there are multiple locations defined as a single screening area). These will be combined in some cases for additional analysis. Examples of combined sets are all data of the same type in Area IV, all data of the same type in an analysis region, and all data for a screening area with multiple locations. Data set com- binations will be selected for analysis as indicated by the results as analysis proceeds.
Additional combinations of data will be evaluated as suggested by the character of the data and the results of previous evaluation.
Evaluation Methods
Methods for analysis of validated data will include cumulative probability plot evaluation,
statistical comparison of data sets, statistical comparison to regulatory limits, and comparisons to
prior measurements. These methods are summarized below and will be described in the Field Sam-
pling, Analysis, and Data Management Plan.
1. Cumulative probability plot evaluation. The cumulative probability plot is a method of data display that presents visually the fit of the data to a normal (Gaus- sian) distribution. A typical plot of a normal distribution, in which the probabil- ity of occurrence of a particular value is plotted against the value itself, is a char- acteristic bell-shaped curve (Figure 5-10a). If the presentation of the distribution is changed to a plot of the cumulative probability (area under the curve to the left of the value on the horizontal axis) it becomes an S-shaped

a. Differentlai Gaussian Distribution
0
420
Survey Data
x = lr.
b. Cumulative Gaussian Distribution Function
Gaussian Data
c. Scale Transformation to Linearize Plot d. Example with Data and Scale Reversed
Figure 5-10. Derivation of Cumulative Probability Plot

curve (Figure 5-lob). If the linear cumulative probability scale is replaced by a normal probability scale, the curve becomes a straight Iine (Figure 5-10c). The curve is usually rotated to make the probability scale the horizontal axis for ease of reading. Figure 5-10d is a cumulative probability plot of data sampled from an underlying normal distribution. The plot shows the fit of the data to the expected line and demonstrates the ease of direct visual interpretation of the data.
Each data set will be evaluated by examination of a cumulative probability plot of the data. Data representation of a single underlying normal distribution will be determined to support later analysis, which is based on the data having this distribution. The plot will also be inspected for evidence of contaminated-area data, which would be high-end values representing a different underlying nor- mal distribution by fitting a higher-slope line than the background-only data.
2. Statistical comparison of data sets. Normal distributions fit to two sets of data will differ as the result of sampling variability, even if the same underlying popu- lation is being measured. If the data sets represent different populations (such as two different background levels, or background and background plus contami- nation), their difference will contain the difference between the populations as well as that from sampling variability. To evaluate the difference between two sets of data, a difference that is considered significant (i.e., likely to represent different popdations) must be defined. For this plan, the significance of the dif- ference between pairs of data sets will be determined using the Student's t test, using a 5% significance level.
The Student's t test will be performed for each pair of background area data sets, for each background data set compared to the aggregate of background data sets for the same measurement or isotope concentration, and for each Area IV data set compared to the aggregate of the similar data for background areas.
3. Statistical comparison to regulatory limits. If a sample data set is determined by the Student's t test to be statistically different from background, the data will be compared to limits based on regulatory limits that are imposed as cleanup stan- dards for release of property for radiologcally unrestricted use. As a result of background variability and normal statistical variations it is expected that application of the Student's t test will indicate that some Area IV data sets are above background, even if no contamination is present. To preclude such cases becoming perceived issues or problems, the comparison to regulatory limits will be done.
The limit for comparison of gamma radiation measurements will be 5 pRhr above background. This is consistent with NRC and State of California limits, and is conservative and in keeping with as-low-as-reasonably-achievable principles compared to the DOE Order 5400.5 recommendation of 20 pRhr. The limits for soil radioisotope concentrations will be the values derived from pathways dose analysis using the RESRAD code (Ref. 5-2) and a dose limit of 10 mremlyear for a hypothesized future resident in Area IV. The limit is aconser- vative value based on the 100 mremlyear specified by DOE Order 5400.5.
The comparison to regulatory limits will use a statistical method known as sam- pling inspection by variables (Ref. 5-3), which provides a convenient method for comparing a normally distributed data set with a single-valued limit. The method was developed in the quality assurance industry and has been

successfully applied to radiological survey evaluation by Rocketdyne for the past 12 years. The method uses a test statistic (TS) which is determined by the mean and standard deviation of the data set values, and by a tolerance factor. The tolerance factor is based on the number of samples in the data set and the choices for acceptable risks for rejection of a data set which represents background only and for acceptance of a data set which includes some contamination. The values which will be used for each of these risks will be lo%, in accordance with recom- mendations by NRC and the State of California (Ref. 5-4 and 5-5).
If the values of TS and the mean of the data are less than the limit, the area repre- sented by the data will be accepted as uncontaminated. If both values are greater than the limit, the area will be considered contaminated. If only TS is greater than the limit (TS is larger than the mean), the area will be identified for further investigation.
5.5.2 Nature and Extent of Contamination
With the sample statistics discussed above and other associated parameters (both calculated and
assumed) for the distribution, estimates of the spatial distribution of a contaminant may be obtained
using the EPA Geo-EAS code, the commercially available SURFER code, or an existing, in-house
developed contour painting code. All these codes will provide, as outputs, contour plots of the nature
and extent of contamination in the characterized areas. Selection of a code will be determined from
preliminary review of a given data set for its suitability to be treated by the estimation algorithms
used by the code.
An example of a contour plot is a contour "painting7' plot of the radiation field around the
RMDF, derived from recent radiological monitoring data for this facility, as shown in Figure 5-11.
In this case, the estimation was performed using an inverse-distance-square weighting method,
which was considered appropriate for the approximate spatial distribution of radiation fields from
sources contained within building structures.
Such contour plots will be obtained for each radionuclide and superimposed to show the overall
contamination patterns and associated environmental pathways. Plots and associated numerical data
can be used for comparison against action levels. In addition, they can be used to refine the
conceptual model and to rank the radionuclides and/or migration pathways so as to enable prioritiza-
tion of future measures such as corrective remedial actions.

Figure 5-11. Contour Point Map Illustrating Radiation Field Surrounding the Radioactive Material Disposal Facility

5.6 REFERENCES
5-1. SW-846, Third Edition, Test Methods for Evaluating Solid Waste, (published by the EPA Office of Solid Waste and Emergency Response).
5-2. T. L. Gilbert, et al., "A Manual for Implementing Residual Radioactive Material Guide- lines," DOE/CH/8901 (June 1989).
5-3. MIL-STD-414, Sampling Procedures and Tables for Inspection by Variables for Percent Defective, June 11, 1957.
5-4. NRC Dismantling Order for the L-85 Reactor Decommissioning, NRC to M. E. Remley, dated March 1, 1983.
5-5. DECON-1, State of California Guidelines for Decontaminating Facilities and Equipment Prior to Release for Unrestricted Use, dated June 1977.

6. PROJECT MANAGEMENT
6.1 SITE MANAGEMENT
The Area IV Characterization Program will be managed by ETEC, with support from the Rock-
etdyne Environment, Health and Safety Division. Details of the management structure and the re-
sponsibilities of each organization will be defined in the program management plan (Section 6.4).
The organizations involved are described in general here. Figure 6-1 shows the positions of ETEC
and Environment, Health and Safety within Rockwell.
The ETEC organization is shown in Figure 6-2. Program direction and funding for the charac-
terization program will be the responsibility of the Facility Programs manager, who serves as the
ETEC Environmental Restoration and Waste Management program manager. Operations will be
planned and carried out by the Engineering and Operations organizations. Quality Assurance and
Training has responsibility for all quality assurance activities supporting DOE programs, and thus
will support the characterization program.
The Environment, Health and Safety Division is responsible for environmental issues for all
Rocketdyne operations. Its organization is shown in Figure 6-3. The director of Environment,
/ CHAIRMAN OF THE BOARD AND CHIEF EXECUTIVE OFFICER
EXECUTIVE VlCE PRESIDENT I AND CHIEF OPERATiNG OFFICER
PRESIDENT ROCKETDYNE
VlCE PRESIDENT ADVANCED PROGRAMS
DIVISION DIRECTOR ENVIRONMENT, HEALTH
AND SAFETY
GENERAL MANAGER ETEC
1 I 6650-1 2
Figure 6-1. Rockwell InternationaVRocketdyne Organization
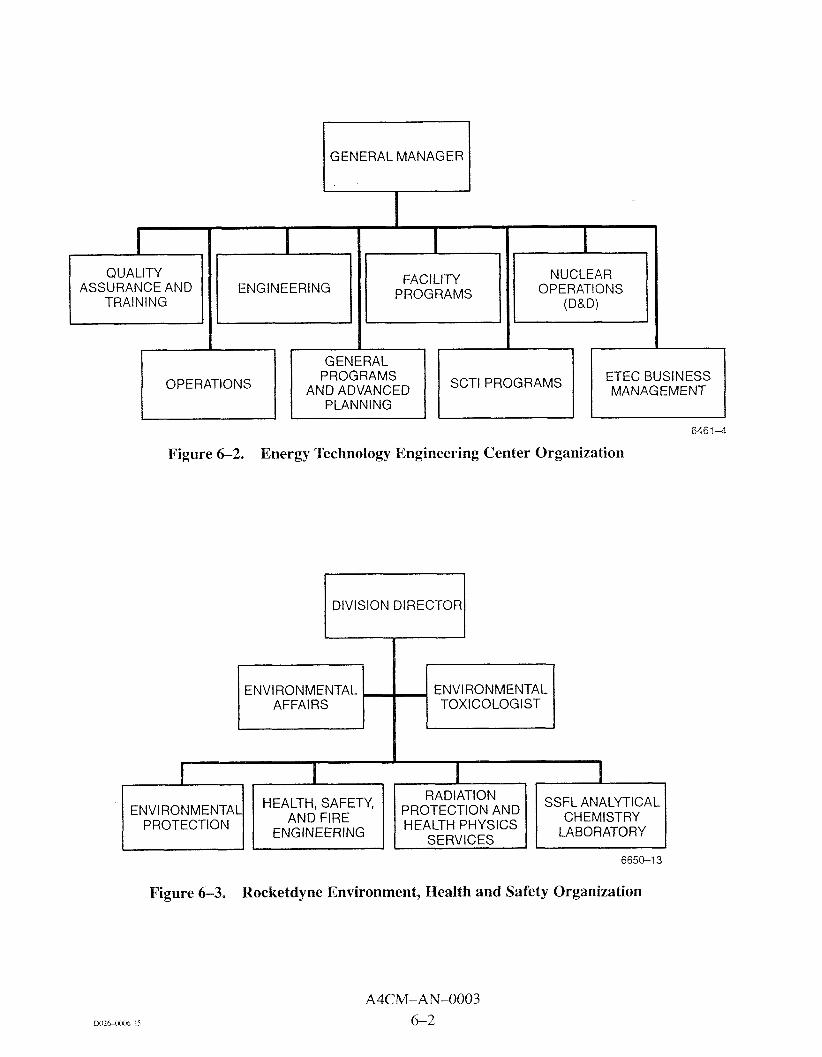
QUALITY ASSURANCE AND
TRAINING
GENERAL MANAGER
'r ENGINEERING PROGRAMS
I[ GENERAL
NUCLEAR OPERATIONS
Figure 6-2. Energy Technology Engineering Center Organization
DIVISION DIRECTOR w ENVl RONMENTAL ENVIRONMENTAL
TOXICOLOGIST
HEALTH, SAFETY, ENVIRONMENTA SSFL ANALYTICAL
PROTECTION ENGINEERING LABORATORY
Figure 6-3. Rocketdyne Environment, Health and Safety Organization

Health and Safety reports directly to the president of Rocketdyne. Radiation Protection and Health
Physics Services will provide support to the characterization program by conducting and evaluating
measurements of radiation and evaluating the results of radiological analysis of samples. Health,
Safety, and Fire Engineering will provide support for the characterization program for industrial
health and safety issues.
6.2 PLAN REVISIONS
Revisions will be incorporated as necessary. The revised plan will be reissued to all holders of
the original (or previous revision).
6.3 DOCUMENTATION
The following documents will be prepared specifically for this plan before implementation.
6.3.1 Health and Safety Plan
A Health and Safety Plan (HASP) will be prepared which will include but not be limited to the
following:
o Hazard assessment of the sampling procedure
o Training requirements for personnel implementing the plan
o Identification of key personnel and project organization
e Safe work practices
o Emergency plan.
In addition to all applicable Rocketdyne Health, Safety and Environment procedures, the HASP
will comply with the requirements of DOE 5480.4, Environmental Protection, Safety, and Health
Protection Standards.
6.3.2 Quality Assurance Project Plan
The Quality Assurance Project Plan (QAPP) will be prepared specifically for this plan and will
be prepared in accordance with the requirements of DOE Order 5700.6C, Quality Assurance.
6.3.3 Field Sampling Plan
A Field Sampling Plan (FSP) will be prepared which will include but not be limited to the
following:

Locations for sampling and measurements
Media type of all samples
Number of samples and measurements at each location
Volume of each sample
Instrument calibration requirements
Cleaning of sampling tools and containers
Numbers and locations of blind duplicate, field replicate, and rinsate samples
Packaging, handling and storage requirements for each sample, including chain-of-custody requirements
Documentation required for each sample and measurement, including docu- ment control
Identification and labeling of each sample
Environmental restoration after sampling
Precautions such as care not to disturb wildlife habitat
Training of personnel involved in sampling and measurements.
6.3.4 Standard Operating Procedures
Applicable ETEC Procedures which will be complied with during implementation of this plan
include:
1-02 Training Programs
e 1-03 Health, Safety and Fire Protection Program
e 1-1 3 Preparation, Production, and Distribution of Technical Reports
e 1-15 ETEC Quality Assurance Audits
2-03 ProgradProject Planning and Control
e 2-16 Retention, Documentation, and Control of Project Records
e 6-06 Instrumentation Servicing, Calibration, and Standards.

6.4 PROGRAM PLANNING
A Program Management Plan (PMP) will be prepared in accordance with ETEC Procedure
2-03, ProgradProject Planning and Control. The major elements of the Program Management Plan
are:
e Project description
0 Scope and objectives
o Description and work plan
o Technical and administrative controls
e An organization chart showing the key personnel responsible for implementing the plan
e Definition of all major milestones to be met during implementation of the plan
e Definition'of the responsibilities of all key personnel shown in the program or- ganization chart
e List of all tasks required to implement the plan
e Baseline schedule to complete the implementation of the plan
e Identification of external reporting requirements, responsibilities, and approvals.
6.5 REPORTING REQUIREMENTS
Once implementation of the plan is begun, monthly progress reports will be submitted to the
DOE site office. The final report will be submitted, as required, to DOE-HQ and distributed to the
various cognizant regulatory agencies involved in Area IV.
6.6 PROJECT SCHEDULE
The schedule for implementation of this plan is presented in Figure 6-4.

1. Complete preparation of site
characterization plan
2. DOE review and approval
3. Prepare PMP, HASP, QAPP,
and FSP
4. Perform site characterization
field work
5. Prepare and issue final report
Months
Figure 6-4. SSFL Area IV Site Cl~aracterization Schedule

This page intentionally left blank.

6. PROJECT MANAGEMENT
6.1 SITE MANAGEMENT
The Area IV Characterization Program will be managed by ETEC, with support from the Rock-
etdyne Environment, Health and Safety Division. Details of the management structure and the re-
sponsibilities of each organization will be defined in the program management plan (Section 6.4).
The organizations involved are described in general here. Figure 6-1 shows the positions of ETEC
and Environment, Health and Safety within Rockwell.
The ETEC organization is shown in Figure 6-2. Program direction and funding for the charac-
terization program will be the responsibility of the Facility Programs manager, who serves as the
ETEC Environmental Restoration and Waste Management program manager. Operations will be
planned and carried out by the Engineering and Operations organizations. Quality Assurance and
Training has responsibility for all quality assurance activities supporting DOE programs, and thus
will support the characterization program.
The Environment, Health and Safety Division is responsible for environmental issues for all
Rocketdyne operations. Its organization is shown in Figure 6-3. The director of Environment,
CHAIRMAN OF THE BOARD AND CHIEF EXECUTIVE OFFICER
EXECUTIVE VlCE PRESIDENT AND CHIEF OPERATING OFFICER
PRESIDENT ROCKETDYNE
VlCE PRESIDENT ADVANCED PROGRAMS
DIVISION DIRECTOR ENVIRONMENT, HEALTH
AND SAFETY
I GENERAL MANAGER I I ETEC I
Figure 6-1. Rockwell InternationaVRocketdyne Organization
GENERAL MANAGER I .
ASSURANCE AND ENGINEERING PROGRAMS OPERATIONS
6461-4
Figure 6-2. Energy Technology Engineering Center Organization
DIVISION DIRECTOR
ENVIRONMENTAL ENVIRONMENTAL TOXICOLOGIST
ENVIRONMENTA PROTECTION
Figure 6-3. Rocketdyne Environment, Health and Safety Organization

Health and Safety reports directly to the president of Rocketdyne. Radiation Protection and Health
Physics Services will provide support to the characterization program by conducting and evaluating
measurements of radiation and evaluating the results of radiological analysis of samples. Health,
Safety, and Fire Engineering will provide support for the characterization program for industrial
health and safety issues.
6.2 PLAN REVISIONS
Revisions will be incorporated as necessary. The revised plan will be reissued to all holders of
the original (or previous revision).
6.3 DOCUMENTATION
The following documents will be prepared specifically for this plan before implementation.
6.3.1 Health and Safety Plan
A Health and Safety Plan (HASP) will be prepared which will include but not be limited to the
following:
e Hazard assessment of the sampling procedure
0 Training requirements for personnel implementing the plan
e Identification of key personnel and project organization
e Safe work practices
0 Emergency plan.
In addition to all applicable Rocketdyne Health, Safety and Environment procedures, the HASP
will comply with the requirements of DOE 5480.4, Environmental Protection, Safety, and Health
Protection Standards.
6.3.2 Quality Assurance Project Plan
The Quality Assurance Project Plan (QAPP) will be prepared specifically for this plan and will
be prepared in accordance with the requirements of DOE Order 5700.6C, Quality Assurance.
6.3.3 Field Sampling Plan
A Field Sampling Plan (FSP) will be prepared which will include but not be limited to the
following:

Locations for sampling and measurements
Media type of all samples
Number of samples and measurements at each location
Volume of each sample
Instrument calibration requirements
Cleaning of sampling tools and containers
Numbers and locations of blind duplicate, field replicate, and rinsate samples
Packaging, handling and storage requirements for each sample, including chain-of-custody requirements
Documentation required for each sample and measurement, including docu- ment control
Identification and labeling of each sample
Environmental restoration after sampling
Precautions such as care not to disturb wildlife habitat
Training of personnel involved in sampling and measurements.
6.3.4 Standard Operating Procedures
Applicable ETEC Procedures which will be complied with during implementation of this plan
include:
e 1-02 Training Programs
e 1-03 Health, Safety and Fire Protection Program
e 1 - 1 3 Preparation, Production, and Distribution of Technical Reports
e 1-15 ETEC Quality Assurance Audits
e 2-03 Program/Project Planning and Control
e 2-1 6 Retention, Documentation, and Control of Project Records
e 6-06 Instrumentation Servicing, Calibration, and Standards.

6.4 PROGRAM PLANNING
A Program Management Plan (PMP) will be prepared in accordance with ETEC Procedure
2-03, ProgramlProject Planning and Control. The major elements of the Program Management Plan
are:
e Project description
e Scope and objectives
e Description and work plan
Technical and administrative controls
e An organization chart showing the key personnel responsible for implementing the plan
Definition of all major milestones to be met during implementation of the plan
e Definition'of the responsibilities of all key personnel shown in the program or- ganization chart
e List of all tasks required to implement the plan
e Baseline schedule to complete the implementation of the plan
e Identification of external reporting requirements, responsibilities, and approvals.
6.5 REPORTING REQUIREMENTS
Once implementation of the plan is begun, monthly progress reports will be submitted to the
DOE site office. The final report will be submitted, as required, to DOE-HQ and distributed to the
various cognizant regulatory agencies involved in Area IV.
6.6 PROJECT SCHEDULE
The schedule for implementation of this plan is presented in Figure 6-4.
1. Complete preparation of site
characterization plan
2. DOE review and approval
3. Prepare PMP, HASP, QAPP,
and FSP
4. Perform site characterization
field work
5. Prepare and issue final report
Months
6650-68
Figure 6-4. SSFL Area IV Site Characterization Schedule

APPENDIX A SUMMARY OF KEY ORDERS AND REGULATIONS
This appendix summarizes Federal and State of California orders and regulations that govern radiological environmental activities for Area IV of the SSFL. For this document, these operations include ETEC and, by DOE assignment of responsibility, the rest of the SSFL Area IV. Subsequent sections discuss the applicable regulations.
Applicable orders and regulations are summarized in Tables A-1 through A-3. Each table identifies the order or regulation by number and title, and summarizes the applicable content. Table A-l lists DOE Orders applicable to radiological characterization. Table A-2 lists applicable Federal regulations identified in DOE 5400.1 as implementing applicable requirements. Table A-3 lists applicable California statutes and regulations.
The central DOE Order for environmental protection is DOE 5400.1, General Environmental Protection Program. This Order defines standards in three categories: ( 1 ) those imposed by Federal statutes, regulations, and requirements; (2) those imposed by State and local statutes, regulations, and requirements applicable to DOE; and (3) those imposed by DOE directives.
The concentrations of radioactive constituents of the site environment and effluents are deter- mined by sampling. In addition, the dose limit to the public must be evaluated considering all expo- sure modes from all DOE activities, including remedial actions required by DOE 5400.5. DOE 5400.1 specifies that the public dose component attributable to airborne releases of radioactiv- ity must comply with CAA standards set forth in 40 C m 61, Subpart H (Table A-3), and be moni- tored according to 40 C m 60, Appendix A, ANSI N 13.1-1969, and DOE 5400.xy (draft). EPA reg- ulation 40 CFR 61.93, Subpart H, requires that compliance with the CAA standards be demonstrated using AIRDOS-PC or other EPA-approved models or procedures (currently CAP88PC). DOE 5400.xy (draft), Chapter IV, Section 3(d)(2), states that Gaussian models or other EPA-approved straight-line models used to demonstrate compliance with 40 CFR 61.93 should use an additional dose assessment to account reaIisticaIIy for temporal and spatial variations in atmo- spheric conditions and release rates. DOE 5400.5, Chapter 11, Section 6(c) states that, if available data are not sufficient to evaluate factors germane to dose or if they are too costly to determine, the assumed parametric values must be sufficiently conservative such that it would be unlikely for indi- viduals to actually receive a dose that would exceed the dose calculated using the values assumed.

Table A-1. DOE Orders Applicable to Environmental Monitoring
Title
General Environmental Protection Program
Radiological Protection of the Public and the Environment
Radiological Effluent Monitoring and Environment Surveillance
Quality Assurance
Quality Assurance
Radioactive Waste Management
Applicable Content
Establishes environmental protection program requirements, authorities, and responsibilities for DOE operations for assur- ing compliance with applicable federal, state, and local envi- ronmental protection laws and regulations, executive orders, and internal DOE policies
Defines more specifically the environmental protection re- quirements established generally in DOE 5480.1 B
Establishes standards and requirements for operations of DOE and DOE contractors with respect to protection of mem- bers of the public and the environment against undue risk from radiation
Specifies limits for radiation doses to the public from all expo- sure modes from DOE activities; drinking water dose impacts meet standards of 40 CFR 141.
To be upgraded to a rule by 10 CFR 834 (draft issued 111 0191)
Establishes requirements and guides for radiological effluent monitoring and environmental surveillance in support of DOE operation and activities
To be replaced by 10 CFR 834 (draft issued 111 0191)
Establishes quality assurance requirements for DOE
Implements provisions of DOE 5700.6B and sets forth the SF objectives to assure that quality assurance and reliability exist as integral parts of programs and projects
Directs SF contractors to develop, implement, and maintain quality assurance and reliability programs responsive to DOE 5700.68, obtain approvals from SF of detailed quality assur- ance and reliability requirements, and provide to SF reports of conditions adverse to achievement of quality and reliability goals
Establishes policies, guidelines, and minimum requirements by which DOE manages its radwaste, mixed waste, and con- taminated facilities
Heads of field organizations are responsible for all activities that affect treatment, storage, or disposal of waste in facilities under their jurisdiction
Requires environmental monitoring program that conforms with DOE 5484.1 and is
1. Designed to measure operational effluent releases, migra- tion of radionuclides, disposal unit subsidence, and changes in disposal facility and site parameters that may affect long-term performance
2. Based on characteristics of the facility being measured; may include monitoring surface soil, air, surface water, and subsurface soil and water in the saturated and unsaturated zones
3. Capable of detecting changing trends in performance to allow corrective action before exceeding performance obiectives

Table A-2. Applicable Mandatory Federal Environmental Protection Regulations
Regulation Title I Applicable Content I I I I
Safe Drinking Water Act I I
I Radiation Protection
40 CFR 141
Specifies limits for radiation doses to the public from all exposure modes from DOE activities; drinking water dose impacts meet standards of 40 CFR 141.
7
National Primary Drinking Water Regulations
10 CFR 834
Table A-3. Applicable California Statutes and Regulations
Establishes primary drinking water regulations (includes concen- tration limits for Ra-226, Ra-228, gross alpha activity, tritium, and Sr-90; and dose limits from beta particle and photon radio- activity)
-
Title I
Radiological Protection of the Public and the Environment
Applicable Content
Establishes standards and requirements for operations of DOE and DOE contractors with respect to protection of members of the public and the environment against undue risk from radiation
Title 17, Division 1
Chapter 5,
Subchapter 4, Group 3 Article 3,
Section 30269
Appendix A, Table II
California Code of Regulations
Public Health State Department of Health
Services Sanitation (Environmental) Radiation Standards for Protection Against Radiation Dose Limits, Permissible Levels and Concentrations
Concentrations in Effluents to Uncontrolled Areas
Concentration in Air and Water Above Natural Background
Prohibits release into air or water in any uncontrolled area of any concentration of radioactive material which, when averaged over any year, exceeds limits specified in Appendix A, Table It
Lists by isotope the allowable concentrations in air and water

This page intentionally left blank.