CHARACTERIZATION AND MODELING OF FRICTION AND WEAR … · CHARACTERIZATION AND MODELING OF FRICTION...
10
Sustainable Construction and Design 2011 Copyright © 2011 by Laboratory Soete CHARACTERIZATION AND MODELING OF FRICTION AND WEAR: AN OVERVIEW F. Al-Bender 1 , K. De Moerlooze 1,2 1 Katholieke Universiteit Leuven, Dept. Mech. Eng., Div. PMA, Celestijnenlaan 300B, B-3001 Leuven 2 Abstract In this age of virtual design, high-performance machines, and precise motion control, the ability to characterize friction and wear processes and then to model and simulate them, becomes a pertinent issue. This communication gives a condensed overview of the generic characteristics of friction, thereafter, generic models, developed at KULeuven, PMA, are presented and discussed. with Leuven Air Bearings N.V. since Sept. 2010 In regard to friction, both sliding and rolling are considered. The characterization concerns (i) the relationship between the friction (traction) force and the state of sliding of the system (displacement, velocity,…), at a given normal load; (ii) the relationship between the coefficient of friction and the normal load. As regards frictional behaviour in function of sliding (rolling) state, the main features are: (i) pre-sliding (pre- rolling) hysteresis and (ii) gross-sliding (rolling) dynamics. Models are presented that capture those features and relate them to the contact characteristics. Comparison with experimental results is also presented for the main features. Secondly, the dependence of the coefficient of friction on the normal load is identified and modelled. Finally, regarding wear simulation, the generic friction model is extended to cater for an asperity population that changes during the lifetime of sliding. Based on fatigue considerations, asperities get broken after a certain number of contact cycles, and are replaced by smaller ones. With the aid of this model, we try to correlate energy dissipation with wear evolution, and support that by experimental observation. Keywords : Friction, traction, wear, normal load, friction coefficient, theoretical models, experimental results, Stribeck curve, friction lag, hysteresis, rolling. 1 INTRODUCTION Friction modelling has been steadily gaining in interest over the last few decades. However, owing to the complexity of the friction and wear phenomenon, no comprehensive, practicable friction model that shows all of the experimentally observed aspects of friction force dynamics in one formulation is available. Most available friction and wear models are, in essence, empirical, that is, based on limited observations and interpretations. In this sense, the resulting models are valid only for the specific scope of test conditions, such as the level and type of excitation, used to obtain the data. On the other hand, development of simulation models and, where possible, predictive theories, at scales from atomic, through continuum, to useful engineering models, can fill empty gaps in the toolboxes available to designers and analysts. Besides the field of tribology, where the origin of friction is one of the main topics, modelling and compensation of friction dynamics are treated in several other domains. In the machining and assembly industry, demand for high-accuracy positioning systems and tracking systems is increasing. Research on controlled mechanical systems with friction is motivated by the increasing demand for these systems. Friction can severely deteriorate control system performance in the form of higher tracking errors, larger settling times, hunting, and stick-slip phenomena. In short, friction is one of the main players in a wide variety of mechanical systems. This communication presents an overview of friction model-building, which starts from the generic mechanisms behind friction to construct models that simulate observed macroscopic friction behaviour. First, basic friction properties are presented. Then, the generic friction model is outlined. Hereafter, the relationship between friction coefficient and normal load is considered from theoretical and experimental point view. A theory for tarctive rolling is then presented with experimental validation. Finally, the gereric friction model is extended to deal with wear in sliding contacts. 19
Transcript of CHARACTERIZATION AND MODELING OF FRICTION AND WEAR … · CHARACTERIZATION AND MODELING OF FRICTION...
Sustainable Construction and Design 2011
Copyright © 2011 by Laboratory Soete
CHARACTERIZATION AND MODELING OF FRICTION AND WEAR: AN
OVERVIEW
F. Al-Bender1, K. De Moerlooze1,2
1 Katholieke Universiteit Leuven, Dept. Mech. Eng., Div. PMA, Celestijnenlaan 300B, B-3001 Leuven
2
Abstract In this age of virtual design, high-performance machines, and precise motion control, the ability to characterize friction and wear processes and then to model and simulate them, becomes a pertinent issue. This communication gives a condensed overview of the generic characteristics of friction, thereafter, generic models, developed at KULeuven, PMA, are presented and discussed.
with Leuven Air Bearings N.V. since Sept. 2010
In regard to friction, both sliding and rolling are considered. The characterization concerns (i) the relationship between the friction (traction) force and the state of sliding of the system (displacement, velocity,…), at a given normal load; (ii) the relationship between the coefficient of friction and the normal load.
As regards frictional behaviour in function of sliding (rolling) state, the main features are: (i) pre-sliding (pre-rolling) hysteresis and (ii) gross-sliding (rolling) dynamics. Models are presented that capture those features and relate them to the contact characteristics. Comparison with experimental results is also presented for the main features. Secondly, the dependence of the coefficient of friction on the normal load is identified and modelled.
Finally, regarding wear simulation, the generic friction model is extended to cater for an asperity population that changes during the lifetime of sliding. Based on fatigue considerations, asperities get broken after a certain number of contact cycles, and are replaced by smaller ones. With the aid of this model, we try to correlate energy dissipation with wear evolution, and support that by experimental observation.
Keywords : Friction, traction, wear, normal load, friction coefficient, theoretical models, experimental results, Stribeck curve, friction lag, hysteresis, rolling.
1 INTRODUCTION
Friction modelling has been steadily gaining in interest over the last few decades. However, owing to the complexity of the friction and wear phenomenon, no comprehensive, practicable friction model that shows all of the experimentally observed aspects of friction force dynamics in one formulation is available. Most available friction and wear models are, in essence, empirical, that is, based on limited observations and interpretations. In this sense, the resulting models are valid only for the specific scope of test conditions, such as the level and type of excitation, used to obtain the data. On the other hand, development of simulation models and, where possible, predictive theories, at scales from atomic, through continuum, to useful engineering models, can fill empty gaps in the toolboxes available to designers and analysts.
Besides the field of tribology, where the origin of friction is one of the main topics, modelling and compensation of friction dynamics are treated in several other domains. In the machining and assembly industry, demand for high-accuracy positioning systems and tracking systems is increasing. Research on controlled mechanical systems with friction is motivated by the increasing demand for these systems. Friction can severely deteriorate control system performance in the form of higher tracking errors, larger settling times, hunting, and stick-slip phenomena. In short, friction is one of the main players in a wide variety of mechanical systems.
This communication presents an overview of friction model-building, which starts from the generic mechanisms behind friction to construct models that simulate observed macroscopic friction behaviour. First, basic friction properties are presented. Then, the generic friction model is outlined. Hereafter, the relationship between friction coefficient and normal load is considered from theoretical and experimental point view. A theory for tarctive rolling is then presented with experimental validation. Finally, the gereric friction model is extended to deal with wear in sliding contacts.
19

Sustainable Construction and Design 2011
Copyright © 2011 by Laboratory Soete
Figure 1. Basic friction configuration. Figure 2. The two friction regimes and the transition between them.
2 BASIC FRICTION BEHAVIOR
Considering friction as a mechanical system, (see Fig.1), a close examination of the sliding process reveals two friction regimes, namely, the pre-sliding regime and the gross sliding regime, (see Fig.2). In the pre-sliding regime the adhesive forces, owing to asperity contacts, are dominant, and thus the friction force is primarily a function of displacement rather than velocity. The reason for this behaviour is that the asperity junctions deform elasto-plastically, thus behaving as nonlinear hysteretic springs.
As the displacement increases, more and more junctions break and have less time to reform, resulting eventually in gross sliding.
The sliding regime is, thus, characterized by a continuous process of asperity junction formation and breaking such that the friction force becomes predominantly a function of the velocity [1]. The transition from pre-sliding to gross sliding is a criticality that depends on many factors such as the relative velocity (to be envisaged as the displacement rate) and acceleration of the sliding objects, see [2].
Figure 3. Example of desired motion in the pre-sliding regime.
Figure 4. Hysteresis behavior as a result of the trajectory of Fig. 3.
2.1 Pre-sliding behavior
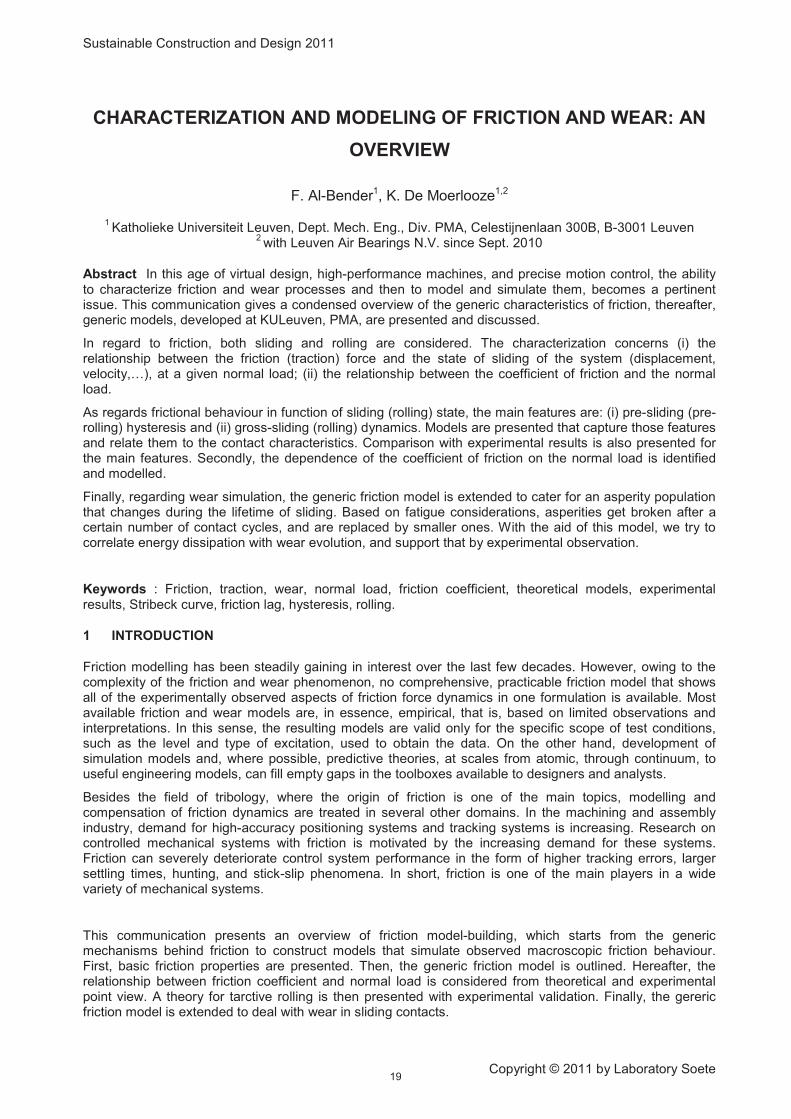
At very small displacements, that is, in the pre-sliding regime, experiments reveal a hysteretic displacement-dependent friction force [3,4]. When a pre-sliding displacement command, such as that shown in Fig. 3, is applied to the block, the force-displacement behavior of Fig.4 results. The position signal is chosen such that there is an inner loop within the outer hysteresis loop. The resulting friction-position curve is rate independent (compare the right and left panels of Fig.4). In other words, the friction-position curve is independent of the speed of the applied position signal. When an inner loop is closed, (c-d-c), the curve of the outer loop (a-c-b) is followed again, proving the nonlocal memory characteristic of the hysteresis. The shape of the hysteresis function is determined by the distribution of the asperity heights, the tangential stiffness, and the normal stiffness of the contact.
This hysteresis behaviour arises primarily from micro-slip, that is, the breaking of adhesive contacts, just as in the Maxwell-Slip model discussed further below. The contribution of deformation losses, which are hysteresis losses in the bulk materials, depends on the relative value of this part as compared to the
Pre-sliding
Transition
Gross sliding
20
Sustainable Construction and Design 2011
Copyright © 2011 by Laboratory Soete
adhesive part, as well as on the tangential stiffness of the asperities, which governs the extent of deformation before slip.
( )
( ) ; 0( )
( ) ; 0
virginF f x
y x xwith f x
y x x
!" #
$ $ %&
Upon reversal at any point xm
22
mfric m
x xF F f
$' ( ) * +, -
, a
doubly dialated version of the virgin curve is followed:
Figure 5. Characteristics of hysteresis with nonlocal memory.
Masing’s rules for describing hysetersis
Figure 6. Modeling of hysteresis using Maxwell-Slip elements.
Figure 5 explains the constitution of hysteresis according to Masing’s rules, shown to the right thereof. This behaviour can also be modeled discretely by a parallel connection of Maxwell-Slip elements [5], as shown in Fig. 6.
2.2 Gross sliding
When the asperity junctions are continually being created and broken, the frictional interface is in the gross sliding regime. Two main characteristics are of interest here. The first is the steady-state friction force behavior with increasing steady-state sliding velocities, generally known as the Stribeck curve, Fig. 7. The second is the change of the friction force with the velocity variation, known as the friction lag or friction memory phenomenon, Fig. 8.
Fri
ctio
n f
orc
eF
rict
ion f
orc
eF
rict
ion f
orc
e
Model:
. /1 / ( ) , (0) 0.dF
f F s v fdt
$
Figure 7. The Stribeck curve consists of velocity weakening, s(v), and velocity strengthening.
Figure 8. Friction lag and its constitutive equation. s(v) is the velocity weakening curve also called the “Stribeck effect”.
2.3 The Stribeck curve
When the friction force is measured at constant velocity values (Fig. 7), the resulting functional relationship has a characteristic form. For increasing velocities, the friction force initially decreases to a minimum (velocity weakening) and then increases again (velocity strengthening). In lubricated sliding, this
“Virg in curve“
0
y(x)
-y(-x)
xm
Ffric
Fm
-xm
(B) Possible trajectory of the hysteretic friction force
x
4
22
1
3
5
0n
02
0i
01
….
x ,
kn
ki
k2
k1
F
0n
02
0i
01
….
x ,
kn
ki
k2
k1
F
Fi
x
FiFi
x
velocity (mm/s)
Fri
ctio
n f
orc
e (N
)
21
Sustainable Construction and Design 2011
Copyright © 2011 by Laboratory Soete
characteristic is known as the Stribeck curve, where the velocity weakening arises from the initial buildup of hydrodynamic pressure, while the velocity strengthening is attributed to the viscous shear of the lubricating film.
The same behaviour seems to hold true for dry friction, which justifies using the same name, that is, the Stribeck curve, to describe it. The actual form of the friction-velocity curve is determined by various process parameters, namely, the normal creep or, equivalently, the time evolution of adhesion, the surface topography, and the asperity parameters, primarily the tangential stiffness and inertia [2,6,8].
2.4 Friction lag
Friction lag, also called hysteresis in the velocity, or frictional memory, is manifested by a lag in the friction force relative to the sliding velocity. The origin of friction lag in lubricated friction relates to the time required to modify the lubricant film thickness, which is known as the squeeze effect. Friction lag is also observed in dry friction experiments (Fig. 8), where lubrication is not used. The mechanism causing friction lag in dry sliding is similar to that for lubricated friction, namely, that the local adhesion coefficient increases with the time of contact of two opposing asperities, owing to normal creep. In other words, time is required before the friction force changes with changing sliding velocity. Since the normal creep is caused by the sinking of the surfaces into each other, this mechanism is akin to the squeeze effect in lubricated friction. Thus, the friction force is higher for acceleration than for deceleration, so that the dynamic friction force curve circles around the steady-state curve. The Stribeck curve s(v) acts as the attractor.
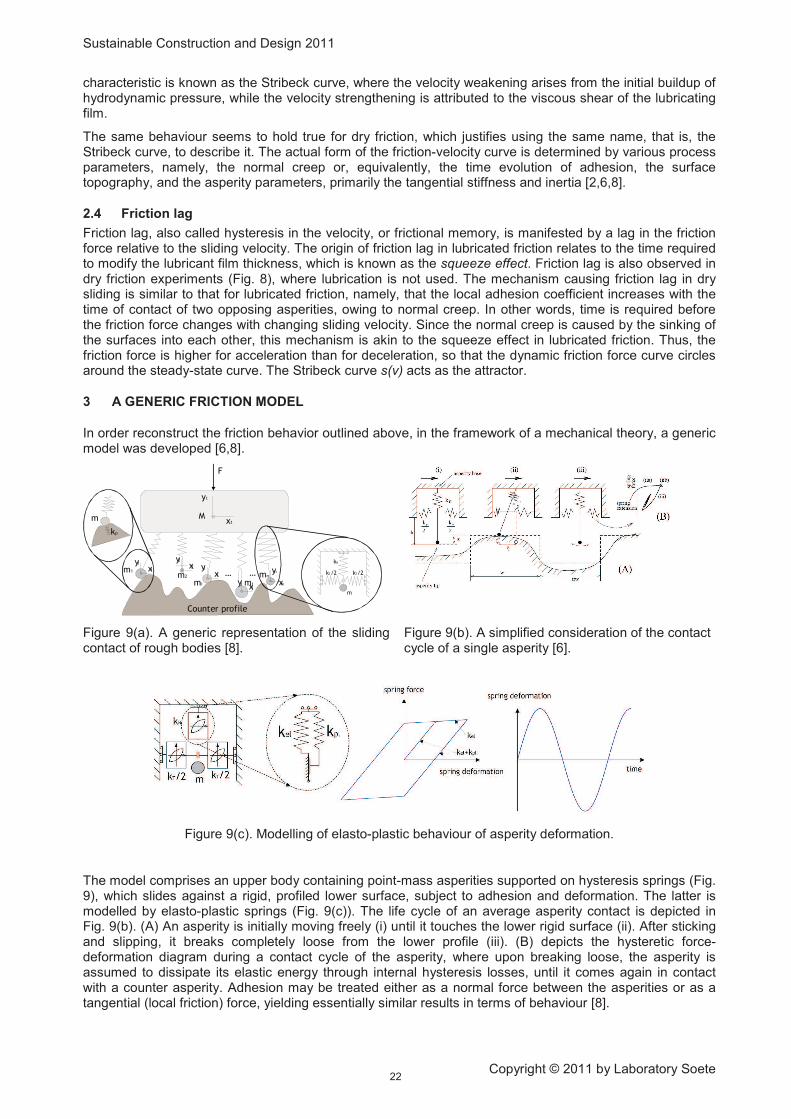
3 A GENERIC FRICTION MODEL
In order reconstruct the friction behavior outlined above, in the framework of a mechanical theory, a generic model was developed [6,8].
…
F
kN
k /2Tk /2T
m
Counter profile
M
yt
xt
m2
y2x2
mjyjxj
mnyn
xnmi
…yi
xim1
y1
x1
kp
m
Figure 9(a). A generic representation of the sliding contact of rough bodies [8].
Figure 9(b). A simplified consideration of the contact cycle of a single asperity [6].
Figure 9(c). Modelling of elasto-plastic behaviour of asperity deformation.
The model comprises an upper body containing point-mass asperities supported on hysteresis springs (Fig. 9), which slides against a rigid, profiled lower surface, subject to adhesion and deformation. The latter is modelled by elasto-plastic springs (Fig. 9(c)). The life cycle of an average asperity contact is depicted in Fig. 9(b). (A) An asperity is initially moving freely (i) until it touches the lower rigid surface (ii). After sticking and slipping, it breaks completely loose from the lower profile (iii). (B) depicts the hysteretic force-deformation diagram during a contact cycle of the asperity, where upon breaking loose, the asperity is assumed to dissipate its elastic energy through internal hysteresis losses, until it comes again in contact with a counter asperity. Adhesion may be treated either as a normal force between the asperities or as a tangential (local friction) force, yielding essentially similar results in terms of behaviour [8].
22
Sustainable Construction and Design 2011
Copyright © 2011 by Laboratory Soete
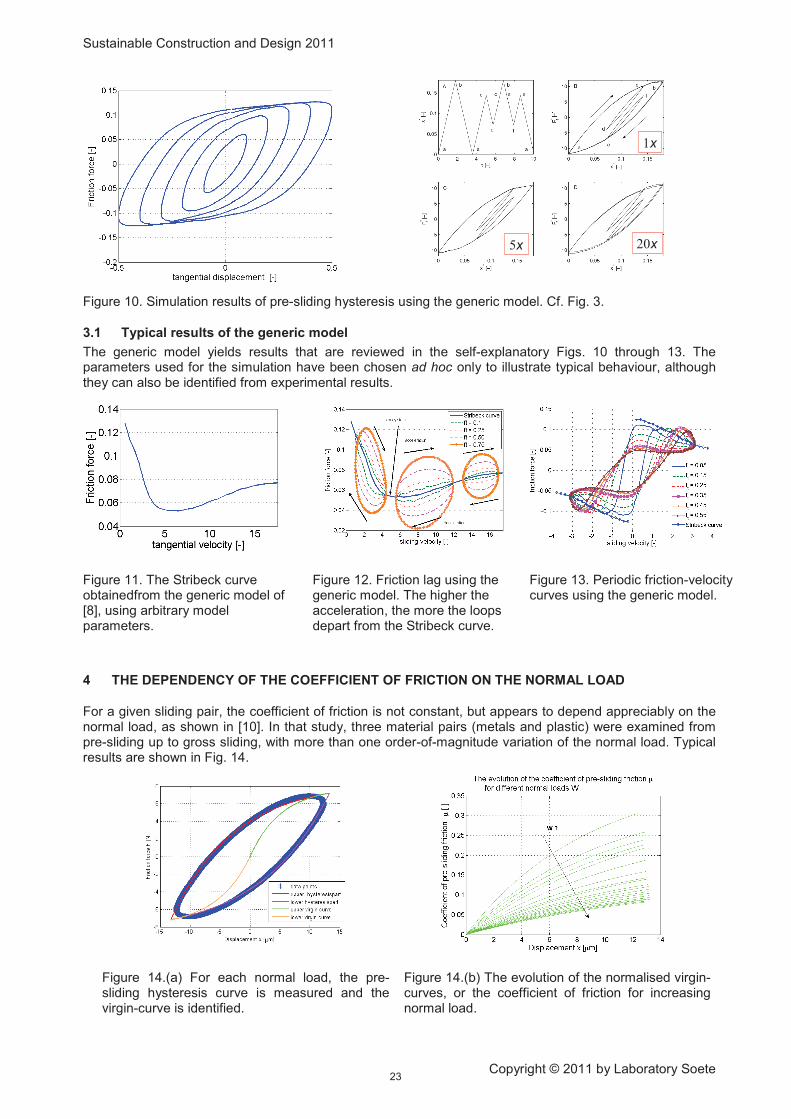
Figure 10. Simulation results of pre-sliding hysteresis using the generic model. Cf. Fig. 3.
3.1 Typical results of the generic model
The generic model yields results that are reviewed in the self-explanatory Figs. 10 through 13. The parameters used for the simulation have been chosen ad hoc only to illustrate typical behaviour, although they can also be identified from experimental results.
Figure 11. The Stribeck curve obtainedfrom the generic model of [8], using arbitrary model parameters.
Figure 12. Friction lag using the generic model. The higher the acceleration, the more the loops depart from the Stribeck curve.
Figure 13. Periodic friction-velocity curves using the generic model.
4 THE DEPENDENCY OF THE COEFFICIENT OF FRICTION ON THE NORMAL LOAD
For a given sliding pair, the coefficient of friction is not constant, but appears to depend appreciably on the normal load, as shown in [10]. In that study, three material pairs (metals and plastic) were examined from pre-sliding up to gross sliding, with more than one order-of-magnitude variation of the normal load. Typical results are shown in Fig. 14.
Figure 14.(a) For each normal load, the pre-sliding hysteresis curve is measured and the virgin-curve is identified.
Figure 14.(b) The evolution of the normalised virgin-curves, or the coefficient of friction for increasing normal load.
1x
5x 20x
1x
5x 20x
23

Sustainable Construction and Design 2011
Copyright © 2011 by Laboratory Soete
Figure 15.(a) Evolution of h0 Figure 15.(b) Evolution of a, for PET on PET. , for PET on PET.
To analyze these results, each virgin curve was fitted by means of a three-parameter function:
. /0( )( ) 1 e
a x x
oF x h$ $ $ (1)
where, h0 scales the friction force and a the pre-sliding distance, (x0
Typical behaviour of these two parameters is shown in Fig. 15, where one can clearly notice that (i) h
is the position of the origin point).
0
increases less than linearly with the load, which means that the coefficient of friction decreases with increasing normal load, and (ii) a decreases with the normal load, meaning that the pre-sliding distance increases with load. The rage of variation of these two parameters depends on the material combination.
This behaviour has been modelled theoretically, making use of (i) the Maxwell-slip structure for modelling the contact in pre-sliding (Fig. 16) and (ii) the Greenwood and Williamson theory for modelling the local friction force at each asperity. The results of this latter model show that a decreasing coefficient of friction in the normal load always results. The trend is most pronounced for low values of the Plasticity Index and of the normal load, as shown in Fig. 17.
Thus the contact parameters influencing hysteresis behaviour and variation of the friction coefficient with normal load are: elasticity, hardness, surface topography and adhesion.
When this analysis is applied to the whole of the pre-sliding region, the behaviour shown in Fig. 18 is obtained [9]. Let us note that this behaviour can is also be predicted by the generic model described in ref. [8].
Figure 16.The Maxwell-slip model for pre-sliding. Figure 17.The static friction coefficient as function of the normal load for different values of the Plasticity Index.
24

Sustainable Construction and Design 2011
Copyright © 2011 by Laboratory Soete
Figure 18.The variation of the coefficient of friction with the displacement and the normal load during pre-sliding.
5 MODELLING OF TRACTIVE ROLLING FRICTION
Tractive rolling is caused by the so-called creepage (or ‘rigid slip’) between the rolling surfaces. This creepage causes the points, which enter the contact patch mated with each other, to progressively stretch and finally slip when reaching the trailing edge and exiting the contact patch. This situation is adequately illustrated by Figures 19-20, ref. [11].
Figure 19. Configuration of tractive rolling. The pressure distribution in the contact patch is Hertzian. Creepages (longitudinal, transverse and spin) are caused by differences in rigid motions between the ball and the flat.
Figure 20. Build up of traction through the contact patch, ending by the traction (slip) limit. The constitutive slip equation states that the slip S is equal to the creepage C less the total derivative of the surface displacement.
Considering, for example, the presence of only spin creepage, as is the case of a ball between V-grooves, the traction field and the associated hysteresis behaviour are depicted in Fig. 21. The hysteresis properties, namely, rate independence and nonlocal memory, resemble those identified in sliding contacts. Thus, we see that sliding and rolling have similar friction (dynamics) properties during pre-rolling. During gross rolling, the Stribeck effect and the friction-lag are much less pronounced. This is so because during rolling, the
012$31
x
25

Sustainable Construction and Design 2011
Copyright © 2011 by Laboratory Soete
Figure 21. Left: steady-state rolling traction field. Right: the hysteresis curve of the traction moment in function of the rolling displacement.
relative speeds between slipping points on the surfaces remains very low (unless the contact as a whole is slipping, in which case rolling ceases to exist). This point is best illustrated by Figures 22 and 23. However, since creepage is generally dependent on the dynamics of the rolling system, i.e. that it changes during dynamic rolling, this situation can lead to very complex dynamics as presented in ref [13].
Figure 23. Evolution of h0 (left) and a (right), of Eq. (1), in the normal load, for rolling contact. We note that
h0
is almost linear in the load and a varies relatively only slightly.
Finally, the theoretical model has been validated by comparison with experiment. The results are shown in Fig. 24 where very good agreement is observed (maximum error of 16 %).
Figure 24. Comparison between experimental measurement and theoretical predictions of the virgin curve during pre-rolling.
40 60 80 100 120 1400.03
0.031
0.032
0.033
0.034
0.035Evolution of "a" as function of the normal load
Normal load W [N]
a [0m
- 1]
0 50 100
0
0.5
1
1.5
2
2.5
3
3.5Evolution of "h
0" as function of the normal load
Normal load W [N]
h0 [
N]
FIGURE 22. Experimentally measured pre-rolling hysteresis curve, with theoretical fit, of a ball rolling between two V-grooves.
26

Sustainable Construction and Design 2011
Copyright © 2011 by Laboratory Soete
6 THEORETICAL MODELLING AND EXPERIMENTAL CHARACTERISATION OF WEAR
Theoretical modelling of wear is a valuable aid for designing and optimizing tribological systems, in particular those involving unlubricated contacts. However, most of the existing models are empirical in nature, which limits their applicability and predictive power. This motivates us to extend the generic friction model, outlined in section 3, by elaborating it with energy-based, asperity-degradation/modification mechanisms, in the form of a local fatigue law: when the energy accumulation in an asperity, owing to repeated elastic-plastic deformation exceeds a certain threshold, the asperity breaks off. Simulation results, using a set of arbitrary model parameters, in unidirectional as well bidirectional sliding, show qualitative agreement with experimental observations (see further). Apart from the running-in phase, which the simulations show clearly, a linear trend between the wear volume and the energy dissipation is observed, as shown in Fig. 25, (ref. [14]).
Asperity height distribution before test (running in).
Wear mass in function of the energy dissipated in the contact.
Asperity height distribution after running in (end of test).
Figure 25. Typical results of the generic wear model simulations.
With the objective of experimentally correlating several wear-process parameters, accurately and continuously over the duration of a sliding test, we developed a novel rotational test rig with axes supported on aerostatic bearings [15]. It enables online, simultaneous measurement of normal load, friction force, angular position and normal displacement with high accuracy, see Fig. 26.
Figure 26. Test rig for accurate wear measurement.
Figure 27. Wear volume in function of the energy dissipated in the contact for nylon on steel (left) and steel, respectively Alumina on steel (right) .
27
Sustainable Construction and Design 2011
Copyright © 2011 by Laboratory Soete
A set of ball-on-disc experiments was then performed, with ball materials being nylon, steel and ceramic, on hard steel disc material. The performed experiments correlate three process variables and parameters: normal load, wear volume and dissipated energy. The basic trends observed show that the relationship between those three variables are quasi linear, but generally with nonzero intercepts (see Fig. 27), corresponding to energy thresholds; except that of wear of alumina on steel (right Figure) [15].
7 CONCLUSIONS
Friction is a complex, nonlinear phenomenon that depends not only on the contacting surfaces and their physical and topographical properties but also on the dynamics of the system comprising friction. Evolution of wear in the contact adds further to the complexity of friction systems. Modelling of friction is important in many fields of science and engineering. We have presented an overview of our research into the modelling and experimental validation of friction, traction and wear. It became hopefully clear from the presentation that modelling of the friction phenomenon, based on the generic contact mechanisms, can lead to results that are qualitatively in agreement with experimentally observed behaviour. In the case of rolling, even very good quantitative agreement is achieved. In order to develop those models further towards predictive models, which will be a very powerful engineering tool, questions regarding the determination and assignment of model parameters have to be dealt with. This is the subject of future work.
8 ACKNOWLEDGEMENTS
This research was partially supported by the Fund for Scientific Research - Flanders (F.W.O.) under Grant FWO4283. The scientific responsibility is assumed by its authors.
9 REFERENCES
[1] ArmstrongHélouvry B. Control of Machines with Friction. Norwell, MA: Kluwer, 1991. [2] Al-Bender F, Lampaert V, Swevers J. Modelling of dry sliding friction dynamics: from heuristic models
to physically motivated models and back. CHAOS, An Interdisciplinary Journal of Nonlinear Science. 2004, 14(2): 446-460.
[3] Swevers J., Al-Bender F, Ganseman C, Prajogo T. An integrated friction model structure with improved presliding behaviour for accurate friction compensation. IEEE Transactions on Automatic Control. 2000, 45(4): 675-686.
[4] Lampaert V, Al-Bender F, Swevers J. Experimental characterisation of dry friction at low velocities on a developed tribometer setup for macroscopic. Tribology Letters, 2004, 16(1): 95-105.
[5] Al-Bender F, Symens W, Swevers J, Van Brussel H. Theoretical analysis of the dynamic behavior of hysteresis elements in mechanical systems. International Journal of Non-linear Mechanics. 2004, 39: 1721-1735.
[6] Al-Bender F, Lampaert V, Swevers J. A novel generic model at asperity level for dry friction force dynamics. Tribology Letters. 2004, 16(1): 81-93.
[7] Al-Bender F, Lampaert V, Swevers J. The Generalized Maxwell-slip model: a novel model for friction simulation and compensation. IEEE Transactions on Automatic Control. 2005, 50(11): 1883-1887.
[8] De Moerlooze K, Al-Bender F, Van Brussel H, A Generalised Asperity-Based Friction Model Source: TRIBOLOGY LETTERS 40(1), 113-130, 2010.
[9] Al-Bender F, De Moerlooze K, On the relationship between normal load and friction force in pre-sliding frictional contacts, Part 1: Theoretical analysis, WEAR, 269(3-4), 174-182, 2010.
[10] De Moerlooze K, Al-Bender F, On the relationship between normal load and friction force in pre-sliding frictional contacts, Part 2: Experimental investigation, WEAR 269(3-4), 183-189, 2010.
[11] Al-Bender, F.; De Moerlooze, A Model of the Transient Behavior of Tractive Rolling Contacts, Advances in Tribology, 214894 (17 pp.), 2008.
[12] De Moerlooze, K.; Al-Bender, F., Experimental Investigation into the Tractive Prerolling Behavior of Balls in V-Grooved Tracks, Advances in Tribology, 561280 (10 pp.), 2008.
[13] De Moerlooze, F. Al-Bender, H. Van Brussel, Modeling of the dynamic behavior of systems with rolling elements, International Journal of Non-Linear Mechanics, Volume 46, Issue 1, January 2011, 222-233.
[14] Kris De Moerlooze, Farid Al-Bender, Hendrik Van Brussel, A novel energy-based generic wear model at the asperity level, paper submitted to Wear, 2010.
[15] Kris De Moerlooze, Farid Al-Bender, Hendrik Van Brussel, An experimental study of ball-on-flat wear on a newly developed rotational tribometer, paper submitted to Wear, 2010.
28