Characteristics of Crash Injuries Among Young, Middle-Aged, and

Characteristics of road traffic injuries and potential risk factors in Oman
Ahmed Al-Risi
A thesis submitted for the degree of Bachelor of Medical Science with Honours
at the University of Otago, Dunedin
New Zealand
January 2013

i | P a g e
Abstract
Background: Globally, road traffic injuries have increased by almost 46% in the twenty years prior to
2010. This makes road traffic crashes (RTC) the tenth leading cause of death in the world
and the leading cause of death of young people. Oman, a wealthy country where motorising
is increasing rapidly, has a very high road traffic mortality. In Oman, road traffic deaths and
injuries are the main external cause of morbidity in young adults and have a direct effect on
the economic and health resources of the country. Road traffic crash research has only
recently begun in Oman. The modifiable causes of this problem and most effective response
have not yet been well-explored.
Aims:
The main aims of the research described in this thesis were:
- To describe the distribution of road traffic crashes in Oman by time, person and
place using the data collected by the Royal Oman Police and examine their
assessment of reasons for crashes, from 1985-2010.
- To collect data in order to estimate the prevalence and distribution of known risk
factors in road traffic crashes in Oman, focusing specifically on Sohar.
Methods:
Two studies were conducted to achieve the aims of this thesis. Firstly, a retrospective case
series used the Royal Oman Police data from 1985-2010. This examined trends in the police
data on road traffic crashes across the whole time period and then summarised the most
recent available year of data (2010) in more detail.
Secondly, a prospective case series of injured drivers admitted to Sohar Hospital Emergency
Department was carried out. Between 20 February 2012 and 20 March 2012, consecutive
injured drivers admitted to Sohar Emergency Department were recruited to the study.
Questionnaire-based face-to-face interviews were held to collect data on

ii | P a g e
socio-demographics, circumstances of the crash, and known risk factors for road traffic
injuries, including risk behaviours at the time of the crash and usual behaviours.
All admitted injured drivers were recruited apart from the most seriously injured drivers
who were taken by ambulance to the capital city Muscat for further investigations, and
those who died from their injures.
Results: According to Royal Oman Police data (1985-2010), total deaths and injuries from RTCs have
increased by almost 300% in Oman since 1985. An element of speeding was reported for all
the crashes since 1992. The victims of road traffic crashes were mostly the young age group
(21-30 years). More drivers have been killed than any other road user group, constituting
43.8% of total road traffic deaths, and passengers have been the most injured, constituting
48.2% of total road traffic injuries.
In the Sohar study, 250 injured drivers, 75% males and 25% females, were interviewed with
a 100% response rate. Interviewed injured drivers were found to have spent long hours on
the roads and had driven for long distances. Overall, less than 5% of injured drivers were
over the age of 35 years. There was a marked difference in the age distribution of male and
female injured drivers. Among men almost half (49.5%) of the injured drivers were 18-25
years old and 45.7% were 25-35. Among women, 95% of injured drivers were 25-35 years
old. Generally, male drivers had more traffic violations than female drivers with 83% of
males reporting at least three traffic violations over the past five years, whereas almost half
of the females reported one or no, traffic violation over the same period. The highest
frequency of crashes occurred on Saturdays and Thursdays (18.8% and 17.6% respectively)
and the majority of the injured drivers were either familiar or very familiar with the roads on
which they crashed.
It was clear that the injured drivers in Sohar routinely ignored the traffic laws and reported
risky driving behaviours. For instance, less than 10% of injured male drivers and only 56% of
female drivers were wearing their seatbelts at the time of the crash. Also, a high proportion
of both male and female drivers were travelling at a speed of 100-140 km/hour at the time
of their crash (65.4% male and 58% female drivers). Moreover, 31.4% of injured male
drivers and 24% of injured female drivers were using their cell phones at the time of their

iii | P a g e
crash. When describing their usual driving behaviour, 52.8% of all interviewed drivers
reported that they never or almost never wear seatbelts while driving.
Conclusions: Overall, the incidence of road traffic crash injuries and deaths is high and increasing in
Oman with a high prevalence of known risk factors for road traffic injuries even where
protective legislation exists. Even though this case series cannot establish that these risk
factors cause road traffic injuries in this population, experience from other countries
suggests that appropriate legislation and increased enforcement could reduce road traffic
injuries in Oman.

iv | P a g e
Acknowledgements
I would like to thank my supervisor Professor Jennie Connor from the
Department of Preventive and Social Medicine for her invaluable support,
guidance, time and comments throughout the period of the thesis.
I would also like to thank my co-supervisor in Oman, associate Professor
Abdullah Al-Maniri for his help while collecting the data in Oman.
Sincere gratitude must also go to the staff at the Department of Preventive
and Social Medicine for welcoming me and helping me with the technical
issues.
I wish to thank all the people in Oman who made my project successful: the
Scholarships Committee at the Ministry of Higher Education and the Ministry
of Health Committee for approving my project; the research training centre
and all the staff of Sohar Hospital in Oman.
Lastly, I would like to thank my family and friends for their support while in
Oman.

v | P a g e
Table of contents
Abstract………………………………………………………………………………………….………..….i
Acknowledgements……………………………………………………………………………………iv
Table of contents………………………………………………………………………………………..v
List of tables………………………………………………………………………………………….…viii
List of figures……………………………………………………………..………………………………ix
List of abbreviations…………………………………………………………………………..………xi
1. Chapter One: Introduction and Literature Review
1.1. Introduction…………………………………………………………………………………………….………….1
1.2. Road traffic crash injuries as a global health problem…………………………….……..……1
1.3. Aims and methods of the literature review…………………………………………………………3
1.4. Road traffic crashes in the Eastern Mediterranean Region (EMR)……………….…..….4
1.5. Road traffic crashes in the Gulf Cooperation Council (GCC) countries………….………5
1.5.1. In the United Arab Emirates………………………………………………………………………..…6
1.5.2. In the Kingdom of Saudi Arabia…………………………………………………………….……….6
1.5.3. In Kuwait…………………………………………………………………………………………….…………7
1.5.4. In Qatar…………………………………………………………………………………………………………7
1.5.5. In Bahrain……………………………………………………………………………………………………..7
1.6. Overview of the Sultanate of Oman………………………………………….….………………..…..9
1.6.1. Health care in Oman……………………………………………………………………………………11
1.6.2. Emergency care in Oman…………………………………………………………………………….12
1.7. The descriptive epidemiology of road traffic crashes in Oman: a
preliminary analysis……………………………………………………………………………………..……13
1.8. Risk factors for road traffic crash injuries………………………………..………………………..18
1.8.1. Driving speed……………………………………………………………………………………….………20
1.8.2. Restraint non-use (seatbelts and child restraints)……………………………….……….21
1.8.3. Alcohol………………………………………………………………………………………………………..21
1.8.4. Fatigue………………………………………………………………………………………………………..22
1.9. Importance of this research…………………………………………………..…………………….……24

vi | P a g e
1.10. Context of this study………………………………………………………….………………………….….25
1.11. Traffic rules in Oman……………………………………………………………………………………..….27
2. Chapter Two: Aims and Methods
2.1. Aims……………………………………………………………………………………………………………..…..30
2.2. Part I: Retrospective data from national Royal Oman Police...………………………..…31
2.2.1. Study design and period………………………………………………………………………………31
2.2.2. Data sources………………………………………………………………………………….……..…....31
2.2.3. Analysis………………………………………………………………………………………….……….…..31
2.3. Part II: Prospective case series of injured drivers admitted
to Sohar Hospital Emergency Department…………………………………………………….….32
2.3.1. Place of study……………………………………………………………………………………..…...…32
2.3.2. Study design………………………………………………………………………….……………...…….32
2.3.3. Inclusion and exclusion criteria………………………………………………………..……..…..33
2.3.4. Case definition……………………………………………………………………….……….…….…….33
2.3.5. Data collection………………………………………………………………………..…………..………33
2.3.6. Data analysis…………………………………………………………………………....….……….…….34
2.3.7. Ethics…………………………………………………………………………………………………….…….34
3. Chapter Three: Results
3.1. Part I: Retrospective data from national Royal Oman Police………………………………35
3.1.1. Road traffic crashes 1985-2009……………………………………………………………………35
3.1.2. Road traffic crashes 2010…………………………………………………………………….………41
3.2. Part II: Prospective case series of injured drivers admitted
to Sohar Hospital Emergency Department….……………………………………………….……46
3.2.1. Study population..…………………………….………………..……………………………………..46
3.2.2. Circumstances of crashes…………………………….………………………………………….….49
3.2.3. Driver behaviours at time of crash……………….…………………………………………….54
3.2.4. Usual driving behaviour…..………………………………….………….….……………...………60
3.3. Summary of main findings………………………………………………………………….……….…….62

vii | P a g e
4. Chapter Four: Discussion
4.1. Main findings……………………………………………………………………..……………………………..64
4.2. Critique of methods……………………………………………………………………………....……..….67
4.3. Implications of findings……………………………………………………………………..…..…….……69
4.3.1. Reducing speed-related crashes………………………………………………..…..…………...69
4.3.2. Seatbelt interventions…………………………………………………………………..…….………72
4.3.3. Child restraints interventions …………………………………………………...…..…..……….74
4.3.4. Reducing alcohol-related crashes …………………………………………………….….…….…….76
4.4. Future research……………………………………………………………………………………………..….78
4.4.1. National Trauma Database………………………………………………………….……….……….....78
4.4.2. Case-control study on risk factors for injuries…………………………….…….....….….78
4.4.3. Work-related fatigue and sleepiness research……………………………….………….…78
4.4.4. Pre-hospitalisation trauma care research…………………………………….………………79
4.4.5. Conclusion…………………………………………………………………………………………….…….80 5. References …………………………………………………………………………..……………………………….….81 6. Appendix……………………………………………………………….…………………………………………..……...89
The Sohar study questionnaire…………………………………………………………………..…………….89
The ethical approval from the Ministry of Health, Oman…………………………….…….……100

viii | P a g e
List of tables
Table 1: The Profile of GCC countries……………………….………………………………….....5
Table 2: Road Traffic Crash Injuries and Mortality in GCC countries
(latest data available)…………………………………………………………………………8
Table 3: Overview of the Sultanate of Oman……………………………………………………9
Table 4: RTC mortality by age and sex (1995-2009)………………………………………..17
Table 5: Example of factors contributing to RTC using Haddon Matrix…………..19
Table 6: Speed limit violations……………………………………………………………….………29
Table 7: Mortality and injury rates 1985-2011(per 100,000 population)………..36
Table 8: Description of study population……………………………………………………….48
Table 9: Circumstances at the time of the crash………………………………………….…52
Table 10: Behaviours at the time of the crash
(Male distribution by age groups)…………...……………………………………55
Table 11: Behaviours at the time of the crash (Female distribution by age
groups)……………………………………………………………………………….…………..58
Table 12: Usual driving-related behaviours…………………………………………………….61

ix | P a g e
List of figures
Figure 1: Total population of Oman, by Governorate (%)……………………………….11
Figure 2: Number of vehicles registered between 2001-2011……….……………….14
Figure 3: The number and outcome of RTCs by age in 2011……………….………….15
Figure 4: Deaths and injuries due to RTCs by age in 2011…………………….…………16
Figure 5: Deaths and injuries due to RTCs by reason in 2011……………….…………18
Figure 6: Total RTC deaths in Oman, 1985-2009 (n)……………………………………….35
Figure 7: Mortality and injury rates (per 100,000 population) 1985-2011………37
Figure 8: Total RTC injuries in Oman, 1985-2009 (n)………………………………………38
Figure 9: Top three reasons for RTCs attributed by Royal Oman Police
1992-2009………………………………………………………….……………………………39
Figure 10: Total RTC injuries, by road user type in Oman, 1985-2009 (n) ………40
Figure 11: Deaths and injuries among drivers in 2010……………………………………41
Figure 12: Deaths and injuries among passengers in 2010……………………………..42
Figure 13: Total deaths and injuries by road user type in Omanin 2010…..…….43
Figure 14: Total RTC injuries by month in Oman, in 2010……………………………….44

x | P a g e
Figure 15: Total RTC deaths, by reasons according to Royal Oman Police
in 2010………………………………………………………………………….………………45
Figure 16: Total RTC injuries, by reasons according to Royal Oman Police, in
2010………………………………………………………………………………………………………………45
Figure 17: The pattern of crashes over a week, by gender…………………….……….49
Figure 18: The pattern of crashes over a week, by reason of trip…………………..50
Figure 19: The pattern of crashes over a week, by number of passengers in
vehicle (n) …………………………………..…………….…………………………………51

xi | P a g e
List of abbreviations
RTC Road Traffic Crashes
WHO World Health Organization
GNP Gross National Product
EMR Eastern Mediterranean Region
GCC Gulf Corporation Council
UAE United Arab Emirates
GDT General Directorate of Traffic
EMS Emergency Medicine Services
ROP Royal Oman Police
MOH Ministry of Health
ED Emergency Department
USA United States of America
VKT Vehicle Kilometres Travelled
UK United Kingdom
BAC Blood Alcohol Concentration

1 | P a g e
Chapter One: Introduction and literature review
1.1. Introduction
The extensive growth in the global economy in the last century has changed many aspects of
people’s lives including their use of various means of transportation. Transportation has
become a significant part of the physical and economic development of societies all over the
world. The relationship between the expansion in road networks and economic
development is well-established [1]. Continuous expansion in road network construction has
accompanied a rapid increase in the population, with a corresponding increase in vehicle
numbers [2]. The growth in motor vehicles that follows economic growth usually results in
an increase in RTC and consequent injuries and deaths [3]. As a consequence, road traffic
injuries have become a major public health problem globally with a large increase in the
number of casualties and fatalities [2].
1.2. Road traffic crash injuries as a global health problem:
The all-cause mortality rates show a reduction with countries’ development. However, RTC
death rates are an exception with higher death rates expected along with economic
development [3]. Globally, road traffic crashes are a major cause of death and disability.
Annually, about 1.2 million people are being killed in RTCs. The WHO estimated the global
mortality rate due to RTCs to be 19 per 100,000 population in the year 2002 and 19.5 per
100,000 population in 2010 [2, 4]. Moreover, for each fatality resulting from a road traffic
crash there are numbers of serious injuries, which may lead to permanent disability. The
Global Burden of Disease project in 2000 estimated that around 20 to 50 million people are
being injured or disabled each year [5]. Furthermore, if no interventions were implemented
to decrease road traffic crashes, the fatalities and injuries due to RTCs are expected to
increase by about 65% by 2020 compared to 2000 [5]. According to WHO data, road traffic
crashes caused about 25% of all deaths from injury worldwide in 2004 [6]. RTCs were ranked
as the eleventh leading cause of deaths and the ninth leading cause of disability-adjusted life

2 | P a g e
years lost in 2002. By 2020, RTCs are expected to rise to become the sixth leading cause of
death internationally. Most of the increase is in low-income and middle-income countries,
where RTC-related deaths are expected to increase by over 80% on average. [7, 5, 2].
A disproportionate number of RTC-related deaths and disabilities are occurring in
developing countries [7]. The low and middle-income countries account for approximately
85% of all global annual road traffic crash fatalities and 90% of the disability-adjusted life
years lost due to road traffic crashes [2]. According to Vinand, the fatality rate for children
aged 0-14 in low income countries (per 100,000 population was six times higher than that of
children of the same age in high income countries in 1998 [7]. The main victims of road
traffic crashes are young adults. More than 50% of all deaths due to RTCs are among young
adults within the age range of 15-44 years [8]. In addition, according to the Global Burden of
Disease project published in 2012, RTCs are now ranked as the eighth leading cause of death
globally [9, 10]. The year 2010 witnessed one million more deaths from injuries than 1990;
this 24% rise was attributed to the increase in RTCs by almost 420,600 crashes claiming the
lives of 1.3 million people [9, 10].
Road traffic crashes have a substantial impact on the social and economic welfare of
nations. In 2002, RTC-related deaths and injuries cost the global community about US$518
billion [11]. It is estimated that the costs of road traffic crashes account, roughly, for 1% of
gross national product (GNP) in low-income countries, 1.5% in middle-income countries and
2% in high-income countries [12]. Such amounts are overwhelming for the economies of
low-income and middle income countries and place a major financial burden on their
developmental assets [12].
Road traffic crashes are one of the leading causes for sustaining short and long term
psychiatric consequences such as post traumatic stress disorder, anxiety disorders and
depression [13]. Findings have shown that adolescents and children who survived road
traffic crashes continue to suffer from the aforementioned behavioural problems [14, 15].
These problems have been shown to influence certain aspects of victims’ quality of life.
Individuals’ employment, physical health and social well-being are among the most affected
areas in RTC survivors [16].

3 | P a g e
1.3. Aims and methods of the literature review
Aims
- Find and summarise the existing literature on road traffic crashes in Oman and surrounding region. - Describe the setting for RTC research in Oman.
- Summarise the most recent RTC data available.
- Describe important behavioural risk factors for RTC, from international literature.
Methods
A literature review has to be approached systematically in order to avoid missing essential
papers and creating information biases. A systematic approach also helps to avoid invalid
or/and insignificant information. For my literature review on the characteristics of road
traffic crashes and potential risk factors I started by reading the most recent review articles
to inform the choice of keywords.
References: references from review articles were used to identify main keywords and learn
more about this topic.
Keywords: the initial keywords list included: “traffic accidents”, “traffic crashes”, “road
traffic accidents”, “epidemiology”, “characteristics”, “road traffic injuries”, “public health”,
“developing countries”, “GCC countries”, “Eastern Mediterranean Region”, “mortality”,
“fatality”, “morbidity”, “disability”, “economy”, “seatbelts”, “cell phones”, “alcohol and
driving”, “child safety”, “risk factors”, “fatigue”, “sleep”, “injury severity”, “motorways”.
Sources: searching was performed using the Medline database (Ovid), and Google Scholar
search engine.

4 | P a g e
1.4. Road traffic crashes in the Eastern Mediterranean Region (EMR)
The Eastern Mediterranean Region (EMR) is composed of 22 low-income and middle-income
countries. It has a developing region demographic profile (with a GNP of less than US$ 1700
per capita) and covers 546 million people constituting 8.3% of the world's population [17].
In general, injury prevention has not been a high priority within the region. One of the major
challenges to the region is the constantly increasing incidence of road traffic crashes [18]. In
2004, RTCs were the sixth leading cause of death in the region, resulting in 146,000 deaths
and 2.8 million injuries. This is higher than the number of deaths caused by diseases such as
tuberculosis, malaria and HIV [17].
Wahid stated that the Eastern Mediterranean Region has one of the world’s highest traffic
fatality rates, mostly due to a lack of adequate pre-hospital medical emergency systems
[19]. He also reported that the region has the world’s highest fatality rate among those aged
15-29 years with a calculated rate of 34.2 deaths per 100,000 population This is costing the
region an estimated US $7.4 billion annually. Records show that around 40 million people in
the EMR with road traffic-related disabilities do not have access to acceptable rehabilitation
services and social integration programs [19].
Many countries in the Eastern Mediterranean region lack simple measures to reduce road
traffic injuries. Of the 22 countries in the region, only 40% set a speed limit on the roads in
urban areas [17]. A lack of government policies (or even public campaigns) that promote
cycling, walking and investing in public transport was observed in more than 90% of the
countries in the region. Drink driving is a potent contributor to RTCs, yet no measurements
to detect alcohol level are implemented in the majority of the countries. In most of the
countries, there are no laws enforcing the use of child restraints, making children the most
vulnerable vehicle occupants in an accident. There are opportunities for promotion of
walking and cycling, establishing regulations for road safety and enforcing them, measuring
alcohol levels on roads and many other health promotions that have been used in other
parts of the world to reduce road traffic injuries in the region [17].

5 | P a g e
1.5. Road traffic crashes in the Gulf Cooperation Council (GCC) countries
The GCC countries, part of the Eastern Mediterranean Region, are located in the Arabian
Peninsula, in the south-western region of the Asian continent. They consist of 6 countries
namely The Kingdom of Saudi Arabia, The Sultanate of Oman, United Arab Emirates,
Kuwait, Qatar and Bahrain. Jordan and Morocco have been invited to join the Council this
year. Oil discovery around the middle of the last century has significantly reformed many
aspects of life in the Gulf Countries. There was an explosion in immigration with a parallel
surge in the number of registered vehicles [20].
Road traffic crashes are recognized as a major cause of mortality and morbidity in the GCC
countries and many developing countries. The large number of traffic crashes has caused
these countries a substantial wastage of life and national resources [21]. The extent of the
problem will be discussed briefly for each country.
Table 1: The Profile of the GCC countries:
Note: Data obtained from World Bank (2011 data) [22].
Country Area
(km2)
Percentage of total GCC area
(%)
Population
The Kingdom of Saudi
Arabia
2,000,000 82.54 27,448,086
The Sultanate of Oman 309,500 12.77 2,782,435
United Arab Emirates 83,600 3.45 7,511,690
Kuwait 17,818 0.74 2,736,732
Qatar 11,427 0.47 1,758,793
Bahrain 707 0.03 1,261,835
Total 2,423,052 100 43,499,571

6 | P a g e
1.5.1. In United Arab Emirates
Ever since its independence in 1971, the UAE has experienced a dramatic growth in its
national economy, specifically in terms of per capita income. In addition, a substantial
amount of money was invested in road construction programs which led to the
development of sophisticated road networks linking the corners of the country. These
particular developments have attracted many individuals to reside and to seek jobs in
different cities of the UAE which resulted in it having the second largest population within
the GCC countries, after Saudi Arabia, by the year 2010 [21]. This rapid economic growth
along with the considerable increase in the number of vehicles registered has led to a
parallel increase in road traffic crashes and resulting casualties, causing it to be a serious
public health problem for the country. Road traffic injuries are second major cause of death
in UAE [23]. In 2005, the road death toll’s average was one road accident death every 15
hours, amongst the highest in the world [24, 25]. The Ministry of Interior’s traffic
department reported 6,700 crashes, 7,808 injuries and 720 deaths in 2011 [26].
1.5.2. In The Kingdom Of Saudi Arabia
Road traffic crashes have become a major health hazard in Saudi Arabia. Tarmac road
networks increased from 239 km in 1952 to more than 40,000 km at the beginning of the
third millennium [27]. There was also an increase in the number of cars from 144,000 cars in
the early seventies to almost 2.5 million cars by the end of the second millennium. As a
result, there was a tragic increase in the number of road traffic crashes and, subsequently
the number of deaths and injuries due to these crashes. According to the Traffic General
Directorate of Saudi Arabia, on the average, more than 4,100 people are being killed and
28,000 are being injured as a consequence of nearly 29,000 traffic crashes annually [27]. For example, in 2005 alone, the traffic data showed that the number of RTCs was 283,684
which resulted in 5,883 deaths; half of these victims were under 30 of age. Al-Nammi
estimated the annual cost of RTC-related casualties to be, approximately, USD 5.6 billion, a
loss of 2.2%-9% of the national income. It has been estimated that in Saudi Arabia, one
person is killed and four are injured every hour due to RTCs [28].

7 | P a g e
1.5.3. In Kuwait
Kuwait is a small country with a total area of 17,818 km2 and a total population of 2.7
million. A noticeable surge in the level of motorization occurred between 2000 and 2009
and that was represented by the increase in the number of registered vehicles from 801,555
in 2000 to 1,414,925 in 2009 (a 76.5% increase). This rather abrupt change has contributed
to an increase in road traffic crashes. From 2000-2009, there was a 121.3% increase in the
number of road traffic crashes jumping from 27,696 in 2000 to 61,298 in 2009. Furthermore,
road traffic crashes accounted for 3,891 deaths and 11,591 injuries during the same period.
The mean annual RTC-related mortality rate was 36 per 100,000 registered vehicles with a
29% total decrease from 2000 to 2009 [29].
1.5.4. In Qatar
In Qatar, injuries are the leading cause of mortality and morbidity, particularly in the
productive age group and in children. In 2000, the road traffic crash fatality rate was 14.7
per 100,000 population compared to a fatality rate of 5.7 per 100,000 population in the UK
during the same year. 96.5 % of the fatalities were males [30]. According to the Ministry of Interior’s Traffic Department, in 2009, there were 688,029
vehicles on the roads. 5,079 road traffic crashes occurred resulting in 1,914 injured and 224
deaths In 2010, the number of vehicles increased by 9.7% and the number of traffic
violations increased by 32.7% of which 40.2% were caused by running red signals. Despite
the increase in traffic violations and vehicles registered, there was an 18% decrease in the
number of road traffic crashes in 2010 [31].
1.5.5. In Bahrain
Bahrain, with an area of 707 km2, is made up of a number of islands in Arabian Gulf off the
coast of Saudi Arabia. The population is just over one million making the population density
one of the highest in the world (852 persons per square kilometre in 1995). The highway
network is quite modern covering most of the populated parts of the country. The roads
cover approximately 3,459 km of which 428 km are multilane highway [32].

8 | P a g e
According to the General Directorate of Traffic (GDT), the number of registered vehicles was
454,191 in 2010. The GDT’s report has shown that the number of road traffic crashes has
declined from 522 in 2008 to 484 in 2010. It has also reported a decrease in the fatalities
caused by RTCs from 84 in 2008 to 75 in 2010. Despite this decline in the number of RTCs
and the resulting casualties and fatalities, the figures are still alarming and significantly
affect the public in terms of death, disability and cost [33].
Table 2: Annual incidence of RTC injuries and deaths in Gulf countries, per 100,000
population (Calculated from most recent available data)
The incidence rate was calculated from published estimates of injury numbers and
population in the year indicated. There were no data available by age or sex. It is obvious
that Oman has the highest rates of mortality and injury compared with the neighbouring
Gulf countries.
Country Annual Incidence of RTC Injuries
RTC Mortality Rate Reference
The Sultanate of Oman 401 (2011) 37 (2011) -
The Kingdom of Saudi Arabia
146 (2004) 28.6 (2004) [19]
Qatar 274 (2010) 13.4 (2010) [34]
UAE 99 (2011) 22 (2007) [26, 35]
Bahrain 9.0 (2000) 6 (2010) [2, 31]
Kuwait 19.4 (2009) 11.8 (2009) [36]

9 | P a g e
1.6. Overview of the Sultanate of Oman Table 3: Overview of the Sultanate of Oman:
Information Statistics
Total Area of the Sultanate of Oman 309,500 km2
Total length of Roads 59363 km
Note: Data obtained from Ministry of Tourism, Oman [37]. The Sultanate of Oman is located on the south-eastern corner of the Arabian Peninsula
occupying an area of 309,500 km2, the second largest of the GCC countries after Saudi
Arabia. It shares borders with the kingdom of Saudi Arabia to the west, the Omani Gulf and
Arabian Sea to the east, the United Arab Emirates to the north and the republic of Yemen to

10 | P a g e
the south [37]. The country is divided into ten governorates as follows (numbered from 1-11
according to the map above):
1. Muscat Governorate which contains the capital city Muscat.
2. Musandam Governorate
3. Al Buraimi Governorate
4. Al Dakhilya Governorate
5. Al Batinah north Governorate which contains the prospective study city Sohar.
6. Al Batinah south Governorate
7. Al Sharqiyah north Governorate
8. Al Sharqiya south Governorate
9. Al Dhahira Governorate
10. Al Wosta Governorate
11. Dhofar Governorate
Note: Data obtained from Ministry of Tourism, Oman [37].
According to the latest census which was carried out by the National Center for Statistics
and Information, in 2010 Oman had a population of 2.77 million people, a density of 9.0
persons per square kilometre. However, 816,143 residents, nearly 30% of the population
were expatriates. Males exceeded females at a ratio of 138 males to every 100 females,
compared with 128 males to every 100 females in 2004. Figure 1 below describes the distribution of the population within the different
governorates in Oman. It can be seen that most of the population resides in the
governorates of Muscat and Al Batinah. This is markedly different from the 2003
governorates percentages of the total population where most people resided in Al Batinah
(31.7%) followed by Muscat (21.4%) [38].

11 | P a g e
28.00%
1.10%2.60%
11.80%
27.90%
12.60%
5.50%
1.50%
9.00%
0.00%
5.00%
10.00%
15.00%
20.00%
25.00%
30.00%
Total Population of Oman, by governorate (%)
Figure 1: Total Population of Oman by Governorate:
Note: Data obtained from 2010 National Census, National Centre for Statistics. Oman has been ruled by Sultan Qaboos bin Said Al Said since 23 July 1970; His Majesty also
heads the Defence Council, the Financial Affairs and Energy Resources Council and the
Supreme Judicial Council [39].
1.6.1. Health care in Oman
There has been a major change in health care provision in Oman in the past four decades.
Prior to the establishment of the current government in 1970, the main health care
providers were the British Embassy Hospital and a few missionary hospitals in Muscat with
no existing national health care system [40]. Providing free health care which is available to
the whole population was the main objective for the new government that came into power
in 1970 under his Majesty Sultan Qaboos (Sultan of Oman). This government made major
investments in improving the health care system which resulted in Oman being the first in
the world in regard to the WHO Health System Attainment and Performance Estimates
[40].The Ministry of Health provides free health care to all Omani citizens through multiple

12 | P a g e
institutions situated throughout the country. These health institutions are divided into
extended (primary) health care centres which are situated in villages and small local
communities, secondary care hospitals which are located in cities and, finally, tertiary care
hospitals mainly in the capital Muscat, but there are a few in major cities within each region
(e.g. Sohar). In addition, alongside the Ministry of Health, many government organisations
and private institutions provide medical care to their employees.
1.6.2. Emergency care in Oman
There is a relatively new system of emergency care which follows the Anglo-American
system of Emergency Medicine Services (EMS). It is only a land based system and does not
include aeromedical services [40]. During 2012, a plan was set in place by the Royal Oman
Police for the EMS services to cover the whole country and to incorporate aeromedical
services. The EMS currently does not cover all cities and responds mainly to trauma cases
with limited coverage of other emergency cases. Under a joint provision from the ROP and
the Ministry of Health committee for the development of a modern EMS system, It officially
started to provide its services in April 2004, covering approximately 70% of the population
with 23 permanent ambulance units. Over a period of four years, the service attended to
5,501 cases of which 83% were trauma cases and the rest were medical emergencies (17%)
[40].

13 | P a g e
1.7. The descriptive epidemiology of road traffic crashes in Oman: a preliminary analysis: This section is drawn from the traffic statistics report (1971-2009). This was also combined
with the online data published by the General Directorate of Traffic in Oman for the
following years till 2011. These are the only available sources that collect descriptive data
regarding road traffic crashes, injuries and deaths in the country. It summarises the
information available on the history of motorization in Oman. It then describes the statistics
related to RTCs in Oman up until 2011.
The country’s economic, social and international status was substantially improved after
1970. The government started using the main revenue (oil and natural gas) for
development, with the first development plan targeting basic needs such as education,
health, transportation and telecommunication. As part of these development plans, the government has invested in the infrastructure of
the country including building paved roads and highways. From only 3 km of paved roads in
the year 1970, Oman now has more than 30,460 km of paved roads across the entire
country [41]. This transformation in road networks, infrastructure and economy has led to
an increase in motorization.

14 | P a g e
Note: Data obtained from the General Directorate of Traffic Department, Oman.
Figure 2 shows the evolution in the number of vehicles registered in the Sultanate of Oman
over the past three years. Records indicate that the number of vehicles in 1970 amounted
to 1,016 vehicle excluding military or police vehicles [41]. The number of vehicles registered
after 40 years, was approximately 804,233 according to the records of the General
Department of Traffic in 2010. This number showed a 10% increase in 2011 making the total
number of registered vehicles rise to 881,360 [41].
755937
804233
881360
680000
700000
720000
740000
760000
780000
800000
820000
840000
860000
880000
900000
2009 2010 2011
Figure 2 : Number of Vehicles Registered Between 2009-2011
Number ofVehiclesRegistered

15 | P a g e
499 580 578 637 689 681 798 951 953 820 1056
9625
7907
6735 6636 6658
7548
8531
10558
978310066
11437
0
2000
4000
6000
8000
10000
12000
14000
2001 2002 2003 2004 2005 2006 2007 2008 2009 2010 2011
Total of TrafficAccidentsDeaths
Injuries
Figure 3: The Number and Outcome of RTCs 2001-2011
Note: Data obtained from the Directorate of Traffic Department, Oman. Road traffic crashes are a major community health threat to Oman have attracted political
and public attention. Injuries from RTCs have become a burden on the health sector in
Oman as it is considered the main external cause of morbidity especially among adults.
[41]. In 2011, more than 7,700 RTCs were reported. There were 1,056 deaths and around
11,000 injuries [41]. Road traffic mortality in Oman was 28 per 100,000 population [41]
which is far higher than the global average of 19 per 100,000 [41]. Despite the fact that the
overall number of RTCs has declined since 2001, the resulting casualties and fatalities have
continued to increase as can be seen from the number of injuries and deaths. Figure 3
shows an increase in RTC deaths and injuries since 2011. Official figures for ‘Total Traffic
Accidents’ show a contradictory flat or decreasing trend over this same period. There are a
number of possible explanations for this, including increasing severity of crashes, resulting
in more severe injuries. However, it is more likely that this is due to changes in reporting of

16 | P a g e
0
1000
2000
3000
4000
5000
6000
0-6 7-15 16-25 26-50 51-70 over 71
Deaths
Injuries
Figure 4: Deaths and Injuries due to RTCs by Age in 2011
traffic crashes, either a reduction in reporting by the public or a service delivery effect from
change in the practices of the ROP. No explanation was uncovered.
Note: Data obtained from the Directorate of Traffic Department, Oman.
The main victims of road traffic crashes in Oman are males and they account for
approximately 84% of all road deaths. According to ROP 2009 statistics, males represent
about 75% of all non-fatal injuries due to RTCs. The distribution of injuries and deaths by
age shows that young and middle aged adults are the main groups affected by road traffic
injuries in Oman. Approximately 13% of fatalities and 9.6% of injuries are accounted for by children under 15
years of age. Adults between the ages of 26 and 50 years account for 46.5% and 49.6% of
fatalities and injuries respectively [41].

17 | P a g e
Table 4: RTC mortality by age and sex (1995-2009):
Table source: [42]
The above table demonstrates the death rate per 100,000 by age and sex from road traffic
crashes in Oman, 1995-2009. Rates are much higher among men than women and
consistently high among young men.
Information on contributing factors for RTCs is collected by the police at the time of the
crash and the main reason for the crash is usually a subjective assessment by the police
officer at the crash scene. Speeding and improper acts1 were the main contributors to RTCs in Oman according to ROP
2011 statistics. They accounted for 51.6% and 22.6% of all reasons respectively. The total
1 There is no official definition of this term however I was told by a police officer that it is usually when a driver mistakenly jumps in front of another vehicle and causes the crash

18 | P a g e
number of crashes caused by speeding was 3,744 crashes, which resulted in 499 deaths and
4,074 injuries. Lack of control resulted in 121 deaths and 2,925 injuries. Other reported
reasons for RTCs include negligence (8.5%), fatigue (0.2%), drink-driving (2.4%), overtaking
(5.2), weather (1.8%), sudden stop (1.2%), unsafe distance (3.3%), vehicles (2.5%) and road
(0.8%) defects [41].
Note: Data obtained from the Directorate of Traffic Department, Oman.
1.8. Risk factors for road traffic crash injuries
A detailed review of the extensive literature on risk factors for RTCs is beyond the scope of
this thesis. This section summarises findings from the published literature directly relevant
to this research.
Road traffic crashes result from a combination of different factors. The understanding of
factors that contribute to RTCs and their consequences could be facilitated by using the
Haddon matrix model. It is one of the most frequently used paradigms in injury
0
1000
2000
3000
4000
5000
6000
Injuries
Deaths
Accidents
Figure 5: Deaths and Injuries Due to RTCs by Reason In 2011

19 | P a g e
prevention. It defines the epidemiological triad of humans, vehicles and environment
which interact during the three phases of the time sequence of a crash event i.e. pre-
crash, crash and post-crash [11,2].
Table 5: Example of factors contributing to RTC using Haddon Matrix:
Note: information obtained from The World Report on Road Traffic Injury Prevention. Road Safety Training Manual. The Haddon matrix framework aids in understanding the behavioural, road-related and
vehicle-related factors that may have an impact on the number and severity of RTCs [11].
Table 5 illustrates some examples of factors that may lead to an RTC categorised by the
Haddon matrix.
Road traffic crashes result from the interaction of a variety of factors, some of which some
may not appear to be directly related. However, there is no doubt that a major contribution
is made by human factors.
Phase
Factors
Human Vehicles and
Equipment Environment
Pre-
crash Crash prevention
Information
Attitudes
Impairment
Police
Enforcement
Roadworthiness
Lighting
Braking
Handling
Speed Management
Road design
Road layout
Speed Limits
Pedestrian
Facilities
Crash Injury prevention
during the crash
Use of restraints
Impairment
Occupant restraints
Other safety devices
Crash-protective
design
Forgiving
roadside
Post-
crash Life sustaining First-aid skill Ease of access Rescue facilities
Access to
medics Fire risk Congestion

20 | P a g e
According to the WHO Road Safety Manual, the top three risk factors for crashes were as
follows: inappropriate or excessive speed, presence of alcohol or medicinal/recreational
drugs and fatigue. Restraint use is an important determinant of injury risk and severity when
a crash does occur, therefore, a risk factor for road traffic injury. Each risk factor will be
further explored from published literature.
1.8.1. Driving speed
Excessive speed is one of the major road safety problems in many countries. It influences
both crash risk and crash consequence. Studies from many different countries have shown
the role of speed in road crashes. It has been shown that up to third of all crashes involve an
element of excessive speed [43]. In addition, it has been suggested that an increase of 1
km/h on average traffic speed may result in a 3% increase in the incidence of an injury and
an increase of 4–5% of death [44]. This relationship between speed and involvement in
RTCs has been tested by many studies. It is a straightforward relationship; the faster the
vehicle is travelling, the greater the kinetic energy absorbed in the collision by both the
vehicle and its occupants. In order to promote road safety and regulate traffic speed, speed limits have been set and
reinforced by traffic authorities all over the world [45, 46]. It has been reported that a
reduction of 1 km/hour in driving speed will reduce the toll of road traffic crashes by 2-3%
[43]. Factors influencing speed, such as setting and then lowering speed limits, the level of
police enforcement, the penalties for speeding and the speed choice of other drivers have
been studied by many researchers [43]. Ryeng found that those factors are variably
significant determinants in an individual’s speed reduction. He found that the most
influential determinant of speeding is the speed choice of other drivers, suggesting that
social pressure is a significant factor in the individual decision of speeding. He also found
that a great reduction in speed follows an increase in police enforcement and police activity
around the targeted roads while only a slight reduction in speed followed stricter sanctions
[47].

21 | P a g e
1.8.2. Restraints non-use (seatbelts and child restraints)
Seatbelts are one of the most important road safety interventions which have made a major
contribution in the reduction of RTC injuries and deaths worldwide [48]. Seatbelts function
by restraining the vehicle occupant from hitting other objects or being thrown outside the
car. Therefore, they help in reducing the severity of the injuries acquired by vehicle
occupants involved in RTCs [48]. According to the WHO, unrestrained drivers and front seat
occupants involved in a traffic collision most frequently suffer from injuries to the head
followed by chest and abdomen. In addition, unrestrained passengers at the time of the
crash constitute the majority of road traffic fatalities globally. Disability and mortality
caused by failure to use seatbelts present a huge burden on governments’ health resources
and economies. Therefore, wearing a seatbelt is one of the most important measures that could be taken by
a vehicle occupant in order to prevent injury and/or death from a traffic crash. Moreover, despite the proven efficiency of child safety seats in preventing child injuries and
deaths, RTCs are still one of the leading causes of child mortality around the world and the
leading cause of child mortality in the USA [49]. Children travelling without restraints are
more common in developing countries than in the developed world. For example, in the
USA, it was found that only 2% to 17% of 0-12-year-old passengers did not use any restraint.
This issue is considerably worse for developing countries, specifically the GCC countries, as
it was found that almost 99% of all child passengers were travelling unrestrained in the UAE [50].
1.8.3. Alcohol Alcohol consumption by drivers is one of the major contributors to the burden of car crash
injuries on public health resources in many countries. It is responsible for approximately one
third of all RTCs’ deaths [51]. In a case-control study carried out in Auckland, New Zealand, a
strong association was found between consuming alcohol in the six hours preceding the
crash and the outcome of having a serious injury crash. It was also found that drivers with a
blood alcohol level more than 50 mg/mL were at 40 times the risk of being involved in a
serious injury crash [52]. Also, a recent meta-analysis clearly states that the risk of an injury
crash increases exponentially, even with low levels of alcohol consumption [53]. Legal limits
for alcohol levels in blood have been set globally, especially in Europe and the USA, and

22 | P a g e
have been reinforced by the police and legal authorities [52]. Those limits vary from one
country to another, from as low as 20 mg/100 mL in Sweden reaching as high as 100 mg/mL
in the United States (current limit in New Zealand is 80 mg/100 mL) [52]. Reports indicate
that alcohol intoxicated drivers are more likely to be involved in RTCs and more likely to
bear fatal injuries as an outcome [51].
Despite the contribution of alcohol, and other substance abuse in RTCs globally, information
and research in this area are limited due to the religious, cultural and sometimes legal
restrictions in the GCC countries [54]. Participants in this study were not questioned about
drinking alcohol while driving. Drinking alcohol is culturally and religiously prohibited, in
addition to being legally prohibited when driving. As well as fearing legal consequences if
disclosing drink-driving, we considered that asking about alcohol would make the
participants feel intimidated and judged, consequently reducing the chance that they would
complete the survey. While the ROP do determine whether alcohol has been involved in
RTCs, the prevalence is extremely low (see later, Figures 14 and 15).
1.8.4. Fatigue
Fatigue decreases alertness, concentration and reaction time which are all critical elements
in avoiding RTCs [55]. According to the European Transport Safety Council, driver fatigue is
responsible for 20% of commercial road traffic crashes in the member states of the council2 [56], and a systematic review of studies conducted in high income countries found driver
sleepiness to be a major contributor to car crashes in the general population (also approx
20%) [57].
Driver sleepiness can be due to sleep disorders (such as obstructive sleep apnea) or to drug
and/or alcohol use, but is mostly commonly due to “lifestyle” factors such as acute or
chronic inadequate sleep, and to driving at times of the day when alertness is impaired by
circadian rhythm (i.e. early morning and mid-afternoon). Long work hours and shift work
can also contribute to inadequate sleep [58].
Another important risk factor is driver inattention which includes being distracted by
outside persons, objects or events. These distractions may also include using a mobile 2 Many European countries and international Road Safety Associations

23 | P a g e
phone, adjusting radio, cassette or CD, a moving object in vehicle, eating or drinking and
smoking cigarettes [59]. It has been reported that approximately 25% of all RTCs in the
United States involved drivers’ inattention [60].

24 | P a g e
1.9. Importance of this research
In order to develop effective intervention programs for road safety, one first needs to
describe the problem and the potentially effective interventions on a population level. This
research is a first step in describing prevalence of known risk factors contributing to the high
documented road toll, and considering which interventions used elsewhere in the world
might be high priority for Oman.
Carrying out both descriptive and analytical epidemiological studies in the field of RTC is of
national interest. Design of effective interventions requires epidemiological and social
diagnosis of the problem. The present thesis represents an attempt to describe the
epidemiology of RTC in Oman with a focus on the Northern Region of Batinah, specifically,
Sohar. The evaluation of road traffic crash trends and characteristics in Oman has many
worthwhile and anticipated outcomes which include:
1. The study may raise awareness among individuals, community and decision makers
about RTCs.
2. Results from this study will be useful in planning future prevention programs to
reduce RTCs.
3. It may also help in the understanding of potential risk factors affecting drivers which
will, eventually, help in identifying populations at high risk to be targeted by
prevention programs.
4. The study may also raise new empirical questions that, in turn, would be the basis
for further investigation.

25 | P a g e
1.10. Context of this study
There are a number of facts which may help the reader to understand the context of this
study. Firstly, the organisation of the week in Oman is different from that in New Zealand
and other western countries. The Islamic religion presents Friday as a public worshiping day;
therefore, in countries where Islam is the predominant religion, the work week either starts
on Saturday and runs till Wednesday (as in Oman) or starts on Sunday and runs till Thursday
(as in United Arab Emirates) [61].
There are a few general requirements to get a new driving licence in Oman. Firstly, an
applicant must be 18 years old to get a light vehicle driving license and 21 years old to get a
heavy vehicle driving license. A vehicle must be insured then registered by its owner to the
closest Royal Omani Police Station [62]. In order to get a driver’s license in Oman, an
individual has to pass four tests conducted by the ROP. The tests are as follows:
Test one: Traffic signals:
This is usually conducted jointly with an eye vision test. An applicant will be required to
correctly identify a number of traffic signs.
Test two: Drum test:
After passing the eye vision and the traffic sign tests, practical driving tests include checking
the applicant’s ability to reverse between two rows of drums without touching any of them.
The applicant is usually alone in the vehicle for the test, with the instructor and the police
officer observing from a distance. The applicant will automatically fail if they change gear or
go forward once the test has started, but they are allowed to apply brakes during the test.
Test three: Slope test:
The slope test involves driving up a slope while observed by a police officer. There will be a
traffic light signal in the middle of the slope which will alternate between red and green.
The applicant is instructed to move when the light is green and stand still without moving
backwards when the light is red. The applicants will automatically fail if they start without
the permission of the police officer and if their vehicles move backwards or forwards on the
slope when the light is red.

26 | P a g e
Test four: Road test:
In this test, the applicants must drive in traffic accompanied by a police officer. The test is
targeting the applicants’ behaviours in specific circumstances such as: changing lanes, taking
right/left turns, stopping at intersections, taking roundabouts and driving in regular traffic
and sometimes motorways [63].

27 | P a g e
1.11. Traffic rules in Oman
The traffic code in Oman was first developed in 1936. This was followed by the safety belt
laws in 1990 and the mobile phone laws in 2000. In 2004, radars were fixed around the
country roads and the first Road Safety College was founded. The first Ambulance EMS
Service unit in Oman also started in 2004 [19]. The first governmental survey regarding the
burden of road traffic crashes in Oman was launched in 1993 by the National Programme
for Prevention and Control of Road Traffic Accidents. This survey found that there is a need
for an urgent focus shift from treatment policies to prevention policies on road safety [19].
Listed below are articles related to the studied risk factors in this thesis as issued by the
Royal Decree 28/93 and published by the Royal Oman Police, Legal Affairs Department [63].
Article 35:
"It shall be prohibited to drive a vehicle on the road without care or drive it at a high speed
or under the influence of alcohol or drugs or in a manner which form a risk or expose the
life of others or their properties to the hazards. The driving license shall be withdrawn in
case of the violation of the rule of the previous paragraph without prejudice to the imposed
penalty."
Article 38:
"If the driver of the vehicle commits an accident, which results in injuries or damages to the
public or private properties he shall stop and report the accident to the nearest police
station or ambulance immediately. It shall be prohibited for any person or workshop to
repair any vehicle exposed to a traffic accident without obtaining a permit from the
Directorate or the police station or the authorities determined by a decision from the
Inspector General according to the control measures indicated by the Executive
Regulations."
Article 130:
"(1) The driver of a vehicle may be apprehended in any one of the following cases:
28 | P a g e
(a) Driving the vehicle under the influence of alcohol or drugs or any other mentally
affecting substances.
(b) Causing a traffic accident which result in fatality or serious injuries or considerable
damages to the properties of the others.
(c) Failure to report to the police any accident he commits or fleeing from the site of the
accident or the police station.
(d) Driving the vehicle with high speed and rashness, which constitute a hazard to the road
users.
(e) Driving the vehicle without obtaining a driving license or refusal Jan-2005 88 to present
it to the policemen on request.
(f) Passing the red light signal.
(g) Exceeding the maximum speed limit by more than 75 km per hour.
(h) Arrangement of races on the road without obtaining a permit in advance."

29 | P a g e
Annex No.3: Table 6: Speed limit violations:
Points Category Violation
3 First Exceeding the maximum speed limit by more than 80 km per hour
2 Second Exceeding the maximum speed limit by more than 50 to 80 km per hour
Zero Third Exceeding the maximum speed limit by more than 35 to 50 km per hour
Zero Fourth Exceeding the maximum speed limit by more than 15 to 35 km per hour
1 Third Failure to reduce the speed near the schools or hospitals or markets or
crowded areas with passers by or work locations, which are determined
by a permit. Zero Fourth Driving at low speed on the left lane of a road
of several lanes. Zero Fourth Driving slowly in a form, which cripples the
traffic movement. Zero Fourth Failure to reduce the speed on encountering
animals.
- - Failure to reduce the speed on approaching the
turning points and roundabouts and junctions.
Note: as stated by article (133) from the traffic rules. A driver's licence will be withdrawn if he/she reaches 12 points within 2 years of the first violation.

30 | P a g e
Chapter Two: Aims and Methods
2.1. Aims
There were two aims for this thesis:
1- To describe the distribution of road traffic crashes in Oman by time, person and
place using the data collected by the ROP and specifically focusing on the data
collected in 2010 to compare it later with Sohar Hospital data.
2- To estimate the prevalence of known risk factors in Oman, focusing specifically on
Sohar. This involved describing the characteristics of RTCs, including detailed
information about the drivers involved and the circumstances of the crashes.
Having reliable descriptive information will identify the groups most at risk of road traffic
injury and help identify which potential risk factors for crashes present an opportunity for
prevention and where further research would be warranted. This research could be
extended to research to assess the relative importance of modifiable risk factors in Oman
and prioritisation of preventive interventions.

31 | P a g e
2.2. Part I: Retrospective data from national Royal Oman Police
2.2.1. Study design and period
All of the traffic crash data from the ROP database was used in this retrospective case series
study. The study period was from 1985 to 2009 for general patterns of RTCs and their
morbidity and mortality. Additional data for the year of 2010 were extracted and made
available for further analysis and comparison with the Sohar prospective study.
2.2.2. Data sources
The source of the historical and 2010 RTC data for this part of the study was The Directorate
General of Traffic which is responsible for vehicle’s inspection licensing, investigations of
RTCs and ensuring safety on the roads. The concept of a police force is relatively new to
Oman. The official start of the current Oman Police was after the widespread administrative
changes in the country in 1970. It was named The Royal Oman Police in 1974 by his Majesty.
The duties of the Royal Oman Police are divided between protecting people’s lives and
properties and maintaining the law in Oman. It is divided into 11 Regional Police
Headquarters, one in each Governorate, and each of the Headquarters supervises a number
of police stations within each Governorate. It is also organised into multiple Directorates
Generals in which some are responsible for serving the public and some are restricted to
serve the ROP only [64].
2.2.3. Analysis
Analysis of this part of the study was mainly descriptive, focusing on time trends for
morbidity and mortality, describing the involvement of each type and gender of road users
and reasons for all RTCs during the period of 1985 to 2009 and also the year of 2010. The
police definition of fatality, injury and reasons for RTCs was used in the analysis which was
done using the statistical package STATA.

32 | P a g e
2.3. Part II: prospective case series of injured drivers admitted to Sohar Hospital Emergency Department
2.3.1 Place of study
This descriptive study was conducted at Sohar Hospital, a 363 bed referral tertiary care
hospital for the population of North Al-Batinah. It is a multispecialty hospital which was
established in 1997 and is a teaching hospital for students of Oman Medical College (the
second medical college in the Sultanate of Oman) [65].
According to the 2010 census, Sohar is the fifth most populous city in Oman with a population
of 140,006 (2:1 male to female ratio) which constitutes approximately 5% of the total
population. Sohar is connected to Muscat, the capital of Oman, by a 375 kilometre (233 miles)
two-lane motorway network which represents the only connection between the GCC countries’
citizens coming from the North to Muscat. It also represents the only way for citizens of Oman
living north of Sohar to get to the capital city, Muscat [38].
2.3.2. Study design
This part of the research was a case series study that aimed to describe the characteristics
of drivers of cars involved in crashes which have resulted in the driver or a passenger
attending the Emergency Department in the city of Sohar as well as investigating potential
risk factors that might be associated with their crash. The candidate carried out
questionnaire-based interviews with injured drivers as they came into the Emergency
Department of Sohar Hospital. The plan was to include as many consecutive cases as
possible in one month so that the study was representative of the whole catchment
population of the hospital. The interviews were conducted directly between the main
investigator (myself) and the injured driver. I was present in the ED from 4pm to 2am daily
starting on 20 February and finishing on 20 March 2012. Drivers in injury crashes occurring
outside this period were recruited by the in-charge nurse. During that period, 250
interviews were completed.

33 | P a g e
2.3.3. Inclusion and exclusion criteria
All drivers involved in an RTC who attended the Accident and Emergency department, were
interviewed to obtain the circumstances leading to their accident. On the other hand,
drivers were excluded from this study in two conditions; firstly, if they did not consent to
take part in the study and secondly, if they were severely injured or had a medium to severe
head injury.
2.3.4. Case definition
For the purpose of this study, an RTC was defined as a crash that occurred on a road and
involved at least one moving vehicle. The participants in the interviews were the injured
drivers of those vehicles, who were attending the Emergency Department of Sohar Hospital.
2.3.5. Data collection
This prospective study was carried out using questionnaire-based interviews. The
questionnaire was developed from questions that have been used in The Auckland Car
Crash Injury Study, a case-control study of determinants of car crash injuries conducted in
Auckland, New Zealand in 1998-9 [52]. It involved questions regarding the demographic and
socioeconomic information of the injured driver and about the circumstances of the crash
and injured car occupants. In addition, questions about known risk factors such as speeding,
cell phone usage and wearing seatbelts were included.
After this study questionnaire was finalised (see Appendix), it was tested over one week in
the emergency department in order to assess the clarity and ability of its questions to
collect the required information. The pilot study resulted in the modification of some
questions and the addition of two characteristics of the vehicles that were not included
before (brake system and condition of tyres). It also served as an opportunity for the
candidate to examine the dataset in terms of participants’ responses to the questions
before commencing data collection.

34 | P a g e
2.3.6. Data analysis
After the questionnaire-based interviews were completed within the given period, the data
were entered into Microsoft Excel, after which they were exported to the statistical package
STATA for the statistical analysis. Data were summarised to illustrate frequency and percentages of socio-demographic
characteristics of drivers in RTCs in Sohar, the prevalence of studied risk factors and the
usual, and at the crash time, behaviour of the injured drivers in Sohar Hospital. The results
were presented in tables and graphs.
2.3.7. Ethics
Before commencing any interview, the injured driver was provided with a brief description
about the aims of this study. Moreover, respondents were informed that the obtained data
would be only used for the purpose of scientific research. Confidentiality and privacy of
information were ensured as the questionnaires were anonymous, so that no direct
personal information such as names and/or ID numbers were required. Respondents were
informed that their submission to be interviewed implied their full consent to participate in
the study. Ethical approval was obtained from the Medical Research and Ethics Committee
at Ministry of Health, Oman (see Appendix).

35 | P a g e
Chapter Three: Results
3.1. Part I: Retrospective data from national Royal Oman Police
3.1.1. Road traffic crashes (1985-2009)
Figure 6: Total RTC Deaths in Oman, 1985-2009 (n):
Figure 6 shows the substantial increase in the number of road traffic crash fatalities in Oman
between 1985 and 2009. In comparison, there has only been a small increase in the
population during that period, rising from 2,340,815 in 2003 to 2,773,479 in 2010. However,
there has been a vast increase in motorization during this period. According to the
Directorate General of Traffic database, the total length of roads increased by almost 200%
from 2002 (32,800 km) to 2011 (59,363 km). In addition, the total number of registered

36 | P a g e
vehicles has risen dramatically during that period as well, climbing from 113,370 vehicles in
2002 to reach 881,360 vehicles in 2011. In 2000, the death rate in Oman was 23.2 per
100,000 population compared to 19.9 and 14.7 in neighbouring UAE and Qatar, respectively,
15.1 in the USA and 5.7 in the UK. By 2010, the rate in Oman had reached 30.6 deaths per
100,000 population.
Table 7: Mortality and injury rates 1985-2011(per 100,000 population):
Year Deaths
(n)
Mortality (per 100,000 population)
Mortality (per 100,000
vehicles)
Injuries
(n)
Injury rate (per 100,000 population)
Injury rate (per 100,000
vehicles) 2011 1056 37.1 120 11420 401.2 1295
2010 820 29.5 102 9709 349.0 1207
2009 953 35.1 - 9783 360.7 -
2008 951 36.0 - 10558 400.3 -
2007 798 31.1 - 8531 333.1 -
2006 681 27.3 - 7548 303.0 -
2005 689 28.3 - 6658 274.0 -
2004 637 26.7 - 6636 273.0 -
2003 578 24.7 - 6735 288.3 -
2002 580 25.1 - 7907 343.3 -
2001 499 21.9 - 9625 422.3 -
2000 492 21.7 - 9323 411.7 -
1999 604 26.7 - 8183 362.2 -
1998 614 27.1 - 7913 349.6 -
1997 549 24.2 - 7278 321.1 -
1996 512 22.6 - 6654 294.5 -
1995 479 21.4 - 6685 299.5 -
1994 497 22.7 - 5954 272.7 -
1993 461 21.8 - 6203 293.8 -
1992 468 23.0 - 5876 289.3 -
1991 432 22.1 - 5481 281.5 -
1990 377 20.1 - 4771 255.4 -
1989 375 20.8 - 4389 244.2 -
1988 359 20.7 - 4072 235.2 -
1987 378 22.6 - 3318 198.8 -
1986 377 23.4 - 2693 167.7 -
1985 382 24.8 - 2981 193.7 -

37 | P a g e
0
50
100
150
200
250
300
350
400
450
19
85
19
86
19
87
19
88
19
89
19
90
19
91
19
92
19
93
19
94
19
95
19
96
19
97
19
98
19
99
20
00
20
01
20
02
20
03
20
04
20
05
20
06
20
07
20
08
20
09
20
10
20
11
Mortality rate
Injury rate
Figure 7: Mortality and injury rates (per 100,000 population) 1985-2011:

38 | P a g e
Figure 8: Total RTC injuries in Oman, 1985-2009 (n): Figure 7 shows the increase in the number of injuries caused by road traffic crashes
between 1985 and 2009. It can be seen that there is a similarity between the pattern of
increase in death and injury numbers during that period. In 2000, the injury rate in Oman
was 287.3 per 100,000 population compared with 195.3 in Qatar. Although the year 2004
marked the release of the the world report on road traffic injury prevention which is not a
plausible explanation of the trend, no other explanation was determined. it seems more
likely to be a reporting effect or a reflection of some real underlying change.

39 | P a g e
0%
10%
20%
30%
40%
50%
60%
70%
80%
90%
100%
Negligence
Lack of control
Speeding
Figure 9: Top three reasons for RTCs attributed by Royal Oman Police, 1992-2009:
According to the Royal Oman Police, speeding is the top reason for RTCs in Oman followed
by lack of control and then negligence. The above graph shows that over 15 years there has
been a dramatic change in these reasons. Speeding was the attributed cause of 25-30% of
all crashes in 1992, but over 60% of 2009 crashes. In addition, negligence, which caused
over 50% of the crashes in 1992, is reported for only 10% in 2009. It is unknown whether
these are changes in how the ROP attributes specific cause to the crashes, or real changes in
the distribution of causes over time.

40 | P a g e
1473
679
0
1000
2000
3000
4000
5000
6000
19
85
19
86
19
87
19
88
19
89
19
90
19
91
19
92
19
93
19
94
19
95
199
61
99
71
99
81
99
92
00
02
00
12
00
22
00
32
00
42
00
52
00
62
00
72
00
82
00
9
Driver
Passenger
Pedestrian
Figure 10: Total RTC injuries, by road user type in Oman, 1985-2009:
Figure 9 shows the changes in who is injured as a result of RTCs between 1985 and 2009. It
can be seen that in 1985 there were more injured pedestrians than drivers and passengers,
but this number suddenly dropped and continued to be the least injured road users. In
addition, an incredible increase in the involvement of drivers and passengers could be seen
from the graph which has a drop of approximately 2000 RTC injuries between 2003 and
2005, but which continues to rise after that. This is likely to be due to a reporting artefact.

41 | P a g e
0 500 1000 1500 2000 2500
< 10 years
11-20 years
21-30 years
31-40 years
41-50 years
> 51 years
9
657
2089
1107
401
253
1
57
159
72
43
27
Deaths
Injuries
Figure 11: Deaths and Injuries among drivers in 2010
3.1.2. Road traffic crashes 20103
Drivers’ injuries and deaths by age groups:
It can be seen from Figure 10 that most injured and killed drivers are in the age groups of
21-30 and 31-40. Almost half of the total number of injured and killed drivers were from the
young age group, 21-30.
3 2010 Police data was the latest available detailed road traffic crash data at the time of analysis

42 | P a g e
0 500 1000 1500 2000
< 10 years
11-20 years
21-30 years
31-40 years
41-50 years
over 51 years
702
1381
1651
654
306
162
14
63
81
49
31
31
Deaths
Injuries
Figure 12: Deaths and Injuries among Passengers in 2010
Passengers’ injuries and deaths by age groups:
It can be seen that the passengers’ age groups of those injured and killed in RTCs are
different from those seen in the previous graph of drivers’ age groups. Many child
passengers were injured in 2010 with approximately 15% of all injured passengers in that
year below the age of 10.

43 | P a g e
32.8
43.8
23.4
Proportion of Total Deaths
Passengers
Drivers
Pedestrains
48.2
44.9
6.9
Proportion of Total Injuries
Passengers
Drivers
Pedestrians
Figure 13: Total deaths and injuries by type of road user in Oman, 2010 (%):
The two pie charts show the proportions that each road user occupied of the total RTCs’
deaths and injuries in 2010. It can be seen that drivers were the most-killed type of road
users and passengers were most-injured road user type. Moreover, a higher proportion
of pedestrians, 23.4%, were killed compared with only 6.9% who were injured. The
larger case fatality reflects their greater vulnerability when involved in RTCs.

44 | P a g e
8
7
8
9
10
88
8
9
8
7
10
Monthly proportion of crashes causing injuryJanuary
February
March
April
May
June
July
August
September
October
Novemeber
December
Figure 14: Total RTC injuries by month in Oman, 2010:
In Figure 13, it can be seen that most crashes occur in May, which is the month of mid-
semester break from schools and universities, and December which is the middle of the end
of year holidays for schools and universities and the start of annual holidays for
government.

45 | P a g e
0.00%
10.00%
20.00%
30.00%
40.00%
50.00%
60.00%
70.00%
Deaths by Reason
0.00%
5.00%
10.00%
15.00%
20.00%
25.00%
30.00%
35.00%
40.00%
45.00%
50.00%
Injuries by Reason
Figure 15: Total RTC deaths, by reasons according to ROP, 2010 (%):
Figure 16: Total RTC injuries, by reasons according to ROP, 2010 (%):
It can be seen in Figures 14 and 15 that most deaths and injuries were attributed to
speeding (more than half of deaths and almost half of the injuries). The second top reason
for both deaths and injuries was improper acts including any reason that would cause the
driver to jump front of another vehicle and cause a crash.

46 | P a g e
3.2. Part II: Prospective case series of injured drivers admitted to Sohar Hospital Emergency Department
3.2.1. Study population
In the study period from 20 February to 20 March 2012, 250 injured drivers attending the
ED at Sohar Hospital were recruited to the study. They were consecutive attendees with the
exception of 5 drivers who attended during the hours of 3:00 to 15:00. The most seriously
injured drivers, who had to be taken by ambulance to the capital city Muscat for further
investigation and those who died of their injuries, were not included. There were no eligible
participants who declined to take part in the study. The data collection period was
constrained for practical reasons. It was expected that 300 participants would be recruited,
based on information supplied about numbers of ED attendances for RTC. The number of
drivers who died or were transferred to Muscat was not known as data about that was not
obtained. This was due to the fact that some do not report death to the authorities. In
addition, some transferred cases are done by individuals involved rather than hospital
services.
Table 8 summarises the characteristics of the study population for men and women
separately. Of the 250 interviewed injured drivers, 75.2% were males and 24.8% were
females. The highest percentage of RTCs occurred in the age group 25-35 years (58%),
followed by 18-25 years (38%), but there were marked gender differences. Almost all of the
women in the study were 25-35 years old, but half of the men were younger (18-25 years).
Slightly more than half of the study population were full time workers (57.4% in males and
56.5% in females), and most owned their own car, with no gender difference seen in these
characteristics.
In an average week, approximately half of the interviewed male drivers (46.3%) drove 100-
300 kms and 61.7% of them spent 21-30 hours driving. Similarly, slightly more than half
(54.8%) of the interviewed female drivers drove 100-300 kms weekly and a similar
proportion (53.2%) spent 21-30 hours driving during the same period. More than half of the
interviewed drivers (68.6% of males and 72.6% of females) had no history of past RTCs.
However, there was a marked gender difference in the number of reported traffic
violations over the past 5 years; the majority of male drivers (83%) reported at least three

47 | P a g e
traffic violations whereas approximately half of the female drivers reported one (30.6%) or
no (19.4%) traffic violations.

48 | P a g e
Table 8: Description of study population:
Male Female
n % n % All Study Participants 188 75.2 62 24.8
Age Groups 18-25 93 49.5 2 3.2 25-35 86 45.7 59 95.2 35-45 9 4.8 1 1.6
Employment Full time work for pay 108 57.4 35 56.5 Part time work for pay 15 8.0 6 9.5
Student 48 25.5 13 21.0 Unemployed 17 9.1 8 13.0
Car Ownership Owner 154 82.0 52 83.9
Not Owner 34 18.0 10 16.1
Distance Spent Driving in an Average Week (km)
10-100 kms 2 1.1 2 3.2 100-300 kms 87 46.3 34 54.8 300-500 kms 56 29.8 16 25.8
More than 500 kms 43 22.8 10 16.2
Time Spent Driving in an Average Week (hours)
5 hours or less 0 0.0 1 1.6 6-10 hours 16 8.5 9 14.5
11-20 hours 24 12.8 10 16.1 21-30 hours 116 61.7 33 53.2
More than 30 hours 31 16.5 9 14.6 Don't Know 1 0.5 0 0.0
Traffic violations over 5 years
0 17 9.0 12 19.4 1 4 2.1 19 30.6 2 11 5.9 17 27.4 3 81 43.0 10 16 4 36 19.0 2 3.3 5 39 21.0 2 3.3
Past Crashes 0 129 68.6 45 72.6 1 43 22.9 10 16.1 2 14 7.5 7 11.3 3 2 1.0 0 0.0

49 | P a g e
3.2.2. Circumstances of crashes Table 9 describes the circumstances at the time of crashes according to time and location.
Most of crashes occurred on the first working weekday; Saturday (18.8%) followed by
Thursday (17.6%) which is the first day of the weekend. It can be seen from Figure 16 that
there are some gender differences in the pattern of crashes across the week. There is more
variability in crashes with male drivers with the highest prevalence on Saturday and
markedly lower prevalence on Friday. Amongst women, there is less variation, but lower
prevalence on Monday and Tuesday.
Figure 17: The Pattern of crashes over a week, by gender (%):
Most of these crashes were located in the city of Sohar with no noticeable gender
difference. However, there was a marked gender difference in the main reason for the
drivers’ trip on the day of the crash. More than half of all interviewed male drivers (51.8%)
reported that the main reason for their trip was to go to or from work compared with 45.2%
of all interviewed female drivers who were just driving around before their crashes. It can

50 | P a g e
be seen from Figure 17 that almost all (90%) of the interviewed drivers who reported just
driving around as the main reason for their trip crashed during the weekend, including
Wednesday. On the other hand, the majority (76.7%) of those interviewed drivers who
reported going to or from work as the main reason for their trip crashed during a weekday.
Figure 18: The Pattern of crashes over a week, by Reason for Trip (%):
The majority of both genders stated that they were either familiar or very familiar with the
roads they crashed on. In addition, there was a gender difference in the number of cars
involved in the crash; more than half of the males’ crashes (58%) involved two cars
compared with 69.4% of the females’ crashes involving only one car. Most of the crashes
occurred during a sunny day and on a dry road surface with 18.6% of males and 11.3% of
females reporting a head on glare from the sun while driving on the day of the crash. As can
be seen from Figure 18, most of the cars involved in the crashes had no passengers at the
time of the crash, however, most of the cars with passengers crashed on Thursday (the
weekend).

51 | P a g e
Figure 19: The pattern of crashes over a week, by number of passengers in vehicle (n)

52 | P a g e
Table 9: Circumstances at the Time of the Crash:
Male Female n % n %
Day of the Week Monday 34 18.1 4 6.5 Tuesday 21 11.1 5 8.1
Wednesday 30 16.0 11 17.7 Thursday 34 18.1 10 16.1
Friday 10 5.3 11 17.7 Saturday 38 20.2 9 14.5 Sunday 21 11.2 12 19.4
Location
Al-Khaboura 0 0.0 1 1.6 Barka 0 0.0 1 1.6 Liwa 26 13.8 12 19.4
Al-Rustaq 0 0.0 1 1.6 Saham 32 17.0 7 11.3 Shinas 27 14.4 10 16.1 Sohar 103 54.8 30 48.4
Reason for the Trip
Just driving around 59 31.4 28 45.2 Going to/from work 103 51.8 26 41.9
Working 13 8.4 2 3.2 Other 13 8.4 6 9.7
Familiarity with the road Unfamiliar 44 23.4 11 17.7
Familiar 59 31.4 32 51.6 Very familiar 83 44.1 17 27.4 Don’t know 1 1.1 2 3.3
Number of Vehicles involved in the Crash
One 69 36.7 43 69.4 Two 109 58.0 19 30.6
Three or more 9 4.8 0 0.0 Don't Know 1 0.5 0 0.0
Number of passengers
0 156 83.0 49 79.0 1 15 8.0 4 6.5 2 9 4.8 7 11.3 3 6 3.2 2 3.2 5 2 1.0 0 0.0
Darkness No 117 62.2 38 61.3 Yes 71 37.8 24 38.7
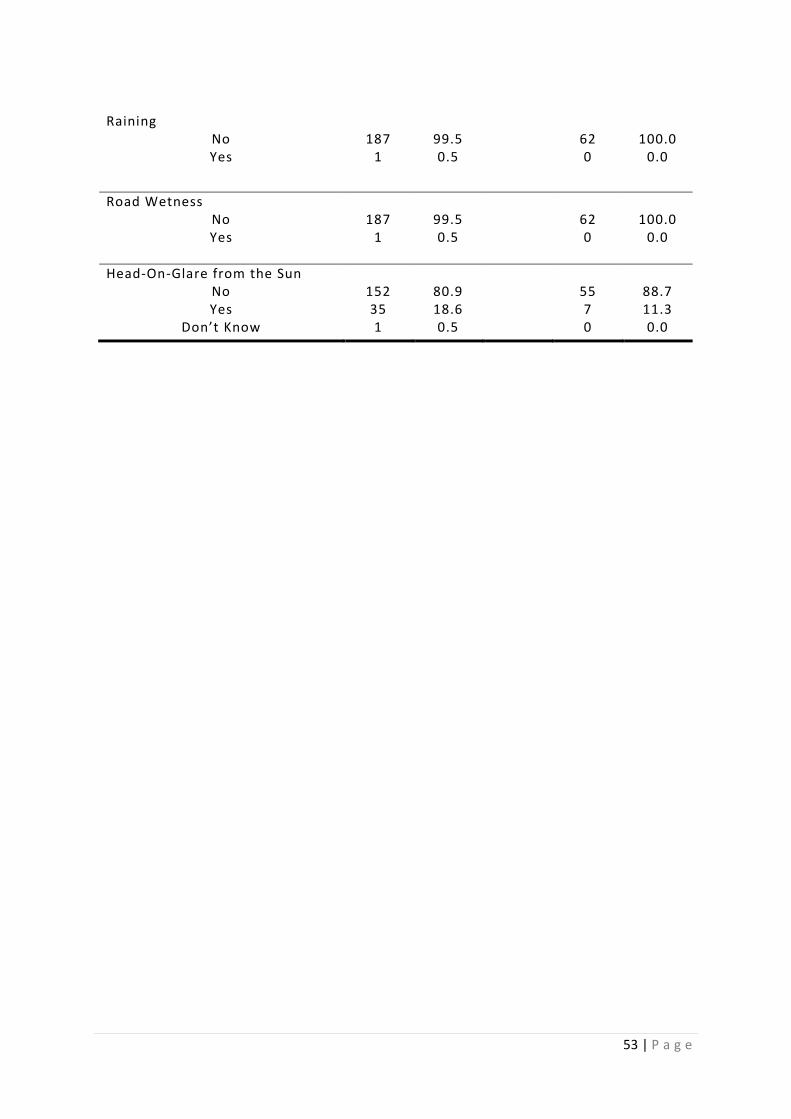
53 | P a g e
Raining
No 187 99.5 62 100.0 Yes
1 0.5 0 0.0
Road Wetness
No 187 99.5 62 100.0 Yes 1 0.5 0 0.0
Head-On-Glare from the Sun No 152 80.9 55 88.7 Yes 35 18.6 7 11.3
Don’t Know 1 0.5 0 0.0

54 | P a g e
3.2.3. Driver behaviours at time of crash Table 10 shows the behaviour of all interviewed male drivers at the time of the crash
according to age groups. The majority (90%) of all interviewed male drivers reported not
wearing their seatbelts at the time of the crash. In addition, the majority of all age groups
were wearing jandals, clogs or scuffs at the time of the crash.
The majority of 18-25 and 25-35 age groups (62.3% and 72.1% respectively) were travelling
at a speed of 100-140 km/hour and a significant proportion estimated that they were
driving at 140-180 km/hour (18.3%, 17.4%). Most injured drivers reported that they had
been driving for 15-60 minutes before the crash with the youngest age group (18-25)
reporting a larger proportion of trips over 30 minutes before their crashes.
A substantial proportion of all age groups reported using a cell phone at the time of the
crash (38.7% of the 18-25 group, 23.3% of the 25-35 group and 33.3% of the 35-45 group).
In addition, 11.8% of the 18-25 years, 22.1% of the 25-35 years and 44.4% of the 35-45 years
said that they were smoking a cigarette at the time of the crash. 24.7% of the 18-25 age
group, 17.4% of the 25-35 age group and 22.3% of the 35-45 age group reported they had
been involved in using the CD and/or radio at the time of the crash. In addition, only 19 of
188 interviewed male drivers reported that they were engaged in adjusting the air
conditioner or the windows at the time of the crash.
Only 15 of the 188 injured male drivers had passengers in their cars at the time of the crash,
with most of them being in the 18-25 group. When asked about the number of nights they
had a 7-hour sleep during the week prior to their crash, almost all of the interviewed drivers
had either 3 or 4 nights at maximum. Five drivers reported they had fallen asleep prior to
the crash and 10 others thought it was possible that they had.

55 | P a g e
Table 10: Behaviours at the Time of the Crash (Male Distribution by age groups):
Age Groups 18-25 25-35 35-45 All Male Participants (n=93) (n=86) (n=9) N (%) N (%) N (%)
Wearing Seatbelt No 83 (89.2) 79 (91.9) 7 (77.8) Yes 9 (9.7) 7 (8.1) 2 (22.2)
Don't know 1 (1.1) 0 (0.0) 0 (0.0) Footwear
Nothing 14 (15.1) 10 (11.6) 1 (11.1) Jandals/Clogs/Scuffs 72 (77.4) 73 (84.9) 5 (55.6)
High Heels 0 (0.0) 0 (0.0) 0 (0.0) Gumboots/Work boots 7 (7.5) 3 (3.5) 3 (33.3)
Other 0 (0.0) 0 (0.0) 0 (0.0) Don't Know 0 (0.0) 0 (0.0) 0 (0.0)
Speed (km/hr) 20-60 2 (2.2) 0 (0.0) 1 (11.1)
60-100 16 (17.2) 9 (10.5) 2 (22.3) 100-140 58 (62.3) 62 (72.1) 3 (33.3) 140-180 17 (18.3) 15 (17.4) 3 (33.3)
Time Driven Before the Crash < 15 mins 8 (8.6) 6 (7.0) 2 (22.3)
15 mins-30 mins 34 (36.6) 44 (51.2) 3 (33.3) 30 mins-1 hour 39 (41.9) 29 (15.4) 2 (22.2)
> 1 hour 12 (12.9) 7 (8.1) 2 (22.2) Using a Cell Phone
No 56 (60.2) 62 (72.0) 5 (55.6) Yes 36 (38.7) 20 (23.3) 3 (33.3)
Don't Know 1 (1.1) 4 (4.7) 1 (11.1) Smoking a Cigarette
No 78 (83.9) 66 (76.7) 5 (55.6) Yes 11 (11.8) 19 (22.1) 4 (44.4)
Don’t Know 4 (4.3) 1 (1.2) 0 (0.0) Using CD/Radio
No 69 (74.2) 69 (80.3) 7 (77.7) Yes 23 (24.7) 15 (17.4) 2 (22.3)
Don't Know 1 (1.1) 2 (2.3) 0 (0.0) Car Occupants
No 83 (89.2) 83 (96.5) 7 (77.7) Yes 10 (10.8) 3 (3.5) 2 (22.3)
Don't Know 0 (0.0) 0 (0.0) 0 (0.0) Adjusting Windows/AC
No 83 (89.2) 77 (89.5) 9 (100.0) Yes 10 (10.8) 9 (10.5) 0 (0.0)
Don't Know 0 (0.0) 0 (0.0) 0 (0.0)

56 | P a g e
Nights of 7 hours Sleep in the Week prior to the Crash
2 7 (7.5) 7 (8.1) 1 (11.1) 3 32 (34.4) 28 (32.6) 1 (11.1) 4 45 (48.4) 44 (51.2) 6 (66.7) 5 6 (6.5) 7 (8.1) 1 (11.1) 6 1 (1.1) 0 (0.0) 0 (0.0) 7 2 (2.1) 0 (0.0) 0 (0.0) Fallen Asleep Immediately before the Crash
No 82 (88.2) 76 (88.4) 7 (77.8) Yes 2 (2.1) 3 (3.5) 0 (0.0)
Possibly 4 (4.3) 5 (5.8) 1 (11.1) Don't Know 5 (5.4) 2 (2.3) 1 (11.1)

57 | P a g e
Table 11 shows the behaviour of all interviewed female drivers at the time of the crash
according to age groups. The 25-35 years age group will be the main focus here as it
constituted almost all (95.2%) of the female drivers. 43.5% (27 out of 62 drivers) of this age
group reported not wearing their seatbelts at the time of the crash compared with 90% of
the male drivers. As with the male drivers, almost this entire group stated that they were
wearing jandals, clogs or scuffs at the time of the crash. More than half (59.3%) reported
travelling at a speed of 100-140 km/hour immediately before the crash, but, unlike the men,
few (n=4) reported driving faster than this (140-180 km/hour). Most of the interviewed
female drivers (72.6%) reported to have been driving for 15-60 minutes with only six drivers
reporting trips over one hour.
A high proportion (15 of 62 drivers) of this age group (25-35) stated that they were using a
cell phone at the time of the crash. In addition, only 10 drivers reported they were smoking
a cigarette at the time of the crash. Regarding use of the CD player or radio and adjustment
of the air conditioner or windows at the time of the crash, similar proportions of the
interviewed females in this group stated that they were using the CD player or radio (11.9%)
or they were adjusting windows or air conditioner (10.2% ) at that time. Only 8.5% of this
group had passengers in their cars at the time of the crash.
In the week prior to the crash, 18 of the 62 interviewed female drivers reported having less
than 4 nights of 7 hours sleep. Moreover, only one driver reported to have fallen asleep
immediately before the crash, but six others thought it was possible that they had.

58 | P a g e
Table 11: Behaviours at the Time of the Crash (Female Distribution by age groups):
Age Groups 18-25 25-35 35-45 All Female Participants (n=2) (n=59) (n=1)
N (%) N (%) N (%)
Wearing Seatbelt No 1 (50.0) 26 (44.1) 0 (0.0) Yes 1 (50.0) 33 (55.9) 1 (100.0)
Don't know 0 (0.0) 0 (0.0) 0 (0.0)
Footwear Nothing 0 (0.0) 1 (1.7) 0 (0.0)
Jandals/Clogs/Scuffs 1 (50.0) 55 (93.2) 0 (0.0) High Heels 1 (50.0) 2 (3.4) 0 (0.0)
Gumboots/Work boots 0 (0.0) 1 (1.7) 1 (100.0) Other 0 (0.0) 0 (0.0) 0 (0.0)
Don't Know 0 (0.0) 0 (0.0) 0 (0.0)
Speed (km/hr) 20-60 0 (0.0) 1 (1.7) 0 (0.0)
60-100 1 (50.0) 19 (32.2) 1 (100.0) 100-140 1 (50.0) 35 (59.3) 0 (0.0) 140-180 0 (0.0) 4 (6.8) 0 (0.0)
Time Driven Before the Crash < 15 mins 0 (0.0) 8 (13.6) 0 (0.0)
15 mins-30 mins 1 (50.0) 31 (52.5) 1 (100.0) 30 mins-1 hour 1 (50.0) 14 (23.7) 0 (0.0)
> 1 hour 0 (0.0) 6 (10.2) 0 (0.0)
Using a Cell Phone No 2 (100.0) 42 (71.2) 1 (100.0) Yes 0 (0.0) 15 (25.4) 0 (0.0)
Don't Know 0 (0.0) 2 (3.4) 0 (0.0)
Smoking a Cigarette No 2 (100.0) 47 (79.7) 1 (100.0) Yes 0 (0.0) 10 (16.9) 0 (0.0)
Don’t Know 0 (0.0) 2 (3.4) 0 (0.0)
Using the CD/Radio No 1 (50.0) 52 (88.1) 1 (100.0) Yes 1 (50.0) 7 (11.9) 0 (0.0)
Don't Know 0 (0.0) 0 (0.0) 0 (0.0)
Car Occupants No 2 (100.0) 54 (91.5) 1 (100.0) Yes 0 (0.0) 5 (8.5) 0 (0.0)
Don't Know 0 (0.0) 0 (0.0) 0 (0.0)
Adjusting Windows/AC No 2 (100.0) 53 (89.8) 1 (100.0) Yes 0 (0.0) 6 (10.2) 0 (0.0)
Don't Know 0 (0.0) 0 (0.0) 0 (0.0)

59 | P a g e
Nights of 7 hours Sleep in the Week prior to the Crash
2 1 (50.0) 1 (1.7) 0 (0.0) 3 0 (0.0) 16 (27.1) 0 (0.0) 4 0 (0.0) 22 (37.3) 0 (0.0) 5 1 (50.0) 8 (13.6) 1 (100.0) 6 0 (0.0) 12 (20.3) 0 (0.0) 7 0 (0.0) 0 (0.0) 0 (0.0) Fallen Asleep Immediately before the Crash
No 1 (50.0) 52 (88.1) 1 (100.0) Yes 0 (0.0) 1 (1.7) 0 (0.0)
Possibly 1 (50.0) 5 (8.5) 0 (0.0) Don't Know 0 (0.0) 1 (1.7) 0 (0.0)

60 | P a g e
3.2.4. Usual driving behaviours Table 12 demonstrates the usual driving-related behaviours for all interviewed drivers
according to gender. The majority of the interviewed drivers reported that they never or
almost never wore seatbelts, with no marked gender difference. However, a slight gender
difference was noted in that the majority (76.6%) of male drivers reported that they often
drove post the speed limit whereas the majority (69.4%) of female drivers stated that they
sometimes drive post speed limit. In addition, 10.6% of male drivers stated that they had
raced once or twice during the past 12 months compared with only 3.2% for female drivers.
Moreover, 20% of male drivers and 8% of female drivers had less than 7 hours of sleep each
day.
There was a slight gender difference when asked if the cars they crashed had had a
professional service in the past year; 24.2% of all interviewed female drivers reported that
their cars had not had a professional service in the past year compared with only 15.4% of
interviewed male drivers. Almost all of the cars involved in this study were not modified
(95.2% in male group and 96.8% in female group). Moreover, 40.4% of males and 30.6% of
females had their tires for 1-4 years and few of either gender had had them for over 4 years
(6.9% for males and 6.5% for females). There was a gender difference when asked about the
last time the brake system was checked; in the male group, 30.3% answered with more than
one year compared with 38.7% in the female group. In addition, in approximately all the
included cars, seatbelts were fitted in both the front and rear of the cars (97.9% of male
group and 100% of female group).

61 | P a g e
Table 12: Usual Driving Related Behaviours:
Male Female N % N %
Wearing seatbelt Never or almost never 105 55.9 27 43.5
sometimes 59 31.4 23 37.1 often 23 12.2 12 19.4
Always or nearly always 1 0.5 0 0 Don’t know 0 0 0 0
Driving Post-Speed Limit Always or nearly always 36 19.1 3 4.8
Often 144 76.6 16 25.8 Sometimes 5 2.7 43 69.4
Never or almost never 3 1.6 0 0 Hours slept each 24 hours
5 13 6.9 1 1.5 6 26 13.8 4 6.5 7 140 74.5 37 59.7 8 8 4.3 20 32.3 9 1 0.5 0 0
Racing during the past 12 months Several times 2 1.1 0 0 Once or twice 20 10.6 2 3.2
Never 166 88.3 60 96.8 Professional Service in the past
12 months
No 29 15.4 15 24.2 Yes 155 82.5 47 75.8
Don't Know 4 2.1 0 0 Car Modification
No 179 95.2 59 96.8 Yes 9 4.8 2 3.2
Tires Age < 1 year 99 52.7 39 62.9
1-4 years 76 40.4 19 30.6 > 4 years 13 6.9 4 6.5
Seatbelts in the vehicle Front and rear 184 97.9 62 100
Front only 3 1.6 0 0 No seatbelts 1 0.5 0 0
Last time brake system checked < 6 months 53 28.2 21 33.9
1 year 78 41.5 17 27.4 2-3 years 44 23.4 19 30.6 > 3 years 13 6.9 5 8.1

62 | P a g e
3.3. Summary of main findings
A substantial increase in traffic crash deaths and injuries occurred in Oman from
1985 to 2009.
According to ROP, from 1985 to 2009:
o Speeding has been the number one contributing factor for all RTCs.
o Passengers have been the most commonly injured road user type.
According to ROP, in 2010:
o Age group 21-30 years was most affected by road deaths and injuries.
o Drivers were the road user type most commonly killed and passengers most
commonly injured.
More younger male drivers were involved in injury crashes than female drivers. o 49.4% of male drivers were in the 18-25 age group compared to 95.2% of female
drivers in the 25-35 age group.
Generally, drivers were found to spend long periods on the roads and drive for long
distances.
More crashes occur on Saturday and Thursday than any other days of the week.
Most male drivers crashed on the way going to or from their work places while most
female drivers were just driving around when they crashed.
Female drivers were found to be more compliant with wearing seatbelts than male
drivers.
o 89.9% of male drivers were not wearing seatbelts at the time of the crash
compared to only 43.5 % female drivers.
84.0% of male drivers were driving at a speed in excess of 100 km/hr compared with
only 64.5% of female drivers.
More male drivers reported specific risk factors or behaviours at the time of the
crash:
o 31.4% of male drivers were using their cell phones compared to only 24% of
female drivers.
o 18% of male drivers were smoking a cigarette compared to 16.1% of female
drivers.

63 | P a g e
o 21.3% of male drivers were using the CD or radio compared to only 13.0% of
female drivers.
o 40% of male drivers had less than 4 nights of 7 hours sleep/night in the week
before the crash compared to 30% of female drivers.
Evidence that the group of injured Omani drivers included in the Sohar study routinely
ignored the traffic laws:
o Most injured drivers never or almost never wore seatbelts when they were
driving.
o 76.6% of male drivers often drove over the posted speed limit and 69.4% of
female drivers sometimes drove past the posted speed limit.
o It is not known how this compares with usual driving practice in Oman as this
study did not include a control group.
No obvious deficiencies in the cars being used were detected:
o Most cars in the Sohar study have had professional maintenance in the year prior
to the crash.
o Almost all of the cars have seatbelts fitted in the front and rear seats.
o 69.7% of males and 61.3% of females had their cars’ brake systems checked
professionally in the year prior to their crashes.
o Most of the cars were not modified.

64 | P a g e
Chapter Four: Discussion
4.1. Main findings
Morbidity and mortality due to traffic crashes is a serious public health issue in most parts
of the world, including the GCC countries of the Eastern Mediterranean Region of WHO
[66]. There has been little attention paid to this issue in Oman to date. This study is a first
step in describing the problem and assessing potential for prevention. The first part
described the magnitude and trends in road traffic crash numbers in Oman, as recorded by
the Royal Oman Police (ROP), from 1985 to 2009, and in more detail in 2010. The second
part was a comprehensive case series study of road traffic crashes and their potential risk
factors in the city of Sohar, to identify potential prevention opportunities.
According to ROP statistics, the last 25 years have seen road traffic injuries and fatalities
increase by almost 300% in concert with a substantial increase in the number of registered
vehicles, while the population increased only slightly in the same period. Since 1992, speed
has been consistently cited as the top reason for RTCs, lack of control and negligence have
been the next common but both have seen a decrease by almost 50% since then. In 1985,
pedestrians were the most commonly injured road user group, but by 2009 they were the
least injured group. According to the ROP, in 2009, drivers were the most injured road
users’ type, with passengers following the same increasing pattern as drivers over that
period.
In 2010, ROP statistics indicated that most drivers and passengers injured and killed in
traffic crashes were in the 12-30 years old category. Moreover, the road users’ group most
often injured was passengers and the most often killed were drivers. Speeding was the main
cause reported for most crashes in 2010 and the peak months for crashes were May and
December.

65 | P a g e
In the Sohar study, all injured drivers attending Sohar (regional) hospital were interviewed
over a one month period. Three quarters (75.2%) of injured drivers were males and 24.8%
were females, and more than half of both sexes were full-time workers. Almost half of the
males were 18-25 years old and the majority of the females were 25-35 years old. The
injured drivers generally drove a lot. On an average week, the majority of the study
population estimated they spent 21-30 hours driving and covered 100-300 kms. Generally,
male drivers had more traffic violations than female drivers with 83% of males reporting at
least 3 traffic violations over the past five years whereas almost half of the females reported
one or no traffic violations over the same period.
Saturday and Thursday had the highest frequency of crashes (18.8% and 17.6% respectively)
and most of the crashes occurred in the city of Sohar rather than outlying areas of the
hospital catchment. However, the most common reason for male drivers' trips on the day of
their crash was "going to/from work", reported by about half (51.8%). In addition, the most
common reason for female drivers’ trips on the day of their crash was "just driving around",
reported by approximately 45%. In addition, the majority of the study population were
either familiar or very familiar with the roads they crashed on. Generally, crashes with male
drivers involved more cars than crashes with female drivers, with 58% of male drivers’
crashes involving two cars and 69.4% of female drivers’ crashes involving only one car. The
majority of crashes did not involve passengers but crashes with passengers were more likely
on Thursdays.
Very few male drivers who presented with injuries were wearing their seatbelts at the time
of the crash (less than 10%). In addition, the majority of male drivers were travelling at a
speed of 100-140 km/hour and almost 42% of those aged 18-25 had been driving for 30
minutes to one hour before their crash. A high proportion of young drivers reported known
risk factors for being involved in an injury crash. For instance, 31.4% of injured male drivers
were using their cell phones at the time of their crash. Almost all of the interviewed male
drivers had had only 3 or 4 nights of 7 hours sleep/night at maximum during the week prior
to the crash. About 8% thought they may have fallen asleep immediately before the crash.

66 | P a g e
In contrast to male drivers, 56% of the female population were wearing their seatbelts at
the time of the crash and a similar proportion were travelling at a speed of 100-140
km/hour at the time of the crash. At the time of the crash, 24% of female drivers reported
that they were using their cell phones when they crashed. Unlike the men, the majority of
females reported having more than 4 nights of 7 hours sleep/night in the week prior to their
crash.
When describing their usual driving behaviours, the majority of all injured drivers
interviewed reported that they never or almost never wore their seatbelts while driving.
The majority of male drivers reported that they "often" drove past the speed limit whereas
females were more likely to report that they "sometimes" drove past the speed limit.

67 | P a g e
4.2. Critique of the methods
4.2.1. Weaknesses
Several limitations should be considered when interpreting our findings. With regard to the
ROP data, underreporting bias is a known limiting factor in studies involving official road
traffic crash statistics [67]. While this has not been examined in Oman, it is well-known that
a number of road traffic crashes do not get reported to the police for several reasons such
as not having insurance, not holding a current valid driving licence or escaping police fines.
Biases of this sort vary by context but have been demonstrated to be present in official road
traffic statistics of other countries [68]. A second limitation is the inability to calculate the
incidence of RTCs as there are no appropriate denominator data are available for most years
(example of a denominator: vehicle kilometres travelled (VKT) [69].
Little is known about the way the ROP assign "reasons" for crashes to their reports. These
have been interpreted as being an impression formed by the police at the time of factors
that may have contributed to the crash.
The Sohar study has produced a wealth of descriptive data but is limited by its case series
design. Without a control group, a comparison of the prevalence of risk factors in the
injured drivers with those same characteristics in the rest of the population of drivers could
not be carried out and so causal inferences could be made. The size of the study population
in Sohar hospital was modest which limited the power of the study to find differences
between groups. Also only one regional hospital, Sohar Hospital, was involved due to the
limitations of time and the manpower provided in the study.
It is not known how reliable the collected information was as findings might be biased by
the exclusion of some daytime cases which are likely to differ from night time crashes. In
addition, the most seriously injured drivers were not included in the study, either because
they had died or had been transferred elsewhere for treatment. We were unable to
ascertain the number of cases in these categories. The sample is therefore representative of
less severely injured drivers attending hospital rather than all injured drivers.

68 | P a g e
4.2.2. Strengths
To the best of my knowledge, this is the first descriptive study of its kind in Oman, and in
the city of Sohar. The ROP provides the traffic data annually but it has not been analysed in
the context of the available literature. This study is the first to describe the prevalence of
road traffic crash characteristics, drivers’ behaviour and potential risk factors in Oman
through interviewing the drivers themselves. Furthermore, the prospective study in Sohar
Hospital had a high response rate which was almost 100% (only 5 cases were missed out of
250).
This study can draw on the extensive international literature of epidemiological studies to
draw inferences about the likely contribution of the measured risk factors to car crash
injuries, and therefore effective strategies for reducing such injuries.

69 | P a g e
4.3. Implications of findings
The findings of this study are relevant to policy makers in Oman. From the study that was
conducted in Sohar Hospital and the national police data, a number of recommendations
can be made to reduce injury from traffic crashes in Oman and to improve the national road
safety status.
4.3.1. Reducing speed-related crashes
According to the WHO, countries such as USA, UK, New Zealand and Finland which reduced
the speeds limits or introduced new laws regarding speed limits witnessed an 8% to 40%
reduction in all road crashes [70]. It was also found that drivers usually choose to drive over
the posted speed limits if they did not perceive a high level of enforcement or a high risk of
being caught by the responsible authorities i.e. Police force. Installation of speed cameras
has been found to be effective in reinforcing speed laws and limits. For instance, France
started installing speed cameras at a national level in 2003 and by 2007 there was a 40 -
65% reduction in fatal and injury crashes. Finally, more public compliance could be expected
after the implementation of widespread enforcement measures and the increase in the
severity of sanctions against speed [70].
Proposed strategy in Oman:
According to the Royal Oman Police, speed has been a top reason for RTCs in Oman since
1985 and in our study in Sohar Hospital most injured drivers were travelling at speeds of
more than 100 km/hour.
- Regulations: The following interventions have been tested internationally and proven effective in
reducing speed-related crashes. To begin with, speed limits could be set around the country
and this step has been taken by the authorities in Oman. However, many studies have
shown that setting speed limits without supporting actions such as police enforcement
would have a minimum effect on the public [71, 72]. Therefore, one of the important
interventions that could reduce the number of drivers exceeding posted speed limits is

70 | P a g e
lowering the speed limits nationwide and raising the penalties for exceeding them [73].
Another regulation that could be implemented in Oman is a driving licence points system in
the ROP. This system involves deducting points from the driving license with each traffic law
violation which could eventually lead, with increased violations, to the suspension of the
individual’s driving license [74]. Currently, this system is being studied by the authorities
and is planned to be implemented by the beginning of next year. This new system would be
an opportunity to show the public that the authorities are serious about reducing road
traffic injuries. This new system would include all sorts of violations, not only exceeding
speed limits.
- Enforcement:
Enforcement by the police increases compliance and therefore the effectiveness of active
interventions. Police enforcement could be carried out in a number of ways, one of which is
by implementing speed detection devices such as speed cameras and radars (mobile and
fixed) [75]. Another enforcement method is for the police to be present at times of higher
than usual risk for speed-related crashes, e.g. on roads during busy traffic hours such as
Wednesdays (the last working day of the week) and Fridays (the end of the weekend).
During these two days, police should be present particularly on all motorways linking
Muscat, the capital, to other major cities such as Sohar and handing out speeding tickets to
drivers who deserve to be penalised. The two methods mentioned above provide a
deterrent, and serve to convince and remind other drivers on the roads that the police
could be anywhere at any time and that they could be caught and penalised [70, 76].
- Publicity:
In addition to legislation and enforcement, it has been found that media campaigns and
advertising increase the awareness of the drivers about the likelihood of being caught by
the police for speeding and being fined for it. For instance, simple highway signs that display
a driver being passed a speeding ticket by a police officer are considered effective in raising
the population’s awareness of the activity of police patrols on the roads [77].

71 | P a g e
- Environmental interventions:
Passive environmental interventions can reduce the risk of speed related crashes without
having to actively change drivers’ behaviour. For example, physical speed-reducing
interventions such as roundabouts, speed humps and rumble strips have been widely used
to reduce driving speed in high income countries. These measures were effective,
predominantly where police enforcement may be lacking for various reasons [78]. Finally,
road design could be made safer, especially in high-risk locations such as intersections into a
highway, and results in reducing speed levels. This design could involve separating high-
speed road users (light vehicles) and low-speed road users (trucks) or preventing specific
vehicles from entering areas with vulnerable road users [70]. The aforementioned
environmental interventions could be used to reduce the severity of the outcome for many
other crashes caused for any reason.

72 | P a g e
4.3.2. Seatbelt interventions
The mechanism by which seatbelt usage reduces the severity of injuries is by preventing the
occupant from hitting the interior of the vehicle or from being ejected through its windows [48]. There are some injuries related to seatbelt usage (example: seatbelt sign injury on
chest and abdomen), however, these are very minor in comparison with major injuries
related to not wearing a seatbelt. Although seatbelts have substantially reduced injuries and
fatalities in many countries, they are still underused, especially in the developing world [79].
In a study comparing the Gulf Cooperation Council countries with high-income countries, it
was found that seatbelt non-use in GCC countries is significantly higher than that in high-
income countries (P<.0001) [80].
The use of seatbelts has been considered to be a crucial factor in road safety in research
conducted in Iran [79]. Two influential factors have been identified to increase seatbelt use
compliance; firstly, implementation of mandatory laws regarding seatbelt use and secondly,
public education to increase their awareness of the importance of seatbelts. Both the
aforementioned factors have been shown to increase compliance to seatbelt use and to
decrease the total number of traffic injuries and their severity [81, 82].
Proposed strategy in Oman:
Over half (54%) of the injured drivers in the Sohar study stated that they never or almost
never wore seatbelts whenever they are driving, and only about 15% reported wearing
them often.
- Regulations:
Mandatory laws and regulations regarding wearing seatbelts and fitting them in all
passenger vehicles should be increased and sustained. In order to be effective in increasing
compliance to wearing seatbelts, these laws and regulations need to meet the
internationally approved standards [83]. For instance, the authorities need to check that
seatbelts are fitted in the front and rear seats of all cars. In addition, individuals who have to
wear seatbelts should be defined in the law. For instance, the Australian law of seatbelts,
rule 265, states that "a passenger in or on a motor vehicle that is moving, or is stationary

73 | P a g e
but not parked, must comply with wearing seatbelts if the passenger is 16 years old, or
older" [84].
Moreover, penalties for non-compliance with seatbelts laws should be serious enough to
discourage drivers from breaking the laws. In addition, seatbelt violations should be linked
with other traffic violations and a penalty points system should be implemented, as
mentioned previously, so that with more traffic violations a person runs the risk of losing
their licence as more points are being taken from it.
- Enforcement:
Enforcement of the use of seatbelts should begin from government agencies and police
departments by making it compulsory for their staff to wear them to and from their work
places in order to lead the population by example [85]. In addition, Police officers should be
visible to drivers, monitor them and be able to penalise them when seatbelt laws are being
violated. This could be done through random, repeated and strict checkpoints which vary in
location and time of the day or night. Moreover, police checkpoints should not be located
on highways and where they could be anticipated by drivers [86]. It was found in the United
States that without high-visibility police enforcement of seatbelt laws, compliance with
seatbelt use decreases dramatically [87].
- Publicity:
Media campaigns can increase awareness of new regulations, and the intention to enforce
them, and therefore increase compliance with the new laws. Hence, in order to achieve
maximum driver compliance with seatbelt laws, public campaigns led by the government
and national media (television, newspaper, radio) should be carried out [88]. In addition,
benefits of wearing seatbelts, consequences of not wearing them and education on existing
seatbelt laws and penalties over non-compliance should be included in the schools’
curriculum. By doing so, an opportunity for changing parents’ non-compliance to seatbelts
through their children’s behaviour will be created. Finally, it has been observed that public
support for seatbelt laws has usually increased once legislation and enforcement has
increased the level of compliance [88].

74 | P a g e
4.3.3. Child restraints interventions
For children aged 1-4 years in the USA, a 69% reduction in the need for hospitalisation was
observed after committing to the use of child safety seats. In addition, the risk of death was
reduced by almost 70% for infants, and 47%-54% for toddlers aged 1-4 years old [89].
Moreover, it was found that if all vehicle occupants younger than 4 years were to be
restrained, that would save 162 lives and prevent 20,000 injuries annually [89].
Proposed strategy in Oman:
The conventional seatbelts are not designed to be used by children aged 12 years and
younger; these require a special child restraint system that is appropriate to their varying
sizes and weights. Child restraints are designed to protect children during sudden braking or
collision by keeping them firmly in their seats [83]. There is no clear legislation regarding
the use of child restraints in Oman.
- Regulations:
A law regarding the use of child restraints and elaborating on specifics regarding their
design has to be implemented by the government and enforced by the ROP. In addition,
exemptions from the law and penalties for non-compliance should be specified by the
police. Royal Oman Police should also identify individuals who are legally responsible for
making sure children are properly restrained in child seats [83].
- Enforcement:
For a new law such as child restraints in Oman, the transition from law introduction to law
enforcement could take a lengthy period of time. Therefore, police enforcement should be
carried out in phases; for example police can start by issuing warnings and explaining the
new laws to offenders. After that, Police could move on to issuing fines for those not
complying with the new law and they could increase the severity of the penalty as time
passes [83]. Another type of enforcement is to provide child restraints at an affordable cost for the
public. An example of that is New Zealand which has a loan scheme for restraints which are
expensive and only needed for a short period [90].

75 | P a g e
- Publicity:
As with seatbelt laws, after the child restraints law is passed, the enforcement process by
the police should be visible to the majority of drivers for maximum impact. It is also crucial
to educate the public on the advantages of using child restraints and the consequences of
not using them. This could be done through mass media campaigns and community-based
activities to promote the use of child seats [77].

76 | P a g e
4.3.4. Reducing alcohol-related crashes
Breath testing is an efficient way to detect alcohol level in drivers due to its low cost, quick
reading and non-invasiveness. The first testing devices for drivers’ breath were developed
around the 1940s, but the first modern breathalyzer as we know it today was designed by
Dr. Robert Borkenstein in 1954 in Indiana, USA [91]. Roadside testing for alcohol level,
especially when conducted randomly, has reduced alcohol-related road traffic crashes in
many countries [92].
Proposed strategy in Oman:
As mentioned in the first chapter of this thesis, driving under the influence of alcohol is
completely intolerable by the ROP in Oman with a legal blood alcohol concentration of 0.0
mg/mL. However, the magnitude of the drinking and driving problem is not yet well-
explored in Oman due to religious and cultural reasons. In addition, there is low public
awareness of the problem and inadequate testing. Blood alcohol concentration (BAC) for
drivers involved in RTCs is often not measured at Emergency departments nor is it routinely
monitored by the police.
- Regulations:
Although the issue of alcohol-related crashes may be minor compared to other risk factors
such as speeding and seatbelt use, it should be kept under routine surveillance by the
authorities in order to monitor its status in the future. A regulation that required all
Emergency Departments in the country to record blood alcohol concentrations for those
involved in RTCs would make assessment of the burden of drink driving simple. In addition,
the existing laws regarding drink driving need to be reviewed and a better definition of what
is “drunk” should be established. In line with most other countries, legal blood alcohol
concentration could be set and publicised and drivers who exceed that limit should be
penalised. The police force should be enrolled in training courses related to the proper use
of alcohol breathalysers. Serious sanctions on drivers caught with BAC over the legal limit
could be set. These sanctions could start with a fine for a first drinking and driving

77 | P a g e
offence and could increase to a night in custody and perhaps points deducted from the
licence for a second time offence [93].
- Enforcement:
Like the seatbelt and speeding laws, enforcement of laws regarding drinking and driving
should be persistent and visible to the public. The police force’s objective should not be to
apprehend those found to be drinking and driving; their main objective should be to reduce
the risk of this problem and reduce the number of RTCs caused by it. The Royal Oman Police
force should start with compulsory breath tests at crash scenes and Emergency
Departments should start with compulsory blood samples to check BAC at hospitals and
should penalise drivers with BAC over the legal limit. Furthermore, a police enforcement
programme should start by investigating about venues where alcohol could be available to
the public (hotels and tourist entertainment venues) and focus on the roads closer to these
venues. This programme could, later, be expanded to cover more road networks and have
random drivers’ screening tests which will help in reducing the incidence of drinking and
driving and will also help in collecting more data on this problem for research purposes [92,
93].
- Publicity:
Since the drink driving issue is relatively new in Oman, public awareness and education on
the problem is extremely important. One of the best and most effective ways to raise public
awareness and educate them about the risks of drinking and driving is mass media
campaigns. Another possible way to raise public awareness is short messages on road signs,
police cars and public transportation vehicles (e.g.: buses). In addition, interviews with
important figures and opinion leaders in the country such as Police officers, celebrities and
religious figures should be an effective measure to educate the public and note the
importance of this problem. Finally, in order to have long-term effective prevention of drink-
driving, its consequences, and road safety in general, this needs to be implemented in the
schools’ curriculum to positively change children’s attitude and behaviour towards road
safety. All the interventions mentioned in this section will not have maximum impact unless
visible regulations and enforcement are being carried out [92, 93].

78 | P a g e
4.4. Future research
This thesis has identified a number of areas where lack of data hampers the developing and
monitoring of interventions to reduce harm for car crash injuries.
4.4.1. National Trauma database
For better definition of the magnitude and burden of Road Traffic Crashes in Oman, more
adequate data collection systems are required. A linked trauma database between tertiary
care hospitals in major cities would enable the gathering of accurate information on RTIs
and evaluate the prevalence of their risk factors. In addition, this database could be linked,
through the national identity number, with the police database in order to cross check the
data and to be able to monitor the efficiency of national RTC prevention campaigns.
Furthermore, the availability of a linked database between hospitals and police will make it
feasible to conduct research on a national level rather than regional as for this research.
4.4.2. Case-control study on risk factors for injuries
In this research, many of the internationally proven risk factors of RTCs were found to be
prevalent in the study population. To identify the relative importance of various modifiable
risk factors in causing car crash injuries in this particular population a case-control study on
risk factors is the most appropriate research design. In this proposed case-control study, the
control group would be a sample of normal drivers, randomly stopped on the side of the
road during normal traffic and asked about the known risk factors. The comparison of
potential risk factors in the injured cases and the usual driving population would allow
quantification of the contribution of the various risk factors to car crash injuries, and
suggest priorities for prevention.
4.4.3. Work-related fatigue and sleepiness research
There are a number of published reports on work-related sleepiness and fatigue as risk
factors for RTCs. However, no epidemiological studies on this topic were carried out in
Oman and specifically in the city of Sohar which has a host of many industrial areas. Fatigue

79 | P a g e
and sleepiness were found to be among the most common contributing risk factors to work-
related crashes [94].
From our study, we found that around 50% of those drivers involved in traffic crashes were
either going to or from work. Thus, it would be critical to investigate the contribution of
work-related fatigue and sleepiness on the drivers and their consequent involvement in a
road traffic crash.
4.4.4. Pre-hospitalisation trauma care research
A significant number of trauma deaths occur outside the hospital environment. Pre-hospital
trauma systems have been shown to be beneficial in reducing mortality, specifically in
middle-income countries [95].
Pre-hospital trauma care focuses specifically on the management of injuries at the scene
and en route to the hospital or health institution. Trauma management of the pre-hospital
environment could be life-saving for road traffic crash victims. A set of questions regarding
pre-hospital trauma care have not been investigated yet in Oman. The first question is
whether pre-hospital trauma care in Oman provides an acceptable coverage to the whole
population or not. The second question is whether an efficient level of trauma management
is being provided in the pre-hospital scene. These questions need to be thoroughly
investigated through controlled research guided and funded by policy makers in Oman. This
research should evaluate the current status of trauma care existing in Oman and, where
necessary, improve and restructure the system and organisations involved.

80 | P a g e
4.4.5. Conclusion
This thesis characterised Oman as a country where motoring is increasing rapidly with a
high incidence of road traffic injuries. Well-recognised risk factors for injuries are prevalent
among injured drivers. Reduction in road traffic injuries will require further developments in
areas of policy and legislation, police enforcement activity and public awareness. There is
considerable international experience that could be drawn upon to achieve this.

81 | P a g e
References 1. Kevin Watkins, Devi Sridhar. Road traffic injuries: The hidden development crisis, A
policy briefing for the First Global Ministerial Conference on Road Safety, Moscow, 19-
20 November 2009. 2. Peden M, et al. The world report on road traffic injury prevention Geneva: World
Health Organization; 2004. 3. Kopits E, Cropper M. Traffic fatalities and economic growth. Washington, DC, The
World Bank, 2003 (Policy Research Working Paper No. 3035). 4. Lozano R, Naghavi M, Foreman K, Lim S, Shibuya K, Aboyans V et al. Global and regional
mortality from 235 causes of death for 20 age groups in 1990 and 2010: a systematic
analysis for the Global Burden of Disease Study 2010. The Lancet 2012;
380(22/29):2095-128. 5. Murray CJL et al. The Global Burden of Disease 2000 project: aims, methods and data
sources [revised]. Geneva, World Health Organization, 2001 (GPE Discussion Paper No.
36). 6. Peden M, McGee K, Sharma G. The injury chart book: a graphical overview of the
global burden of injuries. Geneva, World Health Organization, 2002. 7. Vinand M Nantulya, Michael R Reich. The neglected epidemic: road traffic injuries in
developing countries. BMJ 2002;324;1139-1141. 8. Peden M, McGee K, Krug E, eds. Injury: a leading cause of the global burden of disease,
2000. Geneva, World Health Organization, 2002. 9. Toroyan T, Peden M (eds), Youth and Road Safety, Geneva, World Health Organization,
2007. 10. Lozano R, Naghavi M, Foreman K, Lim S, Shibuya K, Aboyans V et al. GBD 2010:
understanding disease, injury, and risk. The Lancet 2012; 380(22/29):2095-128 11. Ameratunga S, Hijar M, Norton R. Road-traffic injuries: confronting disparities to
address a global-health problem. The Lancet 2006; 367(9521):1533 - 1540. 12. Jacobs G, Aeron-Thomas A, Astrop A. Estimating global road fatalities. Crowthorne,
Transport Research Laboratory, 2000 (TRL Report, No. 445).

82 | P a g e
13. Blanchard, Edward B, Edward J. Hickling, Brian M. Freidenberg, Loretta S. Malta, Eric Kuhn, and
Mark A. Sykes. "Two studies of psychiatric morbidity among motor vehicle accident
survivors 1 year after the crash." Behaviour research and therapy 42, no. 5 (2004): 569-583.
14. Landolt MA, Vollrath ME, Gnehm HE, Sennhauser Fh. Post-traumatic stress impacts on
quality of life in children after road traffic accidents: prospective study.
Australian and New Zealand Journal of Psychiatry 2009; 43(8):746-753. 15. Ameratunga S, Tin Tin S, Coverdale J, Connor J, Norton R. Posttraumatic Stress
Among Hospitalized and Non-hospitalized Survivors of Serious Car Crashes: A
Population-Based Study. PSYCHIATRIC SERVICES 2009; 60(3):402-404. 16. Gudmundsdottir, Berglind, J. Gayle Beck, Scott F. Coffey, Luana Miller, and Sarah A. Palyo.
"Quality of life and post trauma symptomatology in motor vehicle accident survivors:
The mediating effects of depression and anxiety." Depression and anxiety 20, no. 4 (2004):
187-189.
17. Razzak JA. The Eastern Mediterranean Status Report on Road Safety: World Health
Organisation, Regional Office for the Eastern Mediterranean; 2010. 18. Regional Office for the Eastern Mediterranean MA, Health systems priorities in the
Eastern Mediterranean Region: challenges and strategic directions. World Health
Organisation 2004; 51(6):3-11. 19. Al-kharusi W, Update on road traffic crashes: progress in the Middle East. Clinical
Orthopaedics and Related Research 2008; 466(10):2457-2464. 20. Iqbal Z & Fasano U Gcc Countries: From Oil Dependence to Diversification.
Washington : International Monetary Fund; 2003. 21. Bener A, Abu-zidan FM, Bensiali AK, Al-mulla Aa, Jadaan Ks. Strategy to improve road
safety in developing countries, Saudi Medical Journal 2003; 24(6):603-608. 22. The World Bank. Gulf countries. 2011 [cited 2012 Apr 22]. Available from:
http://web.worldbank.org/WBSITE/EXTERNAL/COUNTRIES/MENAEXT/EXTGC/0,men
uPK:6130053~pagePK:141159~piPK:141110~theSitePK:61300. 23. Bener A, Alwash R. A Perspective on Motor Vehicle Crash Injuries and Speeding in the
United Arab Emirates. Traffic Injury Prevention 2010; 3(1):61-64. 24. Bener A, Absood GH, Achan NV, Sankaran-kutti M. Road traffic injuries in Al-Ain City,
United Arab Emirates. The Journal of the Royal Society of the Promotion of Health
1992; 112(6):112: 273.

83 | P a g e
25. Godwin SM, Globalization, Education and Emiratization: A Case Study of the United
Arab Emirates. The Electronic Journal of Information Systems in Developing Countries
2006; 27(1):1-14. 26. Directorate General of Traffic, the Ministry of Interior, United Arab Emirates.
http://www.adpolice.gov.ae/ar/default.aspx. 27. Bendak S, Seat belt utilization in Saudi Arabia and its impact on road accident injuries.
Accident, analysis and prevention 2005; 37(2):367-371.
28. Al-Naami MY, Arafah MA, Al-ibrahim FS. Trauma care systems in Saudi Arabia: an
agenda for action. Annals of Saudi Medicine 2010; 30(1):50–58. 29. Ziyab AH, Incidence and trend of road traffic injuries and related deaths in Kuwait:
2000-2009. International Journal of the Care of the Injured 2011; Electronically-
published ahead of print. 30. Bener A, The neglected epidemic: road traffic accidents in a developing country, State
of Qatar. International Journal of Injury Control and Safety Promotion 2005; 12(1):45-
47. 31. Directorate General of Traffic, the Ministry of Interior, Qatar.
http://www.moi.gov.qa/site/english/departments/TrafficPolice/index.html. 32. Al-madani H, Al-janahi A. Personal Exposure Risk Factors in Pedestrian Accidents in
Bahrain. Safety Science 2006; 44(4):335–347. 33. Traffic Statistics Department. General Directorate of Traffic and Licensing-Ministry of
Interior, [homepage on the Internet]. 2010 [cited 2012 Jun 11]. Available from: Ministry
of Interior, Bahrain, General Directorate of Traffic and Licensing Department Web site:
http://www.traffic.gov.bh/Statistics.asp. 34. Mamtani, Ravinder, Mohammed H. Al-Thani, Al-Anoud Mohammed Al-Thani, Javaid I. Sheikh,
and Albert B. Lowenfels. "Motor vehicle injuries in Qatar: time trends in a rapidly developing
Middle Eastern nation." Injury prevention 18, no. 2 (2012): 130-132.
35. Hosani, Y. Al, M. Stevenson, and M. El Sadig. "The magnitude of the motor vehicle crashes in
the United Arab Emirates during the period 1978–2007." Injury Prevention 16, no. Supplement
1 (2010).
36. Ziyab, Ali H., and Saeed Akhtar. "Incidence and trend of road traffic injuries and related deaths
in Kuwait: 2000–2009." Injury (2011).
37. The Ministry of Tourism. Facts on Oman. 2012 [cited 2012 Apr 21]. Available from:
http://www.omantourism.gov.om/wps/portal/mot/tourism/oman/home/sultanate/

84 | P a g e
facts/!ut/p/c5/jY7JDoIwFEW_hS_oLUNhi1AGgQJWIrIhmBhCwuDCmPj3lrgGfW95cnIP
aYj6uXsNffcclrkbSU0a1jIRpAX3KXKHArF0MialZ4Dril9Z64VuZNopgEPiIU54mZyNjMKl_
9j5qZSB4CZC31K2tEVVWRzQjR_2kTT9uNxU5WXt3u9Y-
d7SyrFxLr58q8W093luEREt0508pqp-
y3goek37AL_ikXY!/dl3/d3/L2dJQSEvUUt3QS9ZQnZ3LzZfOUs3RVMyMDYwT0xCNzBJU
1VIMVNHQjM4MjU!/. 38. Hasan AM, Al Zidjali YK, Al Jabri MH. Final Results of Census 2010, [database on the
Internet]. 20/06/2011 [cited 2012 Jun 11]. Available from: Supreme Council for Planning,
National Center for Statistics and Information Web site:
http://http://www.moneoman.gov.om/viewPublication.aspx?id=781 39. Plekhanov S. A Reformer on the Throne: Sultan Qaboos Bin Said Al Said. : Trident Press
Ltd; 2004. 40. Al-azri NH, Emergency Medicine in Oman: Current Status and Future Challenges.
International Journal of Emergency Medicine 2009; 2(4):199-203.
41. Traffic Statistics Report (1971-2009), Directorate General of Traffic planning. Royal
Oman Police. Sultanate of Oman. 42. Al-Maniri, Abdullah Ali Nasser, Hamed Al-Reesi, Ibrahim Al-Zakwani, and Muazzam Nasrullah.
"Road Traffic Fatalities in Oman from 1995-2009: Evidence from Police Reports." International
Journal of Preventive Medicine (2012).
43. Mohan D, Tiwari G, Khayesi M. The Road Traffic Injury Prevention Training Manual,
2006. The Transport Research and Injury Prevention Programme (TRIPP) of The Indian
Institute of Technology and WHO, 44. Petridou E, Moustaki M. Human factors in the causation of road traffic crashes.
European Journal of Epidemiology 2001; 16(1):819-882. 45. Finch DJ et al. Speed, speed limits and accidents. Crowthorne, Transport Research
Laboratory, 1994 (Project Report 58) 46. Wilson C, Willis C, Hendrikz JK, Bellamy N. Speed enforcement detection devices for
preventing road traffic injuries. Cochrane Database Systematic Reviews 2006; 19(1):1-
57. 47. Ryeng EO, The effect of sanctions and police enforcement on drivers' choice of speed.
Accident; analysis and prevention 2012; 45(1):446–454. 48. Abbas AK, Hefny AF, Abu-zidan FM. Seatbelts and road traffic collision injuries.

85 | P a g e
World Journal of Emergency Surgery 2011; 6(18):1-6. 49. Istre GR, Stowe M, Mccoy MA, Moore Bj, Culica D, Womak Kn, et al. A controlled
evaluation of the WHO Safe Communities model approach to injury prevention:
increasing child restraint use in motor vehicles. Injury Prevention 2010; 17(1):3-8. 50. Du W, Finch CF, Hayen A, Bilston L, Brown J, Hatfield J. Relative benefits of population-
level interventions targeting restraint-use in child car passengers. Perdiatrics 2010;
125(2):304-12.
51. Stübig T, Petri M, Zeckey C, Brand S, Müller C, Otte D, et al. Alcohol intoxication in road
traffic accidents leads to higher impact speed difference, higher ISS and MAIS, and
higher preclinical mortality. Alcohol J 2012; 46(7):681-686. 52. Connor J, Norton R, Ameratunga S, Jackson R. The contribution of alcohol to serious car
crash injuries. Epidemiology 2004; 15(3):337-344. 53. Taylor B, Irving HM, Kanteres F, Room R, Borges G, Cherpitel C, et al. The more you
drink, the harder you fall: a systematic review and meta-analysis of how acute alcohol
consumption and injury or collision risk increase together. Drug and alcohol
dependence 2010; 110(1-2):108-116.
54. Almarri TS, Oei TP. Alcohol and substance use in the Arabian Gulf region: a review.
International Journal of Psychology 2009; 44(3):222-233. 55. Drivers Fatigue and Road Accidents A Literature review and Position Paper. The Royal
Society for the Prevention of Accidents 2010 56. Mcdonald N, Åkerstedt T, Garo C, Hamelin P, Ouwerkerk F. The Role of Driver Fatigue in
Commercial Road Transport Crashes. European Transport Safety Council 2001; :1-36
57. Connor J (2010) The role of driver sleepiness in car crashes: a systematic review of
epidemiological studies, in Sleep, Sleepiness and Traffic Safety (Verster J, George C
eds), pp Chapter 3, Nova Science Publishers. 58. Connor J, Norton R, Ameratunga S, Robinson E, Civil I, Dunn R, Bailey J, Jackson R (2002)
Driver sleepiness and risk of serious injury to car occupants: population based case
control study. British Medical Journal 324:1125-1129.
59. Violanti JM, Cellular phones and fatal traffic collisions. Accident; Analysis and
Prevention 1998; 30(4):519-524.

86 | P a g e
61. Bryson, Alex and Forth, John (2007) Are there day of the week productivity effects?
Manpower Human Resources Lab discussion paper, 4. Manpower Human Resource Lab,
London School of Economics and Political Science, London, UK. 62. Internations Organisation 2012, Transportation in Oman, [cited 2012 Oct 22]. Available
from:
http://www.internations.org/oman-expats/guide/living-in-oman-15747/transportation-
in-oman-3. 63. Royal Oman Police, Legal Affairs Department, Legislation Series – Part Four, Traffic
Law1993, 1-149. 64. Royal Oman Police. Royal Oman Police Website. 2013 [cited 2012 Aug 17]. Available
from: http://www.rop.gov.om/english/organization.asp. 65. Ministry of Health, Oman. Regional health care providers, 2013 [cited 2012 Aug 12].
Available from: http://www.moh.gov.om/en/health_services/mapLarge.php 66. Ziyab AH, Akhtar S. Incidence and trend of road traffic injuries and related deaths in
Kuwait: 2000-2009. Injury 2012; 43(12):2018-22.
67. Bos N, Reurings M, and Derriks H. Correction for underreporting of road traffic
casualties in the Netherlands; relevance and method. Proceedings of the 4th Annual
Meeting of the International Road Traffic and Accident Database, Seoul, South Korea.
2009. 68. Amoros E, Martin J, Laumon B. Under-reporting of road crash casualties in France.
Accident; Analysis and Prevention 2006; 38(4):627-635. 69. Zhang X, Xiang H, Jing R, Tu Z. Road traffic injuries in the People's Republic of China,
1951-2008. Traffic Injury Prevention 2011; 12(6):614-620. 70. Speed management: a road safety manual for decision-makers and practitioners.
Geneva, Global Road Safety Partnership, 2008
71. Afukaar FK, Speed control in developing countries: issues, challenges and
opportunities in reducing road traffic injuries. Injury Control and Safety Promotion
2003; 10(1-2):77-81. 72. DeAngelo, Greg, and Benjamin Hansen. Life and death in the fast lane: Police
enforcement and roadway safety. 2010.

87 | P a g e
73. Debnath, Ashim Kumar, Ross A. Blackman, and Narelle L. Haworth. "A review of the
effectiveness of speed control measures in roadwork zones." (2012). 74. Novoa AM, Santamariña-rubio E, Marí-dell'olmo M, Ferrando J, Peiró R, Tobías A, et al.
Impact of the penalty points system on road traffic injuries in Spain: a time-series
study. American Journal of Public Health 2010; 100(11):2220-2227. 75. Wilson C, Willis C, Hendrikz JK, Le Brocque R, Bellamy N. Speed cameras for the
prevention of road traffic injuries and deaths. Cochrane Database Systematic Reviews
2010; 10(11):1-3. 76. Scott, A. (2010). The Effect of Police Enforcement on Road Traffic Accidents
(Doctoral dissertation, Edinburgh Napier University). 77. Phillips RO, Ulleberg P, Vaa T. Meta-analysis of the effect of road safety campaigns on
accidents. Accident; Analysis and Prevention 2011; 43(3):1204-1218. 78. Charlton SG, Mackie HW, Baas PH, Hay K, Menezes M, Dixon C. Using endemic road
features to create self-explaining roads and reduce vehicle speeds. Accidents; Analysis
and Prevention 2010; 42(6):1989-1998.
79. Soori H, Nasermoadeli A, Ainy E, Hassani Sa, Mehmandar Mr. Association between
mandatory seatbelt laws and road traffic injuries in Iran. The Southeast Asian journal
of tropical medicine and public health 2011; 42(6):1540-1545. 80. Abbas AK, Hefny AF, Abu-zidan FM. Seatbelt compliance and mortality in the Gulf
Cooperation Council countries in comparison with other high-income countries. Annals
of Saudi medicine 2011; 31(4):347-350. 81. Carpenter CS, Stehr M. The effects of mandatory seatbelt laws on seatbelt use, motor
vehicle fatalities, and crash-related injuries among youths. Journal of Health Economics
2008 27(3): 642-662.
82. Cohen A, Einav L. The effects of mandatory seat belt laws on driving behavior and
traffic fatalities. Review of Economics and Statistics 2003, 85(4): 828-843.
83. Seat-belts and child restraints: a road safety manual for decision-makers and
practitioners. London, FIA Foundation for the Automobile and Society, 2009
84. Australian Road Rules 2010, Regulation 265 wearing of seatbelts, [cited 2012 Nov
14]. Available from:
http://www.austlii.edu.au/au/legis/nsw/repealed_reg/arr210/s265.html

88 | P a g e
85. Transport Canada, Road Safety and Motor Vehicle Regulation with support from the
Public Health Agency of Canada. 2011; 1-44. 86. Adler N, Hakkert AS, Kornbluth J, Sher M. Lean management for traffic-police
enforcement planning. Policing: An International Journal of Police Strategies &
Management 2012, 35(4); 1-1. 87. Salzberg PM, Moffat JM. Ninety five percent: an evaluation of law, policy, and
programs to promote seat belt use in Washington State. Journal of Safety Research
2004, 35(2); 215-222. 88. Bruce BS, Snowdon AW, Cunningham C, Cramm C L, Whittle K, Correale H, et al. 2011.
Predicting parents' use of booster seats. Injury Prevention, 17(5); 313-318. 89. Zaza S, Sleet DA, Thompson RS, Sosin DM, Bolen JC. Reviews of evidence regarding
interventions to increase use of child safety seats. American Journal of Preventive
Medicine 2001, 21(4); 31-47. 90. Ministry of Transport, New Zealand’s road safety strategy 2010–2020. 2010. 91. Win DT. Breath Alcohol Testers-Prevents Road Accidents. AU Journal of Technology
2006, 10(2); 75-80.
92. Taylor B, Irving HM, Kanteres F, Room R, Borges G, Cherpitel C, et al. The more you
drink, the harder you fall: a systematic review and meta-analysis of how acute alcohol
consumption and injury or collision risk increase together. Drug and alcohol
dependence 2010, 110(1); 108-116. 93. Drinking and Driving: a road safety manual for decision-makers and practitioners.
Geneva, Global Road Safety Partnership, 2007.
94. Robb, G., Shaheen Sultana, Shanthi Ameratunga, and R. Jackson. "A systematic review of
epidemiological studies investigating risk factors for work-related road traffic crashes and
injuries." Injury Prevention 14, no. 1 (2008): 51-58.
95. Henry, Jaymie Ang, and Arthur Lawrence Reingold. "Prehospital trauma systems reduce
mortality in developing countries: A systematic review and meta-analysis." The Journal of
Trauma and Acute Care Surgery 73, no. 1 (2012): 261-268.

89 | P a g e
Appendix
The Sohar study questionnaire:
Questionnaire No. : Date:
Socio-demographic information:
1. Date:
2. Day:
1. Monday
2. Tuesday
3. Wednesday
4. Thursday
5. Friday
6. Saturday
7. Sunday
3. Gender: Male Female
4. Age:
5. Where did the crash happen?
6. How many vehicles were included in the crash?
1. One
2. Two
3. Three or more
4. Don’t know
7. Which vehicle do you think was at fault?
1. Your vehicle
2. Another vehicle
3. Both vehicles

90 | P a g e
4. No vehicles fault
5. Don’t know
8. Were you wearing your seatbelt at the time of the crash?
1. No
2. Yes
3. Don’t know
9. What were you wearing on your feet at the time of the crash?
1. Nothing
2. Jandals/clogs/scuffs
3. High heels
4. Gumboots/work boots
5. Other
6. Don’t know
10. Had you driven on this road before?
1. No
2. <5 times
3. Between 5 and 100 times
4. >100 times
5. Don’t know
11. What was the main reason for this trip?
1. Just driving aroun
2. Going to/from work
3. Working.
4. Other please specify------------------------------------------------
5. Don’t know/decline to answer

91 | P a g e
12. How fast do you think you were travelling immediately before you were aware of the
crash?
Kms/hr
13. How long had you been driving before the crash? Hours mins
14. In the week before the crash, how many nights did you sleep 7 hours or more
Out of 7
15. Which of the following best describes your level of alertness in the 15 minutes prior to
the crash:
1. Felt active, wide awake.
2. Was functioning at a high level but not at peak
3. Felt relaxed, awake but not fully alert, responsive
4. Felt a little foggy headed
5. Felt a little foggy headed, had difficulty staying awake, was beginning to lose
track
6. Felt sleepy, would have preferred to lie down, woozy
7. Could not stay awake, sleep onset was imminent
8. Don’t know 16. How would you describe that on a scale from one to ten, where one is tired and 10 is
fresh?
17. Do you think you might have fallen asleep immediately before the crash?
1. No
2. Yes
3. Possibly
4. Don’t know

92 | P a g e
Potential Risk Factors:
Were you doing any of the following at the time of the crash?
18. Using a handheld cell phone
1. No
2. Yes
3. Don’t know
19. Smoking or lighting a cigarette
1. No
2. Yes
3. Don’t know
20. Adjusting radio or CD/cassette player, or inserting CD/cassette
1. No
2. Yes
3. Don’t know
21. Attending to passengers
1. No
2. Yes
3. Don’t know
22. Adjusting windows/air conditioners
1. No
2. Yes
3. Don’t know
23. Other activity
1. No
2. Yes please specify--------------------------------
3. Don’t know

93 | P a g e
24. How many other people were with you in the car? 25. Can you tell the age of each of these people, where they were seated, and whether
they were wearing a seatbelt:
Person 1
Person 2
Person 3
Person 4
Person 5
26. At the time of the crash….. Was it dark?
1. No
2. Yes
3. Don’t know
27. Was it raining?
1. No
2. Yes
3. Don’t know
28. Was there head-on glare from the sun?
1. No
2. Yes
3. Don’t know
29. Was the road wet?
1. No
2. Yes
3. Don’t know

94 | P a g e
Personal factors:
30. In general, would you say your health was:
1. Excellent
2. Very good
3. Good
4. Fair
5. Poor
31. How long do you usually sleep each 24 hours?
Hours mins
32. Do you usually awake refreshed?
1. No
2. Yes
3. Don’t know
33. Have you ever been told that you regularly snore loudly?
1. No
2. Yes
3. Don’t know
Migraine:
34. Has a doctor ever told you that you have migraines?
1. No
2. Yes
3. Don’t know

95 | P a g e
35. In the past year have you experienced recurrent headaches that last for more than
4 hours and less than 3 days, and which stop or decrease your daily activities?
1. No
2. Yes
3. Don’t know
Medications:
36. How often do you take sleeping tablets to help you sleep?
1. Never
2. Less than once a month
3. 2-4 times a month
4. 5-15 times a month
5. At least every second day
6. Don’t know
37. Had you taken any sleeping tablets during the 24 hours before the crash?
1. No
2. Yes
3. Don’t know
38. At the time of the crash, were you taking regular medications for depression
or anxiety?
1. No
2. Yes
3. Don’t know
39. If yes, did you start the medication in the six weeks before the crash?
1. No
2. Yes
3. Don’t know

96 | P a g e
40. Which of the following are you?
1. Right handed
2. Left handed
3. No preference for left or right
4. Don’t know
41. How much do you weigh?
Kg
Driving experience:
42. What type of car licence do you hold a present?
1. Never had a car license
2. Disqualified/suspended
3. Full car licence
4. Don’t know
43. During an average week before the crash, how many hours would you spend
driving a car or van on the road?
1. 5 hours or less
2. 6-10 hours
3. 11-20 hours
4. 21-30 hours
5. More than 30 hours
6. Don’t know
44. During an average week before the crash, how far would you drive a car or a van
on the road?
1. 10 kms or less
2. 10-100 kms
3. 100-300 kms
4. 300-500 kms
5. More than 500 kms
6. Don’t know

97 | P a g e
45. Before the crash, how often would you drive above the posted speed limit?
1. Always or nearly always
2. Often
3. Sometimes
4. Never or almost never
5. Don’t know
46. Before the crash, how often would you wear a seat belt when you were driving a
car?
1. Never or almost never
2. Sometimes
3. Often
4. Always or nearly always
5. Don’t know
47. During the last 12 months, how often did you race in a motor vehicle for
excitement?
1. Several times
2. Once or twice
3. Never
4. Don’t know
48. Over the past 5 years, how many times have you been involved in a crash when you
were driving and someone was injured requiring medical attention?
49. In the past 5 years, how many traffic convictions have you had?

98 | P a g e
Vehicle details:
50. Is the car registered in your name?
1. No
2. Yes
3. Don’t know
51. At the time of the crash, was the car insured?
1. No
2. Yes
3. Don’t know
52. Has the car been professionally serviced in the past 12 months?
1. No
2. Yes
3. Don’t know
53. Are seat belts fitted in the car?
1. Front and rear
2. Front only
3. No seat belts
4. Don’t know
54. Has the car been modified? ( for example; suspension raised or lowered, wide
tyres, loud muffler)
1. No
2. Yes
3. Don’t know
55. How old are the tires?
1. < 1 year
2. 1-4 years
3. > 4 years

99 | P a g e
4. Don’t know
56. When was the last time you checked the brake system?
1. < 6 months
2. 1 year
3. 2-3 years
4. > 3 years
5. Never
6. Don’t know
Background information:
57. Which of the following best describes your job situation at the time of the crash?
1. Full time work for pay
2. Part time work for pay
3. Student
4. Unemployed
5. Homemaker
6. Retired
7. Other please specify-------------------------------------------------------------------
----
8. Don’t know

100 | P a g e
The ethical approval from the Ministry of Health, Oman: