Characteristics of large Martian dust devils using Mars Odyssey
48
Open Research Online The Open University’s repository of research publications and other research outputs Characteristics of large Martian dust devils using Mars Odyssey Thermal Emission Imaging System visual and infrared images Journal Item How to cite: Towner, Martin (2009). Characteristics of large Martian dust devils using Mars Odyssey Thermal Emission Imaging System visual and infrared images. Journal of Geophysical Research: Planets, 114(e2) E02010. For guidance on citations see FAQs . c 2009 American Geophysical Union Version: [not recorded] Link(s) to article on publisher’s website: http://dx.doi.org/doi:10.1029/2008JE003220 Copyright and Moral Rights for the articles on this site are retained by the individual authors and/or other copyright owners. For more information on Open Research Online’s data policy on reuse of materials please consult the policies page. oro.open.ac.uk
Transcript of Characteristics of large Martian dust devils using Mars Odyssey
Open Research OnlineThe Open University’s repository of research publicationsand other research outputs
Characteristics of large Martian dust devils using MarsOdyssey Thermal Emission Imaging System visual andinfrared imagesJournal ItemHow to cite:
Towner, Martin (2009). Characteristics of large Martian dust devils using Mars Odyssey Thermal EmissionImaging System visual and infrared images. Journal of Geophysical Research: Planets, 114(e2) E02010.
For guidance on citations see FAQs.
c© 2009 American Geophysical Union
Version: [not recorded]
Link(s) to article on publisher’s website:http://dx.doi.org/doi:10.1029/2008JE003220
Copyright and Moral Rights for the articles on this site are retained by the individual authors and/or other copyrightowners. For more information on Open Research Online’s data policy on reuse of materials please consult the policiespage.
oro.open.ac.uk
1
Characteristics of large Martian dust devils using Mars Odyssey Thermal 1
Emission Imaging System Visual and Infrared images. 2
3
M.C. Towner (1)* 4
5
(1) Planetary and Space Sciences Research Institute, Open University, Walton Hall, 6
Milton Keynes, MK7 6AA, UK 7
8
Index terms: 9
3314 Atmospheric Processes: Convective processes 10
5405 Planetary Sciences: Solid Surface Planets: Atmospheres 11
5445 Planetary Sciences: Solid Surface Planets: Meteorology 12
6225 Planetary Sciences: Solar System Objects: Mars 13
6213 Planetary Sciences: Solar System Objects: Dust 14
15
16
*Corresponding author 17

2
Abstract 18
A search for martian dust devils has been carried out, using Mars Odyssey Thermal 19
Emission Imaging System (THEMIS) visible-wavelength images. Simultaneous THEMIS 20
thermal infrared wavelength images were then processed and analyzed, to investigate the 21
thermal properties of the dust devils observed. 3079 images were checked, concentrating 22
on northern spring, summer and autumn (LS from 0° to 270
°, 20
°S to 50
°N). Mars Express 23
High Resolution Stereo Camera, Mars Global Surveyor Mars Orbiter Camera and other 24
THEMIS visible images were used for comparison to potentially rule out any ambiguous 25
geological features. Eight clear examples of dust devils have been found in five separate 26
images, with a comparable number of unconfirmed possible devils. The rarity of dust 27
devils observed is believed to result from a combination of the difficulty in identifying 28
dust devils in medium resolution THEMIS data, and that the Mars Odyssey orbit flyover 29
local time is later in the afternoon than would be optimum for dust devil searching. The 30
temporal distribution of dust devil activity appears to be weighted more towards later 31
afternoon, compared to Earth, but this may be a sampling effect due to size variation with 32
time of sol, greater coverage later in the sol, or the small-number statistics. The thermal 33
infrared images indicate that the lofted dust in the column is cooler than the surrounding 34
surface, and must be equilibrating with the atmosphere in the dust devil. This energy 35
transfer is estimated to be about 10% of the heat flux energy that is available to drive the 36
systems. The ground shadowed by the dust column also appears colder than the 37
surroundings, due to reduced solar illumination. From the visible-wavelength images, the 38
shadows of the dust columns were used to estimate the column opacity, which in turn 39
gave estimates of the dust loadings, which ranged from 1.9x10⁻⁵
to 1.5x10⁻⁴
kg m-3
, 40

3
similar to lander-based observations. No thermal or visible trails are associated with the 41
dust devils, indicating that the surface equilibrates quickly after the devil has passed, and 42
that track counting as a dust devil survey technique must underestimate dust devil 43
populations and consequently dust loading calculations, confirming previous work. 44
1. Introduction 45
Early studies of arid environments have noted the presence of convective vortices 46
and dust devils [Baddeley, 1860; Flower, 1936], and their formation and occurrence has 47
been studied for many years [Balme and Greeley, 2006; Fitzjarrald, 1972; Kaimal and 48
Businger, 1970; Ryan and Carroll, 1970; Sinclair, 1966; Snow, 1987]. Convective 49
vortices are symptomatic of atmospheric instability, requiring strong insolation to form 50
[Ryan and Carroll, 1970; Ryan, 1972]. They have a low pressure, hot core, and a 51
tangential wind gradient, and if powerful enough they are capable of entraining surface 52
material and becoming dust devils. Terrestrial dust devil investigations have taken on a 53
new interest relatively recently, primarily due to the observations of dust devils on Mars. 54
Dust devils appear to be a ubiquitous process on Mars, having been visually 55
observed by the Viking Orbiters [Thomas and Gierasch, 1985], Mars Global Surveyor 56
[Cantor et al., 2001; Malin and Edgett, 2001], Mars Odyssey [Cushing et al., 2005], 57
Mars Express [Stanzel et al., 2006; Stanzel et al., 2008], and the landers Mars Pathfinder 58
[Metzger et al., 1999] and the Mars Exploration Rovers [Greeley et al., 2004]. Currently, 59
the surface boundary layer wind speeds on Mars are considered borderline to be sufficient 60
to initially loft fine dust particles into the atmosphere [Greeley and Iversen, 1985], 61
therefore particle lofting by impact saltation, including dust devil action, has been posited 62
as one of the main mechanisms for moving and redistributing dust on Mars. 63
4
Consequently, they may be potentially hazardous to both robotic and manned missions to 64
Mars. Terrestrial studies also indicate their potential to degrade the air quality, and 65
occasionally damage light aircraft [Hess and Spillane, 1990]. 66
Dust devils on Mars are believed to form and to be influenced by identical factors 67
to those on Earth [Renno et al., 1998], and detailed study of this hypothesis will enable 68
terrestrial analogues and modeling to be successfully applied to Mars. Several diagnostic 69
features such as size and temporal frequency statistics, and the detailed structure of the 70
dust devil (the nature of temperature, wind and pressure changes within it) have been 71
considered theoretically [Renno et al., 1998] and directly compared between Mars and 72
Earth (see [Balme and Greeley, 2006; Cantor et al., 2006] and references therein for a 73
review). A dust devil is special case of a convective vortex, and one meteorological 74
diagnostic of a convective vortex is the presence of a hot core [Fitzjarrald, 1973; Ives, 75
1947; Kaimal and Businger, 1970; Ringrose et al., 2003; Sinclair, 1964; 1973; Tratt et 76
al., 2003]. Data from the Mars Odyssey Thermal Emission Imaging System (THEMIS) 77
offers the opportunity to provide insight into this structure from orbit, as this instrument 78
observes simultaneously in visible wavelengths and in the thermal infrared. This provides 79
the potential to extract the dust devil’s core temperature, provided the core is large 80
enough to be clearly resolved (i.e. greater than 100 m across). To investigate this, a 81
targeted survey for dust devils on Mars was performed, intended to capture well-observed 82
exceptionally large dust devils. 83
The statistics generated while searching for dust devils using THEMIS also help to 84
address the issue of dust devil activity as a function of time of day; THEMIS is well 85

5
suited to this type of activity, as the instrument has moderate resolution and large 86
coverage. The THEMIS instrument is summarized in [Christensen et al., 2004]). 87
On Earth, dust devils usually form in dry areas, such as deserts, on sunny days in 88
spring or summer [Cooley, 1971]. Surface heating is needed, but the atmospheric thermal 89
gradient (driven by the ground-air temperature difference) is more important than 90
absolute high temperatures, as dust devils have been recorded in sub-arctic climate where 91
the air temperature was about 18°C [Grant, 1949]. Most terrestrial dust devils are less 92
than 150 m tall and last only a few minutes, with exceptional observations of dust devils 93
up to a few thousand meters in height lasting up to an hour [Ives, 1947]. 94
On Mars, similar formation criteria are expected, but due to the different 95
atmospheric environment (e.g. a larger boundary layer, and smaller Grashof number, 96
[Fuerstenau, 2006]), they tend to be larger. It is possible that the generally lower thermal 97
inertia of the martian surface means that it responds faster than the Earth to insolation 98
changes, which in turn implies that dust devils may begin to form earlier than on Earth, 99
and peak during midday to early afternoon. This appears to be supported by the limited 100
number of lander observations; Ringrose et al. [2003] discussed convective vortices at the 101
Viking Lander 2 site as early as 10 am, with a relatively flat temporal distribution, while 102
Mars Pathfinder data [Murphy and Nelli, 2002] shows a peak vortex rate at midday. 103
However, these meteorological instruments are measuring convective vortices, and 104
inferring the presence of true dust devils, so caution must be taken in comparing them to 105
visual observations of dust devils. On the Earth, the temporal distribution of dust devils 106
shows a distinct skew towards the afternoon [Sinclair, 1969]. THEMIS data can also help 107
to determine this temporal distribution on Mars, as it has a different local time of day 108

6
flyover to earlier orbital surveys [Cantor et al., 2006; Fisher et al., 2005]. A clear 109
observation of a dust devil in THEMIS will simultaneously quantify dust devil 110
dimensions, dust loading, and temperatures allowing comparison with terrestrial work. 111
2. Previous martian studies 112
On Earth, the larger dust devils are approximately 50-100 m in diameter and over a 113
kilometer high [Balme and Greeley, 2006; Bell, 1967]. These are small compared to 114
Mars, where dust devils have been observed that are over 1 km across and up to 10 km 115
high [Fisher et al., 2005; Thomas and Gierasch, 1985]. Tracks left by the passage of dust 116
devils leave behind appear to be ubiquitous across Mars, and active vortices have been 117
recorded in data from almost all Mars missions, including landers equipped with 118
meteorology instrumentation or suitable imaging sensors. The two Viking Landers 119
detected vortices in the late 1970s by their meteorological signal [Ryan and Lucich, 120
1983]. Ryan and Lucich’s analysis has shown that the Viking Landers appeared to 121
encounter about 0.6 dust devils per sol, as compared to the 2 dust devils per sol found in 122
the Pathfinder data [Murphy and Nelli, 2002; Ringrose et al., 2003]. 123
In 1999, the Mars Pathfinder lander took images in which five different dust devils 124
were ultimately identified [Metzger et al., 1999], although Ferri et al. [2003] has 125
expanded upon this number. More recent orbital images acquired by the Mars Global 126
Surveyor Mars Orbiter Camera (MOC) detected many dust devils, allowing detailed 127
viewing and statistics to be generated [Cantor et al., 2006; Fisher et al., 2005]. Estimates 128
of dust devil movement traverse velocity have been made by Mars Express High 129
Resolution Stereo Camera (HRSC) [Stanzel et al., 2006], giving speeds on the order of 130
20 ms-1
. Mars Reconnaissance Orbiter has imaged dust devils at pixel resolutions of 131

7
about 6 m, (using the High Resolution Imaging Science Experiment, HiRISE), and at 132
20 m, (using the Context Camera, CTX), as noted on the mission web page but not as yet 133
formally published. Dust devils appear to be very common on Mars: Thomas and 134
Gierasch [1985] identified almost 100 dust devils in Acidalia Planitia in the Viking 135
Orbiter images, although resolution limitations may have obscured the smaller dust 136
devils. Additionally they appear to often leave tracks behind them on the martian surface 137
[Edgett and Malin, 2000], at nearly all latitudes [Balme et al., 2003b; Cantor and Edgett, 138
2002; Whelley and Greeley, 2006]. 139
Of most interest to this study is the recent publication by [Cushing et al., 2005], 140
which reports the first detection of a dust devil in both THEMIS visible and infrared (and 141
the only detection by THEMIS published to date). This particular dust devil had a 142
diameter of approximately 375 m, but is only weakly visible in the infrared data. 143
Intriguingly, it was detected at an altitude of more than 16 km above the Mars datum, 144
where the atmospheric pressure is very low (about 1 mbar), and also occurred relatively 145
late during the day (a local time of 16:06). 146
3. Approach 147
3.1 The THEMIS Instrument 148
The THEMIS Instrument is comprised of two parallel systems; a thermal infrared 149
(IR) emission imager and a visible-wavelength imager [Christensen et al., 2004]. Visible-150
wavelength images have resolutions of 18, 36 or 72 m/pixel, compared to the infrared at 151
about 100 m/pixel. The two parallel multi-spectral systems operate independently, and 152
can be used to observe the same target simultaneously. Standard radiometrically 153

8
calibrated images from the THEMIS dataset can be obtained from the public domain 154
NASA Planetary Data System (PDS) online archive. 155
The visible-wavelength imager can observe in five bands, but typically only band 3 156
is used (centered at 654 nm). The infrared imager can observe ten bands, between 157
6.78 µm and 14.88 µm, with each differing in its ability to highlight different surface (or 158
atmospheric) features [Christensen et al., 2004]. IR bands 3 (7.93 µm) and 5 (9.35 µm) 159
are believed to have the best contrast for detection of surface dust movement and 160
transient features, based on spectral modeling work and previous observations of 161
suspended dust [Cushing et al., 2005; Smith et al., 2003]. As noted by [Brumby et al., 162
2003], band 3 is mostly insensitive to water and the atmosphere, and can be used for a 163
good visualization of the ground surface, while the appearance of dust is enhanced in IR 164
band 5 (due to the atmospheric dust strongly absorbing photons at 9.35 µm). Using 165
Stephan’s law (assuming a fixed surface emissivity and a transparent atmosphere) and the 166
infrared data, a brightness temperature image of the surface (in Kelvin) can be 167
constructed; this is provided as a derived data product on the NASA PDS for each 168
infrared image. 169
3.2 Image selection and treatment 170
Considering the resolution of THEMIS IR observations, it is clear that directly 171
detecting medium size (a few 100 m) dust devils would not be easy. Hence we decided to 172
look initially in the higher resolution visible-wavelength imagery, and then compare to 173
the infrared, whilst using other observations from THEMIS and other missions to rule out 174
permanent or ambiguous geological features. This technique is supported by the results of 175
[Cushing et al., 2005] where the dust devil seen has a diameter of 375 m, and is clearly 176

9
resolved in the visible-wavelength data, but shows only a minor deviation from surface 177
emissivity in the infrared image. 178
We decided that a semi-targeted search of particular regions was likely to be the 179
most successful approach. The criteria for targeting consideration were based on two 180
questions; ‘will there be dust devils there, and will they be observable in the visible and 181
the infrared data?’ As such, ‘borderline’ dust devil producing areas, which might lack the 182
required atmospheric instability and only produce a few dust devils (and hence very few 183
exceptionally large dust devils) were not included [Ryan and Carroll, 1970]. The search 184
therefore focused on areas previously noted as major dust devil producing areas with 185
large dust devils observed, for example the Amazonis region [Cantor et al., 2002; Cantor 186
et al., 2006; Fisher et al., 2005]. The study region should also be close to the equator, as 187
this is where conditions are most suitable for dust devil formation [Biener et al., 2002]. 188
However it is also important to consider a large enough percentage of the martian surface 189
in order to give a reasonable chance of success and to produce statistically meaningful 190
results. 191
With this in mind, a latitude range of 20°S to 50
°N was selected, over the full 192
longitude range, which favors warm areas and maximum levels of light per sol. 193
(Although dust devil tracks are generally seen to be maximum in the 40-60 latitude bands 194
[Balme et al., 2003a; Whelley and Greeley, 2006], they are seen at all lower latitudes.) 195
Dust devil activity is highest in the spring and summer, so images acquired between solar 196
longitude (Ls) 0° to 270
° (northern spring, summer and autumn) were used. Obviously 197
dust devils will not occur at night, and the largest are expected to occur during the 198

10
brightest daylight hours, so only images acquired between local times of 11:00 to 16:30 199
were considered. 200
These constraints were applied to a search of the NASA PDS, and images were 201
retrieved from the PDS and analyzed systematically at increasing magnification, 202
investigating and recording features of interest at greater detail as required. Potential 203
candidates were identified initially based on the criteria of just the presence of a dust 204
cloud like object. These candidates were then compared with images of the same regions 205
taken by HRSC, MOC, Mars Reconnaissance CTX, or other THEMIS data to confirm the 206
presence of a dust devil (dust devils are transient features, and should not appear in other 207
images of the same location acquired at different times). In a small number of cases, there 208
were no comparable images. Those candidates were discarded from the list of confirmed 209
dust devils, but are considered separately later. Rejection was based on a judgment that 210
these particular anomalies were ambiguous – the features lacked a clear shadow, or a 211
clear track/trail, and lacked structure indicating a dust column; if they were dust related, 212
rather than geomorphological, then they were most likely dust flurries or fronts, lacking 213
convective vorticity. 214
The visible representations of confirmed dust devils were then analyzed in detail; 215
where possible the height of the dust devil was calculated using the shadow projection 216
and the Solar Incidence angle (from the PDS label). Diameter was directly measured 217
from the image. 218
Simultaneous observations through the THEMIS infrared system provide a derived 219
brightness temperature record (BTR) of the same locale. These data give local 220

11
temperatures of the ground and dust devil, providing additional information on dust devil 221
structure. 222
4. Results and discussion 223
4.1 Survey results 224
The PDS search generated 3079 images within the region of interest, from 2002-04-225
18 to 2006-03-03, from THEMIS datasets release_id 0001 to 0017 (the latest release at 226
the time of beginning this work). In reality, observations taken earlier than 16:00 local 227
time are only from the orbit phasing part of the mission, early in the spacecraft lifetime, 228
and there are none after 2002-07-20. Observations with a local time from 16:00 to 16:30 229
are available throughout the mission. Initial analysis revealed 294 candidate images that 230
warranted further investigation. Comparison of coexistent images from a variety of 231
sources as discussed allowed removal of false positives by eliminating features that have 232
not moved between images. Overall, only eight dust devils were reliably detected from 233
five image frames (there are two frames which each have multiple dust devils). The 234
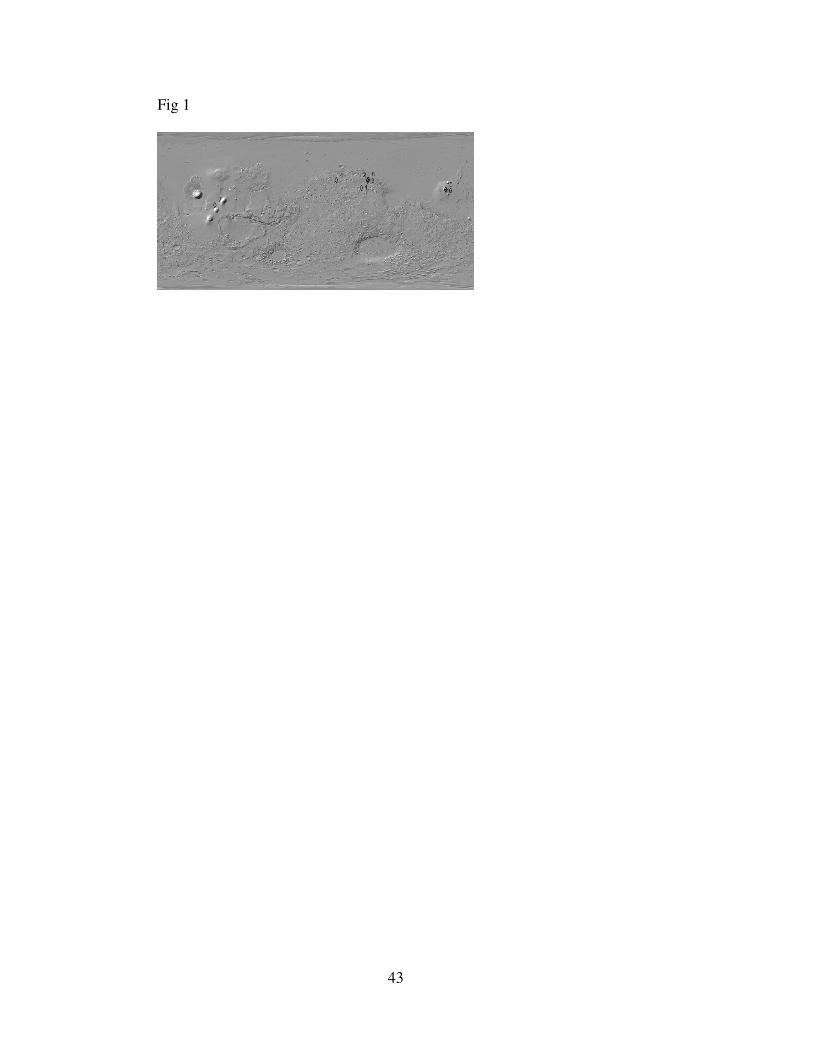
locations of these are shown in Figure 1, and summarized in Table 1. Figure 2 gives 235
detailed images of the dust devils detected, showing both the visible data, and the IR 236
thermal results (discussed later). Due to the conservative approach taken to eliminating 237
false positives, the numbers of dust devils confirmed here probably represents a lower 238
bound, highlighting the clearest, most apparent events, with ambiguous or smaller events 239
excluded. Events that were eventually unconfirmed as dust devils, primarily to a lack of 240
supporting overlapping images are shown in Table 2, and examples of these are shown in 241
Figure 3. These are discussed in more detail later. 242

12
243
<fig 1 here> 244
<table 1 here> 245
<fig 2 here> 246
<table 2 here> 247
<fig 3 here> 248
<table 3 here> 249
250
Only a few active dust devils were detected by THEMIS in this work, suggesting 251
that these detections are of relatively rare exceptional events, requiring a fortuitous 252
combination of size and time of day. No trend is seen with altitude above the Mars 253
datum. In Figure 2, dust devils 5, 6 and 7, appear more ambiguous, and it is possible they 254
are in fact dust fronts or flurries, due to the apparent lack of structure. Dust devils 5 and 6 255
have no clear shadow, so no estimate of height could be made. This ambiguity is 256
somewhat supported by dust devil 7, as close examination of the shadow cast, which 257
although distinct, appears to indicates a lower height than might be expected. It may be 258
that the dust loading is lower later in the day, possibly due to the effect of the time of day 259
itself (a less intense dust devil due to lower illumination), or of course it may just be that 260
these areas happen to have less available dust on the ground to loft. Table 3 summarizes 261
the survey statistics obtained from this search. From this and the PDS image local time 262
statistics, there is a clear observational bias due to the mean flyover time of Mars 263
Odyssey, of about 16:30, such that there are relatively few images to search before 15:30, 264

13
and none before 15:00, when dust devil activity is observed to be higher [Cantor et al., 265
2006; Christensen et al., 2004]. 266
Statistically, it would seem that very few dust devils have been found. As noted by 267
Fisher et al., [2005], very few dust devils occur in the late afternoon on Mars, in contrast 268
to the Earth. The survey of Cantor et al., [2006] using MOC found dust devils in 0.4% of 269
the images studied, far greater than observed here (MOC over-flight is at about 14:00 270
local time). For example, peak rates seen during northern spring in the Syria-Claritas 271
region by [Cantor et al., 2006] were about 1.4x10⁻³
dust devils km-2
, observed between 272
14:00 and 15:00. [Fisher et al., 2005] find very similar peak values for Amazonis 273
Planitia, again using MGS MOC data. One possibility is that the lack of dust devils later 274
in the day is driven by the low surface thermal inertia and the thin atmosphere both 275
loosing heat very quickly once the Sun is past zenith, resulting in less energy to drive the 276
process. Of the 498 dust devils seen by Spirit, [Greeley et al., 2006], only two are after 277
15:30, but there may be some sampling effect due to the observing constraints of the 278
rover, which is permitted to produce more images during the middle of day. When 279
studying terrestrial dust devils in the southwestern USA, Sinclair, [1969] had noted a 280
tendency for larger dust devils to appear later during the day; one might expect this to be 281
applicable to Mars, and this would be consistent with the rate distribution shown in Table 282
3 above. Greeley et al., [2006] detect no trend of diameter with time of day. 283
For comparison, the biggest dust devil seen by Spirit is about 280 m [Greeley et al., 284
2006]. The survey conducted by Fisher et al., [2005] (using MGS MOC Wide Angle 285
images) detected even larger examples, with the largest being about 8.5 km high and 286
about 500 m in diameter. 287

14
This survey concentrated on detecting large well-resolved dust devils that could be 288
visible in the infrared; as such some smaller candidates (that may have been real) were 289
discarded, as they lacked clear diagnostic features (shadow, track etc). This may skew the 290
perceived detection rate. Ultimately the smallest resolvable is 4-8 pixels in the visible 291
(approximately 80-160 m), but any dust devils this small will have very little expression 292
in the lower resolution THEMIS IR image. Table 2 lists dust devil candidates that were 293
ultimately rejected or remain unconfirmed. The majority are rejected purely on the basis 294
of size and image resolution; usually there is one single observation that is just not clear 295
enough to be useful. Figure 3a gives an example of this. In a few cases, signal to noise is 296
insufficient to resolve the candidate clearly against the background structure. Figure 3b 297
shows an example of such a candidate, where there may be changes between the two 298
images, but image saturation prevents confidence that this is a dust devil. Future data 299
releases giving increased coverage may help to clarify the status of some of these 300
candidates. Due to the small numbers of dust devils confirmed, statistics derived from 301
this study are sensitive to the rate of the largest dust devils, and one must be careful in 302
over interpreting such small number statistics. 303
A further consideration is that later afternoon dust devils have been suggested to be 304
less intense and ordered, and more flurry-like [S. M. Metzger, pers. comm., 2005]. 305
Laboratory investigations by Church et al., [1979] and Mullen and Maxworthy, [1977] 306
related the compactness of the structure of tornado-like vortices formed to a ‘swirl ratio’, 307
which compares horizontal to vertical momentum. The swirl ratio will evolve throughout 308
the day, via the atmospheric stability and average wind speeds, so one would expect a 309
variation in dust devil compactness through the day. Terrestrially this is demonstrated by 310
15
considering in Figure 4, where two extremes are presented. One should expect the same 311
variation on Mars, as the underlying mechanism for dust devil formation on the two 312
planets are probably very similar [Renno et al., 1998; Renno et al., 2000]. 313
314
<fig 4 here> 315
316
It should be noted that none of dust devils found here have produced visible tracks. 317
This implies that track-counting alone cannot produce accurate population statistics. This 318
has also been noted by Cantor et al., [2006]. 319
The dust devil observed by Cushing et al., [2005] on Arsia Mons is not captured by 320
this survey: It is within the proscribed latitude range (9.38°S), and local time of day 321
(16:06), but occurred at Ls=341, and as such it could be considered a ‘southern’ dust 322
devil, occurring in southern summer. It would be detected if this survey was repeated 323
with a southern hemisphere orientation. This might be worthwhile, given that the data of 324
Whelley and Greeley, [2006] indicated that the southern hemisphere has more visible dust 325
devil tracks than the northern during peak seasons, per unit area. (see also [Cantor et al., 326
2006]). The Cushing dust devil appears similar in appearance to the later dust devils seen 327
here, with little or no expression in the infrared temperature data. However infrared 328
absorption is weakly seen for this devil in THEMIS band 5, indicating the presence of 329
suspended dust [Smith et al., 2003]. There is clearly no question that the Arsia Mons 330
feature is a dust devil, given its structure: It has a well defined shadow and height, 331
([Cushing et al., 2005], fig 2), whereas the features here suspected to be gusts do not. The 332
high altitude at this point means that the atmosphere is thin, with a low dust loading, and 333

16
hence a low dust opacity. This would have acted to increase the apparent contrast in the 334
IR band 5 and the brightness temperature data; however no temperature excursion is seen. 335
If this structure and temperature difference is typical for this size of dust devils, then it 336
implies that circumstances may have to be exceptionally fortunate at lower altitude for 337
thermal anomalies to be observed, and so in some cases dust devil core temperatures may 338
be difficult to extract from dust devil events seen in THEMIS data. 339
4.2 Infrared Temperature Data results 340
Figure 2, right hand column shows the derived temperature anomalies associated 341
with the dust devils. The visible-wavelength image brightness is overlain as contour lines, 342
while the color pixels are used to represent temperature data. In all images, the 343
temperature pixels are 100 m across. 344
The suspended fine dust in the devil column (about 2-3 µm diameter, [Tomasko et 345
al., 1999]) will appear clearest in IR band 5 [Smith et al., 2003], because suspended 346
particles of this size interact with the incoming sunlight with wavelengths near to 9 µm. 347
Band 3 is less sensitive to suspended dust, and observes the ground below the dust devil. 348
As such, a comparison of IR data from bands 3 and 5 can be used as a check for the 349
presence of lofted dust. The temperature data are derived from band 5, and so give the 350
temperature of the dust devil dust cloud (or the dusty surface if the atmosphere is clear). 351
Dust devil 2 (Figure 2b) has the clearest classic dust devil structure. The 352
temperature data shows clear evidence of the shadow cooling the ground, and of the 353
lofted dust being cooler than the surface. However, although the core should be about 3-4 354
pixels across, it is not immediately obvious as an expected ‘hot spot’, instead appearing 355
cold. This is even more apparent in dust devil 3 (Figure 2c), where the shadowed surface 356

17
is only slightly cooler than ambient, but the relatively weak visible dust plume slightly to 357
the SW of the main core appears strongly-cooled in the temperature data. From previous 358
terrestrial and martian meteorological work it is known that dust devils have a hot core, 359
due to their convective nature, but on Earth the core is generally dust free above the 360
saltation skirt [Ryan and Lucich, 1983; Sinclair, 1969], and as such would not be 361
observed by the dust sensitive THEMIS infrared data. These observations are consistent 362
with the suspended dust appearing cold relative to the hot surface, possibly due to the loss 363
of heat into the dust devil air column. In a terrestrial context, Sinclair, [1966] discusses 364
modeling to consider the heat flow from the relatively hot dust picked up into the 365
surrounding air within the column, which would then act to heat the air column (and cool 366
the dust). Fuerstenau, [2006] indicated that the solar warming of the suspended dust 367
grains is a major component of the thermodynamics of dust devils, as these warmed 368
grains will transfer heat into the atmosphere. This warming will be strongest on the edges 369
of the dust column (dependent on the opacity), which may then result in the inner dust 370
being shaded somewhat, and thus relatively cooler. It would appear that if this warming is 371
occurring then the warmed outer layers are relatively thin, and THEMIS is observing the 372
cooler-than-ambient inner layers of dust. 373
From the thermal data in Figure 2, the lofted dust column is about 1 K cooler than 374
the surface in all cases. Given that the system is roughly in a steady state, and taking 375
plausible values for the dust loading (derived in the following section), and using the 376
specific heat capacity of basalt for the dust (840 J/kg-K, [Roberts-Austen and Rücker, 377
1891]), this temperature drop results in about 100 W/m2 of heat loss from the dust, as 378
once lofted the dust immediately and isometrically re-radiates this absorbed heat. This 379

18
compares to the total energy available to drive dust devil activity of about 430 W/m2 from 380
the later afternoon Sun on Mars. Because nearly 25% of the incoming insolation energy is 381
dissipated by this process, the presence of the dust should be taken into account when 382
modelling dust devils [Fuerstenau, 2006; Sinclair, 1966]. 383
In reality, orbital instruments are unlikely to ever be able to see right down the dust-384
free core of the dust devil, since dust devils are not precisely vertical, but tend to show a 385
tilt in the direction of ambient wind. A ring of slightly cooler air surrounding the dusty 386
core has been reported previously in some cases [Ives, 1947; Ringrose et al., 2003] 387
(although this is somewhat tentative [Balme and Greeley, 2006]), but the resolution here 388
is insufficient to confirm this. 389
Dust devils 4 and 7 show no significant temperature anomalies, and so is possible 390
that they may not be thermally driven, but might instead be wind gusts capable of lofting 391
dust but lacking convective vorticity, similar to very small local fronts or storms [Briggs 392
et al., 1979]. However, such storms generally lack the column-like structure seen here, 393
and are larger, so it is more plausible that the temperature anomalies are merely not large 394
enough to be detected by the instrument, or that the upper-dust-column temperatures are 395
equilibrating with surface temperatures, effectively shielding any temperature anomalies 396
closer to the ground. The contour data clearly shows that dust devil 7 has a apparent 397
double brightness peak, and this may be a compound dust devil, made up of two (or 398
more) vortices circling each other; such structures are relatively common terrestrially in 399
less well defined dust devils such as Figure 4(b) [Balme and Greeley, 2006]. 400
There are weak hints of a hot anomaly seen on the ground in immediate sunward 401
direction of dust devil column in dust devils 1, 2, 3, and 6 (Figure 2), which could be a 402

19
result of the dust column absorbing sunlight and scattering light onto the surrounding 403
surface, which is adding to the direct solar illumination of this area of the surface. These 404
apparent anomalies are very weak, and near to the resolution of the instrument, so further 405
work is required to confirm this effect. In the case of dust devil 2 it is just plausible that 406
this weak hot anomaly may be a false positive caused by the existing apparent 407
temperature patterns in the surrounding surface. On Mars one would expect these 408
anomalies to be a weak effect, given the dust devil opacity, but it might be possible to 409
further investigate these phenomena in terrestrial dust devils using appropriate 410
instrumentation [Lorenz, 2004]. 411
In no case does there appear to be any apparent cold (or hot) trail on the ground 412
upwind of the dust devil, marking the passage of the dust devil. Either the heat being 413
removed from the ground by the dust devil is below the resolution of the instrument, or 414
the ground is equilibrating quickly, which might be expected due to the low thermal 415
inertia of the dusty surface layer. 416
4.3 Opacity and dust loading from consideration of shadowing 417
A significant shadow is seen alongside most observed dust devils. Hence, it is clear 418
that the dust devils have significant opacity, and the depth of this shadow can be used to 419
approximate the dust loading. We summarize the technique here, for a more detailed 420
description of the method, see Fuerstenau, [2006]. We assume a Lambertian surface with 421
constant albedo and geometric properties, and that the drop in illumination caused by a 422
dust devil's shadow is not influenced by surface variations (Figure 5). By quantifying this 423
amount of light lost, it is possible to estimate column absorption along the line of 424
illumination. The measured dust devil diameter combined with the sun altitude above the 425

20
horizon allows opacity to be derived, which can then be related to atmospheric dust 426
loading using previous work ([Landis, 1996], [Metzger et al., 1999]). 427
428
<fig 5 here> 429
430
Considering the schematic of a dust devil in Figure 5 the average radiances of the 431
dust devil and surface (Rdd and Rs respectively) can be extracted from image data of the 432
dust devil shadow and adjacent areas outside the shadow. As measured by THEMIS, 433
these are both relative radiances, but both are linearly related to absolute radiance by the 434
same factor, which cancels out when Rdd and Rs are ratioed. To compensate for variations 435
in terrain reflectivity between areas with and without shadows, a separate THEMIS image 436
of the scene (with dust opacity and viewing geometry as similar as possible to the dust 437
devil image) was considered. Radiance values from areas of the second image 438
corresponding to the previously defined dust devil shadow and well illuminated terrain 439
are used to derive r, the compensating ratio of the reflectances of the two areas. 440
Additionally, one must account for the relative amounts of direct and diffuse illumination 441
because at least some of the radiance emitted from the dust devil's shadow is probably 442
due to scattered light from the sky and other features [Fuerstenau, 2006]. To evaluate the 443
effect of the diffuse illumination, a nearby area of terrain shadow (only illuminated by 444
diffuse lighting) is considered. The pixel values from this terrain shadow are then 445
subtracted from the dust devil shadow’s pixel values. For this opacity calculation, byte-446
scaled pixel units are used, for convenience. All measurements needed to calculate 447
opacity are relative, and from the same image, so byte-scaling of the absolute radiances 448

21
cancels out. This canceling can be shown from Equation 1 using simple algebra: Replace 449
all terms of R (the byte-scaled radiances) with a linear scaling such as A1x+A0, where A1 450
and A0 are constants, and x is the original, non-byte-scaled, radiance (in Wcm-2
Sr-1µm
-1); 451
after simple manipulation, A1 and A0 completely cancel out and disappear from the 452
equation, provided all radiances come from the same image. However, the THEMIS data 453
files from the PDS must be the radiometrically calibrated format (RDR), rather than the 454
raw data, to account for instrumentation effects such as non-linear sensitivity and varying 455
zero offset. Additionally, the brightly-lit dust devil column itself could act as a secondary 456
illumination source, acting to apparently brighten the shadow. Such an effect would be 457
small, due to the relatively low opacity of the dust devil (and hence the low ratio of 458
scattered to direct light), and computationally difficult to deal with, and is neglected here. 459
It would have the effect of making the shadow appear brighter, such that the dust loading 460
of the devil would appear lower than reality. 461
From Figure 5, the ratio of the radiances is then approximately 462
463
τ
τ
−
−
==−
−e
I
eI
RR
RRr
src
src
Ts
Tdd
)(
)(
(Equation 1)
464
Where τ is the opacity, RT is the diffusely lit terrain, and Isrc is the source intensity 465
(which is unknown, but cancels out). From Landis, [1996], who considered martian dust 466
opacity with reference to solar panel loading, the opacity can be related to the number 467
density of particles in the air by 468
469

22
OQAN=τ (Equation 2)
470
Where Q is the scattering efficiency, A is the particle average cross sectional area, 471
and No is the column number density. Due to the geometry of the situation, the path 472
length measured is the dust devil diameter with a factor of the sine of the solar 473
illumination angle, θ (A vertical dust column is assumed), so the number density, n, 474
becomes 475
476
θsinD
Nn O
= (Equation 3)
477
Where D is the dust devil diameter, giving 478
479
θ
τ
sinDQAn
O
= (Equation 4)
480
Q is taken as 2.98 at 600 nm [Ockert-Bell et al., 1997], which is the closest 481
wavelength data available to THEMIS visible band 3 (654 nm), as used for these 482
observations. The lofted dust grain size distribution in a martian dust devil is not well 483
known. The lower dust devil is assumed to be saltation dominated [Greeley et al., 2003], 484
so a mean grain diameter is taken as 75 µm, the size of the most easily saltated dust 485
diameter on Mars [Greeley and Iversen, 1985]. Dust devils are believed to loft finer dust 486
by a low pressure ‘sucking’ effect, as well as saltation [Balme and Hagermann, 2006; 487

23
Greeley et al., 2003], but this is not yet well understood in detail. Qualitative modelling 488
implies that this effect should be strongest for small well-formed dust devils on the Earth, 489
as opposed to the targets of this work, large dust devils on Mars [Balme and Hagermann, 490
2006]. If significant, this excess dust lofting effect might result in a smaller average dust 491
grain size, by increasing numbers of smaller particles. Landis, [1996] assumed particle 492
diameters of 24 µm for his calculations, but he derived this value from the weighted mean 493
of the suspended dust in the full atmospheric column, as relevant to solar panel 494
obscuration. A factor of three difference in particle diameters is probably within the 495
intrinsic variability in dust loading seen in dust devils, as can be seen from dust loading 496
estimates from the Spirit rover ([Greeley et al., 2006], discussed in following section). 497
498
<table 4 here> 499
500
Table 4 gives the physical parameters measured from the images, and the calculated 501
dust devil loading. For comparison, the Spirit rover in Gusev crater recorded values from 502
3.9x10⁻⁹
to 4.6x10⁻⁴
kgm-3
, with a mean of 2.07x10⁻⁵
kgm-3
[Greeley et al., 2006], while 503
the estimated dust devil loading from Mars Pathfinder is 7x10⁻⁵
kgm-3
[Metzger et al., 504
1999]. Our calculated values (derived from spacecraft observations) are reassuringly 505
similar to the values derived from lander observations. The dust concentration derived 506
here is similar to the values of Greeley et al., [2006], but it is not possible to estimate a 507
dust flux, as there is no record of the vertical dust devil wind speed. However, the 508
concentrations and sizes are similar to those observed by Spirit [Greeley et al., 2006], so 509
one might expect the flux to be comparable. The values for visible-dust opacity 510

24
measurements, from 0.06 to 0.23 across the width of the column (typically a few hundred 511
meters), are comparable to estimates of 0.03-0.40 for the full atmospheric column [Smith 512
et al., 2000], which illustrates how much greater than the average dust loading the devil 513
dust loads are. 514
Although this approach is general, in the ideal it requires that the dust loading is 515
strong enough to make a clear dust-devil shadow and that there is a compensating image 516
(which should ideally be a THEMIS visible-wavelength image as well). The values for r 517
in Table 4 are all very close to 1, which highlights the fact that the dust devils are moving 518
across smooth plains, which have a low contrast. The inclusion of r in the calculations 519
would be more important if a dust devil was amongst terrain with a variety of albedos 520
which may have altered, such as on top of older dust devil streaks. In cases where no 521
THEMIS compensating image exists, Mars Express HRSC (the nadir observing channel) 522
could be used as a substitute, as this observes at 650 nm, compared to 654 nm for 523
THEMIS band 3. However this should be used with caution, as the flyover time of day 524
may be different, resulting in a different surface temperature and illumination angle: r 525
would also be altered by variations in atmospheric opacity, or any surface albedo changes 526
such as frost. 527
5. Conclusions 528
Because THEMIS observes simultaneously in both visible and thermal-infrared 529
wavelengths, it provides a unique dataset for studying dust devils, allowing simultaneous 530
analyses to be performed of both physical and thermal properties. To initially detect the 531
dust devils, a survey of THEMIS visible-wavelength images was conducted for Ls from 532
0° to 270
° and latitude 20
°S to 50
°N, initially using THEMIS visible-wavelength 533

25
observations. 3079 images were searched manually, and then cross-referenced against 534
other images of the same areas to eliminate false positives. Eight dust devils in total have 535
been identified, in five images, ranging in diameter from 170 to 335 m. 536
The number of dust devils detected is approximately two orders of magnitude fewer 537
than were detected in previous studies [Cantor et al., 2006; Fisher et al., 2005]. This 538
discrepancy probably reflects the later flyover local time of Mars Odyssey (typically 539
16:30), coupled with the fact that the formation of dust devils may be more clustered 540
around midday on Mars than on Earth. Previous studies used Mars Global Surveyor data, 541
which has a local flyover time of around 14:00. 542
It appears likely that the late afternoon dust devils are more disordered in structure 543
than ones detected earlier in the afternoon, perhaps because of the weaker driving 544
insolation. It is possible (although unlikely given their structure) that the latest two dust 545
devils (numbers 6 and 7, Figure 2) seen are saltation capable wind gusts but lacking in 546
convective vorticity. 547
Using the calibrated surface radiances from the visible-wavelength imagery, and 548
observing the loss in radiance in the shadowed surface, we estimated that the dust loading 549
in the columns ranges from 1.94x10⁻⁵
to 1.53x10⁻⁴
kgm-3
, and are comparable to the 550
values derived from surface measurements for Mars Pathfinder and Spirit ([Greeley et al., 551
2006; Metzger et al., 1999]). The values here are derived from orbit, of the largest dust 552
devils, and yet the loadings are very similar to those from smaller lander-observed devils. 553
Measurements from orbit provide a more broadly applicable method for estimating dust 554
loading in martian dust devils than the spatially limited data acquired from landing craft 555
observations. 556

26
THEMIS also observed the dust devils at infrared wavelengths, as well as visible 557
wavelengths, and this infrared data can be used to derive surface temperature data. The 558
dust devils observed do not have a hot temperature anomaly, although the air temperature 559
in convective vortex cores has been shown to be higher [Balme and Greeley, 2006]. This 560
lack of a visible hot core is probably a shielding effect resulting from the dust column 561
blocking sight of the core, although THEMIS band 5 is primarily sensitive to dust, and 562
the core may be dust free. THEMIS infrared data indicates that the dust column is cooler 563
than the surrounding ground surface, implying that the dust has equilibrated with the 564
atmosphere after lofting. This loss of energy may be a significant part of the energy flow 565
of a dust devil [Fuerstenau, 2006; Sinclair, 1966]. There are also indications that the dust 566
column briefly shadows and cools a small portion of the surface. 567
Thermal tracks on the surface upwind of the dust devils are not detected by 568
THEMIS, indicating that the low-thermal-inertia surface equilibrates quickly after dust 569
devils pass (or that temperature drop is below the resolution of the instrument). 570
Additionally the dust devils discussed here did not produce visible tracks either, 571
suggesting that track counting statistics may not accurately represent dust devil 572
populations, as previously noted by Cantor et al., [2006]. 573
THEMIS 18-m visible-wavelength images can resolve most dust devils, but this is 574
not an perfectly suited instrument for broad surveying (mostly because of the late 575
observational times when most dust devils have expired). As more data released to the 576
NASA PDS, more dust devils that have been captured should be available, and searches 577
of the southern latitudes may be particularly promising, due to their high density of dust 578
devil tracks at some times of the year compared to the north [Whelley and Greeley, 2006]. 579
27
Very recently Mars Odyssey has moved to an earlier orbit, which should also improve the 580
probability of observing dust devils. Dust devil orientated observations do require that 581
THEMIS is observing simultaneously at infrared and visible wavelengths, which is not 582
always the case, due to other mission requirements. Although events will be rare, such 583
searches may be still be fruitful, as the combination of the simultaneous observation by 584
THEMIS of visible, infrared spectral and infrared temperature data provides unique 585
opportunity to explore martian dust devil properties, by comparing lofted dust loading 586
and dust temperature with surface conditions. 587
Acknowledgements 588
Matt Balme is thanked for useful discussions. Martin Towner is funded in part by 589
the UK Science and Technology Funding Council, UK. Two anonymous reviewers are 590
thanked for their detailed work, which greatly enhanced the quality of this paper. 591

28
References 592
593
Baddeley, P. F. H. (1860), Whirlwinds and dust storms of India, Bell and Daldy, London. 594
Balme, M. R., S. M. Metzger, M. C. Towner, T. J. Ringrose, R. Greeley, and J. D. 595
Iversen (2003a), Frictions wind speeds in dust devils: a field study, Geophys. Res. Lett., 596
30(16), 1830, DOI 1810.1029/2003GL017493. 597
Balme, M. R., P. L. Whelley, and R. Greeley (2003b), Mars: dust devil track survey in 598
Argyre Planitia and Hellas Basin, J. Geophys. Res., 108(E8), doi:10.1029/2003JE002096. 599
Balme, M. R., and R. Greeley (2006), Dust devils on Earth and Mars, Rev. Geophysics, 600
44(RG3003), doi:10.1029/2005RG000188. 601
Balme, M. R., and A. Hagermann (2006), Particle lifting at the soil-air interface by 602
atmospheric pressure excursions in dust devils, Geophys. Res. Lett., 33(L19S01), 603
doi:10.1029/2006GL026819. 604
Bell, F. (1967), Dust devils and aviation, Meteorol. Note 27, Aust. Bur. of Meteorol., 605
Melbourne, Victoria. 606
Biener, K. K., P. E. Geissler, A. S. McEwen, and C. B. Leovy (2002), Observations of 607
martian dust devils in MOC wide angle camera images, paper presented at 33rd Lunar 608
and Planetary Science Conference, Houston, Texas, USA. 609
Briggs, G. A., W. A. Baum, and J. Barnes (1979), Viking Orbiter Imaging Observations 610
of Dust in the Martian Atmosphere, J. Geophys. Res., 84(B6), 2795-2820. 611

29
Brumby, S. P., D. T. Vaniman, and D. Bish (2003), Emissivity spectrum of a large "dark 612
streak" from THEMIS infrared imagery, paper presented at Sixth International 613
Conference on Mars, Lunar and Planetary Institute, Pasadena, USA. 614
Cantor, B. A., P. B. James, M. Caplinger, and M. J. Wolff (2001), Martian Dust Storms: 615
1999 Mars Orbiter Camera observations, J. Geophys. Res., 106(E10), 23653-23687. 616
Cantor, B. A., and K. S. Edgett (2002), Martian Dust Devils: 2 Mars Years of MGS MOC 617
Observations, AGU Fall Meeting Abstracts, 51, 0331. 618
Cantor, B. A., M. C. Malin, and K. S. Edgett (2002), Multiyear Mars Orbital Camera 619
(MOC) observations of repeated martian weather phenomena during the northern summer 620
season, J. Geophys. Res., 107(E3), doi:10.1029/2001JE001588. 621
Cantor, B. A., K. M. Kanak, and K. S. Edgett (2006), MOC observations of martian dust 622
devils and their tracks (September 1997 – January 2006) and evaluation of theoretical 623
vortex models, J. Geophys. Res., 111(E12002), doi:10.1029/2006JE002700. 624
Christensen, P. R., B. M. Jakosky, H. H. Kieffer, M. C. Malin, H. Y. McSween Jr., K. 625
Nealson, G. L. Mehall, S. H. Silverman, S. Ferry, M. Caplinger, and M. Ravine (2004), 626
The Thermal Emission Imaging System (THEMIS) for the Mars 2001 Odyssey Mission, 627
Space Science Reviews, 110(1-2), 85-130. 628
Church, C. R., J. T. Snow, G. L. Baker, and E. M. Agee (1979), Characteristics of 629
tornado-like vortices as a function of swirl ratio: A laboratory investigation, J. 630
Atmospheric Sciences, 36, 1755-1776. 631
30
Cooley, J. R. (1971), Dust devil meteorology, NOAA Tech memo NWS CR-42. 632
Cushing, G. E., T. N. Titus, and P. R. Christensen (2005), THEMIS VIS and IR 633
observations of a high-altitude martian dust devil, Geophys. Res. Lett., 32(L23202), 634
doi:10.1029/2005GL024478. 635
Edgett, K. S., and M. C. Malin (2000), Martian dust streaks and surface albedo controls: 636
thin, dark (and sometimes bright) streaks and dust devils in MGS MOC high resolution 637
pictures, paper presented at 32nd Lunar Planet. Sci., Houston, Texas, USA. 638
Ferri, F., P. G. Smith, M. T. Lemmon, and N. O. Renno (2003), Dust devils as observed 639
by Mars Pathfinder, J. Geophys. Res., 108(E12), doi:10.1029/2000JE001421. 640
Fisher, J. A., M. I. Richardson, C. E. Newman, M. A. Szwast, C. Graf, S. Basu, S. P. 641
Ewald, A. D. Toigo, and R. J. Wilson (2005), A survey of martian dust devil activity 642
using Mars Global Surveyor Mars Orbiter Camera images, J. Geophys. Res., 643
110(E03004), doi:10.1029/2003JE002165. 644
Fitzjarrald, D. E. (1972), The dust devil: a laboratory and field investigation, PhD thesis, 645
186 pp, University of California, Los Angeles. 646
Fitzjarrald, D. E. (1973), A field investigation of dust devils, J. App. Meteorology, 12, 647
808-813. 648
Flower, W. D. (1936), Sand devils, Prof. Notes. Met. Office, 71(5). 649
Fuerstenau, S. D. (2006), Solar heating of suspended particles and the dynamics of 650
martian dust devils, Geophys. Res. Lett., 33(L19S03), doi:10.1029/2006GL026798. 651
31
Grant, C. G. (1949), Dust-devils in the sub-arctic, Weather, 4, 402-403. 652
Greeley, R., and J. D. Iversen (1985), Wind as a Geological Process on Earth, Mars, 653
Venus and Titan, Cambridge University Press, Cambridge. 654
Greeley, R., M. R. Balme, J. D. Iversen, S. M. Metzger, R. Mickelson, J. Phoreman, and 655
B. R. White (2003), Martian dust devils: Laboratory simulations of particle threshold, J. 656
Geophys. Res., 108(E5), 5041, doi:5010.1029/2002JE001987. 657
Greeley, R., S. W. Squyres, R. Arvidson, P. Bartlett, J. B. Bell, D. Blaney, N. A. Cabrol, 658
J. Farmer, B. Farrand, M. P. Golombek, S. P. Gorevan, J. A. Grant, A. F. C. Haldemann, 659
K. E. Herkenhoff, J. Johnson, G. A. Landis, M. B. Madsen, S. M. McLennon, J. Moersch, 660
J. W. Rice, L. Richter, S. Ruff, R. J. Sullivan, S. D. Thompson, A. Wang, C. M. Weitz, P. 661
L. Whelley, and A. S. Team (2004), Wind-related processes detected by the Spirit rover 662
at Gusev crater, Mars, Science, 305, 810-821. 663
Greeley, R., P. L. Whelley, R. E. Arvidson, N. A. Cabrol, D. J. Foley, B. J. Franklin, P. 664
E. Geissler, M. P. Golombek, R. O. Kuzmin, G. A. Landis, M. T. Lemmon, L. D. V. 665
Neakrase, S. W. Squyres, and S. D. Thompson (2006), Active dust devils in Gusev crater, 666
Mars: Observations from the Mars Exploration Rover Spirit, J. Geophys. Res., 667
111(E12S09), doi:10.1029/2006JE002743. 668
Hess, G. D., and K. T. Spillane (1990), Characteristics of dust devils in Australia, J. App. 669
Meteorology, 29, 499-507. 670
Ives, R., L. (1947), Behavior of dust devils, Bull. Am. Meteorol. Soc., 28, 168-174. 671

32
Kaimal, J. C., and J. A. Businger (1970), Case studies of a convective plume and a dust 672
devil, J. App. Meteorology, 9, 612-621. 673
Landis, G. A. (1996), Dust obscuration of Mars solar arrays, Acta Astronautica, 38(11), 674
885-891. 675
Lorenz, R. D. (2004), Thermal imaging of a desert dust devil, Journal of Meteorology, 676
29(292), 275-276. 677
Malin, M. C., and K. S. Edgett (2001), Mars Global Surveyor Mars Orbiter Camera: 678
Interplanetary cruise through primary mission J. Geophys. Res., 106(E10), 23429-23570. 679
Metzger, S. M., J. R. Carr, J. B. Johnson, T. J. Parker, and M. T. Lemmon (1999), Dust 680
devil vortices as seen by the Mars Pathfinder camera, Geophys. Res. Lett., 26(18), 2781-681
2784. 682
Mullen, J. B., and T. Maxworthy (1977), A laboratory model of dust devil vortices, 683
Dynamics of Atmospheres and Oceans, 1, 181-214. 684
Murphy, J. R., and S. Nelli (2002), Mars Pathfinder convective vortices: frequency of 685
occurence, Geophys. Res. Lett., 29(23), 18. 686
Ockert-Bell, M. E., J. F. Bell, J. B. Pollack, C. P. McKay, and F. Forget (1997), 687
Absorption and scattering properties of the martian dust, J. Geophys. Res., 102(E4), 688
9039-9050. 689
Renno, N. O., M. L. Burkett, and M. P. Larkin (1998), A simple thermodynamical theory 690
for dust devils, J. Atmospheric Sciences, 55, 3244-3252. 691

33
Renno, N. O., A. A. Nash, J. I. Lunine, and J. R. Murphy (2000), Martian and terrestrial 692
dust devils: test of a scaling theory using Pathfinder data, J. Geophys. Res., 105(E1), 693
1859-1865. 694
Ringrose, T. J., M. C. Towner, and J. C. Zarnecki (2003), Convective vortices on Mars: A 695
reanalysis of Viking Lander 2 meteorological data, sols 1-60, Icarus, 163(1), 78-87. 696
Roberts-Austen, W. C., and A. W. Rücker (1891), On the specific heat of basalt, Phil. 697
Mag., 32, 353-355. 698
Ryan, J. A., and J. J. Carroll (1970), Dust devil velocities: mature state, J. Geophys. Res., 699
75(3), 531-541. 700
Ryan, J. A. (1972), Relation of dust devil frequency and diameter to atmospheric 701
temperature, J. Geophys. Res., 77(36), 7133-7137. 702
Ryan, J. A., and R. D. Lucich (1983), Possible dust devil vortices on Mars, J. Geophys. 703
Res., 88(C15), 11005-11011. 704
Sinclair, P. C. (1964), Some preliminary dust devil measurements, Monthly Weather 705
Review, 92(8), 363-367. 706
Sinclair, P. C. (1966), A quantitative analysis of the dust devil, PhD thesis, 292 pp, 707
University of Arizona. 708
Sinclair, P. C. (1969), General characteristics of dust devils, J. App. Meteorology, 8, 32-709
45. 710

34
Sinclair, P. C. (1973), The lower structure of dust devils, J. Atmospheric Sciences, 30, 711
1599-1619. 712
Smith, M. D., J. C. Pearl, B. J. Conrath, and P. R. Christensen (2000), Mars Global 713
Surveyor TES observations of dust opacity during aerobraking and science phasing, J. 714
Geophys. Res., 105(E4), 9539-9552. 715
Smith, M. D., J. L. Bandfield, P. R. Christensen, and M. I. Richardson (2003), Thermal 716
Emission Imaging System (THEMIS) infrared observations of atmospheric dust and 717
water ice cloud optical depth, J. Geophys. Res., 108(E11), 5115. 718
Snow, J. T. (1987), Atmospheric columnar vortices, Reviews of Geophysics, 25(3), 371-719
385. 720
Stanzel, C., M. Patzold, R. Greeley, and E. Hauber (2006), Dust devils on Mars observed 721
by the High Resolution Stereo Camera, Geophys. Res. Lett., 33(L11202), 722
doi:10.1029/2006GL025816. 723
Stanzel, C., M. Patzold, D. A. Williams, P. L. Whelley, R. Greeley, G. Neukum, and E. 724
al. (2008), Dust devil speeds, directions of motion and general characteristics observed by 725
the Mars Express High Resolution Stereo Camera, Icarus, 197, 39-51. 726
Thomas, P. C., and P. J. Gierasch (1985), Dust devils on Mars, Science, 230(4722), 175-727
177. 728

35
Tomasko, M., L. R. Doose, M. T. Lemmon, P. H. Smith, and E. Wegryn (1999), 729
Properties of dust in the martian atmosphere from the imager on Mars Pathfinder, J. 730
Geophys. Res., 104(E4), 8987-9007. 731
Tratt, D. M., M. H. Hecht, D. C. Catling, and E. C. Samulon (2003), In situ measurement 732
of dust devil dynamics: Toward a strategy for Mars, J. Geophys. Res., 108(E11), 5116. 733
Whelley, P. L., and R. Greeley (2006), Latitudinal dependency in dust devil activity on 734
Mars, J. Geophys. Res., 111(E10003), doi:10.1029/2006JE002677. 735
736
737

36
Figure Captions 738
739
Figure 1 – A plot of dust devil positions, with MOLA shaded relief as a background. Symbols 740
indicate the positions of dust devils observed, while the symbol labels refer to the dust devil number 741
in Table 1 and the text. 742
743
Figure 2 – Left-hand images show the THEMIS visible-wavelength scenes of dust devils, on the 744
right are THEMIS IR temperature variations (overlain by visible-wavelength intensity contours 745
derived from concurrent observations). In all images, Sun illumination is from the left, about 280-300 746
azimuth. (North is to the top). The scale bars are 1 km long. Absolute temperature varies from scene 747
to scene, but in all cases the red-blue corresponds to a 3K temperature difference. (a) V02114009 748
(dust devil 1 in Table 1), (b) V02326010 (dust devil 2), (c) V02326010 (dust devil 3), (d) V02502006 749
(dust devil 4), (e) V03334003 (dust devil 5), (f) V03334003 (dust devil 6), (g) V03343003 (dust devil 7), 750
(h) V02326010 (dust devil 8) 751
752
Figure 3 – Two examples of dust devil candidates that were not confirmed as definite. (a) 753
Shows a low resolution dust devil candidate, with no other supporting coverage (THEMIS image 754
V09950014). (b) Indicates a possible candidate obscured by the saturation of the image (THEMIS 755
images V03343003 and V07837020). The scale bars are 1 km. 756
757
Figure 4 – Examples of terrestrial dust devils, ranging from well structured to more 758
disordered. (a) shows the classic dust devil structure with a dust column made up of fine suspended 759
particles and a slightly wider saltation skirt near the surface. (b) has a weaker structure, and lower 760
dust loading, but is physically larger in diameter. 761
762

37
Figure 5 – The illumination geometry for dust devil imagery. θθθθ is the solar incidence angle. Isrc 763
is solar illumination. Rs and Rdd are the radiances detected by the spacecraft from the unobstructed 764
surface and of the dust devil’s shadow respectively. 765
766
767
38
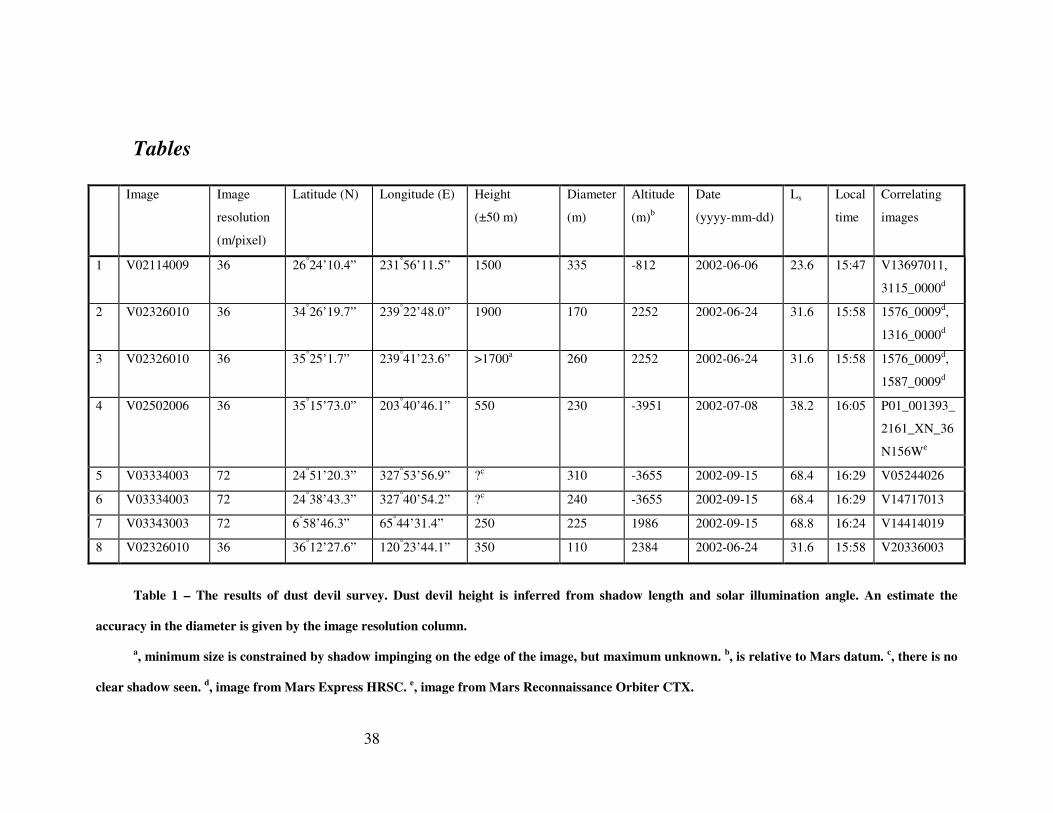
Tables
Image Image
resolution
(m/pixel)
Latitude (N) Longitude (E) Height
(±50 m)
Diameter
(m)
Altitude
(m)b
Date
(yyyy-mm-dd)
Ls Local
time
Correlating
images
1 V02114009 36 26°24’10.4” 231
°56’11.5” 1500 335 -812 2002-06-06 23.6 15:47 V13697011,
3115_0000d
2 V02326010 36 34°26’19.7” 239
°22’48.0” 1900 170 2252 2002-06-24 31.6 15:58 1576_0009
d,
1316_0000d
3 V02326010 36 35°25’1.7” 239
°41’23.6” >1700
a 260 2252 2002-06-24 31.6 15:58 1576_0009
d,
1587_0009d
4 V02502006 36 35°15’73.0” 203
°40’46.1” 550 230 -3951 2002-07-08 38.2 16:05 P01_001393_
2161_XN_36
N156We
5 V03334003 72 24°51’20.3” 327
°53’56.9” ?
c 310 -3655 2002-09-15 68.4 16:29 V05244026
6 V03334003 72 24°38’43.3” 327
°40’54.2” ?
c 240 -3655 2002-09-15 68.4 16:29 V14717013
7 V03343003 72 6°58’46.3” 65
°44’31.4” 250 225 1986 2002-09-15 68.8 16:24 V14414019
8 V02326010 36 36°12’27.6” 120
°23’44.1” 350 110 2384 2002-06-24 31.6 15:58 V20336003
Table 1 – The results of dust devil survey. Dust devil height is inferred from shadow length and solar illumination angle. An estimate the
accuracy in the diameter is given by the image resolution column.
a, minimum size is constrained by shadow impinging on the edge of the image, but maximum unknown.
b, is relative to Mars datum.
c, there is no
clear shadow seen. d, image from Mars Express HRSC.
e, image from Mars Reconnaissance Orbiter CTX.

39

40
Image Latitude (N) Longitude (E) Ls Local
time
Comments
V01770009 17°5'38.4" 71
°30'7.2" 10.2 15:32 Too small to resolve clearly in THEMIS visible, no other coverage
V02055003 11°26'16.8" 131
°20'56.4" 21.3 15:41 Too small to resolve clearly in THEMIS visible, no other coverage
V10398001 -9°19'33.6" 21
°46'8.4" 21.2 16:29 Structure unclear due to surface features, other coverage lower resolution
V10259008 7°45'21.6" 44
°52'58.8" 15.8 16:28 Too small to resolve clearly in THEMIS visible, no other coverage
V18471001 -4°16'55.2" 61
°19'55.2" 10.6 16:26 Structure unclear due to surface features, no other coverage
V03014004 3°49'15.6" 193
°37'40.8" 56.9 16:14 Bright spot but lack structure, interfering surface features, no other coverage
V02498007 25°23'9.6" 317
°31'55.2" 38 16:01 Too small to resolve clearly in THEMIS visible, no other coverage
V09950014 17°16'33.6" 319
°44'49.2" 3.5 16:22 Too small to resolve clearly in THEMIS visible, no other coverage
V03343003 6°13'28" 65
°47'60.0" 68.8 16:24 Possible small dust devil, signal to noise too low to resolve clearly, no better coverage
V18311007 3°15'0" 328
°57'39.6" 4.2 16:23 Bright spot but lack of dust devil structure, no other coverage
Table 2 – Discarded dust devil candidates, with a brief description of the reason for discard. Latitude and longitude refers to the image location.
Two examples of these are shown in Figure 3.

41
Time of Day No. of dust
devils
No. of THEMIS
images
Total area imaged (km2) Rate of occurrence
(km-2
hr-1
)
Before 15:00 0 0 0
15:00-15:30 0 211 219000 < 1.82x10⁻⁵
15:30-15:45 0 321 536000 < 7.45x10⁻⁶
15:45-16:00 4 287 533000 3.00x10⁻⁵
16:00-16:15 1 242 526000 7.60x10⁻⁶
16:15-16:30 3 2018 2609000 4.61x10⁻⁶
Table 3 – A summary of detected dust devil survey statistics.

42
THEMIS
image
Compensation
image
r Rdd Rs RT Plume
Opacity
Incidence
angle
Dust load
(kgm-3
)
1 V02114009 V13697011 0.998 169.4 177.5 38.0 0.0594 55.8 1.94x10⁻⁵
2 V02326010 H1316_0000 0.995 119 138.7 46.0 0.2436 57.8 1.53x10⁻⁴
3 V02326010 H1576_0009 0.971 134.7 139.5 46.0 0.0823 57.8 3.39x10⁻⁵
4 V02502006 a
174.4 209.8 43.0 0.2384 58.1 1.14x10⁻⁴
5 V03334003 H1619_0000 No shadow No shadow 60.6
6 V03334003 V05244026 No shadow No shadow 60.6
7 V03343003 V14414019 0.975 142.3 154.5 12.0 0.1083 65.8 4.78x10⁻⁵
8 V02326010 V20336003 0.990 125.5 135.8 46.0 0.1317 57.8 1.28x10⁻⁴
Table 4 – Opacity and dust loading estimates for confirmed dust devils. HRSC images are
indicated by starting with H, while THEMIS images start with V. Dust devils 5 and 6 do not appear
to have a significant shadow, as discussed further in text. a indicates that no THEMIS or HRSC
compensation images exist, and r is assumed to be 1. The radiance values Rdd, Rs and RT are byte
scaled.
43
Fig 1

44
Fig 2

45
Fig 3

46
Fig 4

47
Fig 5