
Remote Sensing Data Acquisition. 1. Major Remote Sensing Systems.

1
Characteristics and statistics of digital remote sensing imagery
Digital Images:
2
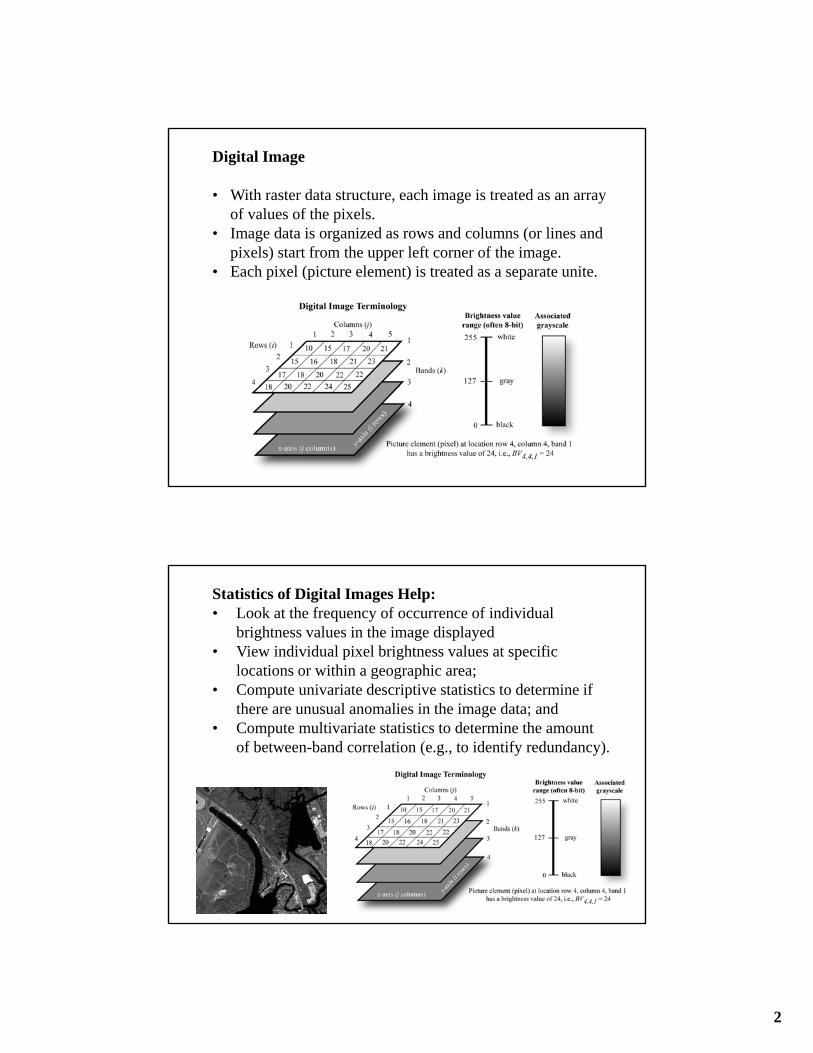
Digital Image
• With raster data structure, each image is treated as an array of values of the pixels.
• Image data is organized as rows and columns (or lines and pixels) start from the upper left corner of the image.
• Each pixel (picture element) is treated as a separate unite.
Statistics of Digital Images Help:• Look at the frequency of occurrence of individual
brightness values in the image displayed• View individual pixel brightness values at specific
locations or within a geographic area;• Compute univariate descriptive statistics to determine if
there are unusual anomalies in the image data; and • Compute multivariate statistics to determine the amount
of between-band correlation (e.g., to identify redundancy).

3
Statistics of Digital Images
It is necessary to calculate fundamental univariate and multivariate statistics of the multispectral remote sensor data.
This involves identification and calculation of – maximum and minimum value– the range, mean, standard deviation– between-band variance-covariance matrix– correlation matrix, and – frequencies of brightness values
The results of the above can be used to produce histograms.
Such statistics provide information necessary for processing and analyzing remote sensing data.
A “population” is an infinite or finite set of elements.
A “sample” is a subset of the elements taken from a population used to make inferences about certain characteristics of the population. (e.g., training signatures)

4
Large samples drawn randomly from natural populations usually produce a symmetrical frequency distribution.
Most values are clustered around the central value, and the frequency of occurrence declines away from this central point.
A graph of the distribution appears bell shaped is called a normal distribution.
Histogram and Its Significance to Digital Remote Sensing Image Processing
The histogram is a useful graphic representation of the information content of a remote sensing image indicating the quality of the original data, e.g. whether it is low in contrast, high in contrast, or multimodal in nature.
Many statistical tests used in the analysis of remote sensing data assume that the brightness values recorded in a scene are normally distributed.

5
Histogram and Its Significance to Digital Remote Sensing Image Processing
Unfortunately, remotely sensed data may not be normally distributed. In such instance, nonparametric statistical theory may be preferred.
?
Water
Forest

6
Univariate Descriptive Image Statistics
Measures of Central Tendency in Remote Sensor Data
• Mode: is the value that occurs most frequently in a distribution and is usually the highest point on the curve. Multiple modes are common in image dataset.
• Median: is the value midway in the frequency distribution.
• Mean: is the arithmetic average and if defined as the sum of all observations divided by the number of observations.
Measures of Central Tendency in Remote Sensor Data
The mean is the arithmetic average and is defined as the sum of all brightness value observations divided by the number of observations. It is the most commonly used measure of central tendency.
The mean (k) of a single band of imagery composed of nbrightness values (BVik) is computed using the formula:
7
1 1 1
1 1 1
1 1 19
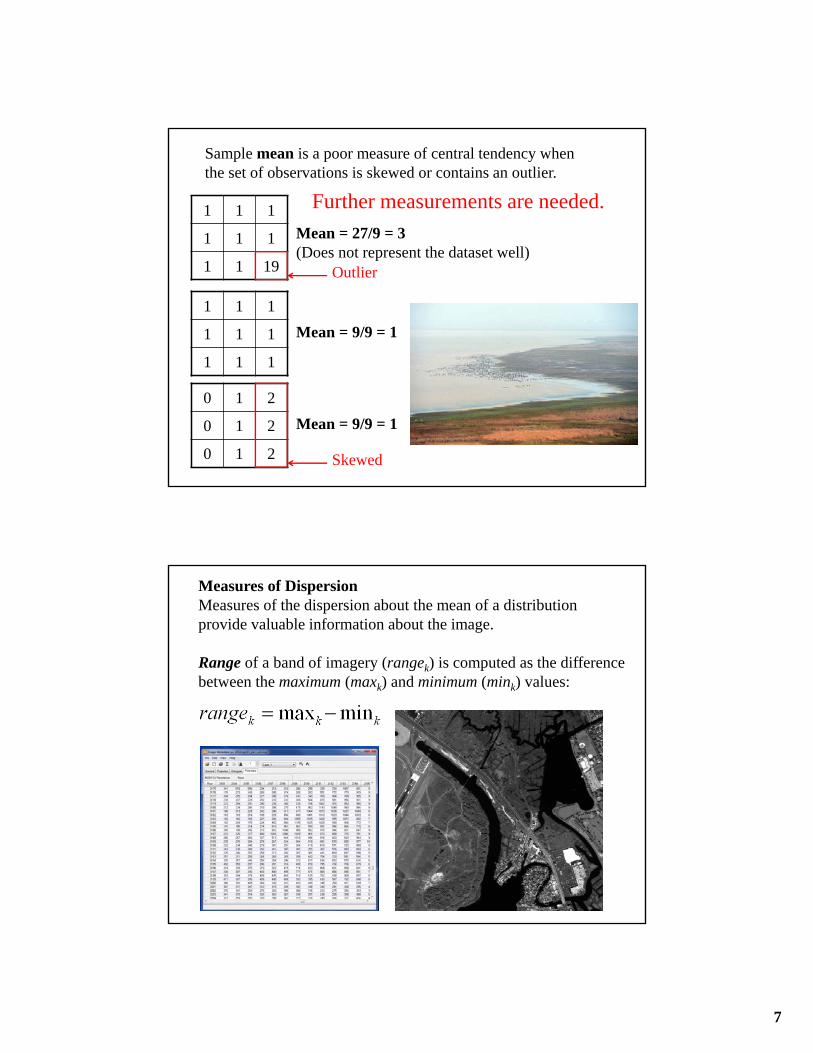
Mean = 27/9 = 3 (Does not represent the dataset well)
1 1 1
1 1 1
1 1 1
Mean = 9/9 = 1
0 1 2
0 1 2
0 1 2
Mean = 9/9 = 1
Sample mean is a poor measure of central tendency when the set of observations is skewed or contains an outlier.
Outlier
Skewed
Further measurements are needed.
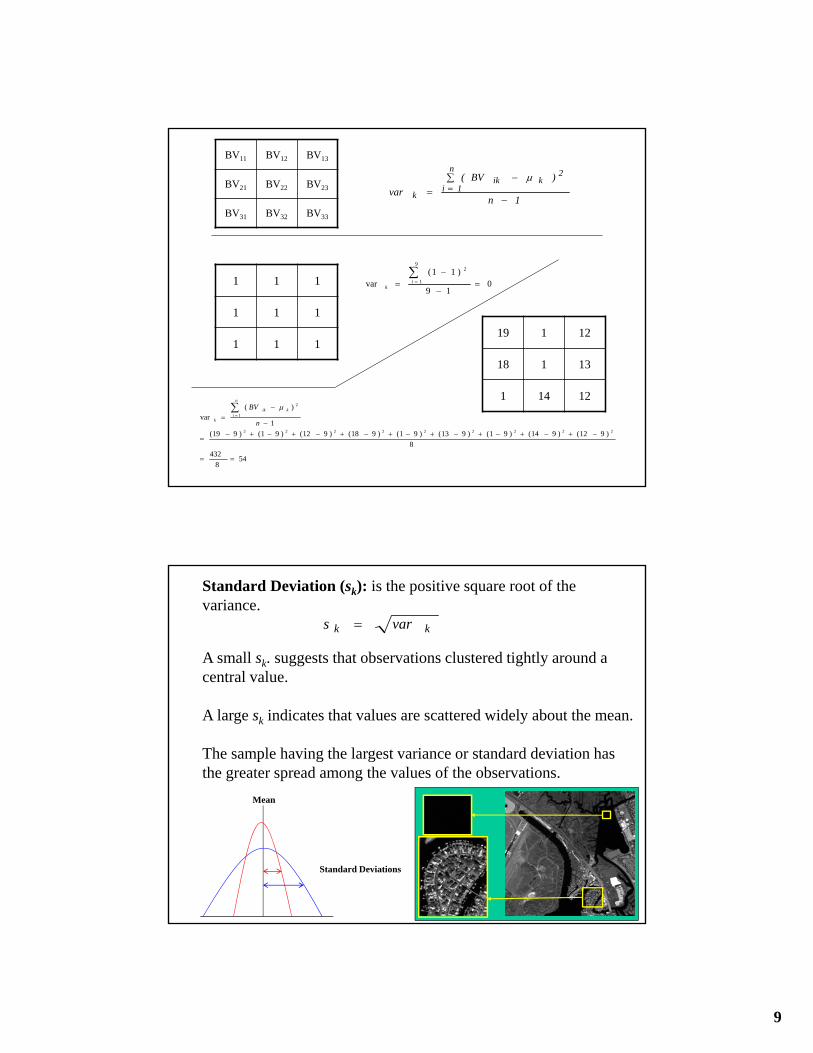
Measures of DispersionMeasures of the dispersion about the mean of a distribution provide valuable information about the image.
Range of a band of imagery (rangek) is computed as the difference between the maximum (maxk) and minimum (mink) values:

8
Measures of Dispersion
When the minimum or maximum values are extreme or unusual, the range could be a misleading measure of dispersion.
When unusual values are not encountered, the range is a very important statistic often used in image enhancement functions such as min–max contrast stretching.
Measures of Dispersion
Variance: is the average squared deviation of all possible observations from the sample mean. The variance of a band of imagery, vark, is computed using the equation:
1n
)BV(
var
n
1i
2kik
k
BV11 BV12 BV13
BV21 BV22 BV23
BV31 BV32 BV33
9
548
4328
)912()914()91()913()91()918()912()91()919(
1
)(var
222222222
1
2
n
BVn
ikik
k
19 1 12
18 1 13
1 14 12
1 1 1
1 1 1
1 1 1
019
)11(var
9
1
2
ik
1n
)BV(
var
n
1i
2kik
k
BV11 BV12 BV13
BV21 BV22 BV23
BV31 BV32 BV33
Standard Deviation (sk): is the positive square root of the variance.
A small sk. suggests that observations clustered tightly around a central value.
A large sk indicates that values are scattered widely about the mean.
The sample having the largest variance or standard deviation has the greater spread among the values of the observations.
kk vars
Mean
Standard Deviations

10
Standard Deviation (sk): is the positive square root of the variance.
19 1 12
18 1 13
1 14 12
35.754var kks
548
4328
)912()914()91()913()91()918()912()91()919(
1
)(var
222222222
1
2
n
BVn
ikik
k
kk vars
7.35
Measures of Distribution (Histogram) Asymmetry and Peak Sharpness
Skewness is a measure of the asymmetry of a histogram and is computed using the formula:
A perfectly symmetric histogram has a skewness value of zero.
BV11 BV12 BV13
BV21 BV22 BV23
BV31 BV32 BV33
11
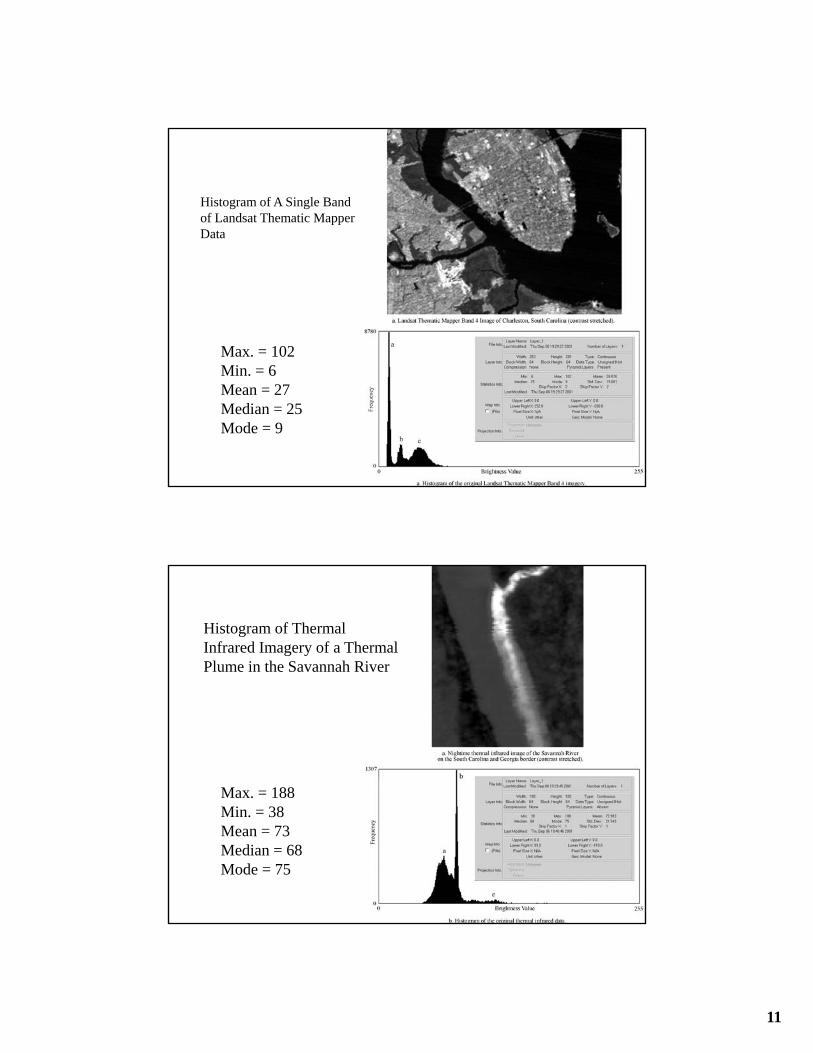
Max. = 102Min. = 6Mean = 27Median = 25Mode = 9
Histogram of A Single Band of Landsat Thematic Mapper Data
Max. = 188Min. = 38Mean = 73Median = 68Mode = 75
Histogram of Thermal Infrared Imagery of a Thermal Plume in the Savannah River

12
The different remote-sensing-derived spectral measurements for each pixel often change together in some predictable fashion.
i.e., an increase or decrease in one band’s brightness value is accompanied by a predictable change in another band’s brightness value.
Remote Sensing Multivariate Statistics
Landsat-7 ETM+ Band 1 (Blue band) Landsat-7 ETM+ Band 2 (Green band)

13
If there is no relationship between the brightness value in one band and that of another for a given pixel, the values are mutually independent;
i.e., an increase or decrease in one band’s brightness value is not accompanied by a predictable change in another band’s brightness value.
Remote Sensing Multivariate Statistics
Landsat-7 ETM+ Band 3 (Red band) Landsat-7 ETM+ Band 4 (Near IR band)
Remote sensing is often concerned with the measurement of how much radiant flux is reflected or emitted from an object in more than one band (e.g., in red and near-infrared bands).
It is necessary to compute multivariate statistical measures such as covariance and correlation among the several bands to determine how the measurements covary.
Remote Sensing Multivariate Statistics
14
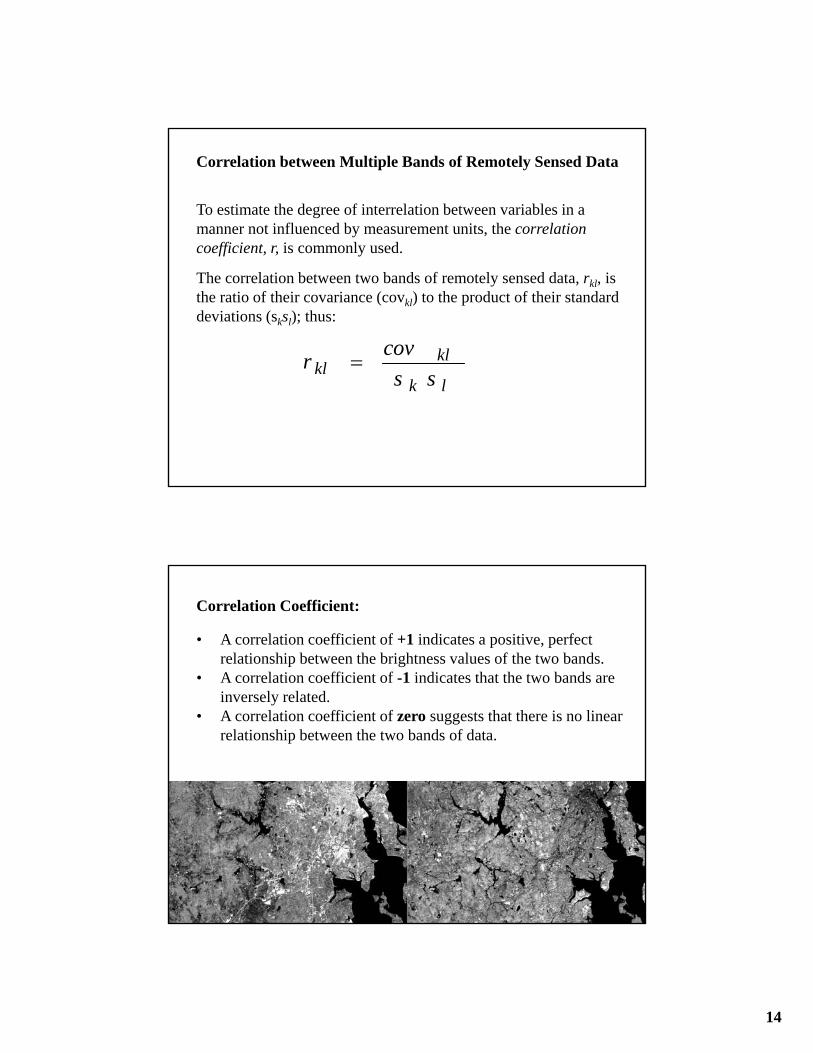
Correlation between Multiple Bands of Remotely Sensed Data
To estimate the degree of interrelation between variables in a manner not influenced by measurement units, the correlation coefficient, r, is commonly used.
The correlation between two bands of remotely sensed data, rkl, is the ratio of their covariance (covkl) to the product of their standard deviations (sksl); thus:
lk
klkl ss
covr
Correlation Coefficient:
• A correlation coefficient of +1 indicates a positive, perfect relationship between the brightness values of the two bands.
• A correlation coefficient of -1 indicates that the two bands are inversely related.
• A correlation coefficient of zero suggests that there is no linear relationship between the two bands of data.
15
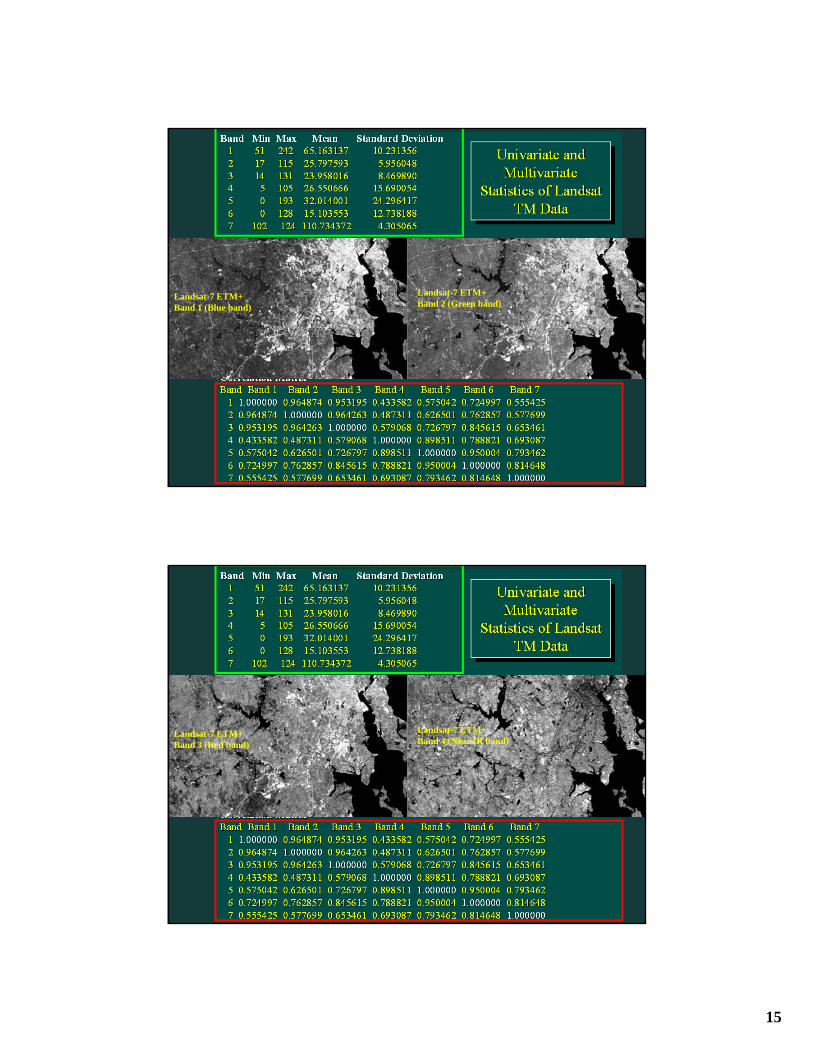
Landsat-7 ETM+ Band 1 (Blue band)
Landsat-7 ETM+ Band 2 (Green band)
Landsat-7 ETM+ Band 3 (Red band)
Landsat-7 ETM+ Band 4 (Near IR band)
16
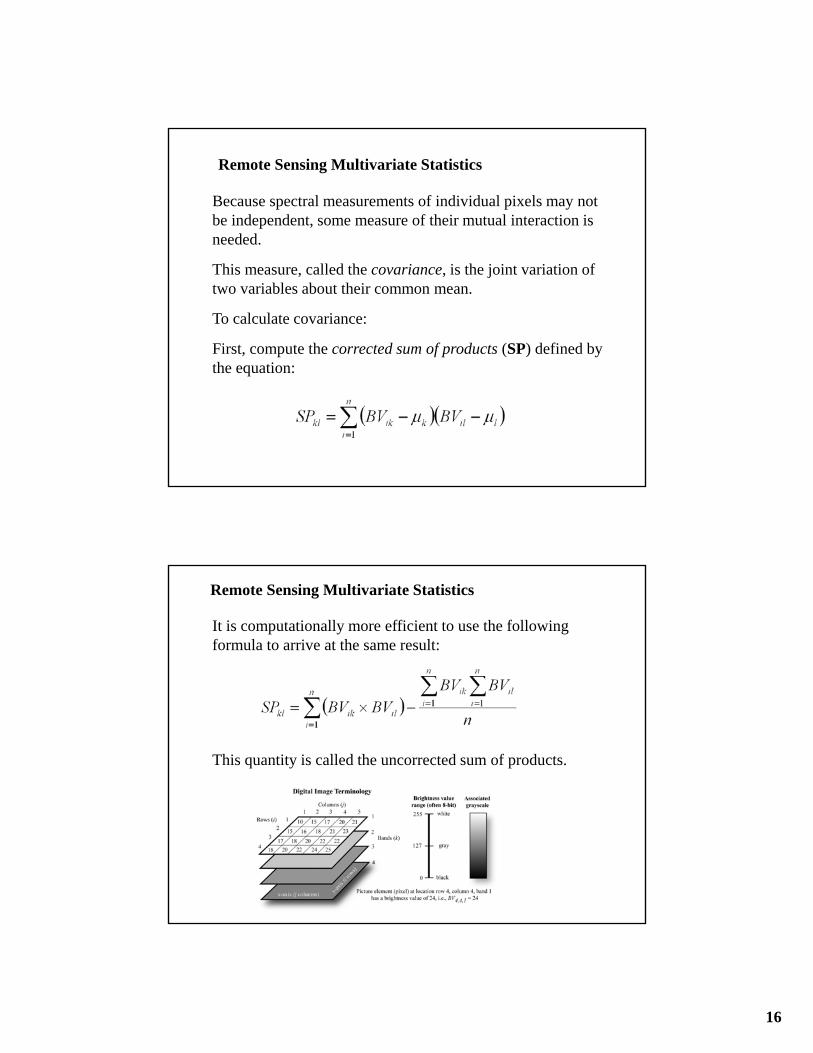
Because spectral measurements of individual pixels may not be independent, some measure of their mutual interaction is needed.
This measure, called the covariance, is the joint variation of two variables about their common mean.
To calculate covariance:
First, compute the corrected sum of products (SP) defined by the equation:
Remote Sensing Multivariate Statistics
It is computationally more efficient to use the following formula to arrive at the same result:
This quantity is called the uncorrected sum of products.
Remote Sensing Multivariate Statistics

17
Then, Covariance is calculated by dividing SP by (n – 1).
The covariance between brightness values in bands k and l, covkl, is equal to:
Remote Sensing Multivariate Statistics
Covariance: is the joint variation of two variables about their common mean. SPkl is the corrected Sum of Products between bands k and l.
1n
SPcov kl
kl
n
1i)lilBV)(kikkl BV(SP
19 1 12
18 1 13
1 14 12
1 1 1
1 1 1
1 1 1
SPkl = (19-9)x(1-1)+(1-9)x(1-1)+(12-9)x(1-1)+(18-9)x(1-1)+(1-9)x(1-1)+(13-9)x(1-1)+(1-9)x(1-1)+(14-9)x(1-1)+(12-9)x(1-1) = 0
Covkl = 0
Band k
k = 9
Band l
l = 1
18
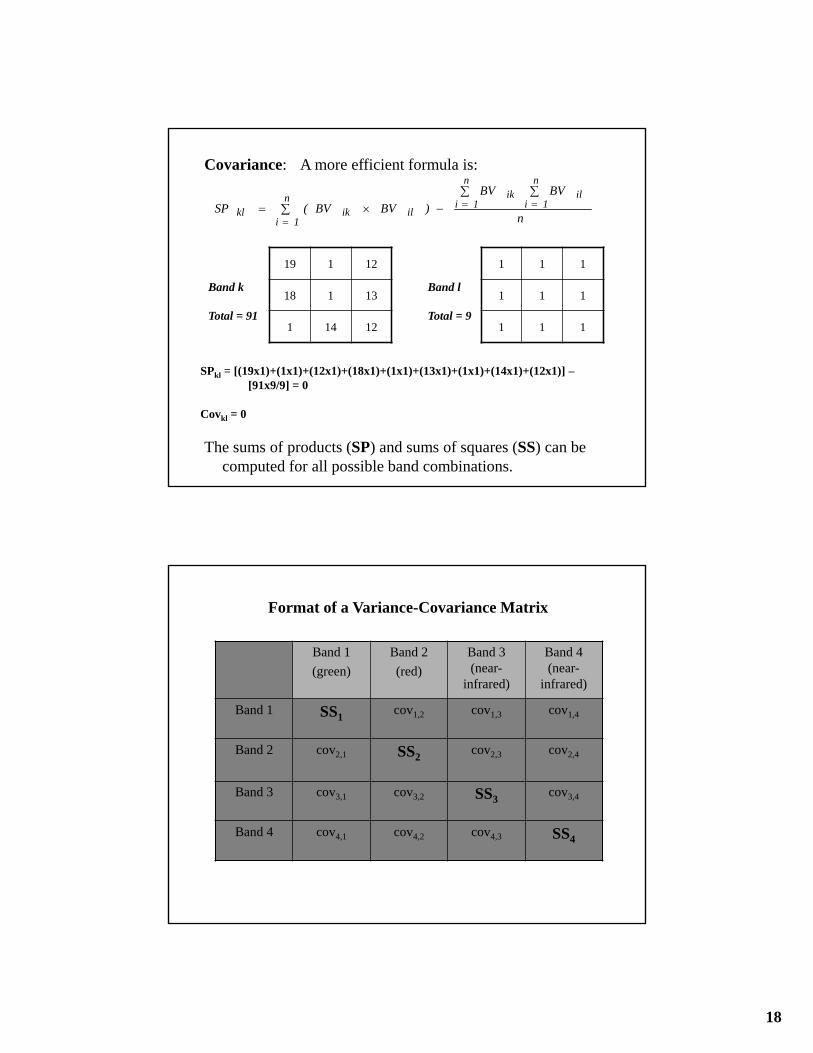
Covariance: A more efficient formula is:
The sums of products (SP) and sums of squares (SS) can be computed for all possible band combinations.
n
1i
n
1iil
n
1iik
ilikkl n
BVBV
)BVBV(SP
Band k
Total = 91
Band l
Total = 9
19 1 12
18 1 13
1 14 12
1 1 1
1 1 1
1 1 1
SPkl = [(19x1)+(1x1)+(12x1)+(18x1)+(1x1)+(13x1)+(1x1)+(14x1)+(12x1)] –[91x9/9] = 0
Covkl = 0
Band 1
(green)
Band 2
(red)
Band 3 (near-
infrared)
Band 4 (near-
infrared)
Band 1 SS1cov1,2 cov1,3 cov1,4
Band 2 cov2,1 SS2cov2,3 cov2,4
Band 3 cov3,1 cov3,2 SS3cov3,4
Band 4 cov4,1 cov4,2 cov4,3 SS4
Format of a Variance-Covariance Matrix
19
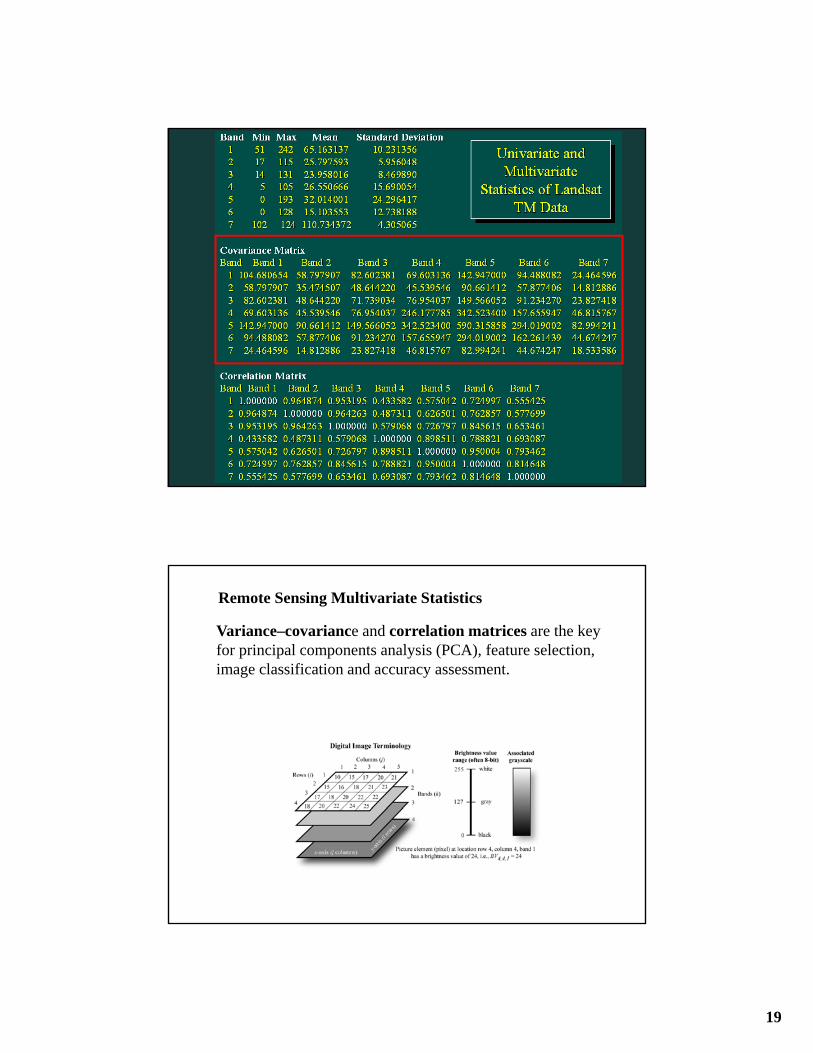
Variance–covariance and correlation matrices are the key for principal components analysis (PCA), feature selection, image classification and accuracy assessment.
Remote Sensing Multivariate Statistics


![[REMOTE SENSING] 3-PM Remote Sensing](https://static.fdocuments.us/doc/165x107/61f2bbb282fa78206228d9e2/remote-sensing-3-pm-remote-sensing.jpg)


