Characteristics and Gelling Property of Gelatin from Scale ... · frozen fish fillets in Thailand,...
28
Instructions for use Title Characteristics and Gelling Property of Gelatin from Scale of Spotted Golden Goatfish (Parupeneus heptacanthus) Author(s) Chuaychan, Sira; Benjakul, Soottawat; Kishimura, Hideki Citation Journal of food processing and preservation, 41(5), e13139 https://doi.org/10.1111/jfpp.13139 Issue Date 2017-10 Doc URL http://hdl.handle.net/2115/71580 Rights This is the peer reviewed version of the following article: Journal of food Proessing and Preservation 2017;41:e13139, which has been published in final form at 10.1111/jfpp.13139. This article may be used for non-commercial purposes in accordance with Wiley Terms and Conditions for Use of Self-Archived Versions Type article (author version) File Information Kishimura J Food process .pdf Hokkaido University Collection of Scholarly and Academic Papers : HUSCAP
Transcript of Characteristics and Gelling Property of Gelatin from Scale ... · frozen fish fillets in Thailand,...

Instructions for use
Title Characteristics and Gelling Property of Gelatin from Scale of Spotted Golden Goatfish (Parupeneus heptacanthus)
Author(s) Chuaychan, Sira; Benjakul, Soottawat; Kishimura, Hideki
Citation Journal of food processing and preservation, 41(5), e13139https://doi.org/10.1111/jfpp.13139
Issue Date 2017-10
Doc URL http://hdl.handle.net/2115/71580
RightsThis is the peer reviewed version of the following article: Journal of food Proessing and Preservation 2017;41:e13139,which has been published in final form at 10.1111/jfpp.13139. This article may be used for non-commercial purposes inaccordance with Wiley Terms and Conditions for Use of Self-Archived Versions
Type article (author version)
File Information Kishimura J Food process .pdf
Hokkaido University Collection of Scholarly and Academic Papers : HUSCAP

CHARACTERISTICS AND GELLING PROPERTY OF 1
2
GELATIN FROM SCALE OF SPOTTED GOLDEN GOATFISH 3
(PARUPENEUS HEPTACANTHUS) 4
5
To be submitted to 6
Journal of Food Processing and Preservation 7
8
9
10
11
SIRA CHUAYCHAN1, SOOTTAWAT BENJAKUL1*AND HIDEKI KISHIMURA2 12
13
14
15
1Department of Food Technology, Faculty of Agro-Industry, Prince of Songkla University, Hat 16
Yai, Songkhla 90112, Thailand 17
2Laboratory of Marine Products and Food Science, Research Faculty of Fisheries Sciences, 18
Hokkaido University, Hakodate, Hokkaido 041-8611, Japan 19
*To whom correspondence should be addressed. Tel: 66-7428-6334 20
Fax: 66-7455-8866, E-mail: [email protected] 21
22
23

ABSTRACT 24
Gelatins from the scales of spotted golden goatfish were extracted under different 25
conditions and characterized. The gelatin yield, when extracted at 45, 60 and 75 C (for 6 or 12 26
h), was 2.3-2.6%, 8.6-9.3% and 9.9-10.1% on dry weight basis, respectively. All the gelatins had 27
β- and α-chains as the dominant components, and had high imino acid contents (182-192 28
residues/1000 residues). Gel strength of the gelatin decreased and the gelatin solution became 29
more turbid with increasing temperature and time of extraction. The gelling and melting 30
temperatures of gelatin were 18.7-20.1 and 26.4-28.0 C, respectively, and these decreased with 31
extraction temperature and time. The results suggest that the scales of spotted golden goatfish 32
have potential to serve as the collagenous raw material for gelatin extraction. 33
Keywords: Scales, spotted golden goatfish, gelatin, yields, gel strength 34
35
PRACTICAL APPLICATIONS 36
Spotted golden goatfish (Parupeneus heptacanthus) is used in the manufacturing of 37
frozen fish fillets in Thailand, and the scales with low market value are generated as byproducts. 38
Large amounts of scales could potentially serve as raw material for gelatin production. However, 39
the proper extraction conditions need to be determined experimentally, considering both yield 40
and properties of the resulting gelatin. 41
42
43
44
45
46

INTRODUCTION 47
Gelatin is a fibrous protein obtained from collagenous materials subjected to thermal 48
denaturation or partial degradation. It has been widely used in food and non-food (photographic, 49
cosmetic, and pharmaceutical) industries [1]. Generally, gelatin is produced from skins and 50
skeletons of land animals [2]. However, both bovine spongiform encephalopathy (BSE) and foot-51
and-mouth disease (FMD) are human health concerns with gelatin from these sources. 52
Furthermore, porcine and bovine gelatins are prohibited by some religions. Fish gelatin has 53
therefore received increasing attention as an alternative to mammalian and avian gelatins. Fish 54
skin, bones, and scales are by-products from fish processing, but they are collagenous materials 55
with potential for gelatin production [3]. Gelatin has several functional properties, including 56
gelling, foaming, emulsifying and wetting properties. Generally, the functional properties of 57
gelatin and other food proteins are governed by many factors such as chain lengths or molecular 58
weights, amino acid composition and hydrophobicity, etc. [4]. Additionally, the suitability of 59
gelatin in a particular application is greatly influenced by the source of raw materials, varying by 60
animal species, and also by the processing [4]. 61
Spotted golden goatfish (Parupeneus heptacanthus) has been widely used in Thailand, in 62
frozen fillet manufacturing. During descaling and dressing, large amounts of scales are generated 63
as low-value by-products. Converting to or extracting value-added products, particularly gelatin, 64
could both reduce waste and be an economic benefit. Gelatins have been extracted from the 65
scales of several fish species, e.g., tilapia [5], bighead carp [6], and grass carp fish [7], and the 66
characteristics of such gelatins have been assessed. However, there is no prior information 67
available on gelatin from the scales of spotted golden goatfish, or on effects of extraction 68

conditions. Therefore, the aim of this study was to characterize gelatins with various extraction 69
temperatures and times, using spotted golden goatfish scales as raw material. 70
71
MATERIALS AND METHODS 72
Chemicals 73
All chemicals were of analytical grade. Sodium dodecyl sulfate (SDS), Coomassie blue 74
R-250 and N,N,N',N'-tetramethylethylenediamine (TEMED) were procured from Bio-Rad 75
Laboratories (Hercules, CA, USA). High-molecular-weight markers were purchased from GE 76
Healthcare UK Limited (Buckinghamshire, UK). Food grade bovine bone gelatin with 150-250 g 77
bloom strength was obtained from Halagel (Thailand) Co., Ltd., (Bangkok, Thailand). 78
79
Collection and preparation of spotted golden goatfish scales 80
Scales of spotted golden goatfish with an average body weight of 100-120 g/fish were 81
collected from Kingfisher Holding, LTD., Songkhla Province, Thailand. The scales were 82
packaged in polyethylene bags and transported in ice to the Department of Food Technology, 83
Prince of Songkla University, within approximately 1 h. Upon arrival, the scales were washed 84
with tap water and drained before storing in polyethylene bags. The samples were kept at -20 C 85
for storage times not exceeding 2 months. Before use, the frozen fish scales were tempered at 4 86
C overnight (8-10 h), and completely thawed using the running water for 2 min. 87
88
Pretreatment of spotted golden goatfish scales 89
The scales were suspended in 0.1 mol/L NaOH for 6 h, at the ratio 1:10 (w/v). The 90
mixture was continuously stirred to remove non-collagenous proteins. The alkaline solution was 91
changed once at 3 h. Treated scales were then washed with tap water, until the wash water had 92
neutral pH. Subsequently, the prepared scales were demineralized in 0.75 mol/L HCl, with the 93
scale/solution ratio of 1:5 (w/v). The demineralization was performed at room temperature (28-94
30 C) with continuous stirring. Thereafter, the demineralized scales were washed until neutral 95
pH of wash water was obtained. 96
97
Extraction of gelatin 98
The demineralized scales were suspended in distilled water at the ratio 1:10 (w/v). The 99
extraction was conducted at different temperatures (45, 60 and 75 C) for various times (6 and 12 100
h), under continuous stirring. At the designated time to stop extraction, the mixture was filtered 101
using a Buchner funnel with Whatman No.4 filter paper (Whatman International, Ltd., 102
Maidstone, England). The filtrate was dried in a freeze-dryer (CoolSafe 55, ScanLaf A/S, Lynge, 103
Denmark), and the gelatin sample obtained was subsequently subjected to analyses. 104
105
Analyses 106
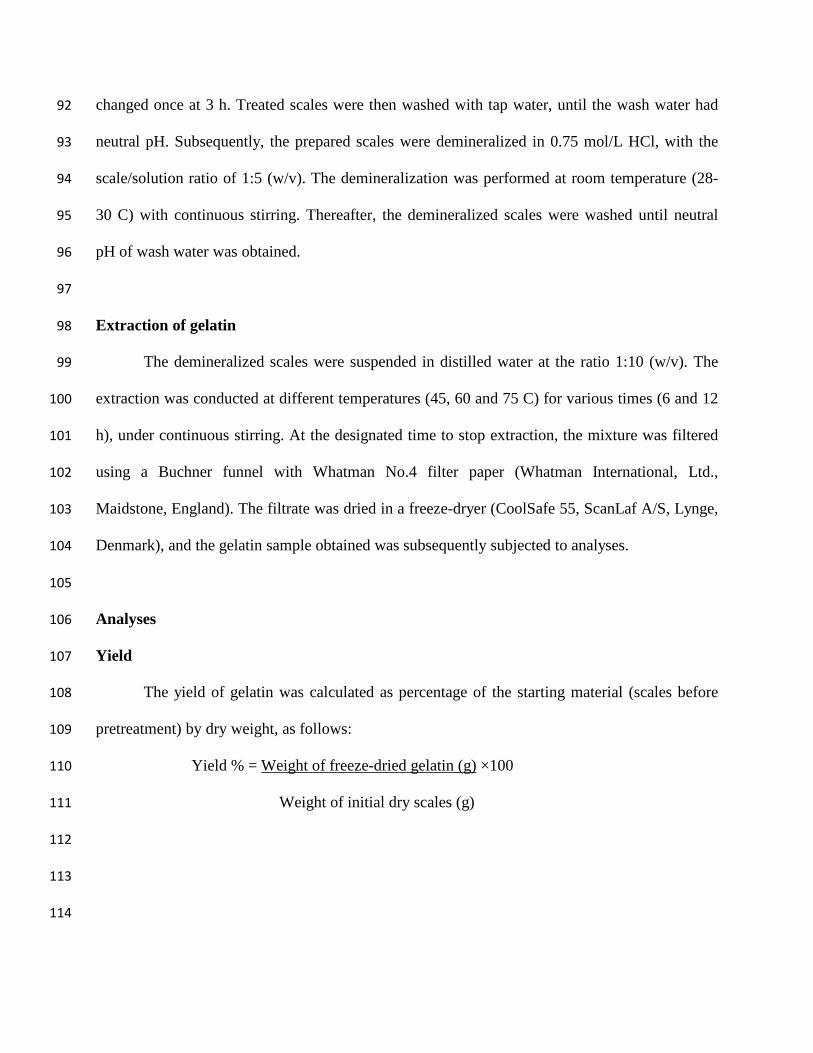
Yield 107
The yield of gelatin was calculated as percentage of the starting material (scales before 108
pretreatment) by dry weight, as follows: 109
Yield % = Weight of freeze-dried gelatin (g) ×100 110
Weight of initial dry scales (g) 111
112
113
114

SDS-polyacrylamide gel electrophoresis (SDS-PAGE) 115
The protein pattern in each gelatin sample was determined using sodium dodecyl sulfate 116
polyacrylamide gel electrophoresis (SDS–PAGE), following the method of Laemmli [8] as 117
modified by Sinthusamran et al. [9]. High-molecular-weight protein markers were used to 118
estimate the molecular weights of the proteins. 119
120
Fourier transform infrared (FTIR) spectroscopic analysis 121
The FTIR spectra for all gelatin samples were obtained by total reflectance-Fourier 122
transform infrared (ATR-FTIR) spectroscopy, as described by Sinthusamran et al. [9]. Each 123
gelatin sample was placed onto a crystal cell. The spectrum was acquired over the range 650–124
4000 cm-1 with 4 cm-1 resolution, by averaging 32 repeat scans, referenced against the 125
background spectrum recorded for a clean empty cell at 25 C, using an FTIR spectrometer 126
(Model Equinox 55, Bruker, Ettlingen, Germany). Deconvolution was performed on the average 127
spectra for the amide I and II bands, using a resolution enhancement factor of 1.8 and full height 128
bandwidth of 13 cm−1. The analysis of spectral data was done with OPUS 3.0 data collection 129
software (Bruker, Ettlingen, Germany). 130
131
Amino acid analysis 132
The amino acid composition of each gelatin sample was analyzed according to the 133
method of Nagarajan et al. [10], with a slight modification. The content is expressed as 134
residues/1000 residues. 135
136
137

Determination of gel strength 138
The gels were prepared by the method of Kittiphattanabawon et al. [11]. First, gelatin 139
was dissolved in distilled water (60 C) to obtain a final concentration of 6.67% (w/v). The 140
solution was stirred until the gelatin was completely dissolved, and was poured into a cylindrical 141
mold with 3 cm diameter and 2.5 cm height, where it was incubated at 4 C for 18 h prior to 142
analysis. The gel strength was determined at 8–10 C using a texture analyzer (Stable Micro 143
System, Surrey, UK) with a 5 kg load cell, cross-head speed set at 1 mm/s, and equipped with a 144
1.27 cm diameter flat-faced cylindrical Teflon® plunger. The maximum force (grams) was 145
recorded when the plunger had penetrated 4 mm into the gelatin gel. 146
147
Determination of gelling and melting temperatures 148
Gelling and melting temperatures of gelatin samples were measured following the 149
method of Boran et al. [12], using a controlled-stress rheometer (RheoStress RS 75, HAAKE, 150
Karlsruhe, Germany) with a stainless steel 60-mm-diameter parallel plate geometry. The gelatin 151
solution (6.67%, w/v) was prepared as described previously. An amplitude sweep test revealed 152
that 3 Pa stress at 1 Hz frequency was within the linear viscoelastic region (LVR) for the sample. 153
The measurement was performed at a scan rate of 0.5 C/min, at 1 Hz frequency with 3 Pa stress 154
amplitude, during cooling from 40 to 5 C and heating from 5 to 40 C. The gelling and melting 155
temperatures were defined by the loss tangent value tan δ = 1, or equivalently δ = 45o. 156
157
Determination of turbidity 158
The turbidity of each gelatin solution was determined according to the method of 159
Kittiphattanabawon et al. [11]. Gelatin was dissolved in distilled water (60 C) to obtain a final 160

concentration of 6.67% (w/v). The solution was stirred until the gelatin was completely 161
dissolved. Turbidity was determined by measuring the absorbance at 360 nm with a 162
spectrophotometer (UV-1800 Spectrophotometer, Shimadzu, Kyoto, Japan). 163
164
Microstructure analysis of gelatin gel 165
The microstructure of gelatin gels was imaged by a scanning electron microscopy (SEM). 166
A gelatin gel sample (6.67%, w/v) with 2–3 mm thickness was fixed with 2.5% (v/v) 167
glutaraldehyde in 0.2 M phosphate buffer (pH 7.2) for 12 h. The sample was then rinsed with 168
distilled water for 1 h, and dehydrated stepwise in ethanol concentrations of 50, 70, 80, 90 and 169
100% (v/v). The dried sample was mounted on a bronze stub and sputter-coated with gold 170
(Sputter coater SPI-Module, West Chester, PA, USA). The specimen was then observed with a 171
scanning electron microscope (JEOL JSM-5800 LV, Tokyo, Japan) set at 20 kV acceleration 172
voltage. 173
174
Statistical analysis 175
The data were subjected to analysis of variance (ANOVA), and the means were 176
compared using Duncan’s multiple range test. For paired comparisons, a T-test was used. In 177
statistical tests, p-values of less than 0.05 were considered significant. Statistical analyses were 178
performed using the Statistical Package for Social Sciences (SPSS for windows: SPSS Inc., 179
Chicago, IL, USA). 180
181
182
183

RESULTS AND DISCUSSION 184
Yield 185
The gelatin yield from the scales of spotted golden goatfish is shown in Table 1 for the 186
various extraction conditions. The yield increased with extraction temperature (P ˂ 0.05): at 45, 187
60 and 75 C, the gelatin yields were 2.27-2.57%, 8.63-9.27% and 9.90-10.07% on dry weight 188
basis, respectively. The yield also increased with extraction time (P < 0.05), except at 75 C, the 189
temperature that showed no significant difference between 6 h and 12 h extractions (P > 0.05). 190
As temperature is increased, the bonds between α-chains in native collagen are effectively 191
destroyed. As a consequence, the triple helix structure became amorphous and could be extracted 192
with ease, giving high yields at elevated temperatures. Increasing the extraction time also 193
favored the release of α and β-chains from the preprocessed fish scales [13]. The results 194
qualitatively agree with Nagarajan et al. [10], who reported that the extraction yield of gelatin 195
from splendid squid skin increased with extraction temperature and time. Arnesen and Gildberg 196
[14] also found that increasing the extraction temperature increased the yield of gelatin from 197
Atlantic salmon skin. Different yields of fish gelatin have been reported for sea bream scale 198
(9.55%) [15], greater lizardfish skin (35.1%) [16] and nile perch skin (64.3%) [17]. It is noted 199
that gelatin yield from the scales of spotted golden goatfish was much lower than the reported 200
yields from fish skin. The scales have compact and dense structures, but the pretreatments, 201
especially the demineralization, provided the scales with looser structures [18]. As a result, hot 202
water could penetrate the scales to extract gelatin. The gelatin yield depends on the type of raw 203
material and on the gelatin extraction process, including the pretreatments [11]. 204
205
206
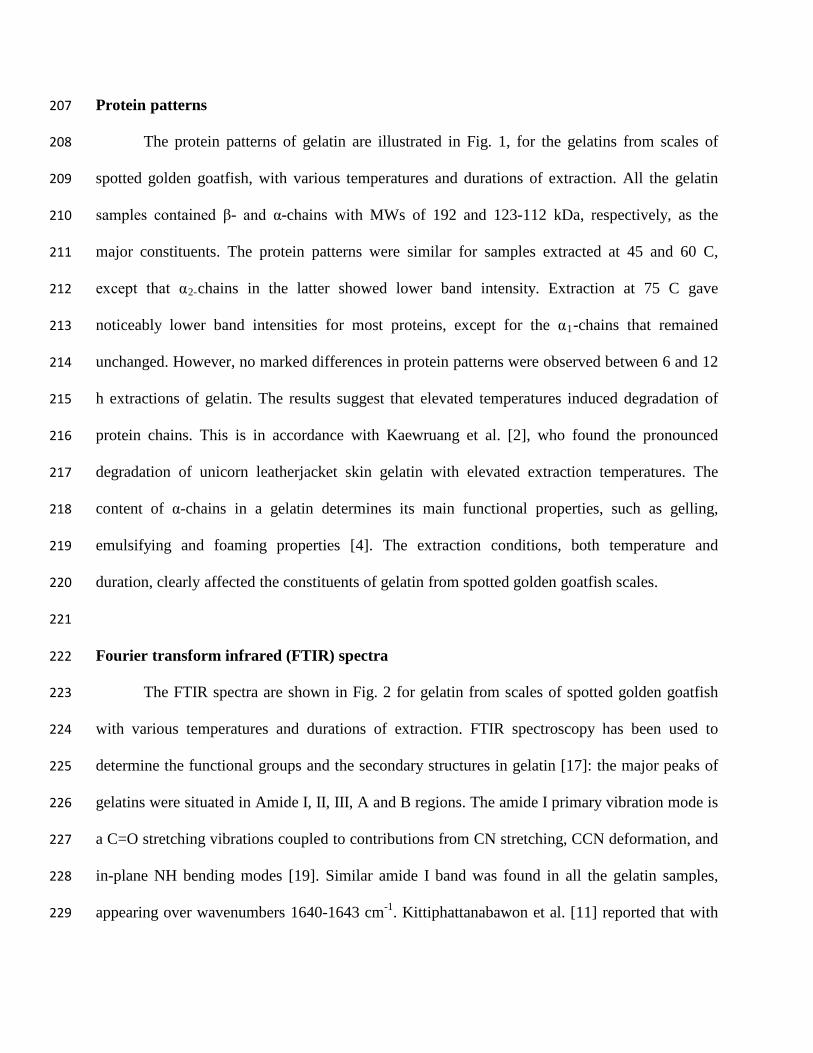
Protein patterns 207
The protein patterns of gelatin are illustrated in Fig. 1, for the gelatins from scales of 208
spotted golden goatfish, with various temperatures and durations of extraction. All the gelatin 209
samples contained β- and α-chains with MWs of 192 and 123-112 kDa, respectively, as the 210
major constituents. The protein patterns were similar for samples extracted at 45 and 60 C, 211
except that α2-chains in the latter showed lower band intensity. Extraction at 75 C gave 212
noticeably lower band intensities for most proteins, except for the α1-chains that remained 213
unchanged. However, no marked differences in protein patterns were observed between 6 and 12 214
h extractions of gelatin. The results suggest that elevated temperatures induced degradation of 215
protein chains. This is in accordance with Kaewruang et al. [2], who found the pronounced 216
degradation of unicorn leatherjacket skin gelatin with elevated extraction temperatures. The 217
content of α-chains in a gelatin determines its main functional properties, such as gelling, 218
emulsifying and foaming properties [4]. The extraction conditions, both temperature and 219
duration, clearly affected the constituents of gelatin from spotted golden goatfish scales. 220
221
Fourier transform infrared (FTIR) spectra 222
The FTIR spectra are shown in Fig. 2 for gelatin from scales of spotted golden goatfish 223
with various temperatures and durations of extraction. FTIR spectroscopy has been used to 224
determine the functional groups and the secondary structures in gelatin [17]: the major peaks of 225
gelatins were situated in Amide I, II, III, A and B regions. The amide I primary vibration mode is 226
a C=O stretching vibrations coupled to contributions from CN stretching, CCN deformation, and 227
in-plane NH bending modes [19]. Similar amide I band was found in all the gelatin samples, 228
appearing over wavenumbers 1640-1643 cm-1. Kittiphattanabawon et al. [11] reported that with 229

higher temperatures and longer times of extraction, the amide I band of gelatin from shark skin 230
shifted towards higher wavenumbers [11]. The difference between Amide I of gelatin from 231
spotted golden goatfish and other gelatins might be due to different thermal stabilities of gelatins 232
from various sources. It was found that the α1-chains in gelatin from scales of spotted golden 233
goatfish showed high thermal stability, as evidenced by this component persisting at elevated 234
extraction temperatures (Fig. 1). Sinthusamran et al. [13] and Kaewruang et al. [2] suggested that 235
the loss of triple helix structure was due to disruption of interchain interactions under harsh 236
conditions. The amide II band of gelatins extracted at 45, 60 and 75 C (for both extraction 237
durations) were observed at wavenumbers 1540-1543 cm-1. The amide II vibration mode is 238
attributed to an out-of-phase combination of CN stretching and in-plane NH deformation modes 239
of the peptide group [19]. All gelatin samples exhibited generally similar spectra, both in terms 240
of wavenumbers and amplitudes. Additionally, the absorption bands of all gelatins in the amide-241
III region appeared at similar wavenumbers ranging within 1539-1541cm−1. The amide III band 242
represents the combination of CN stretching vibrations and NH deformations at the amide 243
linkages, as well as absorption by wagging vibrations of CH2 groups in the glycine backbone and 244
in the proline side-chains. It has been used to indicate the disorder from α-helical to random-coil 245
structures [19]. 246
Furthermore, the amide A band was at 3290, 3292 and 3294 cm-1 for gelatins extracted at 247
45, 60 and 75 C for 6 h, at 3291, 3294 and 3296 cm-1 for gelatins extracted for 12 h in the same 248
order of temperatures. The amide A band is associated with the N–H stretching vibrations and 249
indicates hydrogen bonds. Generally, free N–H stretching vibrations occur in the range of 3400–250
3440 cm-1. When the N–H group of a peptide is involved in a hydrogen bond, the resonance 251
shifts to lower frequencies. The amide A band shifted to higher wavenumbers with increased 252

extraction temperature and with longer extraction times. At elevated temperatures of extraction, 253
the interchain bonds between α- or β-chains were increasingly disrupted, matching the higher 254
yields observed (Table 1). The amide B band was observed at wavenumbers 3086, 3077 and 255
3075 cm-1 for gelatin extracted at 45, 60 and 75 C for 6 h; and at 3081, 3076 and 3072 cm-1 for 256
gelatin extracted at 45, 60 and 75 C for 12 h, respectively. Gelatin extracted at a higher 257
temperature for a longer time exhibited the lower wavenumbers. The amide B band vibration 258
mode is asymmetric stretching vibrations of =C–H as well as of NH3+. The observations suggest 259
that the interaction of _NH3 groups between peptide chains was more pronounced in gelatin 260
extracted at higher temperature for a longer time [10]. Therefore, the secondary structures and 261
functional groups of gelatins obtained from scales of spotted golden goatfish were affected by 262
extraction temperature and time. 263
264
Amino acid composition 265
The amino acid composition of gelatin extracted under the various extraction conditions 266
is shown in Table 2. All the gelatin samples showed similar amino acid compositions, in which 267
glycine was the major amino acid (334–335 residues/1000 residues). Glycine is located at every 268
third position of an α-chain and represents nearly one third of its total residues [1]. All the gelatin 269
samples contained imino acids, including proline (108-113 residues/1000 residues) and 270
hydroxyproline (74-79 residues/1000 residues). Different imino acid contents have been reported 271
for gelatin from various fish species, such as from sea bream scales (185 residues/1000 residues) 272
[15], from grass carp scales (157 residues/1000 residues) [7] and from cod skin (154 273
residues/1000 residues) [14]. With high content of hydroxyproline, gelatin is believed to have 274
highly viscoelastic properties and to develop strong gel structures [4]. Hydroxyproline also plays 275

an essential role in the stabilization of triple helix strands in the mother collagen via hydrogen 276
bonding at its OH group [1]. In gelatin, the OH groups of hydroxyproline might be involved in 277
hydrogen bonds of α- or β-chains, thereby strengthening the gel network. In the present study, it 278
was found that both hydroxyproline and proline contents of gelatin decreased with the extraction 279
temperature. The lowest imino acid content was obtained for gelatin extracted at 75 C. Alanine 280
was also found at high contents (133-136 residues/1000 residues). However, very low cysteine 281
levels were obtained for gelatin from spotted golden goatfish scales. Collagen and gelatin have 282
been known to be free of cysteine [15]. The results suggest that extraction temperature and time 283
affected the amino acid composition of gelatin from the scales of spotted golden goatfish. 284
285
Gel strength of gelatin 286
The gel strength is shown in Table 1, for gelatin extracted from spotted golden goatfish 287
scales under the various extraction conditions. At a fixed extraction time, the gel strength of 288
gelatin decreased with the extraction temperatures (P < 0.05). For gelatins extracted at a fixed 289
temperature, the lower gel strength was observed with the longer extraction time (P < 0.05). 290
Among the cases tested, gelatin extracted at 45 C for 6 h showed the highest gel strength (286.6 291
g). The gel strength correlated with the band intensities of β- and γ-chains (Fig. 1). The amounts 292
of β- and γ-components have been reported as the major factor governing the gelation of gelatin 293
[16]. Additionally, the imino acids played a role in gel formation. Hydroxyl groups of 294
hydroxyproline are involved in inter-chain hydrogen bonding, both via a bridging water 295
molecule as well as by direct hydrogen bonding to the carbonyl group [1]. Different gel strengths 296
have been reported for gelatins from different fish species, including from sea bream scales (126 297
g) [15], and from lizardfish scales (268 g) [20]. It is noted that gelatin extracted at the highest 298

temperature tested, especially for 12 h, showed comparatively low gel strength (P < 0.05). This 299
coincides with the lowest imino acid content of this case (182 residues/1000 residues). The 300
differences in gel strength between the cases could stem from such intrinsic characteristics as 301
molecular weight distribution and amino acid composition. 302
303
Gelling and melting temperatures 304
Thermal transitions were monitored by changes in the phase angle (δ) as shown in Fig 3, 305
for dissolved gelatin from the scales of spotted golden goatfish, both during cooling (40-5 C) and 306
during subsequent heating (5-40 C). The gelling temperatures of gelatin were in the range of 307
18.7- 20.1C. The formation of junction zones and a three-dimensional gel network during 308
cooling of gelatin can be monitored via the phase angle [13]. Nagarajan et al. [10] reported that 309
the amounts of γ-, β-, and α-chain components influenced the gelling point of gelatin. Gelling 310
temperatures have been reported earlier for gelatins from different sources, such as scales of sea 311
bream (20.8 C) [15] and scales of grass carp (20.8 C) [7]. In the current study, gelatin extracted 312
at higher temperatures, especially for the longer time, showed lower gelling temperatures, 313
coinciding with low imino contents (Table 2). Generally, fish gelatin has lower gelling and 314
melting temperatures than its mammalian counterparts. This could be due to the low imino acid 315
content of fish gelatin [21]. 316
The melting temperature of gelatin from spotted golden goatfish scales ranged from 26.4 317
to 28.0 C. The gelatin samples extracted at low temperature and short time had the higher 318
melting temperatures. This suggests that these gels could be maintained in semi-solid state for a 319
longer time when heat is applied, e.g. during chewing in the mouth. Conversely, gelatins 320
extracted at higher temperatures showed lower melting temperatures. The melting temperature of 321

gelatin samples correlated positively with the gel strength (Table 1). Varying melting 322
temperatures have been reported for gelatin from various sources, such as from grass carp scales 323
(26.9 C) [7] and from sea bream scales (26.0 C) [15]. Generally, the thermal stability of gelatin 324
gel has been shown to directly correlate with the number and stability of Pro-rich regions in the 325
collagen or gelatin molecules, which are considerably lower in cold water fish than in warm 326
blooded animals. Temperature of the environment that the animals inhabit affects the gelling and 327
melting temperatures of the resultant gelatin [21]. 328
329
Turbidity 330
Turbidity of the gelatin solutions is shown in Table 1, expressed as A360, for the various 331
extraction conditions from spotted golden goatfish scales. The turbidity increased with the 332
extraction temperature (P < 0.05). At a fixed extraction temperature, the turbidity increased with 333
extraction time (P < 0.05), except for 45 C, the temperature that gave no difference in turbidity 334
between 6 and 12 h extractions. It is noted that the turbidity of gelatin solutions from spotted 335
golden goatfish was higher than that of the bovine gelatin solution (p < 0.05). Random 336
aggregation of the gelatin molecules from spotted golden goatfish scales might cause the 337
increased turbidity. When proteins are subjected to elevated temperatures, aggregation can be 338
induced, resulting in increased turbidity. This is in agreement with the shift of amide B spectral 339
band to lower wavenumbers (Fig. 2). [11] also reported that gelatin solutions from the skin of 340
blacktip shark had increased turbidity with increasing extraction temperature and time. In the 341
present study, the solutions were not clarified, whereas commercial gelatin solutions are 342
commonly clarified using activated charcoal [22]. Therefore, the extraction conditions affected 343
the appearance of gelatin solution as well as the resulting gels. 344

Microstructures of gelatin gels 345
Gel microstructures for the gelatins from the spotted golden goatfish scales, extracted at 346
different temperatures for various times, are shown in Fig. 4. For a fixed extraction time, gelatin 347
extracted at higher temperature yielded the coarser gel network with larger voids. Furthermore, 348
the gel from gelatin extracted over a longer time was less uniform with coarser structure. Among 349
all the cases, gelatin extracted at 45 C for 6 h exhibited the finest gel network with a high 350
connectivity. Conversely, the largest strands and voids were found in the case of gelatin 351
extracted at 75 C for 12 h. In general, fine network structure of gelatin gel positively correlated 352
with gel strength (Table 1). Gelatin extracted at low temperature over a short time most likely 353
had chains with comparatively high molecular weight (Fig. 1). Sinthusamran et al. [13] reported 354
that denser strands in gel structure were governed by the content of high molecular weight 355
constituents (γ- and β-chains) in gelatin, while loose strands in the gel matrix were found for 356
gelatins containing comparatively small and short chains. The long chains could form junction 357
zones with ordered alignment in the gel, leading to strong aggregation with connectivity. The 358
results reveal that the extraction condition impacted the molecular arrangement of gelatin chains 359
in the gel network, thereby determining the properties of gels. 360
361
CONCLUSIONS 362
Gelatin from the scales of spotted golden goatfish was extracted using water at different 363
temperatures for various durations, and this affected the gelatin characteristics and properties. 364
Extraction at higher temperatures for longer times resulted in higher yields; however, the gel 365
became weaker. The scales of spotted golden goatfish could serve as raw material for gelatin 366

extraction, and the extraction conditions should be appropriately selected for the intended use of 367
the gelatin. 368
369
ACKNOWLEDGEMENT 370
The authors thank to the Higher Education Research Promotion and National Research 371
University Project of Thailand, Office of the Higher Education Commission and graduate school 372
of Prince of Songkla University, Thailand for the financial support. The TRF Distinguished 373
Research Professor Grant was acknowledged. We would like to thank Assoc. Prof. Seppo Karrila 374
for edition of the manuscript. 375
376
REFERENCES 377
[1] BENJAKUL, S., OUNGBHO, K., VISESSANGUAN, W., THIANSILAKUL, Y., and 378
ROYTRAKUL, S. 2009. Characteristics of gelatin from the skins of bigeye snapper, 379
Priacanthus tayenus and Priacanthus macracanthus. Food Chem. 116, 445-451. 380
[2] KAEWRUANG, P., BENJAKUL, S., PRODPRAN, T., and NALINANON, S. 2013. 381
Physicochemical and functional properties of gelatin from the skin of unicorn 382
leatherjacket (Aluterus monoceros) as affected by extraction conditions. Food Biosci. 2, 383
1-9. 384
[3] BENJAKUL, S., KITTIPHATTANABAWON, P., and REGENSTEIN, J.M. 2012. Fish 385
gelatin. In Food Biochemistry and Food Processing, (B.K. Simpson, L.M.L. Nollet, F. 386
Toldra, S. Benjakul, G. Paliyath, Y.H. Hui, eds.) pp. 388-405, Wiley-Blackwell, Oxford. 387
[4] GóMEZ-GUILLéN, M.C., TURNAY, J., FERNáNDEZ-Dı́AZ, M.D., ULMO, N., 388
LIZARBE, M.A., and MONTERO, P. 2002. Structural and physical properties of gelatin 389

extracted from different marine species: a comparative study. Food Hydrocolloid. 16, 25-390
34. 391
[5] WENG, W., ZHENG, H., and SU, W. 2014. Characterization of edible films based on 392
tilapia (Tilapia zillii) scale gelatin with different extraction pH. Food Hydrocolloid. 41, 393
19-26. 394
[6] SHA, X.-M., TU, Z.-C., LIU, W., WANG, H., SHI, Y., HUANG, T., and MAN, Z.-Z. 395
2014. Effect of ammonium sulfate fractional precipitation on gel strength and 396
characteristics of gelatin from bighead carp (Hypophthalmichthys nobilis) scale. Food 397
Hydrocolloid. 36, 173-180. 398
[7] ZHANG, F., XU, S., and WANG, Z. 2011. Pre-treatment optimization and properties of 399
gelatin from freshwater fish scales. Food Bioprod. Process. 89, 185-193. 400
[8] LAEMMLI, U.K. 1970. Cleavage of structural proteins during the assembly of the head 401
of bacteriophage T4. Nature. 227, 680-685. 402
[9] SINTHUSAMRAN, S., BENJAKUL, S., and KISHIMURA, H. 2013. Comparative study 403
on molecular characteristics of acid soluble collagens from skin and swim bladder of 404
seabass (Lates calcarifer). Food Chem. 138, 2435-2441. 405
[10] NAGARAJAN, M., BENJAKUL, S., PRODPRAN, T., SONGTIPYA, P., and 406
KISHIMURA, H. 2012. Characteristics and functional properties of gelatin from splendid 407
squid (Loligo formosana) skin as affected by extraction temperatures. Food Hydrocolloid. 408
29, 389-397. 409
[11] KITTIPHATTANABAWON, P., BENJAKUL, S., VISESSANGUAN, W., and 410
SHAHIDI, F. 2010. Comparative study on characteristics of gelatin from the skins of 411

brownbanded bamboo shark and blacktip shark as affected by extraction conditions. Food 412
Hydrocolloid. 24, 164-171. 413
[12] BORAN, G., MULVANEY, S.J., and REGENSTEIN, J.M. 2010. Rheological properties 414
of gelatin from silver carp skin compared to commercially available gelatins from 415
different sources. J. Food Sci. 75, E565-E571. 416
[13] SINTHUSAMRAN, S., BENJAKUL, S., and KISHIMURA, H. 2014. Characteristics and 417
gel properties of gelatin from skin of seabass (Lates calcarifer) as influenced by 418
extraction conditions. Food Chem. 152, 276-284. 419
[14] ARNESEN, J.A., and GILDBERG, A. 2007. Extraction and characterisation of gelatine 420
from Atlantic salmon (Salmo salar) skin. Bioresour. Technol. 98, 53-57. 421
[15] AKAGüNDüZ, Y., MOSQUERA, M., GIMéNEZ, B., ALEMáN, A., MONTERO, P., 422
and GóMEZ-GUILLéN, M.C. 2014. Sea bream bones and scales as a source of gelatin 423
and ACE inhibitory peptides. LWT - Food Sci. Technol. 55, 579-585. 424
[16] TAHERI, A., ABEDIAN KENARI, A.M., GILDBERG, A., and BEHNAM, S. 2009. 425
Extraction and physicochemical characterization of greater Lizardfish (Saurida tumbil) 426
skin and bone gelatin. J. Food Sci. 74, E160-E165. 427
[17] MUYONGA, J.H., COLE, C.G.B., and DUODU, K.G. 2004. Fourier transform infrared 428
(FTIR) spectroscopic study of acid soluble collagen and gelatin from skins and bones of 429
young and adult Nile perch (Lates niloticus). Food Chem. 86, 325-332. 430
[18] CHUAYCHAN, S., BENJAKUL, S., and KISHIMURA, H. 2015. Characteristics of 431
acid- and pepsin-soluble collagens from scale of seabass (Lates calcarifer). LWT - Food 432
Sci. Technol. 63, 71-76. 433

[19] BANDEKAR, J. 1992. Amide modes and protein conformation. Biochim. Biophys. Acta. 434
1120, 123-143. 435
[20] WANGTUEAI, S., and NOOMHORM, A. 2009. Processing optimization and 436
characterization of gelatin from lizardfish (Saurida spp.) scales. LWT - Food Sci. 437
Technol. 42, 825-834. 438
[21] GUDMUNDSSON, M. 2002. Rheological properties of fsh gelatins. J. Food Sci. 67, 439
2172-2176. 440
[22] TZOKOV, S., NEDKOV, P., and DALEV, P. 1996. Clarification and raising the gelling 441
ability of gelatin solutions. Biotechnol. Biotechnol. Equip. 10, 59-64. 442
443
444
445
446
447
448
449
450
451
452
453
454
455
456

FIGURE CAPTIONS 457
FIGURE 1 SDS-PAGE PATTERNS OF GELATIN FROM THE SCALES OF SPOTTED 458
GOLDEN GOATFISH, EXTRACTED AT VARIOUS TEMPERATURES FOR VARIOUS 459
TIMES. M DENOTES HIGH MOLECULAR WEIGHT MARKERS. 460
FIGURE 2 FTIR SPECTRA OF GELATIN FROM THE SCALES OF SPOTTED GOLDEN 461
GOATFISH, EXTRACTED AT VARIOUS TEMPERATURE FOR VARIOUS TIMES. 462
FIGURE 3 CHANGES IN THE PHASE ANGLE (Δ, O) OF GELATIN SOLUTION (6.67%, 463
W/V) FROM THE SCALES OF SPOTTED GOLDEN GOATFISH, EXTRACTED AT 464
VARIOUS TEMPERATURES FOR VARIOUS TIMES, DURING COOLING (A) AND 465
SUBSEQUENT HEATING (B). 466
FIGURE 4 MICROSTRUCTURES OF GELATIN GELS FROM THE SCALES OF SPOTTED 467
GOLDEN GOATFISH, EXTRACTED AT VARIOUS TEMPERATURES FOR VARIOUS 468
TIMES. MAGNIFICATION: 3000× 469
470

TABLE 1
EXTRACTION YIELD (% DRY WEIGHT BASIS), GEL STRENGTH AND TURBIDITY OF
GELATIN FROM THE SCALES OF SPOTTED GOLDEN GOATFISH, EXTRACTED AT
DIFFERENT TEMPERATURES FOR VARIOUS TIMES.
Values are presented as mean ± SD (n = 3).
Different uppercase letters (A and B) in the same column under the same temperature indicate significant differences (P < 0.05). Different lowercase letters in the same column indicate significant differences (P < 0.05). Different uppercase letters (X, Y and Z) in the same column for the same time indicate significant differences (P < 0.05).
Temperature (oC) Time (h) Yields (%) Gel strength (g) Turbidity (OD360)
45 6 2.27±0.12AaX 286.61±1.02BfZ 0.791±0.81AaX
12 2.57±0.29BbX 249.62±0.53AeZ 0.806±0.83AaX
60 6 8.63±0.22AcY 227.77±1.52BdY 0.939±0.97AbY
12 9.27±0.43BdY 206.63±0.91AcY 1.194±0.62BcY
75 6 9.90±1.76AeZ 154.07±1.20BbX 1.493±0.96AdZ
12 10.07±0.93AeZ 124.86±1.38AaX 1.700±0.65BeZ

TABLE 2
AMINO ACID COMPOSITION OF GELATIN FROM THE SCALES OF SPOTTED GOLDEN GOATFISH, EXTRACTED AT DIFFERENT TEMPERATURES FOR VARIOUS TIMES.
Amino acids
Extraction temperature / time
45 oC 60 oC 75 oC 6 h 12 h 6 h 12 h 6 h 12 h
Alanine
135 135 134 136 133 135 Arginine
53 54 54 53 54 53
Aspartic acid/asparagine
44 43 43 43 43 43 Cysteine
2 1 1 1 1 1
Glutamic acid /glutamine
71 72 72 72 72 75 Glycine
335 335 335 335 335 334
Histidine
6 6 7 6 7 8 Isoleucine
7 7 8 7 7 7
Leucine
17 19 19 19 19 19 Lysine
26 26 29 27 27 27
Hydroxylysine
6 6 6 7 6 6 Methionine
13 14 13 14 14 14
Phenylalanine
14 13 14 12 16 14 Hydroxyproline
79 78 76 77 75 74
Proline
113 112 109 110 109 108 Serine
36 36 37 37 36 38
Threonine
23 23 23 23 25 23 Tyrosine
2 2 2 3 3 3
Valine
18 18 18 18 18 18 Total
1000 1000 1000 1000 1000 1000
Imino acid
192 190 185 187 184 182

Figure1
220 kDa 170 kDa
116 kDa
76 kDa 70 kDa
53 kDa
β
α1 α2
6 h 12 h
M 45 60 75 45 60 75
Extraction temperature (C)
γ
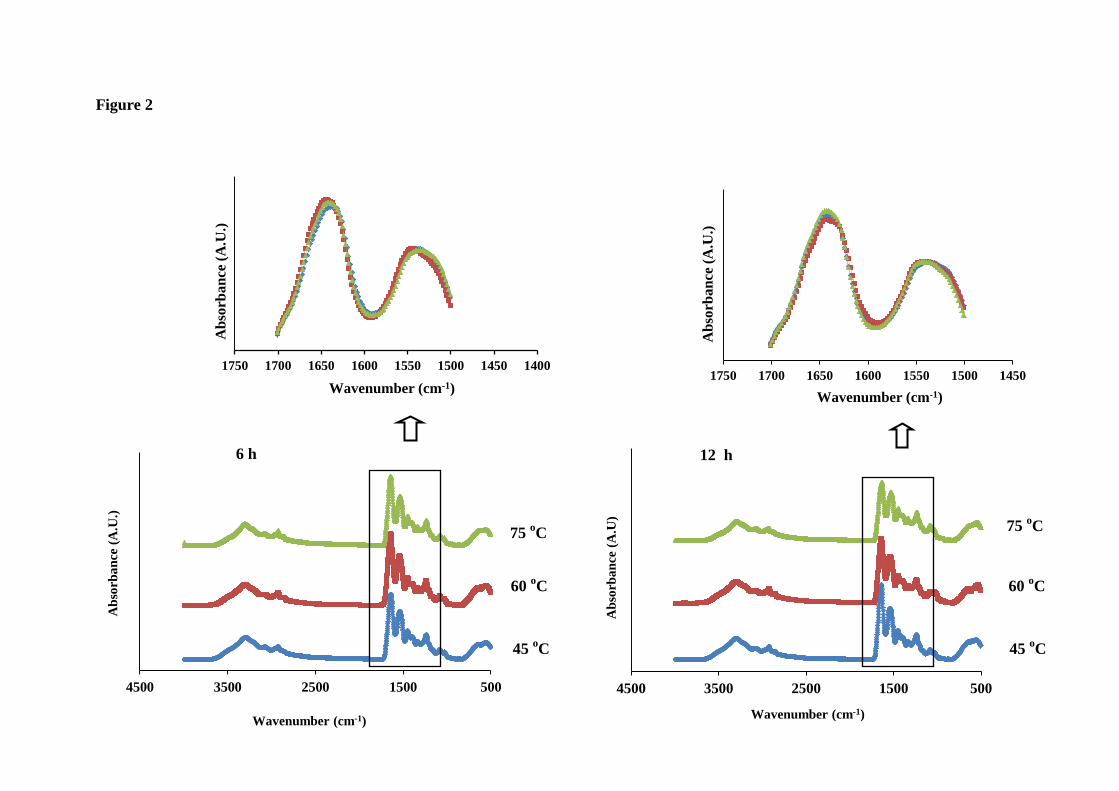
Figure 2
5001500250035004500
Abs
orba
nce
(A.U
.)
Wavenumber (cm-1)
5001500250035004500
Abs
orba
nce
(A.U
)
Wavenumber (cm-1)
6 h 12 h
45 oC
60 oC
75 oC
45 oC
60 oC
75 oC
14001450150015501600165017001750
Abs
orba
nce
(A.U
.)
Wavenumber (cm-1) 1450150015501600165017001750
Abs
orba
nce
(A.U
.)
Wavenumber (cm-1)

Figure 3
0
20
40
60
80
100
051015202530354045
Phas
e an
gle
(δ,o )
Temperature (C)
45 C for 12 h
45 C for 6 h
60 C for 12 h
60 C for 6 h
75 C for 12 h
75 C for 6 h
B
0
20
40
60
80
100
0 5 10 15 20 25 30 35 40 45 50
Phas
e an
gle
(δ,o )
Temperature (C)
45 C for 12 h
45 C for 6 h
60 C for 12 h
60 C for 6 h
75 C for 12 h
75 C for 6 h
A

Figure 4
45 C, 6 h 45 C, 12 h
60 C, 6 h 60 C, 12 h
75 C, 6 h 75 C, 12 h